chapter assessment tools 3 -...
TRANSCRIPT

CHAPTER
3
23
Assessment tools
3.1 Arterial Blood Gases (ABGS) 25
3.2 Attachments 34 3.3 Auscultation 36 3.4 AVPU 42 3.5 Blood Pressure (BP) 44 3.6 Blood Results 49 3.7 Breathing Pattern (See
under 3.54 Respiratory Pattern – Page 148)
3.8 Breathlessness (Dyspnoea) Scales 56
3.9 Capillary Refill Test 58 3.10 (Invasive) Cardiac
Monitoring 59 3.11 Central Venous Pressure
(CVP) 62 3.12 Cerebral Perfusion
Pressure (CPP) 64 3.13 Chest Drains 65 3.14 Chest Imaging (Including
Chest X-rays) 68 3.15 Chest X-ray
(See under 3.14 Chest Imaging – Page 68)
3.16 Chest Wall Shape 74 3.17 (Digital) Clubbing 77 3.18 Consent 78 3.19 Cough Assessment 79 3.20 Cyanosis 81 3.21 Dermatomes 82
3.22 Drugs 84 3.23 Early Warning Scores
(EWS) 90 3.24 Electrocardiogram (ECG)
(See under 3.35 Heart Rhythms – Page 109)
3.25 Electrolytes (See under 3.6 Blood Results – page 49)
3.26 End-Tidal Carbon Dioxide (ETCO 2 ) 92
3.27 Exercise (aerobic fitness) Testing 95
3.28 Exercise Tolerance 101 3.29 FEV 1 /FVC (See under 3.40
Lung Volumes and Lung Function Tests – Page 120)
3.30 Flow Volume Loops (See under 3.40 Lung Volumes and Lung Function Tests – Page 120)
3.31 Fluid Balance (Including Urine Output) 102
3.32 General Observation (See Chapter 1)
3.33 Glasgow Coma Scale (GCS) 105
3.34 Heart Rate (HR) 107 3.35 Heart Rhythms 109

ASSESSMENT TOOLS24
3.36 Inspiratory Muscle Testing (See under 3.40 Lung Volumes and Lung Function Tests – Page 120)
3.37 Intracranial Pressure (ICP) 116
3.38 ITU (critical care) Charts 119
3.39 Level of Consciousness 120
3.40 Lung Volumes and Lung Function Tests (Pulmonary Function Tests) 120
3.41 Muscle Charting (Oxford Grading) 125
3.42 Myotomes 127 3.43 Oxygen Delivery 129 3.44 Pain Score 134 3.45 Palpation 135 3.46 Peak Flow (See under 3.40
Lung Volumes and Lung Function Tests – Page 120)
3.47 Percussion Note 137 3.48 Pulse Oximetry 139 3.49 Pupils 141
3.50 Quality of Life Questionnaires 142
3.51 Rating of Perceived Exertion (RPE) 144
3.52 Reflexes 146 3.53 Renal Function
(See under 3.6 Blood Results and 3.31 Fluid Balance – Pages 49 and 102)
3.54 Respiratory Pattern 148 3.55 Respiratory Rate
(RR) 151 3.56 Resuscitation Status 152 3.57 Sedation/Agitation
Score 154 3.58 Sputum Assessment 156 3.59 Surgical Incisions 157 3.60 Swallow
Assessment 159 3.61 TPR (Temperature,
Pulse and Respiration) Chart 160
3.62 Ventilation–Perfusion (V/Q) Matching 164
3.63 Ventilator Observations 166
3.64 Work of Breathing 169
This chapter contains assessment procedures that may be used with respiratory patients. For each assessment performed, you need to select those that are most appropriate for each patient. If you are unsure which are appropriate, refer back to the assessment check-lists in Chapter 2 , which relate the tools to the assessment process.
There are many texts available that briefly discuss assessment tools. This book aims to cover these techniques in a standardized format. It gives a simple, step-by-step explanation of exactly how they are performed and how to interpret the findings.
Each technique has distinct sections:
● Definition : explains what the tool or measurement is about in simple terms.

3.1 Arterial blood gases (ABGs) 25
● Purpose : suggests why the test/measurement is done and why this is important for physiotherapists.
● Procedure : gives step-by-step instructions on how the technique should be undertaken.
● Findings : looks at the findings and how this information may be of use to you, linking theoretical concepts to practical application.
● Documentation : demonstrates how this information should be recorded in your notes.
Literature and clinical practice vary widely; therefore, each assess-ment tool is based on a consensus of identified articles, key texts and clinical experience. In line with other titles in this series, an amalgamation of evidence style has been taken to allow for a standardization of the text. Specific texts and examples of further reading are at the end of each assessment tool as appropriate. For ease of use, this chapter is in alphabetical order. Please note that many of these procedures are referred to using different termi-nology depending on your work setting and location.
●3.1 ARTERIAL BLOOD GASES (ABGs)
DEFINITION Analysis of an arterial blood sample to measure the levels of oxygen (partial pressure of oxygen ( P a O 2 )and oxygen satura-tions ( S a O 2 )), carbon dioxide (partial pressure of carbon diox-ide ( P a CO 2 )), pH, bicarbonate ( -
3HCO ) levels and base excess (BE). Blood gases can also be taken from a venous or capillary sample.
PURPOSE An arterial blood gas (ABG) is used to determine the significance of any respiratory or metabolic compromise, monitor deterioration and identify respiratory failure. This can provide information to guide treatment with oxygen therapy and/or ventilatory support. It may be used as an outcome measure following physiotherapy treatment and to aid clinical reasoning and treatment selection.
NB: In all instances it is assumed that hands are washed, the proce-dure has been explained to the patient and that suitable consent has been obtained (and documented).
NB: In all instances it is assumed that the entry is dated and timed.

ASSESSMENT TOOLS26
PROCEDURE Physiotherapists need to be able to analyse the results ( Fig. 3.1.1 ). The procedure itself involves taking an arterial blood sample and is normally carried out only by medical or nursing staff and some extended scope physiotherapists with specialized training.
RADIOMETER ABL 700 SERIES
ABL725PATIENT REPORT
Blood Gas Values
Oximetry Values
IdentificationsPatient IDPatient Last NamePatient First NameSample Typetemp.
pH 7.461
pCO2
sO2FO2HbFCOHbFHHb
↑FMetHb
pO2
ctHb98.895.01.01.22.8
11.5%%%%%
1.5
1.5
g/dL[[[[[
[
18.0[[
-----
-
--
]]]]]
]
Electrolyte Values
Metabolite Values
Temperature Corrected Values
Oxygen Status
Acid Base Status
NotesValue(s) above reference rangeCalculated value(s)Estimated value(s)
↑c
e
cNa+
cCa2+
cCa2+(7.4)ccCl–
cK+
14.21.121.16107
3.6mmol/Lmmol/Lmmol/Lmmol/L
pH(T)pCO2(T)pO2(T)
7.4615.0418.0
kPakPa
ctO2cp50e
15.63.24
Vol%kPa
cGlucLac
6.80.6
mmol/Lmmol/L
cBase(Ecf)ccHCO3
–(P,st)c
3.027.2
mmol/Lmmol/L
5.03.4135
98
3.00.5
145
107
8.01.6
mmol/L[[[[
[----
[[
--
-]]]]
]]
]
]]kPa
kPa5.04
Arterial37.0°C
Syringe – S 195μL Sample #
Fig 3.1.1 Example of a set of arterial blood gas results. As can be seen, a blood gas result may contain more information than blood gases alone.

3.1 Arterial blood gases (ABGs) 27
FINDINGS ( Fig. 3.1.2 , Table 3.1.1 ) You should also consider haemoglobin (Hb) levels when inter-preting ABG results (see 3.48 Pulse oximetry ). Fig 3.1.2 summa-rizes the process of interpreting ABG's in flowchart format.
Check pHAlkalosis (>7.45)Normal (7.35–7.45)Acidotic (<7.35)
Check PaCO2 Respiratory cause
Check for hypoxaemiaand what oxygen is
patient on?
PaCO2 moved inopposite direction to pH
Check base excess Metabolic causeHCO3- (or BE) moved in
same direction to pH
Does the patient needmore oxygen?
Check forcompensation
Is one system (metabolic orrespiratory) compensatingfor the other to restore pH?
Check forrespiratory failure
Does patient need ventilating?Is respiratory failure acuteor chronic?
Fig 3.1.2 Flowchart for arterial blood gas analysis.
pH Measure of level of acidity or alkalinity of blood Normal range 7.35–7.45
P a CO 2 Partial pressure of carbon dioxide in arterial blood (plasma) Normal range 4.7–6 kPa (35–45 mmHg)
P a O 2 Partial pressure of oxygen in arterial blood (plasma) Normal range 10.7–13.3 kPa (80–100 mmHg)
S a O 2 Saturation level of Hb in arterial blood (measures how fully saturated each unit of Hb is, given as a percentage) Normal range 95–100%
Amount of bicarbonate (base) in the blood Normal range 22–26 mmol l −1
BE (base excess)
Base excess is a simpler way of expressing bicarbonate levels and gives the amount of 3
–HCO above or below the average value of 24 mmol l −1 Normal range −2 to +2
3–HCO
Table 3.1.1 Blood gas measurements
NB. Partial pressure refers to the pressure exerted by one specific gas (e.g. oxygen), which forms part of the total pressure exerted by the mixture of gases (e.g. oxygen, carbon dioxide and nitrogen) in the blood.

28
Process of Interpreting ABGs. 1. Check pH
a. Decide whether pH is within normal range or whether there is an acidosis (low pH below 7.35) or an alkalosis (high pH above 7.45).
b. Anything outside the normal range can interfere with metab-olism and may become critical. Discuss any recent changes with medical or nursing staff.
2. Check P a CO 2 If there is an acidosis or an alkalosis, you need to decide whether
this is due to a respiratory or metabolic problem. Identify any hypercapnia (high P a CO 2 above 6 kPa) or hypocapnia (low P a CO 2 below 4.7 kPa) ( Box 3.1.1 ). i. Respiratory acidosis is when hypercapnia causes the blood
to become more acidic (i.e. high P a CO 2 and low pH). ii. Respiratory alkalosis is when hypocapnia causes the blood
to become more alkalotic (i.e. low P a CO 2 and high pH).
Hypercapnia suggests that the patient is hypoventilating (under-breathing). This may be due to fatigue or neuromuscular weakness, so the patient may need support with ventilation, e.g. non-invasive ventilation (NIV). Hypercapnia may also
ASSESSMENT TOOLS28
Example of respiratory acidosis ● pH 7.20 ● P a CO 2 8.3 kPa ● P a O 2 8.4 kPa
Example of respiratory alkalosis ● pH 7.49 ● P a CO 2 4.2 kPa ● P a O 2 15.0 kPa
Box 3.1.1
Top tip! If there is a respiratory problem the pH and P a CO 2 tend to see-saw (e.g. if the pH is higher than normal, the P a CO 2 would be lower than normal).

3.1 Arterial blood gases (ABGs) 29
be due to insensitivity to high P a CO 2 levels, as seen in some patients with chronic obstructive pulmonary disease (COPD) (CO 2 retainers).
Hypocapnia suggests that the patient is hyperventilating (over-breathing). This may be due to pain or anxiety. The patient may need reassurance and might benefit from a pain review, or breathing control and relaxation techniques (see 3.55 Respiratory rate).
3. Check 3HCO − (or BE) Identify whether the patient has a high or low bicarbonate (or
BE). Higher values (above 26 mmol l −1 or BE >+2) will make the blood more alkaline, whereas lower values (below 22 mmol l −1 or BE <−2) will make the blood more acidic. Either of these can, therefore, be used to determine the metabolic (i.e. non-respiratory) contribution to the pH ( Box 3.1.2 ).
i. Metabolic acidosis is when lower levels of bicarbonate (or BE) cause the pH to become more acidic (both change in the same direction to become lower).
ii. Metabolic alkalosis is when higher levels of bicarbonate (or BE) cause the pH to become more alkaline (both change in the same direction to become higher).
Top tip! If there is a metabolic problem the pH and the –
3HCO move in the same direction as if in an elevator (e.g. if the pH is high the –
3HCO will also be high).
Example of metabolic acidosis ● pH 7.28 ● 14 mmol l −1 ● BE −8
Example of metabolic alkalosis ● pH 7.5 ● 30 mmol l −1 ● BE +8
3–HCO
3–HCO
Box 3.1.2

ASSESSMENT TOOLS30
4. Check for compensation Compensation is the balancing of one system with the other
(respiratory and metabolic) to make sure the pH stays within normal limits. This is very important for metabo-lism. Each system (respiratory or metabolic) can there-fore adjust its levels of carbon dioxide or bicarbonates in response to changes in the other system. For example, if there is a respiratory acidosis, the kidneys can start to con-serve bicarbonates in the blood (i.e. not pass as many out in the urine). This will raise -
3HCO levels and make the blood more alkaline, thereby restoring the pH.
The respiratory system can react to change quickly (within a couple of hours) but the metabolic system may take approximately 2 days to respond. Any compensation may be full (complete) or partial ( Box 3.1.3 ).
i. Full compensation is seen when both the P a CO 2 and the -
3HCO are outside the normal range and the pH is within the normal range.
ii. Partial compensation is when the P a CO 2 and -3HCO are both
out of range but the pH is not quite within normal limits.
Top tip! If the pH and the P a CO 2 have moved in the same direction, this suggests that the respiratory system is compensating and the prob-lem is metabolic.
If the pH and the -3HCO have moved in the opposite direc-
tion, this suggests that the metabolic system is compensating and the problem is respiratory.
Example of a fully compensated respiratory acidosis ● pH 7.36 ● P a CO 2 8.4 ● 28 ● BE +4
Example of a partially compensated metabolic acidosis ● pH 7.32 ● P a CO 2 4.2 ● 16 ● BE −6
3–HCO
3–HCO
Box 3.1.3

3.1 Arterial blood gases (ABGs) 31
Note that it may be impossible to distinguish between com-pensated respiratory acidosis and compensated metabolic alkalosis, or between compensated respiratory alkalosis and compensated metabolic acidosis without looking at other clinical findings or a series of ABGs.
The chart in Table 3.1.2 assumes that any compensation is complete not partial.
5. Check oxygenation Hypoxaemia. P a O 2 reflects the ability of the lungs to allow the
transfer of oxygen from the environment to the circulating blood. A reduced P a O 2 , regardless of F i O 2 (how much oxygen the patient is receiving), is called hypoxaemia. You should always check if a reading has been taken while the patient is receiving oxygen therapy, and, if so, how much they are receiving (see 3.43 Oxygen delivery). A P a O 2 of 10.7 kPa is normal, but would not be considered normal if the patient is receiving 60% oxygen.
Identify any significant, deteriorating or potentially critical levels of hypoxaemia. In acute respiratory disease, a P a O 2 <10.7 kPa may be significant and <7.3 kPa may be criti-cal, but chronic respiratory patients may be able to tolerate lower oxygen levels, and hypoxaemia may not be consid-ered significant until it drops below 7.3 kPa. Oxygen ther-apy should be considered for patients with significant (or worsening) hypoxaemia.
S a O 2 levels may be used to determine the need for oxygen therapy. Give oxygen when S a O 2 <90% (see 3.48 Pulse oximetry ).
6. Check for respiratory failure a. Identify whether the patient is in respiratory failure – is it
type I or type II?
Status pH P a CO 2 –3HCO
Normal 7.35–7.45 4.7–6 22–24
Respiratory acidosis ↓ ↑ NormalMetabolic acidosis ↓ Normal ↓Compensated respiratory ‘acidosis’ Normal ↑ ↑Compensated metabolic ‘acidosis’ Normal ↓ ↓
Respiratory alkalosis ↑ ↓ NormalMetabolic alkalosis ↑ Normal ↑Compensated respiratory ‘alkalosis’ Normal ↓ ↓Compensated metabolic ‘alkalosis’ Normal ↑ ↑
Table 3.1.2 Respiratory and metabolic acidosis and alkalosis

ASSESSMENT TOOLS32
i. Type I respiratory failure occurs when P a O 2 is low and P a CO 2 is normal or slightly reduced.
ii. Type II respiratory failure occurs when P a O 2 is low and P a CO 2 is high.
b. Acute or chronic respiratory failure? Identify whether any respiratory failure is acute, chronic or a
mixture of the two. Respiratory failure of recent onset, or deteriorating, should be discussed with a senior as oxygen therapy or ventilation may be urgently required.
When respiratory failure is due to acute respiratory disease, there may be little or no compensation from raised
-3HCO
levels because it takes time (e.g. days) for adequate compen-sation to occur. Therefore, the pH is likely to be low (respi-ratory acidosis).
When respiratory failure is due to a chronic respiratory dis-ease there may be compensation from raised -
3HCO lev-els. Therefore, the pH may be normal, or only slightly lower than normal (compensated respiratory acidosis). Check any current ABG results against any previous or usual results as this will also help to confirm the diagnosis of acute or chronic failure.
It is important to identify the extent to which any respiratory failure is acute or chronic because patients with chronic respiratory disease can tolerate lower levels of hypoxae-mia and may not need oxygen therapy until their lev-els become lower. Additionally, they may be reliant on a ‘hypoxic’ drive to breathe, and if they are given too much oxygen therapy their drive to breathe could be seriously reduced.
DOCUMENTATION Record each value together with time and date of test, and any oxygen therapy or ventilation support given at the time of mea-surement. Record the patient's position if appropriate.
Top tip! Type One failure is when One gas (i.e. Oxygen) is affected – remember they both begin with O!
Type Two is when Two gases (i.e. oxygen and carbon dioxide) are affected.

3.1 Arterial blood gases (ABGs) 33
CLINICAL EXAMPLES (ANSWERS FOLLOW) Case 1
A 65 year old man enters the Accident and Emergency Department short of breath. He has no chest pain but a productive cough. His ABGs are reflected below. What do these show? Can you suggest a possible cause?
● pH 7.29 ● P a O 2 8.2 ● P a CO 2 8.4 ● -
3HCO 24 ● BE 1
Case 2 A 16 year old girl is about to go to theatre for removal of her ton-sils. She has no previous medical history (PMH) but is extremely anxious. Her ABGs immediately before her operation are shown below. What do they show and what is the possible explanation?
● pH 7.49 ● P a O 2 10 ● P a CO 2 3.9 ● -
3HCO 22 ● BE −2
Case 3 An 80 year old ex-miner presents with these ABGs. What do they show? Would you be concerned about these results? What is the reason for your decision?
● pH 7.39 ● P a O 2 9.9 ● P a CO 2 7.2 ● -
3HCO 32 ● BE 6
Case 4 A 25 year old man with no PMH was admitted with a history of fre-quent urination, excessive thirst and nausea for the past 3 days. He was drowsy but coherent and his breathing was notably deep. What do his ABGs show? Would you take any action to try to affect his breathing?
● pH 7.1 ● P a O 2 17 ● P a CO 2 2.5 ● -
3HCO 3.5 ● BE −24

ASSESSMENT TOOLS34
ANSWERS TO CLINICAL EXAMPLES Case 1
This man has a respiratory acidosis (uncompensated). It is an acute condition and may be due to pneumonia or a severe chest infection – note he has type II respiratory failure and may require additional ventilator support.
Case 2 This girl has respiratory alkalosis (uncompensated). This is an acute situation and has been caused by hyperventilation due to anxiety.
Case 3 This man has compensated respiratory acidosis. This is a chronic situation because there has been enough time for -
3HCO to increase and his pH is within the normal range, despite his high P a CO 2 (remember he is an ex-miner; therefore, respiratory disease would not be uncommon).
Case 4 This man has partially compensated metabolic acidosis. His symptoms suggest diabetes, which can cause a fall in -
3HCO and therefore a fall in pH. There is some compensation because the P a CO 2 has gone down, suggesting that he is breathing more in order to try and raise the pH. This is only partially successful because his pH is still below the normal range. Physiotherapy is not going to help his breathing at this point as he needs medical attention to stabilize his diabetes.
●3.2 ATTACHMENTS
DEFINITION These may be any piece of equipment that is attached to the patient, e.g. intravenous (i.v.) lines, central venous line, ECG lines, surgical drains, ventilator tubing, saturations monitor and catheter ( Figs 3.2.1 and 3.2.2 ).
PURPOSE The purpose of an attachment is specific to what is being moni-tored – many of these will be discussed throughout this chapter. However, the ultimate aim of attachments can be subdivided as:
● monitoring/assessment of the patient, e.g. saturations moni-tor, intracranial pressure (ICP) bolt
● provision or drainage of fluids, i.e. what is going in and out, such as drips and drains
● treatment/support of the patient, e.g. renal support, ventilator.

3.2 Attachments 35
Fig 3.2.1 Example of patient attachments in an intensive therapy unit.
Fig 3.2.2 Example of patient attachments in the ward setting.
ASSESSMENT TOOLS36
PROCEDURE Be aware of all attachments and take care not to displace any equipment during your assessment.
FINDINGS If you do not know what a piece of equipment or fluid running into the patient is, ask the nursing staff. It may be important information that will influence what you can/cannot do with the patient, e.g. changing position.
DOCUMENTATION As part of your assessment, all attachments should be noted within your documentation.
●3.3 AUSCULTATION
DEFINITION Auscultation is the process of using a stethoscope to listen to and interpret the lung/breath sounds generated by airflow through the airways.
PURPOSE This assessment technique can help identify sputum retention in the airways, or areas of atelectasis. It may be used as an outcome measure before and after physiotherapy. It can also help identify deterioration or more serious pathology such as a pneumothorax that may need further medical investigation.
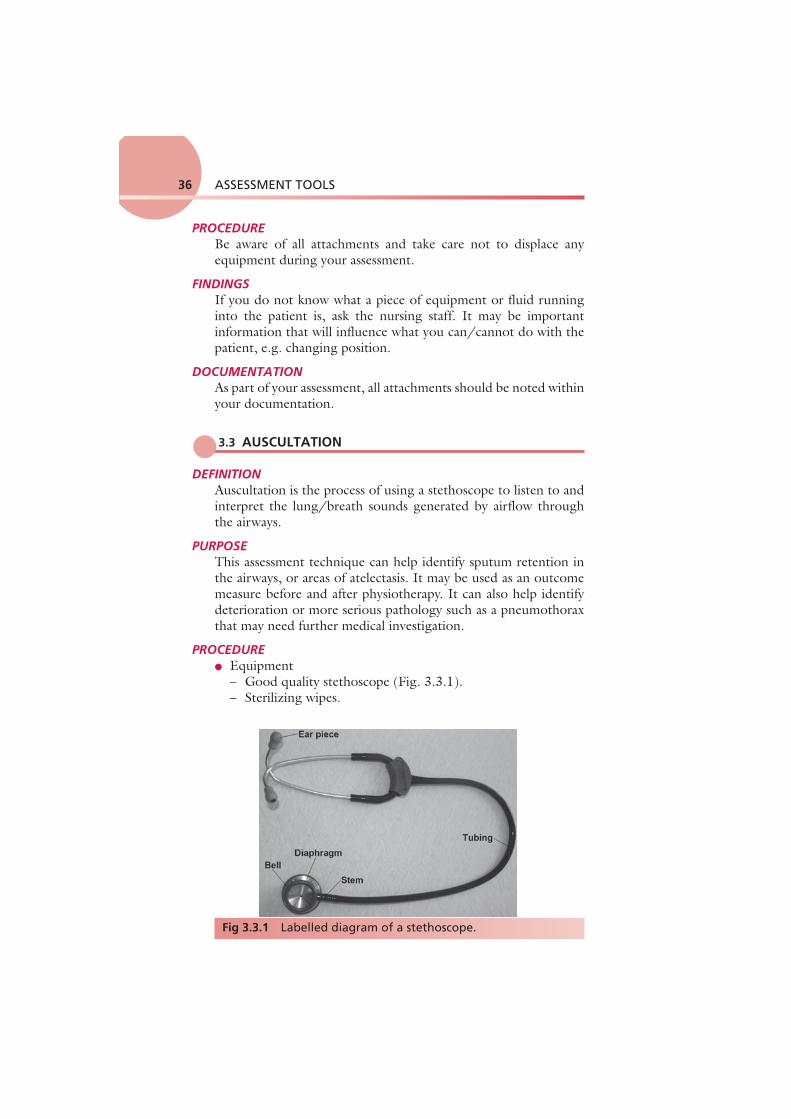
PROCEDURE ● Equipment
– Good quality stethoscope ( Fig. 3.3.1 ). – Sterilizing wipes.
Fig 3.3.1 Labelled diagram of a stethoscope.

3.3 Auscultation 37
● Method – Clean the diaphragm and earpieces with wipes. – Place earpieces in your ears (earpieces should face forwards
in order to fit into your auditory canals). – Check that the stethoscope is tuned to the diaphragm (tap the
diaphragm lightly – can you hear this clearly? If not twist the metal connector until you can hear the tapping sound most clearly).
– Ask the patient if they would be willing to remove any items of clothing in order to expose the chest area, providing this is appropriate and you can maintain their dignity and comfort.
– Position the patient so you can access anterior and posterior aspects of the chest, e.g. sitting up over the edge of the bed or sitting forwards in a chair. If they are confined to bed, you may need help to sit them forwards slightly when listening posteri-orly or help them to roll into side lying. Note that you may have to access the posterior segments by moving your stethoscope under the patient if they are very unwell and unable to move.
– Warn the patient to inform you if they start to feel dizzy. – Place the stethoscope firmly on the chest wall in the posi-
tions described in Fig. 3.3.2 and Table 3.3.1 . – Listen during both inspiration and expiration. Listen to each
zone of the lungs on alternate sides of the chest to compare your findings.
Anterior
RUL
RML
RLL
OO
H
LLL
LUL
Posterior
RUL
RLL
O O
H
LLL
LUL
Fig 3.3.2 Auscultation points.
Reproduced and modified with kind permission from Pryor JA, Prasad SA. 2008 Physiotherapy for Respiratory and Cardiac Problems, 4th Edn. Edinburgh, UK: Churchill Livingstone.
H, horizontal fissure; LLL, left lower lobe; LUL, left upper lobe; RLL, right lower lobe; RUL, right upper lobe; RML, right middle lobe.

ASSESSMENT TOOLS38
– Make sure you listen to one or two full breaths in AND out at each point.
– Allow the patient a period of rest or normal breathing between zones or if they become dizzy.
– When you have finished, note your findings and clean your stethoscope.
FINDINGS For each zone, record whether breath sounds are normal or bronchial, loud or quiet, and then identify any added sounds.
Breath sounds ( Table 3.3.2 ) arise in the trachea and bronchi and are caused by the turbulence of the air as it flows in and out of
Anterior Apical Middle Lower
Left and right Left and right Left and right
Mid-axillary Left and right
Posterior Upper Middle Lower
Left and right Left and right Left and right
Table 3.3.1 Auscultation zones
Normal breath sounds Soft, muffled, louder on inspiration, fade in expiration, ratio 1:2
Turbulence in the large airways
Bronchial breathing Expiration louder and longer with pause between inspiration and expiration (sounds like Darth Vader) Heard normally over trachea
If heard over lung fields, suggests: ● Consolidation ● Collapse without a plug ● May also be heard at the lip of
a pleural effusion
Breath sounds quiet or absent? Poor air entry Low lung volumes Atelectasis
May be due to: ● Shallow breathing ● Poor positioning ● Collapse with complete
obstruction of airway ● Sounds filtered by air
(hyperinflation) ● Sounds filtered by pleura,
chest wall (obese or muscular patients, pleural effusion, pneumothorax, haemothorax)
● Pneumothorax
Table 3.3.2 Breath sounds

3.3 Auscultation 39
these large airways. If you listen over the trachea (just below the cricoid cartilage or Adam's apple) you will hear what they sound like at the source.You will notice that they are very loud here and also quite harsh sounding. Inspiration and expiration are heard clearly (both are loud) and there is a very slight pause between them. These sounds are known as bronchial breath sounds because they are generated in the bronchi (and trachea).
● Normal breath sounds. If you listen anywhere over the lung fields (including all of the zones shown in Fig. 3.3.2 ) the sounds are much quieter because you are over lung parenchyma and the air in the lungs has absorbed a lot of the sound. This attenuates the sound, making it smoother, gentler and more continuous, so it is harder to tell when inspiration changes to expiration. Since we expect to hear these sounds when auscul-tating over the lungs we call them ‘normal breath sounds’.
● Bronchial breathing (bronchial breath sounds heard over lung fields). If you are listening over the lungs and what you hear sounds loud, harsh and discontinuous (i.e. like bron-chial breath sounds), it is not ‘normal’ and suggests that these sounds have not been dampened down by the air in the lungs – usually because in that area of lung the air has been replaced by something solid (consolidated). A solid area transmits sound very well because it vibrates more than air (ask the patient to say ‘99’ while auscultating and the sound will be very clear over consolidated lung tissue). These sounds may occur over an area of lobar pneumonia where the alveoli fill with clotted inflammatory exudate, or over collapsed lung tissue (occurring without a sputum plug), or at the lip of a pleural effusion.
● Breath sounds quieter than normal. If the breath sounds are very quiet it might be because the patient is very large and therefore the sounds have been dampened down by excess soft tissue. Make sure you press the stethoscope firmly to the chest wall and press through the adipose tissue to get the best sound transmission. It might, however, be because the breaths were quite small and not generating much turbulence. Perhaps the patient is not breathing very deeply? Does this fit with your observation and palpation? Is one side of the chest moving more than the other side?
Top tip! Think! If a patient is not breathing very deeply – what possible implications might this have and what problems might this cause?

ASSESSMENT TOOLS40
● Absent breath sounds. A pleural effusion, sputum plugging or pneumothorax could prevent sounds from being heard by absorbing the sound completely before it can be transmitted to the chest wall.
● Breath sounds louder than normal. Loud breath sounds sug-gest more turbulence in the large airways. This is usually due to obstruction or narrowing of these airways, e.g. due to COPD. Narrower airways are harder to breathe through, so the patient may be working harder in order to breathe.
● Other added sounds. – Crackles ( Table 3.3.3 )
Top tip! If you auscultate and hear a ‘silent’ chest, it may mean that the patient is in extremis and is unable to move air at all (check airway and stethoscope). This is a medical emergency and you need to seek expert medical assistance straight away!
Crackles Short, non-musical, popping sounds, fine or coarse
Fine crackles Reopening of airways sounds like rubbing hair next to your ear
Atelectasis
● Short, explosive ● Periphery lung ● Reduce with deep
breath
Intra-alveolar oedema
● ‘Tissue paper’ ● Do not resolve with
deep breath or cough ● Late inspiration (NB:
interstitial fibrosis)
Secretions small airways
● High pitched ● Peripheral ● Clear with cough
Coarse crackles Sounds like pouring milk on rice crispies
Obstruction more proximal and larger airways with sputum. May be inspiratory as well as expiratory
● Early expiratory: central
airways ● Late expiratory: more
peripheral airways ● Large deep sound ● Changes/clears with
coughing
Table 3.3.3 Added sounds: crackles

3.3 Auscultation 41
– Fine crackles. Sound like rubbing a hair next to your ear. They may be due to pulmonary oedema or sputum but are often caused by the sudden opening of small airways when lung volumes are low, suggesting atelectasis. If it is the latter, they often resolve after some deep breathing exercises.
– Coarse crackles. Sound like rice crispies crackling as you add the milk. They may be caused by sputum, par-ticularly if you notice that they reduce or change after coughing.
– Wheezes ( Table 3.3.4 ). Whistling sounds due to nar-rowed airway walls vibrating against each other, indicating airway obstruction. High-pitched wheeze indicates bron-chospasm or oedema in the walls of conducting airways. Low-pitched wheeze indicates sputum.
You should identify whether wheezes or crackles are heard dur-ing inspiration or expiration and whether they are heard early or late during the breath. Louder sounds heard early in the breath are more likely to be generated centrally (in the larger airways). – Pleural rub ( Table 3.3.5 ). A sound like boots crunching
on snow suggests that the pleura are inflamed.
Top tip! Remember crackles are only heard if the velocity of airflow is ade-quate and breath sounds are audible. Coarse crackles move/dis-appear when the patient coughs, whereas fine crackles remain the same after coughing.
Wheezes Musical sounds due to vibration of wall of narrowed airway
High pitched Bronchospasm ● Potential increased work of breathing
Low pitched Sputum ● Disrupted turbulent flow ● Change with coughing
Localized
TumourForeign body
● Limited to a local area on auscultation
Table 3.3.4 Added sounds: wheezes

ASSESSMENT TOOLS42
– Stridor ( Table 3.3.5 ). This is a sound like a loud ‘barking’ noise. Occurs during both inspiration and expiration and is usually caused by significant upper airway obstruction, which could be a foreign body or tumour. If stridor is heard as a new/recent symptom, alert the medical staff immedi-ately as the patient's airway could be compromised.
DOCUMENTATION Record the patient's position and your findings, e.g. ‘Normal breath sounds heard in all zones, quieter in right base. Coarse crackles in right base on mid-expiration, reduced after coughing’.
3.4
● AVPU (SEE ALSO 3.33 GLASGOW COMA SCALE
AND 3.39 LEVEL OF CONSCIOUSNESS)
DEFINITION AVPU is a simple test to give an indication of the level of arousal of a patient. It is a quick neurological assessment and the acronym stands for Awake, Voice, Pain and Unresponsive.
Sounds like Cause
Pleural rub ● Creaking/rubbing (like boots on snow)
● Localized/generalized ● Soft/loud ● Equal inspiration to expiration
● Inflammation of pleura ● Infection ● Tumour
Stridor ● Constant pitch on inspiration and expiration
● Produced in upper airways
● Croup ● Laryngeal tumour ● Upper airway obstruction ! Alert medical staff as the patient's airway is at great risk of compromise
Table 3.3.5 Other sounds
Top tip! Auscultation is only a small part of respiratory assessment and its interpretation is subjective. Always consider your findings alongside other assessment information before drawing any firm conclusions.

433.4 AVPU
PURPOSE This was adapted from paediatric practice to acute adult care as a method of quickly identifying change in neurological arousal. While effective, it does not replace formal neurological assessment such as the Glasgow Coma Scale (see 3.33 Glasgow Coma Scale and 3.57 Sedation/agitation score).
PROCEDURE There are only four possible outcomes within this scale. Ask the patient a simple question such as ‘hello – can you hear me’. Look for the best response in the patient. If the patient is asleep, he or she should be woken first. It is not valid in patients who are sedated or having paralyzing drugs.
1. Alert . The patient is alert and responsive and answers clearly and coherently. The patient could be sitting up reading the paper or talking to visitors.
2. Voice . The patient is responding only to voice commands and may be drowsy, possibly keeping eyes closed and not speaking coher-ently. There is a response to your voice. Does the patient wake up when you call their name? This response may be only a grunt.
3. Pain . The patient responds only to pain. To elicit any response from the patient requires a painful stimulus (for procedure and appropriate painful stimuli, see 3.33 Glasgow Coma Scale).
4. Unresponsive . The patient is unresponsive. This patient is unresponsive or unconscious. They may be in a ‘coma’ with no eye opening or movement.
FINDINGS Note that you are looking for a change in status. If a patient who was previously alert is now only responding to voice, this is a sig-nificant change and should be notified to the team. Any patients who are only responding to pain or who are unresponsive warrant an urgent medical review.
DOCUMENTATION This should be documented in the neurological section of the assessment as the level of response according to the first letter of the acronym, e.g. ‘The patient was at “V” on the AVPU scale’. Some units write down the acronym AVPU and circle the appro-priate letter e.g. AVP U

ASSESSMENT TOOLS44
●3.5 BLOOD PRESSURE (BP)
DEFINITION The force exerted by the blood against the walls of the arteries. Blood pressure (BP) can be measured in a large artery (e.g. brachial or femoral), and may be measured invasively through an arterial line or non-invasively through a cuff and sphygmomanometer (manu-ally) or by using an automated BP machine ( Figs 3.5.1 and 3.5.2 ).
Fig 3.5.1 Non-invasive blood pressure monitors. Manual sphygmomanometer (left) and automated blood pressure machine (right).
Fig 3.5.2 Invasive blood pressure measurement. Arterial blood pressure trace; the arterial trace is second from the top with a blood pressure of 101/49 and a mean arterial pressure of 66.

3.5 Blood pressure (BP) 45
PURPOSE The measurement of BP is very important when determining car-diovascular status and stability in the critically ill patient as well as monitoring patients at risk of deterioration that could lead to cir-culatory failure. The physiotherapist must also take BP status into account when standing and mobilizing patients and when pre-scribing exercise. BP may also be used as an outcome measure for physiotherapy treatment.
PROCEDURE Non-invasive BP monitoring: cuff and sphygmomanometer ( Fig. 3.5.3 )
● Choose an appropriate sized cuff for the patient ( Table 3.5.1 ). The inflatable part of the cuff should go round at least 75% of the arm circumference, but it should not be any longer than the arm circumference.
● Observe the patient's arm carefully throughout the procedure. If there is any pain or numbness or if the arm starts to change colour, becoming blue or purple, the cuff should be immedi-ately deflated and removed from the arm. 1. The patient should be sitting still with their elbow
extended and supported at approximately the level of the heart. Ideally, the patient should rest for 5 minutes before the measurement is taken.
Fig 3.5.3 Blood pressure measurement using a sphygmomanometer.

ASSESSMENT TOOLS46
2. Explain that the cuff will exert an uncomfortable pressure for a few seconds while inflated.
3. Ensure there is no residual air in the cuff (squeeze any air out), then wrap the cuff around the arm above the elbow joint so that the ‘arterial point’ on the cuff is over the bra-chial artery (medial to the biceps muscle on the anterior aspect).
4. Fasten the cuff firmly but not too tightly. 5. Inflate the cuff to a pressure higher than the ‘likely’ sys-
tolic pressure. For most people 150 mmHg will be suf-ficient; however, if a person is known to have a high BP, or if you are measuring following exercise, you will need to inflate to a higher pressure, up to a maximum of 260 mmHg.
6. Release the pressure in the cuff slowly while using a stethoscope over the brachial artery pulse at the anterior aspect of the elbow. Listen for the sounds generated by the blood flow in the artery. These are described as soft knocking or pounding sounds (Korotkoff sounds).
7. Record the pressure when you FIRST hear the knocking sounds. This is the systolic pressure.
8. Record the pressure when you STOP hearing the knock-ing sounds. This is the diastolic pressure.
9. Release the valve and allow the cuff to completely deflate before removing it from the patient's arm.
10. Check the arm to ensure circulation (normal pink colour) is restored and no damage has been caused.
Cuff and automated BP machine ( Fig. 3.5.4 ) ● Make sure you are familiar with the machine and any manufac-
turer's instructions before commencing.
Size of cuff Upper arm circumference (measure at mid-point of humerus)
Child/small adult cuff <23 cm
Standard/regular adult cuff <33 cm
Large adult cuff <50 cm
Adult thigh cuff <53 cm
Table 3.5.1 Blood pressure cuff sizes

3.5 Blood pressure (BP) 47
● Carry out steps 1–5 above; then press the start button on the automated BP machine.
● It is very important to observe the patient's arm carefully. If there is any pain or numbness or if the arm starts to change colour, becoming blue or purple, the cuff should be immedi-ately deflated and removed from the arm.
● If the machine stays inflated too long, or continually reinflates over and over again, stop the procedure and check the patient's circulation.
● Check the arm to ensure circulation (normal pink colour) is restored and no damage has been caused.
FINDINGS Average resting BP is 120/80 mmHg. The first figure (120 mmHg) represents the systolic pressure, achieved during ventricular con-traction. The second figure (80 mmHg) is the diastolic pressure, achieved during ventricular diastole. Invasive measurements of BP will also calculate MAP (mean arterial pressure) (see 3.10 (Invasive) Cardiac monitoring).
Normal BP ranges between 95/60 and 140/90 mmHg, but does tend to increase with age. The significance of any ‘abnor-mal’ values (i.e. outside the range given) depends on what is usual for that patient. A one-off abnormal measurement may not be
Fig 3.5.4 Measuring blood pressure using an automated machine.

ASSESSMENT TOOLS48
significant, because BP varies with many factors, including activ-ity levels, emotion (including stress!) and temperature. It is more important to look at the ‘trend’ and identify any changes over time. However, if there is a sudden significant change in BP you should seek senior advice.
Hypotension is defined as BP <95/60 mmHg (adults). If BP is dropping over time, or is below the patient's usual level, this could be significant because it could compromise blood flow to the brain, leading to fainting or, in more serious situations, cir-culatory failure and death. A patient whose pulse is higher than their systolic BP at rest is likely to be significantly compromised and may require urgent attention and circulatory support (e.g. intravenous fluids and possibly cardiopulmonary resuscitation (CPR)).
Postural hypotension may occur if the BP drops when the patient sits or stands up, leading to dizziness or fainting. Patients are most at risk when getting out of bed for the first time after a period of bed rest. If the patient's BP is low, take extra care when getting them up and ensure that this is carried out slowly.
Hypertension is defined as BP >140/90 mmHg. The signifi-cance of high BP depends on the patient's age and their usual values. A diastolic pressure of >95 mmHg warrants a degree of caution with any ‘active’ treatments or mobilization. Any unex-plained increase in BP above the normal range and the patient's usual values should be referred to the medical practitioner for investigation.
Blood pressure should also be considered in conjunction with any medication the patient may be on that may affect the BP:
● Inotropes (e.g. adrenaline, noradrenaline, enoximone, milri-none) help to increase BP. Patients who need this support are less stable, and need extra caution with physiotherapy techniques.
Top tip! If the BP is much higher than the heart rate or much lower than the heart rate seek advice from a senior as this can indicate an acute problem.

3.6 Blood results 49
● Anti-hypertensives (e.g. beta-blockers, angiotensin-converting enzyme inhibitors, diuretics) help to reduce BP and may affect the patient's response to exercise (see 3.22 Drugs).
DOCUMENTATION Record measurement, e.g. resting BP on L arm in sitting using (name of) machine = 120/80 mmHg.
●3.6 BLOOD RESULTS
DEFINITION There are a number of different types of blood tests; Table 3.6.1 summarizes those that are particularly relevant to physiothera-pists. Other types of blood tests include those for immunology and virology.
PURPOSE Blood results reflect body systems and how they are functioning. They may give an indication of deterioration or improvement. Some results can be markers of specific problems. For example, they can be used to identify patients:
● developing a chest infection which might require chest physiotherapy
● at risk of bleeding and the need for caution with manual chest therapy techniques
● at risk of deep vein thrombosis (DVT) and caution with mobilization
● with anaemia who may be at risk of low oxygen levels.
Haematology Biochemistry Blood sciences Microbiology
Full blood count Coagulation
CRP Lactate Liver function U&Es Cardiac markers (ABGs)
Glucose Identification of bacterial infections
Table 3.6.1 Types of blood tests relevant to physiotherapists
ABG, arterial blood gas; CRP, C-reactive protein; U&Es, urea and electrolytes.

ASSESSMENT TOOLS50
PROCEDURE Blood tests in the main are carried out by medical and nurs-ing staff. Some specialist physiotherapists may take some blood samples, e.g. ABGs.
FINDINGS
Full blood count A common test that assesses the state of health of the patient ( Table 3.6.2 ). For definitions, see the further reading suggested at the end of this section.
Coagulation screen ( Table 3.6.3 ) This gives an indication of the body's ability to form clots. Activated prothrombin time (APTT) and prothrombin time (PT) are often tested together to evaluate the function of all clot-ting factors. PT is often adjusted to the international normalized ratio (INR), especially in the assessment of anticoagulant therapy (blood thinners). Fibrinogen assesses the body's ability to form and break down clots.
C-reactive protein (CRP) CRP ( Table 3.6.4 ) is an inflammatory marker (often used along-side the white blood count). It serves as a general marker of infection and inflammation.
Lactate Lactate ( Table 3.6.4 ) is a by-product of anaerobic respiration and rises in patients with sepsis. It is also a marker of the severity of stress response. Hyperlactataemia is a mild-to-moderate persistent increase in blood lactate concentration (2–5 mmol l −1 ) without metabolic acidosis. Lactic acidosis is a persistently increased blood lactate level (usually >4–5 mmol l −1 ) in association with metabolic acidosis. It is not within the remit of this book to discuss lactic acidosis; see Further reading on this subject at the end of this section.
Top tip! There is much variation in the normal values referenced by differ-ent texts, online and in hospitals. Therefore, the ranges provided here are guides; when reviewing patient results the normal values used in your own facility should be used.

3.6 Blood results 51
Table 3.6.2 Full blood count results
Test (normal range) Too high Too low
(WBC) (4–11 × 10 9 /l) May be increased with infections, inflammation, cancer, leukaemia
Decreased with some medications (e.g. chemotherapy), when immune system is compromised, some severe infections, bone marrow failure
WBC differentials, i.e. neutrophils, lymphocytes, monocytes, eosinophils and basophils
Measures the percentage of each type of WBC in blood. A low level is generally due to immunocompromise. Neutropenia is a low neutrophil count and happens after chemotherapy; neutropenic sepsis is when the patient becomes very unwell and has no reserves to fight off infection
RBC (M = 4.5–6.5 × 10 12 /l) (F = 3.9–5.6 × 10 12 /l)
Increased when too many made and with fluid loss, e.g. diarrhoea, dehydration or burns
Decreased with anaemia; may mean patients tire easily as reduced RBC and Hb reduce oxygen-carrying ability
Hb (M = 13.5–18.0 g/dl) (F = 11.5–16.0 g/dl)
Mirrors RBC results
Hct (M = 42–54%) (F = 38–46%)
Mirrors RBC results
MCV (76–96 fl)
Increased with B 12 and folate deficiency
Decreased with iron deficiency and disorders of Hb
Platelets (150–400 × 10 9 /l)
May be increased in people living at altitude. Myeloproliferative disorder may cause greater propensity for DVT and clotting problems. Oestrogen and the oral contraceptive pill can cause increased levels
Decreased when greater numbers used, e.g. bleeding, some inherited disorders, leukaemia and chemotherapy. Caution with treatment as high risk of bleeding
DVT, deep vein thrombosis; F, female; Hb, haemoglobin; Hct, haematocrit; M, male; MCV, mean corpuscular volume; RBC, red blood cell; WBC, white blood cell.

ASSESSMENT TOOLS52
Table 3.6.3 Coagulation results
Test (normal range) Too high Too low
APTT (25–35 s)
Clotting deranged, bleeding time prolonged and interventions may have higher risk of bleeding; many treatments can be contraindicated. Check with senior!
Potential hypercoagulable state in which blood may clot too easily; this is unusual but could lead to, for example, DVT
PT (11–15 s)INR (0.8–1.2)
Fibrinogen(2.0–4.0 g/l)
May rise sharply in any condition that causes inflammation or tissue damage. Rise will increase a person's risk of developing a blood clot
Low levels impair the body's ability to form a stable clot; may be an inherited disorder or can be the result of illness. Caution with treatment and discuss with senior!
Platelets See Full blood count
APTT, activated prothrombin time; DVT, deep vein thrombosis; INR, international normalized ratio; PT, prothrombin time.
Test Too high Very high
CRP Normally <6 mg/l
Acute infection or inflammation
A CRP >100 mg l −1 is suggestive of bacterial infection
Lactate Normally 0.5–1.8 mmol/l
Gives an indication of anaerobic respiration
Levels of 4–5 in presence of metabolic acidosis = lactic acidosis, i.e. your patient is very unwell!
Table 3.6.4 C-reactive protein and lactate results
CRP, C-reactive protein.

3.6 Blood results 53
Urea and electrolytes (U&Es) U&Es ( Table 3.6.5 ) encompass renal function and electrolyte tests. Urea and creatinine are the main markers of renal function.
Electrolytes are salts that conduct electricity and are found in the body fluid, tissue and blood (e.g. chloride, calcium, magnesium, phosphate, sodium and potassium). Sodium (Na + ) is concentrated in the extracellular fluid (ECF) and potassium (K + ) is concentrated in the intracellular fluid. Proper balance is essential for muscle coordination, heart function, fluid absorption and excretion, nerve function and concentration. Levels may be affected by diet, total body water and the amount of electrolytes excreted by the kidney.
Sodium (Na + ) Na + ( Table 3.6.6 ) plays a vital role in maintaining the con-centration and volume of the ECF. It is the main cation of the ECF and a major determinant of ECF osmolality. Na + is important in maintaining irritability and conduction of nerve and muscle tissue and assists with the regulation of acid–base balance.
Test Measurement significance
Urea (2.1–8.0 mmol/l)
Urea is the final degradation product of proteins and amino acid metabolism and is the most important catabolic pathway for eliminating excess nitrogen in the body. Blood loss, fluid balance, renal failure and liver failure can also cause rises in urea
Creatinine (M = 80–115 μ mol/l) (F = 70–100 μ mol/l)
A waste product produced by muscles; related to muscle mass (women and children tend to have lower levels). Creatinine blood levels can also increase temporarily as a result of muscle injury and are generally slightly lower during pregnancy Creatinine clearance measures how well creatinine is removed from your blood by your kidneys. It is completed using a blood sample and 24 hour urine collection
Table 3.6.5 Urea and creatinine results
F, female; M, male.

ASSESSMENT TOOLS54
Potassium (K + ) K + ( Table 3.6.6 ) is the major ion of the body. Nearly 98% of potassium is intracellular, with the concentration gradient maintained by the sodium- and potassium-activated adenosine triphosphatase pump. The ratio of intracellular to extracellular potassium is important in determining the cellular membrane potential.
Small changes in the extracellular potassium level can have pro-found effects on the function of the cardiovascular and neuromus-cular systems.
Other electrolytes have different functions but are not as com-monly reviewed by physiotherapists and therefore will not be cov-ered here.
Test Too high Too low
Sodium (135–145 mmol/l)
Hypernatraemia >145 mmol l −1 Caused by disruption in water balance: either too little going in or too much coming out, or by salt loading
Hyponatraemia <135 mmol l −1 caused by water intoxication, altered ADH secretion and drugs, e.g. diuretics and MDMA (ecstasy). If seen in dehydrated patients, seek expert help
Potassium (3.5–5.0 mmol/l)
Hyperkalaemia >5.5 mmol l −1 (severe is >7 mmol l −1 ) Decreased or impaired potassium excretion most common in renal failure but also potassium-sparing diuretics and specific inherited diseases
Hypokalaemia <3.5 mmol l −1 Caused by renal losses, GI losses and drug effects (commonly diuretics)
If potassium is out of range in either direction there is a high risk of cardiovascular instability, especially if the patient suffers from renal failure! If you are unsure if it is appropriate to treat, seek senior advice!
Table 3.6.6 Sodium and potassium results
ADH, antidiuretic hormone; GI, gastrointestinal.

3.6 Blood results 55
Cardiac markers These are substances released into the bloodstream when the heart is damaged. The two commonly used markers are troponin and creatinine kinase. These can be used to diagnose, evaluate and monitor heart problems.
Glucose Blood sugar levels are important in maintaining acid–base bal-ance in the body. It has previously been suggested that tight gly-caemic control improved mortality, but this is currently under question. However, glucose levels ( Table 3.6.7 ) are important because altered results may cause dramatic effects and yet can be easily treated.
Microbiology The pathology department can run specific tests for infections within the blood. If bacteria are identified, an appropriate antibiotic can be prescribed. Specific tests will not be discussed within this text.
DOCUMENTATION Blood results relevant to your assessment should be documented within the cardiovascular system (CVS) section of your assessment or under a heading of haematology. It is good practice to identify the trends of the results and note any cautions to treatment based upon these.
FURTHER READING Skinner, S., 2005. Understanding Clinical Investigations: A Quick
Reference Manual, 2nd edn. Balliere Tindall, London, UK.
Test Too high Too low
Glucose Normal 3.6–6 mmol/l
Hyperglycaemia leads to fatigue and thirst. In the diabetic patient when high levels have been present for some time, diabetic ketoacidosis can develop – a medical emergency
Hypoglycaemia Sympathetic responses: sweating, tremors and tachycardia CNS symptoms of confusion convulsions, dizziness and syncope
Table 3.6.7 Glucose results
CNS, central nervous system.

ASSESSMENT TOOLS56
●3.7 BREATHING PATTERN (See under 3.54 RESPIRATORY PATTERN – page 148)
●3.8 BREATHLESSNESS (DYSPNOEA) SCALES
DEFINITION Breathlessness (dyspnoea) is the subjective sensation of difficulty in breathing or the perception of an increased effort to breathe. There are several different tools that may be used to ‘measure’ this perception by attempting to quantify what is essentially a qualita-tive patient experience. Two scales that are commonly used by physiotherapists are:
● Borg breathlessness scale (CR10) ● Medical Research Council (MRC) scale.
Other breathlessness scales include visual analogue scales, the base-line dyspnoea index (BDI) and scales found within other quality of life measurement questionnaires such as the St Georges ques-tionnaire and chronic respiratory questionnaire.
PURPOSE Breathlessness scales have a number of uses:
● The Borg scale (CR10) can be used to rate exercise intensity during an exercise test and identify an appropriate level of inten-sity when prescribing exercise or activity. It may also be used to monitor progress during an exercise programme and as a guide when patients are learning to desensitize themselves to their breathlessness.
● The MRC scale can be used to classify patients according to the functional impact of their respiratory disease. This can be used to monitor progression or deterioration and in helping to select patients who are appropriate for pulmonary rehabilitation and medical interventions.
● Breathlessness scales can also be used as outcome measures for drug therapy and for physiotherapy interventions such as exer-cise programmes, breathing control or sputum clearance.
PROCEDURE Borg scale ( Table 3.8.1 )
Ensure that the patient understands the scale points and descrip-tors; then ask them to rate how strong their feeling of breathless-ness is at that moment according to the criteria.

3.8 Breathlessness (dyspnoea) scales 57
Note that some texts refer to the absolute maximum level of breathlessness as above 10; on some adapted scales, this may be marked with a symbol, e.g. ‘*’. There is also a Borg scale that uses 20 points (see 3.51 Rating of perceived exertion).
MRC scale ( Table 3.8.2 ) Ask the patient to pick the statement that is most applicable to them. If their breathlessness is variable, they should focus on the past 2 weeks when answering.
FINDINGS Borg scale
As this is a subjective measure, patient ratings will vary considerably and we cannot compare patients with each other using this scale. Patients are generally encouraged to try and exercise at between 3 and 5 on the scale and to learn to pace themselves accordingly. Patients who get more breathless than ‘5’ during exercise or activ-ity should be monitored carefully, but, providing their sensation
Number Strength of perception of breathlessness
0
0.3
0.5
0.7
1
2
2.5
3
4
5
6
7
8
9
10
*
Nothing at all
Extremely weak (just noticeable)
Very weak
Weak
Moderate
Strong (heavy)
Very strong
Extremely strong (almost maximal)
Absolute maximum/highest possible
Table 3.8.1 The Borg CR10 scale

ASSESSMENT TOOLS58
of effort is back to resting levels within 5 minutes of stopping, they are generally considered safe to exercise at that intensity.
MRC scale Some pulmonary rehabilitation programmes use MRC grade 3 and above as a criterion for inclusion in a pulmonary rehabilitation programme, as this indicates that the patient is limited by their breathlessness and may find benefit from such a programme.
DOCUMENTATION For the Borg scale, record the score and state whether at rest or during exercise. Record the intensity of any exercise undertaken and any additional (qualitative) comments the patient may make about their breathlessness.
For the MRC scale, record the score and note the status of the patient (i.e. whether or not the patient has had a recent exacerba-tion or whether he or she is in a stable condition).
FURTHER READING Borg, G. The Borg CR10 Scale®. © G. Borg, 1982, 1998, 2004. Borg
Perception, Gunnar Borg, Rädisvägen 124, S-165 73 Hässelby, Sweden. Stenton, C., 2008. The MRC breathlessness scale. Occup. Med. 58,
226–7.
●3.9 CAPILLARY REFILL TEST
DEFINITION A quick test performed on the nail beds to monitor dehydration and the amount of blood flow to tissue.
MRC score Descriptor
1 I only get breathless with strenuous exercise
2 I get short of breath when hurrying on the level or walking up a slight hill
3 I walk slower than other people of the same age on the level because of breathlessness, or I have to stop for breath when walking at my own pace on the level
4 I stop for breath after walking about 100 yards or after a few minutes on the level
5 I am too breathless to leave the house or garden by myself (i.e. I can only leave the house if I am with others and/or need a car to get out)
Table 3.8.2 Medical Research Council (MRC) scale

593.10 (Invasive) Cardiac monitoring
PURPOSE This test is used to assess the amount of blood flow to the tissue and to determine the patient's tissue perfusion. If capillary refill is slower than expected then reduced cardiac output or impaired digital perfusion is suspected and should be further investigated by medical staff.
PROCEDURE ● This should be performed at the level of the heart. ● Pressure is applied to the nail bed until it turns white, indicating
that the blood has been forced from the tissue (blanching). ● Once the tissue has blanched, pressure is removed. ● The time taken for the tissue to return to its normal colour is
then recorded. ● The tissue should normally take less than 2 seconds to return to
its normal colour.
FINDINGS A slow capillary refill time may indicate dehydration (hypovolae-mia), hypothermia, peripheral vascular disease or sepsis. If the slow refill time is caused by dehydration the patient may potentially have dry tenacious secretions, which are difficult to expectorate.
A fast capillary refill time may indicate overhydration (hypervo-laemia). This may have an impact on physiotherapy if the patient shows other signs of symptoms of fluid overload leading to pul-monary oedema. Capillary refill time can also be very fast if the patient is very hot and is vasodilated to lose heat.
DOCUMENTATION Capillary refill time should be recorded (especially if greater than 2 seconds) under the cardiovascular section of your assessment.
●3.10 (INVASIVE) CARDIAC MONITORING
DEFINITION Invasive cardiac monitoring comprises the calculation of cardiac activity and cardiac function through the insertion of invasive (intravascular) catheters.
Key terminology ● Stroke volume index : a calculation relating the stroke volume
(the amount of blood pumped by the left ventricle in one con-traction) to the body surface area (normal range = 33–47 ml/m 2 /beat).

ASSESSMENT TOOLS60
● Cardiac index : a calculation that relates the cardiac output (stroke volume × heart rate) to body surface area (normal range = 2.5–4.0 l/min/m 2 ).
● Global ejection fraction : the proportion of the volume of blood in the ventricles at the end of diastole that is ejected during sys-tole; it is the stroke volume divided by the end-diastolic volume, often expressed as a percentage (normally range = 65 ± 8%).
● Mean arterial pressure : the average BP in an individual. It is not a true average as diastole counts twice as much as systole because two-thirds of the cardiac cycle is spent in diastole (normal range = 70–105 mmHg). It is calculated using the equation:
= ´ +MAP [(2 diastolic) systolic] / 3
● Systemic vascular resistance : the resistance to flow that must be overcome to push blood through the circulatory system (nor-mal range = 800–1200 dynes.sec/cm 5 ).
PURPOSE The purpose of invasive cardiac monitoring is to quickly ascertain how the heart is functioning, and to help assess the cardiovascular status of a patient. Information gained from these devices provides information on cardiac function and assists in the optimization of cardiac function as well as in the treatment of heart failure, kidney failure, pulmonary disease and complex fluid management. Such devices will be seen within the intensive therapy unit (ITU) and theatre environments.
For physiotherapists, cardiac monitoring will assist in the assessment of the cardiovascular system. This will aid in decid-ing whether physiotherapy treatment is required and whether the patient is likely to tolerate any intervention. If a patient has any form of invasive cardiac monitoring it should be observed throughout the treatment, and, if gross changes occur, treatment should be stopped immediately (e.g. sudden reductions in BP). In these circumstances, medical advice must be sought.
PROCEDURE The insertion of all invasive cardiac monitoring is completed by specifically trained doctors.
Arterial pressure Intra-arterial pressure measurement is performed through the insertion of a line into an artery (this is called an arterial line). Arterial BP is then interpreted through a transducer and displayed on the monitor system.

3.10 (Invasive) Cardiac monitoring 61
Central venous pressure (CVP) Reflects right ventricular filling and is usually monitored via a catheter which sits within the superior vena cava. The catheter is usually inserted via the subclavian vein within the thorax or the internal jugular vein. Less commonly, central venous cathe-ters can be inserted via the femoral vein (see 3.11 Central venous pressure).
Pulmonary artery catheter (Swan–Ganz) A pulmonary artery catheter is a catheter which is inserted into a pulmonary artery. This is done by a video-fluoroscopy-guided catheter that is passed via a major vein (e.g. internal jugular vein) through and into the right atrium and right ventricle. From here, the catheter can be forwarded into one of the pulmonary arteries. It is a diagnostic tool used to detect heart failure or sepsis.
Pulmonary artery occlusion pressure (previously known as wedge pressure) can also be recorded using a pulmonary artery catheter by passing a balloon-tipped catheter into a pulmonary capillary. The normal range for pulmonary artery occlusion pres-sure is 2–12 mmHg.
Continuous thermodilution (e.g. PiCCO®) The PiCCO® system (Pulsion Medical Systems AG; Fig. 3.10.1 ) requires the insertion of a thermodilution catheter in the femo-ral or axillary artery and a central venous catheter (no catheter in right atrium required). By using a complex technique of trans-pulmonary thermodilution the monitor is able to provide specific
Fig 3.10.1 PiCCO® system (Pulsion Medical Systems AG). Reproduced with kind permission from Pryor JA, Prasad SA. 2008 Physiotherapy for Respiratory and Cardiac Problems, 4th Edn. Edinburgh, UK: Churchill Livingstone.

ASSESSMENT TOOLS62
parameters for arterial BP, heart rate, cardiac output, global end-diastolic blood pressure, intrathoracic blood volume index, car-diac function index, global ejection fraction, stroke volume, stroke volume variation and systemic vascular resistance.
FINDINGS All of the above invasive cardiac monitoring systems indicate the function of the heart and can assist in the assessment of the whole cardiovascular system. Changes in the cardiac function will assist the medical and physiotherapy team in assessing the response to intervention and guide future treatment. For example, if a patient has a large change in cardiac output during manual hyperinflation, this will aid future decisions on whether to repeat treatment or choose an alternative modality.
For implications of arterial blood pressure, see 3.5 Blood pres-sure; for CVP, see 3.11 Central venous pressure.
Pulmonary artery pressure and PiCCO®. Pulmonary artery pressure will increase in poor left ventricular function, fluid over-load (hypervolaemia) and mitral valve disease. However, low measurements will be seen in hypovolaemia. This information is important to physiotherapists as hypervolaemia may be seen in conjunction with pulmonary oedema, whereas hypovolaemia may cause drying of secretions making them harder for the patient to expectorate. Also, hyper- or hypovolaemic patients will react dif-ferently to rehabilitation because of the extra demands placed on the heart and vascular system.
DOCUMENTATION Arterial BP (where available) is recorded as part of the cardiovas-cular section of a system-based assessment. It may also be neces-sary to document non-invasive BP if grossly different as any reason for the difference (e.g. poor arterial BP trace). Any other forms of invasive cardiac monitoring may be recorded as required or as appropriate for the assessment being completed.
●3.11 CENTRAL VENOUS PRESSURE (CVP)
DEFINITION CVP reflects the amount of blood returning to the heart (right ventricular filling or ‘preload’). It is usually monitored via a cath-eter situated within the superior vena cava.

3.11 Central venous pressure (CVP) 63
PURPOSE CVP measurement may be used to guide fluid therapy. It is useful for the physiotherapist as it can help us to identify patients who are:
● overloaded with fluid and at risk of developing pulmonary oedema
● dehydrated and may have dry tenacious secretions ● at risk of cardiovascular instability during treatment.
PROCEDURE The catheter can be inserted via the subclavian, the internal jugu-lar or the femoral veins. The catheter is connected to a manome-ter that sits level with the right atrium of the heart ( Fig. 3.11.1 ). A central line trace and value is seen on the patient's monitor (this is often blue). Within critical care, continuous measure-ments are possible. Heart function is indirectly measured by CVP; therefore, in the critically unwell patient more specific invasive monitoring may be utilized (see 3.10 (Invasive) Cardiac monitoring).
500 ml 0.9% saline
Giving set
Filter
Manometer
Scale
Zero reference line
Central venouspressure catheter
Three-way tap
Fig 3.11.1 Central venous pressure line set-up. Reproduced with kind permission from Pryor JA, Prasad SA. 2008 Physiotherapy for Respiratory and Cardiac Problems, 4th Edn. Edinburgh, UK: Churchill Livingstone.

ASSESSMENT TOOLS64
FINDINGS ● Normal CVP = 3–15 cmH 2 O ● A high CVP may be associated with conditions that cause a
rise in right atrial pressure such as heart failure, reduced right atrial compliance, tension pneumothorax, fluid overload or pulmonary hypertension.
● A low CVP may suggest hypovolaemia (reduced fluid) and gross vasodilatation of blood vessels (e.g. as in sepsis).
● Changes in CVP can provide information to the medical team on current fluid balance and also response to fluid loading.
DOCUMENTATION CVP should be documented under the CVS section of your assessment.
●3.12 CEREBRAL PERFUSION PRESSURE (CPP)
DEFINITION Cerebral perfusion pressure (CPP) represents the pressure in the cerebral circulation that determines blood flow to the brain ( perfusion). This value is calculated using the equation:
CPP MAP ICP= –
PURPOSE Monitoring CPP allows the team to identify whether the patient's brain has enough blood flow to prevent further damage and pro-vide enough oxygen to the brain tissue. Physiotherapists must be aware of the CPP value as our treatment techniques may have an impact on both BP and ICP (intracerebral pressure) and therefore alter CPP – see 3.37 ICP.
FINDINGS The accepted value for CPP can be based on the individual, but commonly 50–90 mmHg is used. Persistently low pressures will cause brain ischaemia. High pressures may lead to bleeding and/or compression of brain tissue. Either situation could cause fur-ther brain damage.
If CPP is too high or too low, physiotherapy treatments (e.g. manual chest clearance, head-down positioning, suction or passive/active movements) may worsen the situation. They are likely to be contraindicated, or only used if considered essential to improve

3.13 Chest drains 65
arterial oxygenation. If you do need to treat, determine whether the patient is stable enough and if there is any leeway if the BP should fall or the ICP should rise with treatment. Treatment deci-sions in this situation should be discussed with senior colleagues.
DOCUMENTATION The CPP value should be documented under the central nervous system (CNS) section of assessment and should be considered alongside MAP and ICP as well as the global clinical picture.
●3.13 CHEST DRAINS
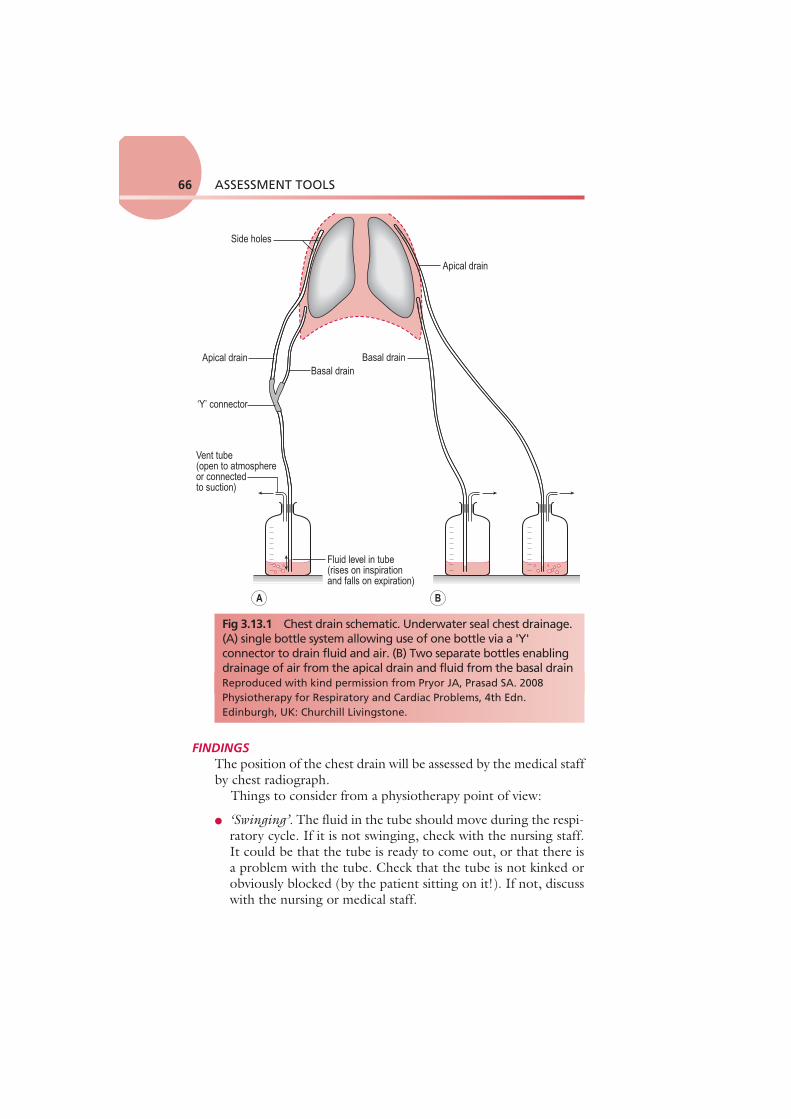
DEFINITION A chest (intercostal) drain is a tube inserted into the pleural space in order to drain air (pneumothorax) or fluid (pleural effusion, empyema, haemothorax or residual postoperative fluid) from the pleural space. The size of the tube can vary, from narrow bore (approximately 5 mm) to wide bore (approximately 1.5 cm). The tube leads away from the thorax to an underwater sealed unit which stops the drained fluid backtracking up the tube ( Fig. 3.13.1 ). The drainage of fluid can be enhanced by the appli-cation of low-pressure suction. The tube will only be removed when it has stopped draining air or fluid.
PURPOSE Chest drains can be placed as part of a surgical procedure or to treat medical symptoms. It is important to observe the location and drainage of the chest drain as part of physiotherapy assessment as its presence may affect the patient's mobility and ability to expand the thorax. It is also important to notice whether the drain is blocked or not draining properly – this needs to be reported immediately.
PROCEDURE A simple look, listen and feel will tell you a lot:
● Look at where the drain enters the patient and the dressing around it. Do not take down the dressing, but look for oozing or leaks. Look at the tube and bottle forming the underwater seal and how the water level varies ( Fig. 3.13.2 ).
● Listen to the patient – do they report any pain and how are they breathing?
● Feel the level of expansion of the chest.
ASSESSMENT TOOLS66
FINDINGS The position of the chest drain will be assessed by the medical staff by chest radiograph.
Things to consider from a physiotherapy point of view:
● ‘Swinging’ . The fluid in the tube should move during the respi-ratory cycle. If it is not swinging, check with the nursing staff. It could be that the tube is ready to come out, or that there is a problem with the tube. Check that the tube is not kinked or obviously blocked (by the patient sitting on it!). If not, discuss with the nursing or medical staff.
Side holes
Apical drain
Apical drain
Basal drainBasal drain
‘Y’ connector
Vent tube(open to atmosphereor connectedto suction)
Fluid level in tube(rises on inspirationand falls on expiration)
A B
Fig 3.13.1 Chest drain schematic. Underwater seal chest drainage. (A) single bottle system allowing use of one bottle via a 'Y' connector to drain fluid and air. (B) Two separate bottles enabling drainage of air from the apical drain and fluid from the basal drainReproduced with kind permission from Pryor JA, Prasad SA. 2008 Physiotherapy for Respiratory and Cardiac Problems, 4th Edn. Edinburgh, UK: Churchill Livingstone.

3.13 Chest drains 67
● ‘Bubbling’ . Occurs if there is an air leak and air bubbles are seen in the drainage bottle. It is important to note whether bubbling happens in part of the respiratory cycle or just on coughing as this gives an indication of the severity of the leak. So what should you do if it is bubbling? Is this a new occurrence or not? If this has not happened previously, you will need to highlight this to the team.
● ‘Draining’ . The volume of fluid drained needs to be measured. How is the volume measured? The volume is measured in millili-tres (ml) by looking at the graduated lines on the side of the chest drain bottle. Remember that the bottle is filled with approxi-mately 500 ml of water to create a negative suction pressure in the pleural space; therefore, 500 ml needs to be subtracted from the total amount of drainage in the bottle to determine how much fluid had drained from the pleural space – this is generally allowed for by our nursing colleagues when they chart drainage.
Pain can be an issue, and the level should be recorded in rela-tion to the respiratory cycle (the patient reports pain on deep breathing) or in relation to coughing. There should be adequate analgesia to allow the patient to move. You should also monitor the patient's arm movements, encouraging shoulder abduction (ordering a drink or waving movement), medial rotation (can they
A
B
Fig 3.13.2 Chest drain in situ post thoracotomy (A) and corresponding CXR (B). Note apical placement of drain (arrow). Reproduced with kind permission from Harden B, Cross J, Broad M, et al. 2009 Respiratory Physiotherapy: An On-call Survival Guide, 2nd Edn. Edinburgh, UK: Churchill Livingstone.

ASSESSMENT TOOLS68
touch their back as if to do up a bra!) and lateral rotation (can the patient touch the back of the head to do their hair) and consider trunk movement, as this may be compromised.
DOCUMENTATION Document how the wound site appears, whether the drain is swinging or bubbling, and the volume of fluid drained during a certain time period (often 24 hours). Document any limited range of movement of shoulder joint or trunk.
3.14 ● CHEST IMAGING (INCLUDING CHEST X-RAYS)
DEFINITION Images of the thorax used to aid diagnosis include chest X-rays (CXR), computer tomography (CT) scans, magnetic resonance imaging (MRI), ultrasound imaging and nuclear medicine. Physiotherapists may seek information regarding the outcomes of scans but are usually only involved in interpretation of CXR images, so these will be the focus of this section.
PURPOSE Imaging is normally used by medical staff to aid diagnosis; how-ever, physiotherapists often refer to this information to identify specific areas of loss of volume or collapse/consolidation that may respond to physiotherapy. Images may also be used as outcome measures for physiotherapy and may demonstrate improvements after sputum clearance or treatment to increase volume.
Chest X-rays Uses X-rays to generate an image of the thoracic anatomy. These are the mainstay of imaging in acute care. CXRs are normally taken from behind the patient (posterior to anterior (or PA) film) to reduce the shadow of the heart. In a ward or critical care environ-ment they are frequently taken from the front (anterior to posterior (or AP) film) because of limitations caused by the position of the patient. Occasionally, films are taken from the side (a lateral film).
Top tip! A chest drain should always be below the level of the chest to pre-vent siphoning of the contents back into the chest cavity!
Patients can mobilize with a chest drain in place and should be encouraged to do so – make sure the drain is held below the level of the chest!

3.14 Chest imaging (including chest X-rays) 69
In modern radiology, images are stored and viewed using a pic-ture archiving and communication system (PACS). This stores and retrieves images digitally and has the added benefit of allow-ing you to view any reports on the film.
Computer tomography This is an advanced form of X-ray scanning in which images are acquired from a 360° arc around the patient and reconstructed to give three-dimensional images of the study area. CT can be used to gain a much clearer picture of the structures within the chest. For example, prior to thoracic/lung surgery or to monitor dis-ease progression as with cystic fibrosis (CF) or bronchiectasis. CT can also be used when pulmonary emboli are suspected (CTPA – CT pulmonary angiogram). CTs require a higher dose of ionizing radiation than a CXR.
Magnetic resonance imaging This uses strong magnetic fields to give detailed three-dimensional images (i.e. no ionizing radiation is used). MRI is rarely used in respiratory investigations and is much better for body parts with higher water content (e.g. joints) as this technology relies on mag-netic fields exciting water molecules to produce an image.
Ultrasound imaging High-frequency sound waves are converted into an image using a probe over a localized area. This imaging process relies on a fluid medium to transmit the sound waves; therefore, it can be very useful to image the heart, effusions or other collections of fluid in the pleural space. Sometimes an ultrasound is used to identify where an effusion is and to mark a place on the skin to guide the doctors on where it should be drained.
Nuclear medicine This field of medicine uses a variety of radioactive isotopes with short half-lives, whose movement through the body can be detected. This can give information about physiological processes, for example ventilation/perfusion (V/Q) scans, although CTPA scans are more commonly used in preference.
PROCEDURE The procedures are performed by trained specialists, either medical staff or radiographers. A few specialist physiotherapists are involved in these procedures in both image acquisition and ordering imaging.

ASSESSMENT TOOLS70
FINDINGS The key to interpreting CXRs successfully is to take a systematic approach, otherwise you will miss something! Remember – do not view them in isolation. They are a useful diagnostic tool but do not give the whole story. Interpret the radiological evidence with the other clinical signs from your assessment and the patient's his-tory. Does the CXR match the clinical picture? Think about sur-face and the internal anatomy of the chest. Remember that this is a two-dimensional projection of a three-dimensional structure.
It is accepted practice that you view the image as if the patient were standing in front of you, so the right side of the image is the left side of the patient. To save confusion, the radiographers label the image with an ‘L’ or ‘R’ ( see Fig. 3.14.1 , which shows a PA
Fig 3.14.1 Posteroanterior film of a 29 year old woman.

3.14 Chest imaging (including chest X-rays) 71
film of a healthy 29 year old woman with some of the anatomical structures annotated). Note that the white areas represent densi-ties (e.g. the heart) whereas the blacker areas represent less dense areas (air shows as black). Table 3.14.1 highlights some simple questions to consider when reviewing a CXR.
In Fig. 3.14.2 , the same CXR of the 29 year old woman is shown. It has been marked for ease of interpretation using the system for interpretation of CXRs summarized in Table 3.14.2 . Use the suggested points while looking at the radiograph in Fig. 3.14.2 . This is just one system that can be used to go through CXRs – the key is to use the same system every time so that you do not miss anything out!
It is particularly important for the physiotherapist to be able to identify loss of volume and consolidation as these may sug-gest the need for intervention. It is also important to be aware of a pneumothorax as this may be a contraindication to treatment. Pulmonary oedema and emphysema are also important; for fur-ther details, see Further reading.
Who? Who is the film of? A simple question but it is all too easy to look at the film of the wrong patient!
What? What part of the body was radiographed? With PACS systems it is easy to bring up an image from another part of the body
When? When was the film taken? You can look at an old film and wonder why the patient looks so well! It is also good to compare previous images with the most recent film to look for changes
Where? Where was the film taken? A film taken on the ward will not be of the same quality as one taken in the department. Departmental films are taken with the shoulders protracted, thus keeping the scapula away from the lung fields
Why? Why was the film taken in the first place? There is always a good clinical reason
How? How was the film taken? AP vs PA. With an AP film the heart shadow is larger
Table 3.14.1 Questions to consider when reviewing a CXR
AP, anteroposterior; PA, posteroanterior.

ASSESSMENT TOOLS72
Fig 3.14.2 Posteroanterior film of a 29 year old woman with CXR analysis markers - see Table 3.14.2.
A Alignment and A quick look!
Is there anything obviously wrong? Is it a straight film or rotated? If the patient was not straight at the time of the radiograph, the positions of the structures will appear to have moved. To assess this, look at the proximal ends of the clavicles – they should be an equal distance from the spinous processes. If they are not, the side with the bigger gap is the side it is rotated towards
B Bones Are they all there or are there bits that should not be there at all? Look for fractures, and not just of the ribs. In trauma patients these are frequently not picked up until much later on and it may be that you are the first person to notice it. There are no fractures in Fig. 3.14.2
Table 3.14.2 A system for interpretation of CXR

3.14 Chest imaging (including chest X-rays) 73
C Cardiac Look at the heart size and borders. The heart should be one-third of the diameter of the chest, with more on the left side than the right. The heart borders or lines around the heart should be smooth. There should also be a sharp angle seen between the heart borders and the diaphragm. These are known as cardiophrenic angles
D Diaphragm Can you see both of them clearly? The costophrenic angles between the ribs and the diaphragm should be clear and sharp. If not, there may be some fluid in the pleural space. Note that the right hemidiaphragm is always higher than the left hemidiaphragm owing to the position of the liver under the right lung
E Expansion and Extrathoracic structures
Expansion is a reflection on the volume of air in the lungs. The normal level of expansion is to the 10th rib at the mid-clavicular point posteriorly or the 6th rib anteriorly. Underexpansion may mean poor lung volumes; overexpansion may be related to other pathologies, such as emphysema. Extrathoracic structures should be looked at for obvious changes or warning signs such as subcutaneous emphysema (air in the soft-tissue structures)
F Fields The lung fields are as a result of the vascular structures within the lung. As such, in an upright film there are more lung markings at the base than at the apex. These should extend to the edge of the chest wall. In pathological states, you should look for increased shadowing, decreased tissue density or absence of lung markings. You will need to be able to differentiate between collapse, consolidation, and air/fluid within the lung and outside the lung. In general, if there are areas of lung which have collapsed, the surrounding structures will shift towards that area; if there is consolidation, there will be an increase in the shadowing or ‘whiteness’ but with no shifting of structures
G Gadgets There may be a variety of drips, drains, tubes, lines, wires, orthopaedic fixtures and fittings, prosthetic valves, pacemakers. There are none in Fig. 3.14.2
Table 3.14.2 A system for interpretation of CXR—cont'd

ASSESSMENT TOOLS74
DOCUMENTATION Identify any obvious abnormality compared with the normal pre-sentation, and describe it in terms of how it differs from normal (e.g. there is an area of increased density in the right upper lobe).
FURTHER READING Corne, J., Pointon, K., 2009. Chest X-Ray Made Easy, 3rd edn.
Churchill Livingstone, Edinburgh, UK.
3.15 ● CHEST X-RAY (See under 3.14 CHEST IMAGING – page 68)
●3.16 CHEST WALL SHAPE
DEFINITION Identification of any variations of the skeletal structures of the thoracic cage, resulting in fixed or non-fixed changes that could affect respiration (e.g. the thoracic spine, ribs, sternum, clavicle and the associated joints).
PURPOSE To identify patients:
● at an increased risk of respiratory complications due to a restric-tive breathing pattern (e.g. after surgery)
● who might benefit from exercise or mobilization to improve chest wall mobility
● with severe airway obstruction where the effect on lung mechan-ics could limit their ability to breathe diaphragmatically or take part in exercise.
PROCEDURE (Any significant deformity may already be recorded in the patient's notes.)
● Observe the patient with his or her top removed (if appropri-ate) from posterior, anterior and lateral aspects, and note any of the changes described in the findings below.
FINDINGS Variations in chest wall shape are shown in Fig. 3.16.1 .
Restrictive changes ● Pes excavatum (funnel chest): the sternum is indented. ● Pes carinatum (pigeon chest): the sternum projects forwards.

3.16 Chest wall shape 75
Pigeon chestAnteriorly displaced sternum
Funnel chestDepressed lower sternum
Thoracic kyphoscoliosisRaised shoulder and scapula,thoracic convexity, and flaredinterspaces
Normal adult chest Barrel chestIncreased anteroposteriordiameter
Fig 3.16.1 Chest wall shape. Reproduced with kind permission from Lippincott, Williams and Wilkins 2004. Breath Sounds made Incredibly Easy. Springhouse Publishing Co.

ASSESSMENT TOOLS76
● Scoliosis: the thoracic spine is curved laterally and rotated. ● Kyphosis: the thoracic spine is curved anteroposteriorly. ● Stiff, immobile ribs due to osteoarthritis, osteoporosis or previ-
ous rib fractures. ● Thoracoplasty – rib resection.
This can result in a reduced inspiratory capacity (inspiratory reserve) and predispose to ‘low lung volumes’, causing a restric-tive pattern. This may result in a reduction in maximum voluntary ventilation, which in turn will lower potential exercise tolerance. These deformities may also increase the work of breathing.
These factors predispose the patient to atelectasis and possibly respiratory failure and fatigue (particularly if the patient is facing additional respiratory compromise, such as pneumonia or because of abdominal or thoracic surgery).
Obstructive changes Severe airway obstruction (e.g. severe COPD or CF) can lead to gas trapping and hyperinflated lungs that give rise to a barrel chest appearance. The chest appears deeper from front to back than normal and becomes more rounded. This is because the ribs are permanently elevated, even during expiration. Since the patient cannot lift the ribs very much further on inspiration (loss of bucket handle mechanism), they use their neck muscles to lift the clavicle and the whole thoracic cage in order to breathe in. They will have elevated clavicles and scapulae and a protracted shoulder girdle as a result of needing to use accessory muscles of inspiration.
Severe mechanical changes associated with obstruction will result in a flattened diaphragm that cannot descend much further. Therefore, teaching the patient diaphragmatic breathing would be inappropri-ate. Patients may need to fix their arms in front of the thorax in order to use their serratus anterior and pectoral muscles to help lift the tho-rax forwards in order to inspire, e.g. forward lean sitting.
DOCUMENTATION State any observed variation in chest wall shape using above termi-nology under observation.
Top tip! These patients are working at a mechanical disadvantage. Therefore, when they are unwell, they have a limited respiratory reserve and so may deteriorate very quickly. They should be considered as at high risk of deterioration!

3.17 (Digital) Clubbing 77
●3.17 (DIGITAL) CLUBBING
DEFINITION Digital clubbing might be a sign of underlying or chronic lung disease. It is a deformity of the nail bed of fingers and toes asso-ciated primarily with cardiac, gastrointestinal or respiratory disease.
PURPOSE To identify patients with underlying respiratory or cardiac dis-ease with significant hypoxia. The exact mechanism of developing clubbing is unclear; however, it is thought to be as a result of cap-illary proliferation. Digital clubbing usually occurs as a result of respiratory, cardiac or gut disease and occasionally can occur with no underlying pathology ( Table 3.17.1 ).
PROCEDURE An examination of the hands and nail beds will identify clubbing.
FINDINGS Figure 3.17.1 demonstrates digital clubbing of a 24 year old man with CF compared with the finger of the author. Note the bul-bous end of the patient's finger and loss of the acute angle in the nail bed.
DOCUMENTATION Note the presence of clubbing within the observations section of your assessment.
Respiratory Cardiac Gut Other
Primary lung cancer Lung abscess Bronchiectasis and cystic fibrosis Fibrotic lung disease
Infective endocarditis Chronic cardiac failure Congenital heart disease
Ulcerative colitis Crohn's disease Liver cirrhosis
Acromegaly Hereditary
Table 3.17.1 Some causes of digital clubbing

ASSESSMENT TOOLS78
●3.18 CONSENT
DEFINITION The provision of approval or assent, particularly and especially after thoughtful consideration (Oxford English Dictionary). Remember that, for an adult, it is only the person themselves or a designated person (advocate) in the absence of the individual's capacity who can consent for treatment.
PURPOSE To allow a patient to consider relevant information to decide whether they want to be assessed or treated. If we treat with-out consent we could be accused of battery/assault. Some of our patients will not be able to consent; this may be because they are unconscious, are not able to communicate or lack capacity. In this instance, we are able to treat in their best interests.
DOCUMENTATION All consent issues and how consent is obtained should be docu-mented clearly at the start of any new intervention or treatment; some examples of how this may be done include:
● patient nodded/mouthed/verbally consented to assessment and treatment
Fig 3.17.1 Digital clubbing (top) as compared with normal.

3.19 Cough assessment 79
● patient advocate consented to assessment and treatment ● patient unable to consent; therefore, assess and treat in best
interests.
It is not appropriate to use abbreviations such as ‘VCG’ (verbal consent given) or ticks to document consent as this is inappropriate use of abbreviations and ticks do not give any indication as to how consent was obtained.
●3.19 COUGH ASSESSMENT
DEFINITION Assessment of the factors affecting cough effectiveness and/or any problems associated with coughing (e.g. weakness, bronchospasm).
PURPOSE ● To determine whether cough is sufficient to maintain effective
sputum clearance and identify factors adversely affecting cough effectiveness. Used to identify the most appropriate clearance intervention(s).
● To identify situations of excessive non-productive coughing that may respond to cough suppression (e.g. breathing control practice to reduce coughing).
● To identify problems associated with coughing that may be affecting the patient's health or quality of life.
PROCEDURE Cough effectiveness
If your patient has signs/symptoms of sputum retention (e.g. crack-les) you need to assess their ability to cough (directed cough):
● sit the patient up/forward and ask them to take a deep breath in first and then to cough as hard as they can.
Cough suppression If the patient complains of frequent coughing but does not pro-duce any sputum and there are no signs of sputum retention, assess their breathing pattern to determine whether there are any signs of hyperventilation, anxiety or excessive mouth breathing. The patient may benefit from breathing control or relaxation and practising cough suppression.
Chronic cough Carry out subjective questioning to identify any problems associ-ated with frequent coughing such as fatigue, anxiety, embarrass-ment, social situations in which coughing is a problem, lack of

ASSESSMENT TOOLS80
sleep, abdominal muscle strain, retching, fainting, or coughing fits which are difficult to control. Of note is that stress incontinence is common in chronic coughers.
● Use a questionnaire such as the Leicester cough questionnaire (LOC) in order to explore or quantify this further.
FINDINGS Potential factors affecting cough effectiveness:
● Can the patient take a deep breath in? ● Any inspiratory muscle weakness? ● Chest wall deformity or lack of mobility? ● Did you hear the glottis close, then open suddenly at the begin-
ning of cough (the harsh sound that characterizes a cough) or did it sound more like a forced expiratory manoeuvre?
● Any pain that might be affecting cough? If so, consider pain control, or supported coughing if there is a wound or incision.
● Any wheezing? Patient may have airway obstruction affecting expiration – do they need bronchodilators?
● Does the patient have a condition which might cause weakness of the expiratory muscles? If so, could this respond to strength-ening exercises or does the patient need some support such as manually assisted cough or the cough assist machine?
● Peak cough flow. The peak expiratory flow rate during cough gives an overall evaluation of cough efficiency; values below 160–270 l/min suggest poor airway clearance. A value of less than 160 l/min is not sufficient to clear secretions indepen-dently. It can be measured by coughing into a peak flow meter.
● Is the patient's airway at risk? (Loss of bulbar function; see 3.60 Swallow assessment.)
● Is the patient unable to cough in response to direction? Are there any neurological reasons for inhibited cough reflex or lack of sensitivity in the airways? Has the patient lost other protective reflexes such as the gag reflex, swallow reflex or the expiratory reflex? These reflexes are controlled by the medulla oblongata and are referred to collectively as ‘bulbar function’.
DOCUMENTATION Record observations and the patient's response to any attempted intervention.
Top tip! A problem with bulbar function may need urgent attention such as the recovery position, airway insertion or suction, so highlight to senior immediately.
3.20 Cyanosis 81
FURTHER READING Morice, A.H., Fontana, G.A., Belvisi, M.G., et al, 2007. ERS guide-
lines on the assessment of cough. Eur. Respir. J. 29, 1256–76. University Hospitals of Leicester NHS Trust, 2001. Leicester Cough
Questionnaire. Glenfield Hospital, Leicester, UK.
●3.20 CYANOSIS
DEFINITION A bluish discoloration of the skin and/or the mucous mem-branes that is caused by lack of oxygen in the blood and local tissues:
● Central cyanosis appears around the mouth, tongue and lips. ● Peripheral cyanosis: only the peripheries are affected (especially
fingers, fingernails, toes and toenails).
PURPOSE Central cyanosis may indicate significant respiratory or cardiac failure, which is potentially life-threatening, requiring immediate respiratory or circulatory support (see Findings below).
PROCEDURE Cyanosis can be observed directly through observation of the lips, tongue and fingers in good light.
FINDINGS ● Cyanosis of recent onset should be immediately reported to the
medical team. ● Cyanosis shows best on those with good levels of Hb. It is less
visible in patients with anaemia. ● Cyanosis is usually only visible when 5 g Hb per 100 ml
blood is deoxygenated. For most people in an acute situa-tion, this would suggest a severe lack of oxygen and the need for immediate intervention (e.g. airway management, CPR, ventilation).
● People with severe chronic respiratory disease are more likely to show signs of cyanosis (at higher S p O 2 ) because they may have more Hb (because of polycythaemia). Additionally, their oxy-gen content may actually be acceptable despite low S p O 2 ; this is the result of increased Hb, which enables more oxygen to be carried, so it is important to find out whether this is ‘usual’ for them before responding.
● Note that cyanosis is more difficult to see in Afro-Caribbean and Asian patients because of darker skin tone.

ASSESSMENT TOOLS82
DOCUMENTATION Record date and time, whether cyanosis is central and/or periph-eral, on room air or oxygen therapy, the method of oxygen deliv-ery and the percentage of any oxygen given.
●3.21 DERMATOMES
DEFINITION A dermatome is an area of skin with sensory innervation by one main spinal nerve root ( Fig. 3.21.1 ).
C2
Upper lateral cutaneousnerve of arm
Medial cutaneous nerve of arm
Medial cutaneousnerve of forearmLateral cutaneousnerve of forearm
Lateral cutaneous nerve of thigh
Medial and intermediate cutaneousnerves of thigh
Lateral cutaneous nerve of leg
Saphenous nerve
Sural nerveSuperficial peroneal(musculocutaneous nerve)
Deep peroneal nerve
Posterior cutaneousnerve of thigh
Obturator nerve
Radial nerve
Medial nerve
Ulnar nerveIlioinguinal nerve
Lower lateralcutaneousnerve of arm
Posteriorcutaneous
nerve of arm
Ophthalmicnerve
Trigeminalnerve
Maxillarynerve
Mandibularnerve C4
C3
T3T4T5T6
T12T11T10T9T8T7
T2T1
C5
L2
L3
L4
L5
S1
L1
S3S4
T4
T6T8T10
T12L1L2
T2T1
C7
L5
L3
L3L4
L4
L5
S2
S2S1
C2
C4C3
C5C6C7
C6C8
T3T5
T7
T9T11
C8
Fig 3.21.1 Dermatome chart. n., nerve. Reproduced with kind permission from Crossman AR, Neary D. 2002 Neuroanatomy: An Illustrated Colour Text, 2nd Edn. Edinburgh, UK: Churchill Livingstone.

3.21 Dermatomes 83
PURPOSE Knowing which nerve supplies an area of skin can be used to ascer-tain the level of injury or deficit. It should be noted that there is some overlap between dermatomes. Dermatome assessment is often carried out alongside assessment of myotomes and muscle charting (see 3.42 Myotomes and 3.41 Muscle charting).
Dermatomes can also be used to assess the level of analgesia, e.g. with an epidural.
PROCEDURE ● Make sure any clothing that may restrict the assessment is
removed (remember to maintain dignity of the patient). ● Using your hand, or a cotton wool ball, touch an area of skin that
is unaffected to make sure the patient can feel this sensation. ● Ask the patient to close his or her eyes. ● Working from the top of the body down, stroke over different
dermatomes and ask the patient to report changes in sensa-tion. Make sure to compare left and right as deficits may be unilateral!
For the assessment of analgesia via epidural block, an ice pack rather than cotton wool is commonly used to assess the level at which the block is working.
Light touch and pinprick can also be assessed for differentiation between sensations (i.e. sharp and dull). This is commonly used in neurological assessment.
FINDINGS If an area is not innervated (e.g. no sensation) it may need to be protected from damage caused by lack of pain/temperature receptors.
It may be necessary to re-chart dermatomes on several occa-sions to assess improvement or deterioration in the level of sensa-tion. This is particularly relevant in the management of early spinal injury in which ‘spinal shock’ (i.e. inflammatory response in the spinal cord) may cause a higher level of deficit than the original injury level. This needs to be closely monitored.
DOCUMENTATION Document at which level the patient can detect altered sensation (and which sensation you tested, e.g. sharp/dull/light touch) as per the dermatome chart ( Fig. 3.21.1 ), e.g. ‘Sensation to light touch present above T6 level’.

ASSESSMENT TOOLS84
FURTHER READING Day, R., Fox, J., Paul-Taylor, G., 2009. Neuro-musculoskeletal Clinical
Testing: A Clinician's Guide. Churchill Livingstone, Edinburgh, UK.
●3.22 DRUGS
DEFINITION Physiotherapy assessment should include a list of the medications the patient is currently taking, how frequently they are taken and their drug history (DH) if appropriate.
PURPOSE A clear understanding of the medication a patient is taking is invaluable, as this may highlight additional points from the patient's past medical history that have not been identified. Sometimes, we need to ensure that patients have taken medica-tions prior to physiotherapy treatment (e.g. pain relief or bron-chodilators), whereas on other occasions certain medication may contraindicate physiotherapy treatments (e.g. patients on long-term steroids may not be able to tolerate chest wall percussion). Physiotherapists also need to be aware of possible side-effects of some medications in order to report any observations to the medical team. Remember that certain drugs can limit the inter-ventions a therapist can use; therefore, a working knowledge of common drugs is important.
PROCEDURE There are a number of sources to obtain a DH. Most of this will come from the notes, drug charts, letters or a discussion with patients or family. Most physiotherapists are not involved in the prescription of drugs.
FINDINGS Tables 3.22.1–3.22.6 display some of the common classifications of medications patients may take. This is by no means comprehen-sive, and the reader is directed to other sources (such as a BNF (British National Formulary)) for more comprehensive informa-tion. Note that, if you come across a drug that is unfamiliar to you, you should ensure that you have an understanding of both what it is intended to treat and the implications for physiotherapy. The pharmacy team are an excellent resource if you cannot find what a drug is or why it is being used.

3.22 Drugs 85
Table 3.22.1 Common respiratory medications
Key drugsImplication for physiotherapy
Oxygen Oxygen should be viewed as a drug and as such be prescribed
High-dose oxygen in normal individuals over time can cause airway irritation (note that any patient who requires high-dose oxygen is very ill). There is a small population of patients with COPD who rely on hypoxic drive, and if given too much oxygen will stop breathing. However, treatment should not be denied to patients who will benefit from this vital treatment Physiotherapists should monitor saturation levels during treatment, particularly movement and exercise. It may be acceptable to increase or decrease oxygen flow in certain situations – check with your supervisor regarding your local policy
Bronchodilators (see examples below): may be delivered by inhaler or nebulizer
May need to be taken prior to chest clearance procedures or before exercise if the patient is ‘tight’ or ‘wheezy’ Can be used to relieve breathlessness in an emergency Check inhaler technique
β 2 -agonist Salbutamol, terbutaline (short acting) Salmeterol (Serevent), formoterol (Oxis) (long acting)
Can cause increased heart rate and tremors
(Continued)

ASSESSMENT TOOLS86
Table 3.22.2 Common cardiac medications
While these have been placed in broad categories, these agents can affect several aspects of cardiovascular physiology
Key drugsImplication for physiotherapy
Inotropes (increase myocardial contractility)
Adrenaline (epinephrine) Noradrenaline (norepinephrine) Dopamine Dobutamine
Patients on inotropes are cardiovascularly unstable and need careful handling Monitor BP when treating
Key drugsImplication for physiotherapy
Anticholinergic Ipratropium bromide (Atrovent) (short acting) Tiotropium (long acting)
Can cause a dry mouth, which may make airway clearance more difficult
Xanthines (bronchodilators with some anti-inflammatory effect)
Theophylline Aminophylline Phyllocontin
Can cause increased heart rate
Steroids (inhaled); steroids may also be oral (see Table 3.22.6 )
Beclometasone Fluticasone Budesonide
High-dose inhaled steroids have been associated with oral fungal infections. Encourage the patient to rinse their mouth after taking the drug
Mucolytics Carbocystine Dornase Alfa (DNAse) Hypertonic saline
Reduces viscosity of secretions and aids airway clearance Carbocystine can cause GI bleeding Hypertonic saline can increase bronchospasm
COPD, chronic obstructive pulmonary disease; GI, gastrointestinal.
Table 3.22.1 Common respiratory medications—cont'd

3.22 Drugs 87
Anti-arrhythmia drugs (also known as anti-arrhythmics)
Digoxin Amiodarone Adenosine
Be aware of an abnormal cardiac rhythm and seek help of senior staff if you are unsure whether the patient's clinical picture has changed
Beta ( β )-blockers (reduce rate and strength of heart beat)
Atenolol Labetolol
Patients may not be able to respond to increased workload; thus, you may not be able to use HR as a guide to exercise prescription. Consider using RPE as well
Vasodilators (increase coronary blood flow and control angina)
GTN Caution if mobilizing the patient for the first time; if the patient complains of chest pain or breathlessness, seek senior support immediately! Ensure patients have GTN handy when exercising if it is prescribed
Calcium channel blockers (reduce myocardial contractility and BP)
Diltiazem Lidoflaxine Nifedipine Verapamil
Caution if mobilizing for the first time as BP may drop – be aware of resting BP; you may need to repeat BP measurement during your intervention
Diuretics (increase urine production and can reduce BP)
Bendrofluazide Furosemide (Frusemide) Bumetanide Spironolactone
Increase the need to go to the toilet and can induce muscle cramps
Antihypertensive drugs Captopril Enalapril Adalat
If a patient is on this medication, note that they have a history of increased blood pressure
BP, blood pressure; GTN, glyceryl trinitrate; HR, heart rate; RPE, rating of perceived exertion.
Table 3.22.2 Common cardiac medications—cont'd

ASSESSMENT TOOLS88
Key drugs Implication for physiotherapy
Penicillins Benzylpenicillin Flucloxacillin Amoxicillin
Any patient who is on antibiotics will have an infection and is likely to feel unwell. Side-effects of many of these antibiotics include nausea, vomiting and diarrhoea. It is important to adhere to infection control principles Note: some antibiotics (e.g. in CF/bronchiectasis) may be nebulized and should be taken after airway clearance techniques
Cephalosporins Cefaclor Cefetaxime
Tetracyclines Tetracycline Doxycycline
Aminoglycosides Gentamicin
Table 3.22.3 Common antibiotics
The route of delivery is varied and can include inhaled, oral, intramuscular (i.m.) and intravenous (i.v.) routes and as a suppository. Care should be taken when mobilizing patients with epidurals in situ (in place) as they can become hypotensive (low BP) and may have altered motor control of their legs.
Key drugs Implication for physiotherapy
Paracetamol Risk of liver toxicity, and is often contained in other preparations
NSAIDs Ibuprofen Voltarol
Can cause irritation of the gut and cause GI bleeding. Some asthmatic patients are allergic to this group of drugs
Opiates Morphine Diamorphine Codeine
Can depress the respiratory drive if the dose is too high. Pinpoint pupils may indicate that the patient has had a large dose of opiates
Table 3.22.4 Analgesic medications
GI, gastrointestinal; NSAID, non-steroidal anti-inflammatory drug.
Key drugs Implication for physiotherapy
Sedation agents
Midazolam Propofol Fentanyl
The patient may vary from being awake and settled to not being able to respond to you
Paralysing agents
Vecuronium Pancuronium Atracurium
BE AWARE! The patient can make no muscular effort at all, so if removed from the ventilator the patient will stop breathing. As patients are paralysed, they will not be able to cough on suction
Table 3.22.5 Intensive therapy unit drugs

3.22 Drugs 89
Key drugs Implication for physiotherapy
Anti coagulants (blood thinners)
Heparin Warfarin Aspirin Clexane
There is an increased risk of bleeding, so care needs to be taken and some procedures considered with extreme caution, e.g. nasopharyngeal suction. Check the patient's clotting screen! (see 3.6 Blood results)
Insulins Actrapid Humulin Mixtard Gliclazide
If your patient is on insulin, it is good practice to ensure that blood sugars are stable prior to mobilizing. If the patient's blood sugars are poorly controlled they may become unresponsive
Immunosuppressant Cyclosporin As the immune system is suppressed, this leaves the patient more open to contracting infections
Steroids (oral/i.v.) Prednisolone Dexamethasone Hydrocortisone
Long-term use can lead to diabetes, osteoporosis and a degree of immunosuppression Take care with manual clearance techniques if affected
Anti-epileptics Carbamazepine Phenytoin Valproate
Be aware that the patient may have a history of fitting
Table 3.22.6 Other common drugs
The majority of physiotherapists are non-prescribing. When a drug is prescribed, the prescription will state the drug, the dose, the route (i.v., oral, etc.), the frequency (as required (prn) or at set intervals) and the duration of the course (how many days). The person prescribing the drug should clearly sign the chart and ide-ally leave contact details.
The route is important as this implies different severities of the disease and the care required. For example, drugs delivered via an infusion imply that the patient is unwell (hence the need for an intravenous line) and care should be taken over the line deliver-ing the drug.

ASSESSMENT TOOLS90
DOCUMENTATION The medications a patient is taking should be marked in the DH of your assessment, and any cautions/contraindications to physio-therapy intervention arising from the patient's medications should be noted clearly.
FURTHER READING The BNF is updated regularly, so look for the latest version as a hard copy or go to http://bnf.org
●3.23 EARLY WARNING SCORES (EWS)
DEFINITION Simple scoring systems based on physiological measurements to assist staff to recognize and respond to the acutely unwell patient in hospi-tal. Parameters measured can include HR, BP, RR, S p O 2 and AVPU.
PURPOSE There are a large number of different early warning score (EWS) systems that are used, but all take physiological parameters and put a score to them. These scores can then be used to grade the severity of illness, identifying patients who need preventative treatment or should be moved to a higher dependency area ( Table 3.23.1 ). For the purpose of this section we will use the modified early warning score (MEWS). See 3.61 TPR for a completed TPR chart example.
PROCEDURE The normal observations are taken and then scored according to Table 3.23.1 . The overall score is then calculated and action is taken based on the score recorded (see below).
FINDINGS The key point is to look for a change in the score. A MEWS score which has changed by 3 or more would merit some form of action.
● Low score (1–3): increased frequency of observations. ● Medium score (3–6): urgent call to the team caring for the
patient for a review. ● High score (>6): emergency medical treatment.
Even if your patient does not meet the ‘trigger’ score for review but you are concerned about them, this does not mean you can-not seek additional review.

3.23 Early warning scores (EWS) 91
3
21
01
23
Syst
olic
BP
(mm
Hg
)<
7071
–80
81–1
0010
1–19
9
≥200
Hea
rt r
ate
(bea
ts p
er m
inu
te)
<
4041
–50
51–1
0010
1–11
011
1–12
9≥1
30
Res
pir
ato
ry r
ate
(bre
ath
s p
er m
inu
te)
<
9
9–14
15–2
021
–29
≥30
Tem
per
atu
re (
°C)
<
35
35–3
8.4
≥3
8.5
AV
PU s
core
Ale
rtR
eact
ing
to
Vo
ice
Rea
ctin
g t
o P
ain
Un
resp
on
sive
Tab
le 3
.23.
1 Th
e o
rig
inal
mo
dif
ied
ear
ly w
arn
ing
sco
re
Rep
rod
uce
d w
ith
kin
d p
erm
issi
on
fro
m S
ub
be
et a
l (20
01).

ASSESSMENT TOOLS92
DOCUMENTATION A postoperative patient currently has a blood pressure of 82/60 (score 1), with a pulse of 135 (score 3), a RR of 24 (score 2), a temperature of 39°C (score 2). This would be documented as a MEWS score of 8 (i.e. requiring an urgent medical review).
FURTHER READING National Institute for Health and Clinical Excellence, 2007. Acutely
Ill Patients in Hospital. Clinical Guideline 50. NICE, London, UK. Available at: www.nice.org.uk/Guidance/GC50
Subbe, C.P., Kruger, M., Rutherford, P., Gemmel, L., 2001. Validation of a modified early warning score in medical admissions. Q. J. Med. 94, 521–6.
●3.24 ELECTROCARDIOGRAM (ECG) (See under 3.35 HEART RHYTHMS – page 109)
●3.25 ELECTROLYTES (See under 3.6 BLOOD RESULTS – page 49)
●3.26 END-TIDAL CARBON DIOXIDE (ETCO 2 )
DEFINITION Non-invasive measurement of carbon dioxide levels by sampling the air at the end of expiration, which ‘approximates’ the partial pressure of carbon dioxide in arterial blood ( P a CO 2 ). The device may be attached to an endotracheal tube (ETT) (with intubated patients) or can be positioned at the nose or mouth to sample expired air with non-intubated patients. Machines may incorporate a capnograph (a device that measure CO 2 ; Fig. 3.26.1 ), which also displays the flow waveform on a screen and allows more accu-rate interpretation of the end-tidal carbon dioxide (ET CO 2 ) lev-els. The device also measures respiratory rate (RR) and gives a continuous measurement that may be used to detect slow or fast breathing ( Fig. 3.26.2 ).
PURPOSE ● The main use is as a monitor with ventilated patients on ITU
to highlight any problems with the ventilator settings and set-up. Often used after intubation to ensure that the endotracheal tube is positioned correctly.

933.26 End-tidal carbon dioxide (ETCO2)
Fig 3.26.1 Capnometry with self-ventilating patient. Reproduced with kind permission from Al-Shaikh B, Stacey S. 2007 Essentials of Anaesthetic Equipment, 3rd Edn. Edinburgh, UK: Churchill Livingstone.
Fig 3.26.2 Capnometry on ITU. Reproduced with kind permission from Al-Shaikh B, Stacey S. 2007 Essentials of Anaesthetic Equipment, 3rd Edn. Edinburgh, UK: Churchill Livingstone.

ASSESSMENT TOOLS94
● In self-ventilating patients, it can be used to detect and give feedback on lowered CO 2 levels for patients who are hyperven-tilating (overbreathing).
PROCEDURE ● Measurement of ET CO 2 in ITU is normally a nursing procedure. ● Physiotherapists may use the following procedure to measure
ET CO 2 when working with self-ventilating patients with dys-functional breathing syndrome: – use a new sterile nasal prong for each patient – position (or ask patient to place) the probe in one nostril –
near the end of the nose – encourage the patient to breathe normally and wait until
ET CO 2 levels ‘settle’ and the RR is shown – this equipment is for single patient use; therefore, either clean
and store for use again with the same patient or discard.
FINDINGS ● Normal values for ET CO 2 are between 4.5 and 6 kPa, 35 and 45
mmHg, or 4% and 6% if measured as a percentage of the air. ● ET CO 2 is usually about 2–5 mmHg less than P a CO 2 , which
gives a reasonable approximation of P a CO 2 ; however, this close relationship is altered with: – ventilation/perfusion (V/Q) mismatch – common with
respiratory disease – circulatory instability (e.g. pulmonary embolism, cardiac
dysrhythmia) – unstable body temperature.
● With ventilated patients it is particularly important to consider the shape of the waveform trace when interpreting ET CO 2 measure-ments, as an abnormal tracing (that does not resemble Fig. 3.26.3 ) may be associated with inaccurate reflection of P a CO 2 .
● It is important to consider trends rather than one-off measure-ments, and to interpret the findings with caution, taking into account the other assessment findings as well.
● A trend towards increasing ET CO 2 (above 6 kPa or 45 mmHg) suggests hypoventilation (possibly related to secretion reten-tion or exhaustion).
● A trend towards reducing ET CO 2 (below 4.5 kPa or 35 mmHg) may occur for a number of reasons with ventilated

953.27 Exercise (aerobic fitness) testing
patients (such as a leak in the cuff around the ETT, or ventila-tor disconnection), but with free-breathing patients it indicates hyperventilation (overbreathing).
DOCUMENTATION Record the position of the patient and ET CO 2 reading in kPa or mmHg depending on your local policy. Add any information about activity levels, inspired oxygen levels, any ventilatory support or any factors affecting the patient at the time of measurement.
3.27 ● EXERCISE (AEROBIC FITNESS) TESTING
DEFINITION Planned, controlled and supervised exercise protocols (usually involving walking, running, cycling or stepping) aimed at iden-tifying maximum (or peak) aerobic exercise capacity and/or to observe physiological responses to specified exercise intensities.
PURPOSE ● For exercise prescription, results may be used to calculate a safe
and appropriate intensity for exercise training programmes such as pulmonary or cardiac rehabilitation.
● For an ambulatory oxygen assessment (compared with and without ambulatory oxygen).
A
38
0B E
C
DC
O2 (m
mH
g)
Fig 3.26.3 Capnograph: normal waveform. Shows normal end-tidal carbon dioxide level. (A–B) Dead space (CO 2 -free gas); (B–C) mixed dead space and alveolar gas; (C–D) mostly alveolar gas; (D) end-tidal CO 2 ; (D–E) inhaled gas (CO 2 -free gas). Reproduced with kind permission from Pryor JA, Prasad SA. 2008 Physiotherapy for Respiratory and Cardiac Problems, 4th Edn. Edinburgh, UK: Churchill Livingstone.

ASSESSMENT TOOLS96
● As a goal or target to help motivate patients. ● As an outcome measure to test the effects of treatments and
interventions. ● Diagnosis and evaluation of disease.
PROCEDURE There are a number of validated exercise protocols – select the protocol that is most appropriate for the patient:
Cardiopulmonary exercise test (CPET) This is a laboratory-based treadmill or cycle ergometer test with a specific protocol and direct measurement of oxygen uptake until the maximum level ( V O 2 max) is achieved. It is commonly used for ‘exercise stress tests’ to aid diagnosis and management of car-diac patients. This test requires trained staff with current advanced life support certification, and equipment such as a gas analyser, ECG, blood pressure and lactate monitoring, and full resuscita-tion equipment including a defibrillator. The Bruce protocol is commonly used for the treadmill test ( Fig. 3.27.1 ) - see Further reading.
Field tests These tests can be carried out in hospital and gym environments. They do not directly measure expired air, and do not monitor the patient as extensively as the cardiopulmonary exercise tests. (These tests do not measure V O 2 max directly but they may be used to predict V O 2 peak.) They are often more functional and better related to activities of daily living than a laboratory-based test.
Exercise tests may be classified under the following headings (e.g. the incremental shuttle walking test may be classified as an externally paced, incremental, maximal test). Externally paced or self-paced ● Externally paced tests usually use a pre-recorded signal that the
patient has to keep pace with (e.g. shuttle walking tests, Chester step test; Fig. 3.27.2 ).
● Self-paced tests allow the patient to maintain the fastest speed that they can for the duration of the test, e.g. 6 or 12 minute walk test, 6 or 12 minute step test.
Incremental or constant speed ● Incremental tests start at a slow pace and incorporate progressive
‘stages’ in which the speed is increased at specified levels (e.g. incremental shuttle walking test, Chester step test; Fig. 3.27.3 ).

3.27 Exercise (aerobic fitness) testing 97
● Constant speed tests can be used when testing endurance and for submaximal testing (e.g. endurance shuttle walking test).
Maximal or submaximal: Most tests are ‘maximal’ in that they require the patient to keep going until they cannot go any faster. They, therefore, aim to find the patient's ‘peak’ intensity of exer-cise. Submaximal tests, however, look at the patient's responses to a period of relatively low-intensity exercise that may then be used to ‘predict’ that person's peak intensity using a specified formula.
Before an exercise test ● Risk/safety assessment – health screening.
Ensure no contraindications – the following health checks should be made:
– Recent infection: maximum exercise should not be under-taken if the patient has had any recent infection (within the past 2 weeks).
– Cardiovascular risk: patients with a high risk of cardiovas-cular disease, recent heart attack or stroke (within 6 weeks)
Fig 3.27.1 Cardiopulmonary exercise test in the laboratory. Reproduced with kind permission from Albouaini K, Egred M, Alahmar A, et al. 2007 Cardiopulmonary exercise testing and its application. Postgraduate Medical Journal 83: 675–82.

ASSESSMENT TOOLS98
should be referred to an appropriate medical practitioner for assessment prior to any exercise testing.
– Blood pressure: resting BP should be between 60 and 90 mmHg (diastolic) and 100 and 140 mmHg (systolic) and be ‘normal’ for the patient; if not, further investigations should be carried out to ensure that the patient is safe to exercise.
– Recent injury: any recent musculoskeletal injury (within 6 weeks) must be investigated and cleared prior to exercise testing.
– Adverse symptoms: any pain, dizziness, fainting, incoordina-tion, or any other symptoms or concerns should be investi-gated to ensure that the patient is safe to exercise.
– Recent intensive exercise: people should not work maximally if they have carried out intensive exercise in the past 24 hours.
Fig 3.27.2 Shuttle walking test. Fig 3.27.3 Step test.

3.27 Exercise (aerobic fitness) testing 99
– Diabetes: ensure this is well controlled. For insulin- dependent diabetics, ensure that the timing of exercise is suitable and a sugary snack is available if needed. Discuss symptom recogni-tion and response with the patient and ensure that you know how to respond if the patient becomes hypoglycaemic during exercise.
● Check environmental factors: – Floor must be dry and clear – any equipment, e.g. step or
bike, must be tested for safety. – Check clothing for suitable shoes, ensure shoelaces are tied,
secure any loose clothing that could cause the patient to trip. – Familiarize yourself with crash/first aid procedures and ensure
you have access to a telephone, first aid box and also a crash team and crash trolley if working with high-risk patients.
– The patient should not have eaten a meal or drunk any caf-feine or alcohol for 2 hours prior to the test.
– Record the temperature of the room and ensure that it is comfortable for exercise.
– Ensure that drinking water is available. – Provide seating near to the test area in case the patient sud-
denly needs to rest. – Warn the patient to stop if they experience any pain, discomfort
or dizziness and inform him/her of the risk of muscle aching (delayed-onset muscle soreness) for the following couple of days.
Pre-test measurements Take and record resting levels for the following as appropriate:
● HR ● BP ● RR ● breathlessness score (e.g. Borg) ● oxygen saturations ( S p O 2 ) ● any oxygen requirements.
During the test For each ‘stage’ of the test (or every 1–2 minutes):
● Note exercise achieved (e.g. protocol stage reached, number of steps, number of lengths).
● Monitor HR and S p O 2 if using portable monitors (e.g. HR monitor, oximeter).
● Monitor carefully for any signs of dizziness, loss of coordina-tion, pain or anxiety; stop the test and investigate if you observe these signs.

ASSESSMENT TOOLS100
● Encourage and give feedback to the patient regarding his/her progress.
● Remind the patient that he/she can stop if needed (e.g. if any of the previously discussed symptoms arise).
After the test ● Warm down for 5 minutes at a slower speed or allow the patient
to sit and rest, as appropriate. ● Take post-test levels for the following as appropriate:
– HR – BP – RR – breathlessness score (e.g. BORG) – S p O 2 – rating of perceived exertion (RPE) score.
● Identify any reasons for stopping, any limitations or symptoms experienced during the test.
● Offer the patient a drink of water. ● Ensure that the patient has returned to within five beats of resting
HR and has no adverse symptoms before they leave the test area. ● Inform the patient of follow up – who to contact if they have
any problems or pain following the test.
FINDINGS ● Calculate V O 2 peak. This is an estimate of the maximum oxygen
uptake achieved when working at the highest stage or level of the test. It can be estimated by using the tables provided with the pro-tocol or by using a standard formula for the type of exercise under-taken (see American College of Sports Medicine guidelines).
● Exercise intensity for further training can be prescribed at 50–85% of V O 2 peak as appropriate.
● Use HR response and Borg breathless score or RPE to con-sider how close the patient came to his/her ‘maximum’ exercise capacity during the test (see 3.8 Breathlessness (dyspnoea) scales and 3.51 Rating of perceived exertion).
● Follow-up any problems, limitations or symptoms identified during the test with the appropriate practitioner.
DOCUMENTATION Record any pre-test health screen findings, safety warnings and patient consent, pre- and post-test measurements, type of test car-ried out, stage or level achieved, HR and S p O 2 response for each stage, reasons for stopping and any symptoms or problems expe-rienced, describe any warm-up or warm-down. Recovery time to resting HR should also be noted.

3.28 Exercise tolerance 101
FURTHER READING American College of Sports Medicine, 2007. Physical Activity and Public
Health Guidelines for Healthy Adults. ACSM, Indianapolis, IN. American College of Sports Medicine, 2007. Physical Activity and Public
Health Guidelines for Older Adults. ACSM, Indianapolis, IN. Bruce, R., 1963. Bruce Protocol. Available at: http://www.brianmac.
co.uk/bruce.htm Sykes, K., 1998. Chester Step Test. Chester College of Higher
Education, Chester, UK. Available at: http://www.topendsports.com/testing/history-sykes.htm .
University Hospitals of Leicester NHS Trust, Incremental shuttle walk-ing test and endurance shuttle walking test. Available at: Pulmonary Rehabilitation Department, University Hospitals of Leicester NHS Trust, Glenfield Hospital, Groby Road, Leicester LE3 9QP, UK.
●3.28 EXERCISE TOLERANCE
DEFINITION Exercise tolerance can be defined as an individual's capacity to exercise.
This could be:
● Self reported: the patient is asked how long he/she could con-tinue with exercise before becoming fatigued (endurance).
● Measured: the maximum workload achieved during an exercise test (see 3.27 Exercise (aerobic fitness) testing).
PURPOSE Self-reported exercise tolerance gives a quick indication of any improve-ment or deterioration in the patient's condition over time and can be used to identify those patients in need of exercise interventions and/or social support. It can be taken into account when mobilizing patients or making decisions regarding suitability for discharge but is not as accurate or reliable as the results from a well-conducted exercise test.
PROCEDURE ● Ask the patient to give a subjective assessment of his/her exer-
cise tolerance, e.g. ‘How far are you usually able to walk before becoming too tired to go any further?’ or ‘How many steps can you usually climb before becoming too tired to go any further?’
● Specify whether the distance walked is on the flat or includes hills. ● Exercise tolerance may vary according to any symptoms, time
of day, and weather conditions so ask supplementary questions for further specificity.
● You may need to qualify this by suggesting a time period, e.g. ‘over the past 2 weeks’, and note whether this has been stable or getting better or worse recently.

ASSESSMENT TOOLS102
● Is the patient satisfied with this level of exercise tolerance or would he/she like to be able to do more?
● For some patients (e.g. those who are unable to walk) exercise tolerance may be based on the distance they can wheel them-selves in their wheelchair, or their ability to transfer.
● It may be useful to estimate exercise tolerance from activities of daily living, e.g. are they able to wash themselves (face and hands, or all over body) or clean their teeth before becoming too tired to continue?
● Patients may also be asked to rate how hard an activity is by using the rating of perceived exertion scale (see 3.51 Rating of perceived exertion).
FINDINGS If the patient's exercise tolerance has been getting worse recently, this should be investigated further to identify possible causes such as deterioration in health status.
Patients with very poor exercise tolerance may be at higher risk of complications following surgery and may need more intensive rehabilitation prior to discharge.
DOCUMENTATION Record distance walked/number of steps climbed and time taken to walk a specified distance, if appropriate. Make a note of how the patient is/is not affected by weather conditions or any other factors. State whether this is less or more than when previously recorded if appropriate. You may find this recorded within the social history section of an initial database.
●3.29 FEV 1 /FVC (See under 3.40 LUNG VOLUMES AND LUNG FUNCTION TESTS – page 120)
●3.30 FLOW VOLUME LOOPS (See under 3.40 LUNG VOLUMES AND LUNG FUNCTION TESTS – page 120)
●3.31 FLUID BALANCE (INCLUDING URINE OUTPUT)
DEFINITION The running calculation of fluids that have been delivered minus those that have been excreted/drained from the body.

3.31 Fluid balance (including urine output) 103
PURPOSE In illness fluid balance is very important as patients who have lost lots of fluid are at risk of going into shock (a state of organ hypo-perfusion) and therefore need to be monitored closely. Patients who have fluid overload may develop pulmonary oedema, which may lead to respiratory symptoms.
PROCEDURE In the ward setting, a fluid balance chart may be done over a 24 hour period (i.e. only a balance at the end of the day). Within crit-ical care, there is a running hourly total. In both instances, this is completed by the nursing staff.
Fluid may be delivered orally, via a nasogastric (NG) tube or through an i.v. line. Fluid is normally lost through urine out-put and faeces. In the unwell patient fluid can additionally be lost from NG tubes and surgical drains. There are also insen-sible losses, including water vapour from the lungs and per-spiration from the skin (these often increase in illness) – these cannot be recorded. See Fig. 3.31.1 for an example of a fluid balance chart.
FINDINGS Normal urine output is 0.5–1 ml/kg/hr in adults. In the unwell patient, a drop in urine output is often an early sign of deterioration and should be considered alongside the rest of your assessment.
Following surgery, drains are often used, and these are placed to drain excess fluid from a surgical site. This is often a slow drain-age; therefore, if there is a large volume in the drain bag or if you note there is a large output you should seek senior help.
For specific information on chest drains, see 3.13 Chest drains.
● Fluid loss/dehydration : it is not uncommon for dehydration to be the result of too little fluid intake; remember that there are many patient groups that might not be able to drink inde-pendently, e.g. the grossly weak. Patients with diarrhoea and vomiting will have excessive fluid losses as will those following trauma or surgery – this can result in impairment of the body's electrolytes (see 3.6 Blood results) and also the acid–base bal-ance (see 3.1 Arterial blood gases). Note that dehydration can cause sputum to become more viscous.
● Fluid overload : too much fluid is not uncommon in heart failure and kidney failure. It can also be the result of excessive sodium absorption. This can be due to too much i.v. fluid or in the case

ASSESSMENT TOOLS104
of severe illness when capillary membranes become more per-meable (leaky). Overload leads to fluid being pushed into inter-stitial spaces (i.e. spaces outside both cells and vascular system), causing the physical signs of peripheral oedema (may be ankle or whole body oedema) or pulmonary oedema when fluid is pushed
DAILYINTAKE-OUTPUT CHART
(Not to be filled in Medical Record)
Bodyweight
SurnameMr./Mrs./Miss
Case No.
First Names
INSTRUCTIONS FOR 24 HOURS (PARENTERAL)All intravenous fluid therapy and drug additives to these fluids must be prescribed on the “INTRAVENOUS FLUIDS AND DRUGADDITIVES” form provided. Please refer to this form for fluid volumes which will be required when completing the INTAKE sectionbelow. (H.M.R. 111(W) IV).NOTE The “Type” heading below refers to the particular fluid prescribed in the numbered section on the “INTRAVENOUS FLUIDAND DRUG ADDITIVES” form.
INSTRUCTIONS FOR 24 HOURS (ORAL)
24hrs. from
TIMEINTAKE OUTPUT
INTRAVENOUS FLUIDS ORAL URINEOtherType Vol. set up given vol.
c/f
24 hourTotal
24 hourTotal
CUMULATIVE BALANCE H.M.R. 210A (W)82 (WKJ120X)+ –
12 hourTotal
Vol. Vol. Vol. Vol. Vol. Vol.NatureS.G.TypeGastric Drainage Other
on onto
Fig 3.31.1 Fluid balance chart.

105
into the lungs. Signs and symptoms of pulmonary oedema are shortness of breath, fine crackles on auscultation and ‘ground glass’ appearance on chest radiograph. If the patient is invasively monitored, there may be changes in CVP, BP and PiCCO® mea-surements. It is important to distinguish pulmonary oedema from a chest infection as these are managed differently by the physiotherapist.
DOCUMENTATION Urine output and overall fluid balance ( Fig. 3.31.1 ) should be doc-umented under the renal section of your assessment (see Table 2.3 , systems-based checklist in Chapter 2 ) along with a running total of fluid balance. If there are any drains in place (e.g. post-surgery or chest drains) the volume of fluid lost should also be noted. For the unwell patient, it is important to look at a trend over 24 hours rather than the last hour only and consider the pattern over the last few days (e.g. it could be that 4 litres is positive over the last 3 days).
●3.32 GENERAL OBSERVATION (See CHAPTER 1 )
3.33 ● GLASGOW COMA SCALE (GCS)
DEFINITION A method for quantifying level of consciousness, it comprises three tests: eye, verbal and motor responses. Although pupil response is not part of this test it is often performed at the same time (see 3.49 Pupils).
PURPOSE To monitor changes in neurological function and level of conscious-ness. It can be used in both the acute and chronic illness settings.
PROCEDURE Table 3.33.1 shows how the Glasgow Coma Scale (GCS) is scored. Each element is assessed separately.
● Eyes (E): if the patient is not eye opening spontaneously: – ask the patient to open their eyes – if the patient does not respond, use a painful stimulus to see
if a response can be evoked (see below).
Top tip! What should you consider when trying to distinguish between infection and pulmonary oedema?
3.33 Glasgow coma scale (GCS)

ASSESSMENT TOOLS106
● Motor (M): note any abnormal patterns of movement shown at rest or on stimulation: – ask the patient to stick out their tongue, squeeze your hand
or wiggle their toes. Consider the most appropriate option for your patient, e.g. for a patient with a complete spinal injury it would not be appropriate to suggest ‘wiggle your toes’.
– if the patient does not respond, use a painful stimulus to see if a response can be evoked (see below).
● Verbal (V): – ask the patient their name – note that if the patient is on a ventilator or has a tracheos-
tomy, the score is often 1 in this situation.
Painful stimuli are considered as: a hard object pressed into the nail bed of hands and feet; squeezing the upper trapezius muscles between the thumb and forefinger of the assessor; or
Response Score
Eye opening
Opens eyes spontaneously 4
Opens eyes in response to voice 3
Opens eyes in response to painful stimuli 2
Does not open eyes 1
Best verbal response
Orientated, converses normally 5
Confused, disorientated 4
Utters inappropriate words 3
Incomprehensible sounds 2
Makes no sound 1
Best motor response
Obeys commands 6
Localizes to painful stimuli 5
Flexion/withdrawal to painful stimuli 4
Abnormal flexion to painful stimuli (decorticate) 3
Extension to painful stimuli (decerebrate) 2
Makes no movements 1
Table 3.33.1 Glasgow Coma Scale scoring

107
supra orbital rub (using the thumb to apply pressure in the top corner of the eye socket). It is no longer recommended to use a sternal rub (rubbing the knuckle of the assessor over the sternum).
FINDINGS A normal GCS score is 15/15. The lowest score possible is 3/15. A GCS score of 8 indicates that the patient may be unable to pro-tect their own airway and may require intubation.
When assessing the patient you are looking for best response and any abnormal patterning (e.g. extending or flexing to pain). Deteriora tion in GCS score should always be highlighted to senior colleagues as this may reflect an acute change in status requiring prompt action.
DOCUMENTATION Unless the score is either 3/15 or 15/15, each element of the GCS assessment should be documented, e.g. ‘GCS 7/15 (E1, M4, V2)’. Any abnormal patterning should also be noted. This should be recorded in the CNS section of your assessment. Any change in status since the last review or during intervention should be documented.
●3.34 HEART RATE (HR)
DEFINITION Heart rate (HR) is the number of ventricular contractions that occur per minute (beats per minute or b.p.m.). It may be measured by auscultation at the cardiac apex or through an electro cardiograph (ECG). Continuous ECG monitoring may be performed rou-tinely, particularly in critical care (ITU) settings. HR can also be taken manually by palpating one of the body's pulses.
A normal range for HR is 60–100 b.p.m. (at rest).
PURPOSE Medically, HR is used as a diagnostic indicator for possible pathologies (e.g. infection or sepsis), to monitor response to treatment and to assess the patient's overall health and fitness (see 3.35 Heart rhythms).
For physiotherapists, HR is measured to assist in deciding whether a patient is stable enough to treat, making decisions regarding exercise tolerance and prescription (see 3.27 Exercise (aerobic fitness) testing), and monitoring response to treatment and possible pain and anxiety. During physiotherapy assessment, it can indicate when to call for help if the patient's HR is abnormal.
3.34 Heart rate (HR)

ASSESSMENT TOOLS108
PROCEDURE Manual pulse can be taken with two fingertips, using light pressure:
● if possible, ensure that the person has been sitting or lying still for at least 5 minutes
● choose an appropriate site.
Some commonly palpated sites are shown in Table 3.34.1 . You may count the number of pulsations for 15 seconds and then mul-tiply by 4; however, counting for 60 seconds is recommended for less stable patients in whom HR may be irregular.
Commercial HR monitors are also available, consisting of a chest strap with electrodes. The signal is transmitted to a wrist receiver for display. HR monitors allow accurate measurements to be taken continuously and can be used during exercise when man-ual measurement would be difficult or impossible (such as when the hands are being used).
FINDINGS ● Tachycardia (>100 b.p.m.): this often occurs with anxi-
ety, exercise (may limit exercise capacity – see 3.27 Exercise (aerobic fitness) testing), fever, anaemia, hypoxia, patients with cardiac disorders and those on certain medications,
Position Artery Reason for use
Thumb side of wrist Radial Easy access pulse and comfortable for individual
Medial side of wrist Ulnar Not commonly used
Neck Carotid Strong pulse with easy access
Inside of elbow Brachial Commonly used with children and babies
Groin Femoral Use if distal pulse is weak, e.g. hypovolaemia or sepsis
Behind medial malleolus
Posterior tibial Used to check leg perfusion
Middle of dorsum of foot
Dorsalis pedis Used to check leg perfusion
Behind the knee Popliteal Used to check leg perfusion
Over the abdomen Abdominal aorta Indicator of abnormal pathology, e.g. abdominal aortic aneurysm
Table 3.34.1 Commonly palpated pulse sites

3.35 Heart rhythms 109
e.g. bronchodilators and some cardiac drugs may increase HR. A high HR in response to physiotherapy treatment may sug-gest pain or stress and thus a need to stop or change technique or position.
● Bradycardia (<60 b.p.m.): this is seldom symptomatic until below 50 b.p.m. when a person is at total rest. If the patient is feeling well and is not dizzy there is probably no need to be con-cerned; however, you should report any bradycardia that occurs with symptoms. Also take care when exercising, as HR should normally rise with exercise. Trained athletes tend to have a slow resting HR, and resting bradycardia in athletes should not be considered abnormal if the individual has no symptoms associ-ated with it. Bradycardia may also be caused by some cardiac drugs, especially β -blockers and by vagal nerve stimulation owing to suctioning. If you are unsure whether bradycardia is new or abnormal for the patient, you should seek senior support.
Arrhythmias are abnormalities of the HR and rhythm (sometimes felt by patients as palpitations). They can be divided into two broad cate-gories: fast and slow heart rates. Some cause few or minimal symptoms. Others produce more serious symptoms of light-headedness, dizzi-ness and fainting (see 3.35 Heart rhythms for further information).
In most situations, the HR and pulse rate are identical; a difference between the two is called a ‘pulse deficit’. This indi-cates that some heartbeats have not caused sufficient blood flow to reach the periphery and is commonly found in atrial fibrilla-tion and some other arrhythmias (see 3.35 Heart rhythms).
DOCUMENTATION HR should be recorded when documenting a patient's vital signs in the CVS section of the assessment. Any recent changes in HR should also be recorded, especially if there has been a noticeable increase or decrease in the rate. Any changes when undergoing physiotherapy should be documented, as well as the time taken for HR to return to baseline and whether any additional treatment was required to allow the HR to return to baseline.
●3.35 HEART RHYTHMS
DEFINITION Heart rhythm or cardiac rhythm refers to the rhythm of the beating heart and considers the relationship between the atria and ventricles. It is considered alongside heart rate (see 3.34 Heart rate).

ASSESSMENT TOOLS110
PURPOSE Assessment of heart rhythms is used to detect many cardiac prob-lems, including angina pectoris, stable angina, ischaemic heart disease, arrhythmias/dysrhythmias (irregular heartbeat), tachy-cardia (fast heartbeat), bradycardia (slow heartbeat), myocardial infarction (heart attack), and certain congenital heart conditions. Monitoring of heart rhythms is used routinely in physical examina-tions and for monitoring a patient's condition during and after sur-gery, as well as in the intensive care setting. Heart rhythm analysis is also used to investigate symptoms such as chest pain, shortness of breath and palpitations ( Table 3.35.1 and Figs 3.35.1–3.35.3 ).
As a physiotherapist you should consider the heart rhythm prior to initiating any treatment. Also the rhythm should be monitored throughout to assess the patient's response to treatment. If any changes in heart rhythm occur then the medical team must be consulted.
PROCEDURE Heart rhythms are most commonly measured using an ECG. An ECG is a starting point for detecting many cardiac problems.
An ECG can be completed using either three leads or 12 leads. A three-lead ECG recording is often used within the critical care envi-ronment to monitor heart rhythm throughout the course of the day. This provides a guide to heart rhythm but is not as sensitive to change and displays only a small aspect of the heart rhythm. A 12-lead ECG, however, provides a more detailed interpretation of the heart rhythm and is able to detect more discrete changes in myocardial activity.
Both forms of ECG are completed by placing electrodes in spec-ified places on the chest wall (and on the patient's upper and lower limbs for a 12-lead ECG only). The electrodes on different sides of the heart measure the activity of different parts of the heart muscle. The ECG displays the voltage between pairs of these electrodes and hence demonstrates the amount of muscle activity that is occur-ring. This procedure is rarely completed by physiotherapists.
FINDINGS ● You are not responsible for diagnosis so always ask for help if
unsure! ● Is the patient in a normal sinus rhythm? ● Patients respond differently to dysrhythmias and a serious dys-
rhythmia in one person may have no adverse effects in another, so look at the patient!
● Blood pressure is the key when deciding the importance of any dysrhythmia (see 3.5 Blood pressure). Also consider general obser-vations such as colour, temperature and level of consciousness.

3.35 Heart rhythms 111
Rh
yth
mA
nal
ysis
ECG
fin
din
gs
Sin
us
rhyt
hm
(SR
)N
orm
al c
ard
iac
rhyt
hm
pro
ceed
ing
fro
m t
he
sin
oat
rial
no
de.
In h
ealt
hy
adu
lts
60–1
00 b
.p.m
.C
on
sist
s o
f a
P w
ave,
a Q
RS
com
ple
x an
d a
T w
ave.
Th
e P
wav
e is
atr
ial d
epo
lari
zati
on
; th
e Q
RS
com
ple
x o
ccu
rs a
s th
e im
pu
lse
trav
els
thro
ug
h t
he
ven
tric
les;
an
d t
he
T w
ave
is t
he
rep
ola
riza
tio
n o
f th
e ve
ntr
icle
s ( F
ig. 3
.35.
1 )
Sin
us
bra
dyc
ard
ia (
SB)
See
3.34
Hea
rt r
ate
A s
low
rat
e, r
egu
lar
rhyt
hm
, no
rmal
QR
S co
mp
lex
and
th
e p
rese
nce
of
bo
th t
he
P an
d T
wav
e ( F
ig. 3
.35.
1 )
Sin
us
tach
ycar
dia
(ST
)Se
e 3.
34 H
eart
rat
eA
rap
id r
ate,
reg
ula
r rh
yth
m, n
orm
al Q
RS
com
ple
x an
d
the
pre
sen
ce o
f b
oth
th
e P
and
T w
ave
( Fig
. 3.3
5.1 )
Atr
ial f
ibri
llati
on
(A
F) M
ost
co
mm
on
arr
hyt
hm
ia, o
ccu
rrin
g in
5–1
0%
of
pat
ien
ts o
ver
65 y
ears
. Atr
ial a
ctiv
ity
is n
ot
seq
uen
ced
an
d is
mec
han
ical
ly in
effe
ctiv
e. T
he
atri
ove
ntr
icu
lar
no
de
con
du
cts
on
ly a
pro
po
rtio
n
of
the
atri
al im
pu
lses
to
pro
du
ce ir
reg
ula
r ve
ntr
icu
lar
resp
on
ses
Sym
pto
ms
ran
ge
fro
m p
alp
itat
ion
s an
d f
atig
ue
to a
cute
pu
lmo
nar
y o
edem
a Th
e ar
ea o
f co
nce
rn w
ou
ld b
e fa
st A
F, in
wh
ich
th
e p
atie
nt'
s H
R is
ver
y h
igh
an
d t
he
blo
od
p
ress
ure
is c
om
pro
mis
ed
ECG
has
a r
apid
rat
e, ir
reg
ula
r h
eart
rh
yth
m a
nd
th
e re
pla
cin
g o
f P
wav
es w
ith
an
irre
gu
lar
bas
elin
e.
( Fig
. 3.3
5.2 )
Tab
le 3
.35.
1 H
eart
rh
yth
ms
(Co
nti
nu
ed)
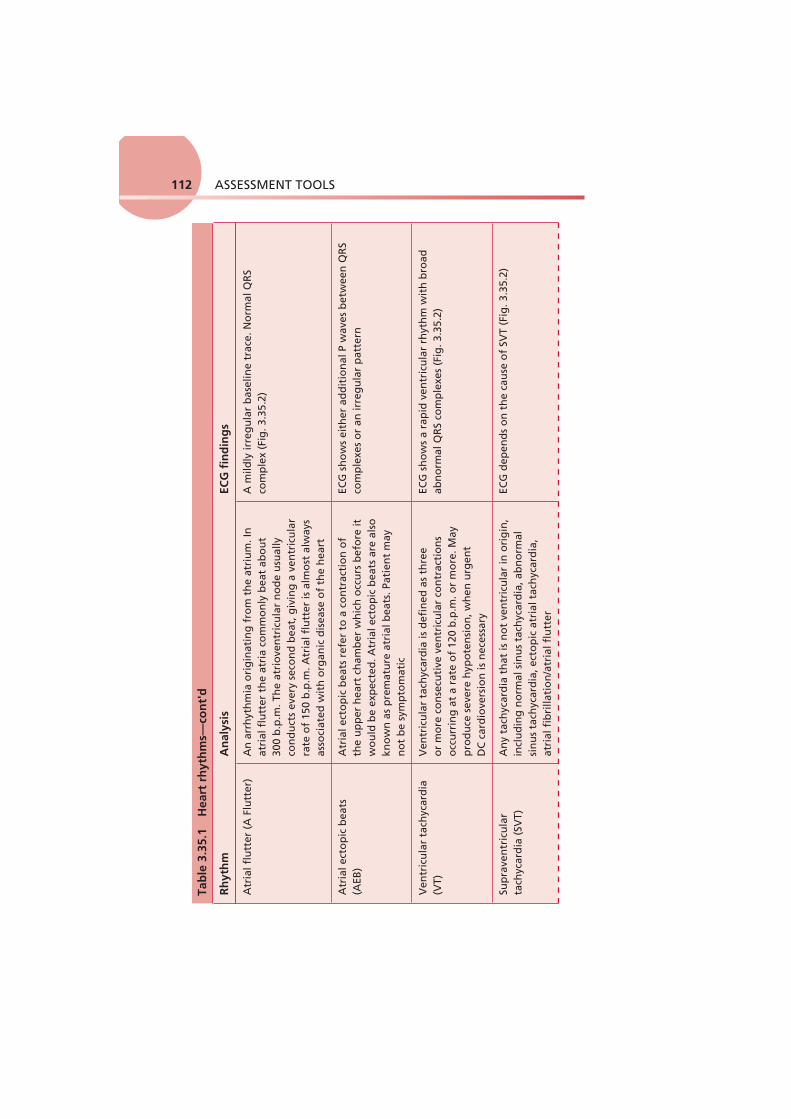
ASSESSMENT TOOLS112
Rh
yth
mA
nal
ysis
ECG
fin
din
gs
Atr
ial f
lutt
er (
A F
lutt
er)
An
arr
hyt
hm
ia o
rig
inat
ing
fro
m t
he
atri
um
. In
at
rial
flu
tter
th
e at
ria
com
mo
nly
bea
t ab
ou
t 30
0 b
.p.m
. Th
e at
rio
ven
tric
ula
r n
od
e u
sual
ly
con
du
cts
ever
y se
con
d b
eat,
giv
ing
a v
entr
icu
lar
rate
of
150
b.p
.m. A
tria
l flu
tter
is a
lmo
st a
lway
s as
soci
ated
wit
h o
rgan
ic d
isea
se o
f th
e h
eart
A m
ildly
irre
gu
lar
bas
elin
e tr
ace.
No
rmal
QR
S co
mp
lex
( Fig
. 3.3
5.2 )
Atr
ial e
cto
pic
bea
ts
(AEB
)A
tria
l ect
op
ic b
eats
ref
er t
o a
co
ntr
acti
on
of
the
up
per
hea
rt c
ham
ber
wh
ich
occ
urs
bef
ore
it
wo
uld
be
exp
ecte
d. A
tria
l ect
op
ic b
eats
are
als
o
kno
wn
as
pre
mat
ure
atr
ial b
eats
. Pat
ien
t m
ay
no
t b
e sy
mp
tom
atic
ECG
sh
ow
s ei
ther
ad
dit
ion
al P
wav
es b
etw
een
QR
S co
mp
lexe
s o
r an
irre
gu
lar
pat
tern
Ven
tric
ula
r ta
chyc
ard
ia
(VT)
Ven
tric
ula
r ta
chyc
ard
ia is
def
ined
as
thre
e o
r m
ore
co
nse
cuti
ve v
entr
icu
lar
con
trac
tio
ns
occ
urr
ing
at
a ra
te o
f 12
0 b
.p.m
. or
mo
re. M
ay
pro
du
ce s
ever
e h
ypo
ten
sio
n, w
hen
urg
ent
DC
car
dio
vers
ion
is n
eces
sary
ECG
sh
ow
s a
rap
id v
entr
icu
lar
rhyt
hm
wit
h b
road
ab
no
rmal
QR
S co
mp
lexe
s ( F
ig. 3
.35.
2 )
Sup
rave
ntr
icu
lar
tach
ycar
dia
(SV
T)A
ny
tach
ycar
dia
th
at is
no
t ve
ntr
icu
lar
in o
rig
in,
incl
ud
ing
no
rmal
sin
us
tach
ycar
dia
, ab
no
rmal
si
nu
s ta
chyc
ard
ia, e
cto
pic
atr
ial t
ach
ycar
dia
, at
rial
fib
rilla
tio
n/a
tria
l flu
tter
ECG
dep
end
s o
n t
he
cau
se o
f SV
T ( F
ig. 3
.35.
2 )
Tab
le 3
.35.
1 H
eart
rh
yth
ms—
con
t'd

3.35 Heart rhythms 113
Rh
yth
mA
nal
ysis
ECG
fin
din
gs
Ven
tric
ular
fib
rilla
tion
(VF)
n
o c
ard
iac
ou
tpu
t –
emer
gen
cy!
A v
ery
rap
id a
nd
irre
gu
lar
ven
tric
ula
r ac
tiva
tio
n w
ith
no
mec
han
ical
eff
ect
and
h
ence
no
car
dia
c o
utp
ut.
VF
rare
ly r
ever
ts
spo
nta
neo
usl
y an
d r
equ
ires
imm
edia
te D
C
card
iove
rsio
n
The
ECG
dis
pla
ys a
ch
aoti
c w
ave
pat
tern
wit
h n
o
clea
r T
wav
e, Q
RS
com
ple
x o
r P
wav
e ( F
ig. 3
.35.
3 )
Ven
tric
ula
r ec
top
ic b
eat
(VEB
)A
n e
xtra
hea
rtb
eat
ori
gin
atin
g in
th
e lo
wer
ch
amb
er o
f th
e h
eart
. Th
ey a
re c
om
mo
n a
nd
d
o n
ot
ind
icat
e a
pro
ble
m in
peo
ple
wit
ho
ut
hea
rt d
isea
se. H
ow
ever
, if
a p
erso
n h
as a
ort
ic
sten
osi
s, h
eart
fai
lure
, or
a p
revi
ou
s h
eart
at
tack
, VEB
s m
ay b
e fo
llow
ed b
y ve
ntr
icu
lar
tach
ycar
dia
an
d f
ibri
llati
on
, wh
ich
can
lead
to
su
dd
en d
eath
ECG
sh
ow
s ad
dit
ion
al Q
RS
com
ple
xes
in a
n ir
reg
ula
r p
atte
rn
Atr
iove
ntr
icu
lar
(AV
) b
lock
(al
so k
no
wn
as
hea
rt b
lock
)
Thre
e fo
rms
of
AV
blo
ck c
an b
e id
enti
fied
– f
irst
, se
con
d a
nd
th
ird
deg
ree.
Th
e co
mm
on
est
cau
ses
are
coro
nar
y ar
tery
dis
ease
, car
dio
myo
pat
hy
and
fi
bro
sis
of
the
con
du
ctin
g t
issu
e
1st
deg
ree
= lo
ng
er g
ap b
etw
een
P a
nd
R w
aves
2n
d d
egre
e =
QR
S d
oe s
no
t fo
llow
eac
h P
wav
e 3r
d d
egre
e =
no
co
ord
inat
ion
bet
wee
n P
wav
e an
d
QR
S co
mp
lex
( Fig
. 3.3
5.3 )

ASSESSMENT TOOLS114
● The trend of any dysrhythmias is also important: – Have they just occurred? – Did they occur suddenly or gradually? – Are the dysrhythmias getting more frequent? – How is your treatment affecting them? – Pay attention to dysrhythmias that have recently appeared or
are getting more frequent. ● Manual chest treatments may affect the ECG tracing, so allow time
for the tracing to settle before interpreting any abnormality. ● The most critical heart rhythms are:
– ventricular tachycardia – supraventricular tachycardia – ventricular fibrillation – no cardiac output – asystole – no cardiac output.
Physiotherapists are not expected to be able to interpret an ECG and are not involved in the management of changes in heart rhythm. However, the presence of heart arrhythmias will have an impact on
A
B
C
Fig 3.35.1 Electrocardiogram traces of sinus rhythms. (A) Sinus rhythm. (B) Sinus bradycardia. (C) Sinus tachycardia.
Top tip! If you are the first on the scene and the patient has no cardiac out-put or pulse, activate the buzzer/crash button and start cardiopul-monary resuscitation immediately!

3.35 Heart rhythms 115
whether physiotherapy input is appropriate and whether the patient is able to tolerate treatment. If arrhythmias occur during treatment, medical assistance must be requested and treatment stopped. In some circumstances, the ceasing of treatment may lead to a reversal of the arrhythmias. For further information, see 3.34 Heart rate.
DOCUMENTATION When documenting the patient's HR, the rhythm (if known) should also be documented. For example, ‘heart rate = 100 b.p.m. (SR)’, where SR means sinus rhythm. This then allows for recognition
A
B
C
D
E
Fig 3.35.2 Electrocardiogram traces of dysrhythmias. (A) Atrial fibrillation. (B) Atrial flutter. (C) Supraventricular tachycardia. (D,E) Ventricular tachycardia.

ASSESSMENT TOOLS116
of deterioration or improvement in a patient's condition as well as considerations for any precautions or contraindications for physio-therapy input. Any changes in HR or rhythm must also be docu-mented and any action taken, e.g. discussion with medical staff.
●3.36 INSPIRATORY MUSCLE TESTING (See under 3.40 LUNG VOLUMES AND LUNG FUNCTION TESTS – page 120)
3.37 ● INTRACRANIAL PRESSURE (ICP)
DEFINITION The pressure within the cranium that represents the pressure from the brain, blood and cerebrospinal fluid (CSF). It is normally mea-sured in mmHg with a normal resting range of 0–10 mmHg.
A
B
C
D
<P–R>interval
P P P P P P
Fig 3.35.3 Electrocardiogram traces of dysrhythmias. (A,B) Ventricular fibrillation. (C,D) first and second degree heart block.

3.37 Intracranial pressure (ICP) 117
PURPOSE Monitoring ICP allows the team to identify whether the patient's brain is swelling or whether there is pressure being put upon the brain (e.g. following a subarachnoid haemorrhage), which may cause further damage to the brain tissue. It can also monitor whether swelling/pressure is subsiding.
Physiotherapists use ICP as a guide to identify which treat-ments they can use, as many physiotherapy treatments can have an impact on ICP and CPP, potentially leading to further brain dam-age (see 3.12 Cerebral perfusion pressure (CPP)).
PROCEDURE Medical staff place an ICP probe in the subdural/subarachnoid space under the skull, which gives a continuous digital reading on the monitor by the patient's bedside. ICP may be monitored in one of several ways, as demonstrated in Fig. 3.37.1 .
FINDINGS The normal value for ICP is 0–10 mmHg; when this value climbs above 20–25 mmHg, the patient may require specialist treatment to reduce ICP.
Intraparenchymalfibreoptic catheter
Epidural tranducer
Subdural catheter
Subdural bolt
Ventriculostomy
Fig 3.37.1 Intracranial pressure monitoring. Reproduced with kind permission from Grant IS, Andrews PJ. 1999 ABC of intensive care: neurological support. British Medical Journal 319: 110–13.

ASSESSMENT TOOLS118
The brain compartment holds three elements – the brain tissue, blood and CSF. If pressure in one element increases, the others must decrease to maintain a stable ICP (Monro–Kellie hypoth-esis). Following brain injury, ICP may rise.
A raised ICP can be caused by many factors, including neuro-logical deterioration. However, high P a CO 2 and low P a O 2 (per-haps as a result of retained secretions) can also raise ICP as this causes vasodilitation of the blood vessels in the brain; vasodili-tation leads to a greater flow of blood to the brain and there-fore an increase in ICP. It may be difficult for physiotherapists unfamiliar with this group of patients to decide whether dete-rioration in the patient's condition is due to neurological or respiratory causes. If you are unsure, it is important that you seek senior advice.
Many physiotherapy treatments can have an impact on ICP and CPP. Increased intrathoracic pressure associated with man-ual respiratory techniques and manual hyperinflation can reduce venous return to the heart, therefore lowering cardiac output and subsequently BP. A lower BP will lead to a lower MAP, which then affects CPP (see 3.12 Cerebral perfusion pressure (CPP)). Raised intrathoracic pressure may also reduce venous drainage from the head and, therefore, potentially increase ICP. Often the adage ‘maximal involvement, minimal intervention’ is used, i.e. only treat if treatment is indicated – not just for assessment and not prophylactically.
DOCUMENTATION The ICP value should be documented under the CNS section of assessment and should be considered alongside the global clinical picture. Any changes in ICP during treatment must be recorded along with the time it took to return to baseline and whether any action was required by nursing or medical staff to rectify the change.
Top tip! Talk with nursing staff about any changes in the patient's ICP in response to nursing procedures, such as turning or washing. If ICP stabilizes quickly after such interventions the patient is likely to tol-erate physiotherapy treatment, but if ICP takes 2–3 hours to stabi-lize, physiotherapy might not be tolerated well. Seek senior advice prior to treating potentially unstable patients.

119
●3.38 ITU (CRITICAL CARE) CHARTS
DEFINITION The 24 hour spreadsheet on which ITU nurses document hourly key observations within the critical care setting.
PURPOSE Charts within critical care vary between institutions; however, there is a general overview that is common to many. Fig. 3.38.1 may help you locate the information you are seeking to aid your assessment.
PROCEDURE ITU nurses document observations on the chart over a period of time – usually over a 24 hour period – and these observations are usually recorded every hour. The value of these charts is that you can see what has happened to the patient over a period of time. This facilitates spotting trends and also linking changes in one system to changes in another, e.g. if RR increases, has there been any change in HR?
It should be noted that documentation using ITU-type charts is common practice within high-care/dependency areas and the format of charting may be very similar to this.
DOCUMENTATION What should be documented within a critical care assessment can be seen in Chapter 2 , Table 2.5 Critical care/ITU patients.
3.38 ITU (critical care) charts
Patient details
Cardiovascular Fluids including: infusions, drugs, drains, and fluid balance
Neuro obs Comments/to do list
Respiratory
Cares, e.g. mouth and eye
Fig 3.38.1 Example of an ITU/critical care chart.

ASSESSMENT TOOLS120
●
3.39 LEVEL OF CONSCIOUSNESS (SEE ALSO 3.4 AVPU, 3.33 GLASGOW COMA SCALE AND 3.57 SEDATION/AGITATION SCORE)
DEFINITION A measure of how responsive a patient is to the environment, stimuli or the degree of arousal.
PURPOSE To ascertain the patient's ability to participate in treatment. It can also be used as a marker of progression or deterioration (for fur-ther information, see 3.4 AVPU, 3.33 Glasgow Coma Scale and 3.57 Sedation/agitation score).
PROCEDURE Observe the patient and attempt to rouse them by asking them to respond to simple questioning; consider the appropriateness of their response.
DOCUMENTATION In the absence of using AVPU, GCS or a sedation score it is accept-able to note the patient's level of awareness; this should be done in the CNS section of your assessment, e.g. awake and alert/very sleepy/appears confused.
●3.40 LUNG VOLUMES AND LUNG FUNCTION TESTS (PULMONARY FUNCTION TESTS)
DEFINITION The measurement of ventilation (movement of air into and out of the lungs) during normal and/or maximal breathing manoeuvres.
Volumes and/or flow rates of inspired or expired air may be measured by portable equipment in GPs’ surgeries, hospital wards and clinics (spirometry) and even in the patient's own home. However, measurements of the volumes (static volumes), volumes between breaths and other tests such as muscle function pressures and gas transfer can only be made by specialized equipment in the
Top tip! If a patient has a less than normal conscious level, find out whether this is recent. Any sudden or recent deterioration should be reported and may need urgent intervention.

1213.40 Lung volumes and lung function tests
pulmonary function laboratory. The most commonly measured test that physiotherapists may need to be able to either conduct or inter-pret is spirometry in order to find the forced vital capacity (FVC), forced expiratory volume in the first second (FEV 1 ) and peak expira-tory flow rate (PEFR). These are dynamic volumes. Definitions of all these volumes and measurements are described in Tables 3.40.1 and 3.40.2 and discussed under Findings.
Inspiratory muscle testing can be performed; however, testing is dependent on the effort of the patient and, therefore, the level of reliability or reproducibility may not be consistent. As this mea-surement is less commonly used in practice, results have not been discussed under Findings.
PURPOSE There are a number of reasons to review lung volumes and lung function tests (LFTs):
● to look for the presence of lung disease and aid diagnosis ● to grade the severity of respiratory disorders ● to differentiate between different pathologies
Lung volumes
Tidal volume The volume of a normal resting breath
Inspiratory reserve volume The extra volume that can be inhaled after a normal inspiratory breath to reach maximal inspiration
Expiratory reserve volume The extra volume that can be exhaled after a normal expiratory breath to reach maximal expiration
Residual volume The amount of air left in the lungs after full expiration – this cannot be directly measured
Vital capacity The volume from maximal inspiration to maximal expiration
Functional residual capacity The amount of air left in the lungs at the end of a normal tidal volume – this cannot be directly measured
Total lung capacity The total volume of the lung if completely emptied and includes the residual volume – this cannot be directly measured
Table 3.40.1 Key terms in normal respiratory mechanics

ASSESSMENT TOOLS122
● to monitor disease progression over time ● to evaluate the response to treatment (e.g. response to bron-
chodilators or steroids).
Physiotherapists may occasionally be required to take these mea-surements and may also need to interpret LFT results in order to determine disease progression. It may also be useful for physiothera-pists to distinguish between restrictive and obstructive lung disease (this is discussed further under Findings) in order to select appro-priate treatments. For example, patients with low lung volumes may require deep breathing exercises or positions to increase ventilation.
PROCEDURE ● PEFR : the patient is asked to take a maximal breath in and then
blow out forcefully into a peak flow meter. This is a short and sharp manoeuvre. The figure recorded is normally the best of three attempts.
● Spirometry : the patient is asked to take a maximal breath in and then blow out forcefully into a device and keep blowing until they can exhale no more. They will be asked to repeat this to ensure a consistent result. This test measures FEV 1 and FVC.
See the guidelines in Further reading for more detailed instruc-tions on performing these tests, including safety measures.
PEFR or PEF Peak expiratory flow rate or peak expiratory flow is the highest flow rate achieved with forced expiration following a maximal inspiration. It can be measured with very small, cheap and simple flow meters which may be given to patients to use at home. It is often used as an indicator of airflow obstruction in asthma
FEV 1 The volume of air a subject can exhale in the first second of a maximal breath out, following a maximal inspiration
Forced vital capacity (FVC)
The volume expired forcefully (following a maximal inspiration), until residual volume is reached
FEV 1 /FVC Looks at the amount of air expelled within the first second compared with the overall volume achieved
Flow–volume loop/curve
This procedure starts from tidal breath in, then measures a full inspiration followed immediately by a forced maximal expiration. The curve is plotted from rates at specific volumes
Table 3.40.2 Dynamic lung function tests measure volumes over a period of time

123
FINDINGS The primary function of the lung is gas exchange. This is achieved using three physiological mechanisms:
● Ventilation : the bulk movement of gas in and out of the lungs. ● Diffusion : the movement of a substance from an area of
high concentration to an area of low concentration along a gradient.
● Perfusion : the movement of blood through the pulmonary circulation.
Breathing moves gas in and out of the lungs; the thin membrane of the lung and large surface area facilitate diffusion, and the con-stant supply of blood transports oxygen from the lungs to the body and returns carbon dioxide for removal.
There are a variety of methods to measure the efficiency of these mechanisms and compare them with normal values in a lab-oratory setting; however, there will be a focus on simple bedside tests in this section. Lung function tests focus on the ventilation component only; for more detail on background respiratory phys-iology and testing, the reader is directed to the Further reading.
Table 3.40.1 and Fig. 3.40.1 set out the static volumes that can be measured in the physiology laboratory. It is important to understand these first before going on to look at the dynamic values that are com-monly measured in the clinics and hospital wards ( Table 3.40.2 ).
3.40 Lung volumes and lung function tests
Time
5
2
1
3
4
6
7Volu
me
Fig 3.40.1 Static lung volumes. 1 = Tidal Volume; 2 = Inspiratory Reserve Volume; 3 = Expiratory Reserve Volume; 4 = Residual Volume; 5 = Vital Capacity; 6 = Functional Residual Capacity; 7 = Total Lung Capacity

ASSESSMENT TOOLS124
The results are compared with the predicted result for a patient of the same age, sex, height and ethnic origin and the result is converted into a percentage; for example,
= = ´ =(measured FVC 4.5 / predicted FVC 6.0) 100 75%
Any result below 80% or above 120% of predicted is considered to be outside the normal range. Below 80% of predicted is suggestive of pathology. If previous values are available, they provide a useful comparison to review disease progression.
How to interpret abnormal lung function testing ● Is the FVC normal? If the FVC is lower than 80% predicted
this suggests pathology; however, at this point it is not pos-sible to decide whether this is an obstructive or a restrictive problem.
● Is FEV 1 normal? If the FEV 1 is less than 80% of predicted this also suggests pathology. However, if considered on its own it is not possible to say whether this is a restrictive or obstructive problem.
● Is the FEV 1 /FVC ratio normal? Identify an obstructive problem ● Airflow obstruction: there is a partial block or narrowing of the con-
ducting airways and the patient is having difficulty getting air out of the lung quickly. This results in a flattened spirogram ( Fig. 3.40.2 ). Look at the FEV 1 /FVC × 100 ratio. Any value lower than 70% sug-gests obstructive respiratory disease such as asthma or COPD.
FVC Normal
Airflowobstruction
Airflowrestriction
Time1.0 sec
FEV1
Volu
me
Fig 3.40.2 A simplified graph to demonstrate a spirogram, with forced vital capacity in first second of expiration (FEV 1 ) and forced vital capacity (FVC) demonstrated.

125
Identify a restrictive problem ● Airflow restriction ( Fig. 3.40.2 ): here the total volume of
air the patient is able to blow out is limited (so the FVC would be low), but there is no obstruction (so the FEV 1 /FVC ratio is above 70%). This happens because the patient is not able to take in a deep enough breathe initially, which then reduces the FVC. The air that they do manage to expire will come out quickly, so the FEV 1 /FVC ratio can be high. This would be found in patients with kyphoscoliosis – a non-reversible condition – or a pleural effusion which could be drained.
Combined problems ● Some patients have both a reduced FVC AND FEV 1 together
with a lower FEV 1 /FVC ratio – they may be classified as having obstructive AND restrictive problems.
● Flow volume loop: inspiratory curves can indicate muscle strength and vocal cord problems. Expiratory loops are good indicators for extrathoracic obstruction and small airway blockage.
DOCUMENTATION The results for FEV 1 and FVC are expressed in litres and PEFR is expressed in litres per minute. The FEV 1 /FVC ratio is always expressed as a percentage. These should be documented under the respiratory heading of your assessment.
FURTHER READING American Association for Respiratory Care, 1996. AARC Clinical
Practice Guideline Spirometry, 1996 Update. Respir. Care 41, 629–36.
Cotes, J.E., 1993. Lung Function Assessment and Application to Medicine. Blackwell Scientific Publications, Oxford, UK (Chapter 6).
Quanjer, P.H., Tammeling, G.J., Cotes, J.E., et al, 1993. Lung volumes and forced ventilatory flows. Eur. Respir. J. 6 (Suppl. 16), 5–40.
West, J.B., 2008. Respiratory Physiology: The Essentials, 8th edn. Lippincott, Williams and Wilkins, Baltimore, MD.
3.41 ● MUSCLE CHARTING (OXFORD GRADING)
DEFINITION A form of manual muscle testing which assesses the power of a muscle. This is then rated on a scale (0–5) to provide an objective marker.
3.41 Muscle charting (Oxford grading)

ASSESSMENT TOOLS126
PURPOSE It is important for a physiotherapist to measure muscle strength as objectively as possible when assessing an individual. This is com-pleted to obtain a baseline level from which future improvement or deterioration can be measured. This allows the therapist to devise an individual exercise plan and to evaluate its effectiveness.
The Oxford scale provides an indication of the strength of a particular muscle or group of muscles. It is relatively quick and easy to complete and requires no equipment, and as such it is widely used in all areas of clinical practice.
However, the scale is limited as it is subjective, and is not func-tional or sensitive to change since the movements resisted are con-centric contractions. Also, the spaces between the grades are not linear ( Table 3.41.1 ).
PROCEDURE For information on muscle strength testing for particular joints and/or muscles refer to Fox and Day (2009) (see Further reading).
FINDINGS ● Grade 0: no action discernible in the muscle belly or tendon
when the patient attempts to perform the activity several times. ● Grade 1: twitch discerned as the muscle undergoes a small con-
traction but is not strong enough to perform any of its specified joint movement.
● Grade 2: muscle is strong enough to perform its designated joint movement when the force of gravity is eliminated (making it much easier to perform). The joint must be accurately posi-tioned for this to be tested correctly.
● Grade 3: muscle is strong enough to perform the joint action to the full range against gravity but with no resistance applied. An example is a patient lifting his or her arm above their head.
Grade Definition
0 No contraction of the muscle
1 A flicker of a contraction
2 Full range of movement with gravity eliminated
3 Full range of movement against gravity and with a hold
4 Full range of movement against a minimal resistance
5 Full range of movement against a maximal resistance
Table 3.41.1 Oxford grading scale

127
● Grade 4: muscle can move the joint through the full movement both against gravity and against some resistance such as body weight or gentle resistance applied by the therapist. It is a pro-fessional judgment as to the resistance to be applied for the test, and the physiotherapist should have in mind the health, age, activity and weight of the patient.
● Grade 5: the patient's normal power, but as this will vary greatly between individuals the physiotherapist must make an estimation of the expected full muscle power for that particular patient. Grade 5 for a frail sick person will be very different from grade 5 for a young, fit, sports person.
To demonstrate the subjectivity of this measurement some thera-pists may also use a ‘+’ or ‘−’ after the grade. If the patient can raise their arm up above the head to some extent but not very strongly nor to full range, the physiotherapist might grade that as 3/5 for the deltoid muscle but, because it is not full, it might be rated 3−/5. If the muscle will take good manual resistance but does not appear to be normal for that patient then the grading could be 4+/5.
This grading scale allows the physiotherapist to test all the appro-priate muscles and record them in the patient's notes, enabling progress to be charted against time as the strength improves.
DOCUMENTATION When documenting Oxford grading it is essential to record the muscle being tested, the patient's starting position (e.g. long sit-ting) and the estimated muscle power from 0/5 to 5/5. This infor-mation is required to ensure that the test can reliably be repeated for that given patient and that given muscle group.
Any observations made during the test should also be recorded, e.g. any noticeable loss of range, pain or abnormal movement pattern.
FURTHER READING Fox, J., Day, R., 2009. A Physiotherapist's Guide to Clinical
Measurement. Churchill Livingstone, Edinburgh, UK.
●3.42 MYOTOMES (SEE ALSO 3.41 MUSCLE CHARTING (OXFORD GRADING))
DEFINITION A myotome is a muscle that is supplied by one main spinal nerve root ( Fig. 3.42.1 ). It is the motor equivalent of a dermatome. Myotome assessment can be used to assess peripheral nerve inju-ries and spinal cord injuries.
3.42 Myotomes

ASSESSMENT TOOLS128
C5
C6,7C5,6
C6, 7
C6, 7
C6,7
C8
L3,4
L5,S1 L1,2,3
L4,5
S1,2
L4,5 L5,S1
L5,S1
T1
Fig 3.42.1 Myotomes. Reproduced with kind permission from Crossman AR, Neary D. 2002 Neuroanatomy: An Illustrated Colour Text, 2nd Edn. Edinburgh, UK: Churchill Livingstone.

129
PURPOSE Myotome testing is designed to test the integrity of the nerve supply to a group of muscles. A muscle group's isometric muscle strength relates directly to the nerve root innervations, and thus may aid in the identification of the potential nerve root lesion.
PROCEDURE The procedure is fully described in Day et al (2009) (see Further reading).
FINDINGS Weakness or inability to contract individual muscles provides a guide to the level of injury. In practice, within the cardiorespira-tory setting, it should be noted that ‘C3, 4 and 5 keep the dia-phragm alive’ and that abdominal muscles are highly important for an effective cough. Thus, any injury above and including the thoracic level can have an impact on respiratory function.
As with dermatomes, it may be necessary to re-chart myotomes on several occasions to assess improvement or deterioration in level of function. This is particularly relevant in the management of early spinal injury in which ‘spinal shock’ (i.e. inflammatory response in the spinal cord) may cause a higher level of deficit than the original injury level. This needs to be closely monitored.
DOCUMENTATION See 3.41 Muscle charting (Oxford grading) for documentation.
FURTHER READING Day, R., Fox, J., Paul-Taylor, G., 2009. Neuro-musculoskeletal Clinical
Testing: A Clinician's Guide. Churchill Livingstone, Edinburgh, UK.
3.43 ● OXYGEN DELIVERY
DEFINITION Oxygen therapy is the administration of oxygen at concentrations greater than that in ambient air (i.e. above 21%) to treat or pre-vent the symptoms and problems associated with hypoxia. It is used to achieve normal or near-normal tissue oxygenation, with-out causing a reduction in ventilation and consequent increase in arterial carbon dioxide tension or oxygen toxicity.
Oxygen therapy can be provided in both the acute and commu-nity environment to assist in the management of hypoxaemia.
3.43 Oxygen delivery

ASSESSMENT TOOLS130
PURPOSE Oxygen is a drug and should be prescribed by a medical profes-sional; however, physiotherapists need to assess oxygen delivery to ensure that the patient is receiving the amount of oxygen that has been prescribed. The physiotherapist may also assess whether oxygen therapy is sufficient and whether the modality by which it is delivered is appropriate. They need to monitor oxygen delivery during exercise or physiotherapy treatment and may (depending on the setting) be allowed to alter oxygen delivery in response to changes in oxygen saturation.
PROCEDURE Oxygen can be delivered to a patient in several different ways ( Fig. 3.43.1 ). Physiotherapists are not normally involved in the prescription of oxygen but in an emergency situation are allowed to increase oxygen as needed and change the method of delivery. The most common methods of delivery are:
● nasal cannulae or specs ● face mask – simple or Venturi or non-rebreathe mask ● tracheostomy mask ● ventilator ● resuscitation bag ● head box (small children).
Fig 3.43.1 Oxygen delivery devices. A, nasal cannula; B, simple face mask;

1313.43 Oxygen delivery
Fig 3.43.1, cont'd C, non-rebreathe mask; D, tracheostomy mask; E, Ambu bag; F, ventilator.

ASSESSMENT TOOLS132
Oxygen delivery is divided into two main categories:
● Fixed performance devices (high flow): – These masks deliver oxygen at a rate above the peak inspira-
tory flow rate. – They deliver fixed concentrations of oxygen, e.g. Venturi
face mask, and are necessary particularly for patients with reduced hypoxic drives (e.g. COPD patients) and those with type II respiratory failure (see 3.1 Arterial blood gases).
– They deliver an accurate percentage of oxygen (24–60%). – Correct oxygen flow is important. – Table 3.43.1 summarizes the flow required for each percent-
age oxygen – the % and flow rate required is also marked on individual valves.
● Variable flow devices (low and variable flow): – These devices deliver oxygen at less than the peak inspiratory
flow rate and therefore provide a variable concentration of oxygen.
– The percentage of oxygen delivered is dependent on the rate and depth of the patient's respiration.
– Suitable for patients who do not require an accurate percent-age of oxygen.
– Table 3.43.2 summarizes flow rates and the potential con-centrations of variable performance devices.
In many circumstances it may be appropriate to add humid-ification to the oxygen delivery system. This may help spu-tum clearance, as it will prevent the drying effects of oxygen. Humidification can be added using any of the following equipment:
● heat moisture exchanger: used for ventilated patients ● heated humidification systems, e.g. Fisher Paykell: used for
ventilated patients
Venturi valve Oxygen flow
24% (blue) 2 l/min
28% (white) 4 l/min
35% (yellow) 8 l/min
40% (red) 10 l/min
60% (green) 15 l/min
Table 3.43.1 Venturi valves

3.43 Oxygen delivery 133
● cold water large volume nebulizers, e.g. Hudson or Respi-flo ● cold water bubble-through systems ● saline nebulizers.
FINDINGS The concentration of oxygen being delivered to the patient is a key indicator of the clinical condition. Patients on higher oxy-gen requirements normally have a worse clinical picture. Also, patients who have had sudden increases in oxygen demand are likely to be deteriorating and require referral to the medical team. The patient may require either a change in concentration of oxygen or a change in delivery system (e.g. change from nasal cannula to face mask if the patient is mostly mouth breathing).
Changes in oxygen therapy can also assist in the decision as to whether physiotherapy input is required and how likely the patient is to tolerate the intervention. You should be aware of a patient's oxy-gen requirements prior to initiating any form of intervention and, if appropriate, monitor oxygen saturations during the treatment. Physiotherapists will also be involved in suggesting the use of humid-ification with oxygen therapy (e.g. patients with viscous secretions).
DOCUMENTATION Level of oxygen and method of delivery should be noted in the respiratory section of your assessment. In the community setting, the duration that the oxygen therapy is in use should also be doc-umented. These patients can be using long-term oxygen therapy for up to 24 hours each day.
Delivery system
Concentration Flow rate Additional information
Non-rebreathe mask
60–90% (dependent on breathing pattern)
15 l/min Can be very dry – causing dry secretions
Simple face mask
40–60% 1–15 l/min Flow rates <5 l/min can lead to CO 2 retention
Nasal cannula Low–medium dose 1–4 l/min Patients likely to experience nasal dryness with higher flow rate
Table 3.43.2 Variable flow devices

ASSESSMENT TOOLS134
It must also be documented whether additional oxygen therapy was provided during a physiotherapy assessment or treatment ses-sion and also whether the oxygen delivery device was altered or changed as part of the physiotherapy session.
●3.44 PAIN SCORE
DEFINITION Pain is subjective and as healthcare professionals we should accept that pain is what the patient tells us. Pain scores quantify the patient's perspective of pain severity and may be done by verbal report, through pointing to scales or pictures or (if a patient is unable to express themselves) based on the behaviour of the patient.
An example of a pain scoring chart is shown in Table 3.44.1 .
PURPOSE Pain scores are used to evaluate the patient's response to pain-relieving medication and to identify deterioration or improve-ment. If pain is not well controlled, this can lead to postoperative complications similar to those associated with immobility and respiratory compromise.
PROCEDURE Ask the patient to rate their level of pain severity out of 3 (where 0 = no pain and 3 is the worst pain they could imagine). Some units use a scale of 0–10.
Patients with speech problems and children may be asked to point to a picture (or scale) that represents their pain.
If the patient is unable to indicate their pain severity (e.g. because they are unconscious), the assessor may estimate pain relief based on behaviour.
Ask the patient ‘Which word describes best the pain you have when you move?’
No pain 0
Mild pain 1
Moderate pain 2
Severe pain 3
Table 3.44.1 Pain scoring chart

3.45 Palpation 135
FINDINGS Be aware of physiological responses to pain, which include increased HR, BP and RR. Therefore, if these parameters are deranged, it is important to consider the option that pain relief may not be effective during our assessment.
Note any deterioration and determine whether pain levels are accept-able. If pain is not well controlled, patients will not be able to partici-pate in assessment or treatment and this may lead to complications.
DOCUMENTATION Note the route of analgesia (e.g. epidural, patient-controlled anal-gesia) and if pain control is adequate.
●3.45 PALPATION
DEFINITION Palpation involves using your hands to assess the patient's breath-ing pattern, abdomen and limbs.
PURPOSE ● To supplement observations of breathing pattern, and help to
identify: – degree of expansion – work of breathing – sputum retention – pain or tenderness – changes in temperature – any swelling (oedema) in the area.
● To communicate with the patient and gain their confidence. ● To identify any circulatory problems, hypothermia or fever.
PROCEDURE ( Fig. 3.45.1 ) Place your hands comfortably on each of these areas in turn:
● neck and shoulder girdle ● apical (over upper ribs and upper chest area) ● lateral costal (over lower ribs and lower chest area) ● abdominal (diaphragmatic).
Palpate each area during resting breathing and repeat for deep (full) inspiration:
● use your hands to feel for depth of movement and equality of expansion during resting and maximal breathing
● note the quality and smoothness of movement and coordina-tion between the chest and abdomen

ASSESSMENT TOOLS136
● note any pain, increased muscle tension, tenderness or swelling, or sputum movement in the area
● feel the hands and feet for altered temperature and/or swelling.
FINDINGS Consider auscultation findings as well when interpreting what you feel.
Thorax and respiratory movement ● Palpation may be used to support your observations of RR and
breathing pattern. ● Presence of secretions may be felt as crackles over the affected
lung fields during breathing, particularly during expiration. Beware of very shallow breathers – these crackles may not be as obvious. Asking patients to breathe out through their mouth and to breathe more deeply may sometimes help to determine whether secretions are present as they may be more easily heard.
● Pain or tenderness may indicate recent injury or infection – manual techniques may need caution or may be contraindicated.
Fig 3.45.1 Chest wall palpation. (A) Apical palpation. (B) Basal palpation (front view). (C) Basal palpation (side view).
Top tip! If you feel secretions, you may need to address these straight away. If they are significantly obstructing the airway you should clear them before continuing with the rest of your assessment.

3.47 Percussion note 137
● Note any sign of surgical emphysema (a popping feeling like bubble wrap directly under the skin); this might be related to internal damage or pneumothorax and should be reported. Manual techniques may need caution or be contraindicated and positive pressure should be avoided.
● Paradoxical movements – inward movements of the lower ribs during inspiration may be due to ineffective diaphragmatic con-traction secondary to hyperinflation in patients with COPD. Poor coordination between abdominal movements and rib cage movements may suggest diaphragmatic fatigue, and the possibility of impending respiratory failure.
Abdomen ● If the abdomen is tight, tense or tender it may be inhibiting the
movement of the diaphragm and restricting breathing. ● In the surgical patient an ‘open abdomen’ may occur, where
the incision site is not closed. Noting this is important as this will affect the patient's ability to cough and he/she may not be appropriate to mobilize.
Upper and lower limb ● Cold peripheries (especially if they feel clammy) may be due to
significant circulatory disorders that require immediate inter-vention (e.g. circulatory shock).
● Dryness in the axilla may be due to dehydration, particularly if accompanied by a dry mouth and a drop in urine output.
● Bilateral lower limb oedema may be related to right-sided heart failure or overhydration.
● Warm skin may be due to CO 2 retention (hypercapnia). Warm, sweaty feel may indicate infection or anxiety.
DOCUMENTATION Describe what you have felt, specifying whether left or right sided.
●3.46 PEAK FLOW (See under 3.40 LUNG VOLUMES AND LUNG FUNCTION TESTS – page 120)
3.47 PERCUSSION NOTE ● DEFINITION
The sound heard when striking the chest wall briskly with the fin-gers to detect the presence or absence of air in the thorax.

ASSESSMENT TOOLS138
PURPOSE This technique is particularly useful (along with other clinical find-ings) for indicating pleural effusion, consolidation, emphysema or pneumothorax.
PROCEDURE ● Place the fingers of your non-dominant hand flat along the chest
wall in between the ribs, with slightly hyperextended fingers and a firm pressure. Strike the middle finger with the middle fingertip of your cupped dominant hand with a ‘bouncing’ action caused by a flick of the wrist. (This technique is the same as when ‘sounding’ a wall to see if it is hollow (plasterboard) or solid; Fig. 3.47.1 .)
● Repeat the process in a systematic manner over the lung fields as with auscultation (see 3.3 Auscultation) and note the degree of resonance you feel/hear.
FINDINGS ● A dull sound and a solid feel (like tapping on a brick wall) sug-
gests absence of air in the region, e.g. when percussing over the liver (right anterior, subcostal).
Fig 3.47.1 Percussion technique.
Top tip! Practise your percussion technique over normal lung tissue (resonant), then compare this by percussing over the liver or the clavicle (dull). This will help you to differentiate between the two sounds.

3.48 Pulse oximetry 139
● A resonant sound and a vibrant feel (like tapping on a stud/plasterboard wall) suggests the presence of air in the region, e.g. when percussing over the lung fields.
● If you percuss over lung tissue but the sound and feel is more like over the liver, this suggests absence of air in that region, which could be due to consolidation (as with lobar pneumo-nia), lung collapse or pleural effusion.
● If your percussion sounds very resonant (more so than usual, or more than the same lung zone on the opposite side), this is called ‘hyper-resonant’ (or ‘tympanic’ as it has a slightly musical quality) and suggests more air in the lung or pleural space. This could be due to hyperinflation as in emphysema or asthma or, if only on one side, a pneumothorax.
● Consider alongside auscultation findings.
DOCUMENTATION Record the resonance (e.g. dull, resonant or hyper-resonant) in different lung zones (e.g. anterior or posterior, upper, middle or lower lobes).
●3.48 PULSE OXIMETRY
DEFINITION Pulse oximetry is the non-invasive measurement of estimated saturation of arterial Hb with oxygen. The pulse oximeter has a probe that can be attached to the fingertip or ear lobe that senses and displays the patient's pulse rate (HR) and oxygen saturations. Light generated by the probe is absorbed by Hb in the pulsating capillary (approximating arterial blood) in a pattern that depends on its percentage saturation with oxygen. This is calculated and displayed as the S p O 2 (oxygen saturation of pulsating blood), also known as saturations (or sats) ( Fig. 3.48.1 ). Saturations (sats) can also be measured directly (invasively) from arterial blood and recorded as S a O 2 (see 3.1 Arterial blood gases).
PURPOSE Oximetry allows for continuous monitoring of S p O 2 in the critically ill patient. It can be used to monitor the patient's response to exer-cise and activity in hospital and community settings. It can also be used to make treatment decisions (e.g. the need for oxygen ther-apy; see 3.43 Oxygen delivery), ensuring safety/effectiveness of interventions (e.g. position change), as an outcome measure (e.g. following manual chest clearance) and to aid exercise prescription.

ASSESSMENT TOOLS140
PROCEDURE ● Clean the probe with appropriate wipes. ● Check that the patient's finger is clean and remove any dark nail
polish. ● Ask the patient to rest his/her hand (e.g. on their upper abdo-
men or chest) and remain still to prevent movement ‘artefacts’ affecting the measurement.
● Check that the finger is pink and warm – rub the finger to warm it if necessary.
● Place the probe over the fingertip with the light emission point next to the fingernail.
● Check that the probe is picking up the HR accurately compared with the manual pulse.
It can sometimes take some time for the machine to settle and get an accurate reading. In the acute setting, if the reading is not normal for the patient, you should seek help as the patient may be acutely unwell and need prompt attention.
If leaving the patient unattended with the device, check that the alarms are set appropriately.
FINDINGS S p O 2 tells you how ‘full’ the Hb is but does not necessarily tell you whether a patient does or does not have enough oxygen, because this will also depend on the amount of functioning Hb present. Patients with anaemia have less Hb, so, even with a S p O 2 of 98%, oxygen content could be inadequate. Conversely, patients with
Fig 3.48.1 A portable pulse oximeter with finger probe. Note on the display read out, the top figure is heart rate and the bottom figure is S p O 2.

1413.49 Pupils
high levels of Hb (e.g. some chronic respiratory patients) may have adequate oxygen content with very low S p O 2 .
Normal S p O 2 on air is above 95%, so anything less than this should be investigated. Less than 92% is significant (in patients with no pre-existing respiratory disease) and oxygen therapy should be considered, but expect slightly lower values in elderly patients, heavy smokers and during sleep. Look for trends and report any deterioration (e.g. a consistent S p O 2 of 90% may be less worrying in some cases than saturations that have suddenly dropped from 98% to 92%). Patients with reduced cardiac output should normally have S p O 2 maintained above 94%. In the chronic respiratory patient hypoxaemia may not be significant until S p O 2 drops below 80–85% owing to increased Hb.
DOCUMENTATION This should be recorded in the respiratory section of the assessment.
Record S p O 2 measurement, the patient's position and any activ-ity undertaken. Note inspired oxygen concentration during mea-surement and the type of oxygen delivery device, if used.
●3.49 PUPILS (SEE ALSO 3.33 GLASGOW COMA SCACE)
DEFINITION Pupil size and reactivity (response to light) is important in neu-rological assessment. Changes may reflect pressure on the nerves of the eye (optic and oculomotor) or an increased pressure within the cranium (skull) or the effect of some drugs.
PURPOSE Pupillary assessment allows physiotherapists to monitor changes in a patient's status as this may require an urgent response, e.g. may indicate a neurological deterioration. This is often recorded alongside GCS (see 3.33 Glasgow Coma Scale) using a scale such as the one in Fig. 3.49.1 .
PROCEDURE ● To assess pupils you need a pen-torch. ● If the patient is sedated/asleep you will have to hold the eye-
lids open. ● Observe the pupils for size and shape. ● Briefly shine a light into the eyes, noting whether they react
both when the light is shining and once taken away.

ASSESSMENT TOOLS142
FINDINGS ● Normal pupils will constrict to light; this is marked as ‘+’ on the
record sheet. If there is no reaction, it is marked as ‘−’. ● A slowed response can be described as sluggish and is marked
as ‘+/−’ or ‘s’. ● Normal pupil size is 2–3 mm. Fixed dilated pupils are a very poor
sign and may indicate brain stem death. However, the drugs a patient is receiving may adversely affect pupil reaction. For exam-ple, the heavy sedative thiopentone can cause fixed dilated pupils, as can atrovent nebulizers if they get into the eye, and opiates (e.g. morphine) can cause pinpoint pupils. It is also important to know whether the person has any previous eye problems as this may distort the assessment, e.g. cataract surgery.
Any change in reaction should always be highlighted to senior col-leagues, particularly fixed, sluggish or unequal responses as these may reflect an acute change in status requiring prompt action.
DOCUMENTATION Pupil size and reactivity should be recorded in the CNS section of your assessment. A normal pupillary response on assessment is often writ-ten as PEARL – or pupils equal and reactive to light. Any change in status since last review or during intervention should also be noted.
●3.50 QUALITY OF LIFE QUESTIONNAIRES
DEFINITION There are a number of questionnaires and scales that have been designed to quantify the impact of respiratory disease on the patient's life.
Pupil chart
1mm 6mm
2mm 7mm
3mm 8mm
4mm 9mm
5mm 10mm
Fig 3.49.1 Pupil size chart.

1433.50 Quality of life questionnaires
PURPOSE These are used mainly as outcome measures to test the effective-ness of medical and pharmacological treatments and other inter-ventions such as pulmonary rehabilitation programmes. They aim to capture the patient's perspective and relate to their social par-ticipation. Outcome measures focus on body, structure and func-tion. ‘QoL’ questionnaires relate to a patient's perspective and their social participation: they are more client-centred and poten-tially more relevant.
These questionnaires may also be used as a starting point when helping set patient goals for physiotherapy treatments.
PROCEDURE Choose the questionnaire that seems most appropriate for the patient or the one currently used by your department for audit. Some questionnaires are ‘disease specific’ whereas others are ‘generic’ to many diseases. Respiratory disease-specific question-naires tend to focus on the problems that breathlessness causes in everyday life.
Some commonly seen questionnaires ● St Georges Respiratory Questionnaire for COPD (SGRQ-C) ● Pulmonary Functional Status and Dyspnoea Questionnaire
(PFSDQ) ● Chronic Respiratory Disease Questionnaire (CRQ) ● Short Form Chronic Respiratory disease Questionnaire (SF CRQ) ● Short Form 36 (SF 36) ● Asthma Quality of Life questionnaire.
Questionnaires may be left with the patient to complete, or may be completed by an interviewer working with the patient. This option is particularly important for patients who are unable to read and write or who have cognitive problems and may need further prompting. Decide on the most appropriate option for your patient.
FINDINGS Most questionnaires have a standardized scoring scheme and information regarding the significance of the scores and what would constitute a clinically valid effect from treatment.
DOCUMENTATION Record time of completion and score. Note any issues affecting the patient such as a current infection or any emotional upset.

ASSESSMENT TOOLS144
OBTAINING THE QUESTIONNAIRES ● St Georges Respiratory Questionnaire (SGRQ-C). Available at:
P.W. Jones, PhD FRCP, Professor of Respiratory Medicine, St George's University of London, Cranmer Terrace, London SW17 ORE, UK; Tel.: +44 (0) 20 8725 5371; http://www.healthstatus.sgul.ac.uk/SGRQ_download/SGRQ-C%20English%202008.pdf
● Pulmonary Function and Dyspnoea Questionnaire (PFSDQ). Available at: Ms S.C. Lareau, Pulmonary Clinical Nurse Specialist, Jerry L. Pettis Memorial Veterans Hospital, 11201 Benton Street, Loma Linda, CA 92357, USA; Email: [email protected]. gov
● Chronic Respiratory Disease Questionnaire (CRDQ, CRQ). Available at: Jane Howe, Licensing Officer, Office of Research Contracts & Intellectual Property, McMaster University, GH 306G, 1280 Main Street, W. Hamilton, Ontario, Canada L8S 4L8; Email: [email protected]
● Asthma Quality of Life Questionnaire. Available at: Qoltech, Professor Elizabeth Juniper/Mrs Jilly Styles, 20 Marcuse Fields, Bosham PO18 8NA, UK; http://www.qoltech.co.uk/obtaining.html
● SF 36, modified version. Available at: RAND Health Commu-nications, 1776 Main Street, PO Box 2138, Santa Monica, CA 90407-2138, USA; http://www.rand.org/health/surveys_tools/mos/mos_core_36item_survey.html
●3.51 RATING OF PERCEIVED EXERTION (RPE)
DEFINITION A numeric scale used to rate the level of effort (exertion) felt by the patient/participant during a particular exercise or activity.
PURPOSE Used during exercise testing to identify the patient's response at each stage as a supplement to, or instead of, HR. Also used to pre-scribe and monitor appropriate exercise intensity for patients par-ticipating in exercise programmes and as an outcome measure for research. It is particularly useful where HR response to exercise is not reliable, such as with patients on β -blocking drugs or people with respiratory limitations to exercise.
PROCEDURE Two scales are frequently used: Borg (original) RPE and Borg (revised) CR10. (These scales can also be adapted to rate breath-lessness, see 3.8 Breathlessness measurement.) Table 3.51.1 sum-marizes both of these scales.

3.51 Rating of perceived exertion (RPE) 145
● Choose a scale and print in large font so it can easily be seen by the patient during the exercise.
● Ask the patient to familiarize themselves with the scale and then choose (call out or point to) the number that best describes the amount of ‘effort’ or ‘exertion’ they feel they are making during the exercise. They should focus on how heavy or strenuous the exercise feels overall rather than on any specific symptoms.
● This can be repeated at every level during an exercise test or during regular intervals (e.g. every minute).
FINDINGS This is a subjective measure of how the individual feels, and may vary from person to person, so ideally the RPE should be consid-ered in conjunction with HR. There is normally good correlation between RPE and HR, so that, for most people, their HR will be approximately 10 times their RPE score (providing the original scale is used). If you have measured both during a test you could look to see whether this correlation was demonstrated. If not,
Borg RPE scale Borg CR10 scale
6 No exertion at all 0 Nothing at all
7 Very, very light 0.3
8 0.5 Extremely weak (just noticeable)
9 Very light 1 Very weak/light
10 1.5
11 Fairly light 2 Weak (light)
12 3 Moderate
13 Somewhat hard 3.5
14 4.5
15 Hard 5.5
16 6.5
17 Very hard 7.5
18 9
19 Extremely hard 10 Extremely strong, almost maximal
20 Maximal exertion * maximal
Table 3.51.1 Borg RPE scale and Borg CR10 scale
Adapted from Borg Perception.

ASSESSMENT TOOLS146
your participant might be underestimating or overestimating the intensity of exercise and may need to be encouraged to work less hard or to work harder, depending on what is most appropriate for them. When prescribing exercise we normally encourage peo-ple to work at a ‘moderate’ to ‘somewhat severe’ intensity (12–14 on the RPE scale or 3–4 on the CR10 scale), so you can help your patient to ‘learn’ what constitutes an appropriate level by practis-ing using this rating scale and giving them feedback.
DOCUMENTATION When recording, it is important to state which scale is being used and to record the RPE alongside the corresponding intensity of exercise/stage of exercise test.
FURTHER READING Borg, G., 2004. The Borg CR10 Scale. Borg Perception, Hässelby,
Sweden. For information about scale construction, administration, etc., see Borg G., 1998. Borg's Perceived Exertion and Pain Scales. Human Kinetics, Champaign, IL. Scales and instructions can be obtained for a minor fee from Dr G. Borg. E-mail: [email protected]
Centres for Disease Control and Prevention, 2010. Physical Activity for Everyone. Available at: http://www.cdc.gov/physicalactivity/everyone/measuring/exertion.html
●3.52 REFLEXES
DEFINITION An involuntary and nearly instantaneous muscle contraction in response to a stimulus, e.g. a tap by a patellar hammer. Reflexes are used to review various aspects of the patient's neurology.
PURPOSE Some reflexes that may be used in respiratory care are:
● Reflexes to protect the airway : coughs and sneezes are reflexes developed to protect the airway as a result of mechanical stimulation. Swallow is a complex reflex to protect the airway while eating or drinking (see 3.19 Cough assessment and 3.60 Swallow assessment).
● Reflexes to review neurology : reflex tests are used in a variety of clinical situations to form part of a wider assessment. This is often carried out alongside assessment of dermatomes, myo-tomes and muscle grading (see appropriate sections). If there is

3.52 Reflexes 147
muscle weakness, reflex testing aids in distinguishing between muscle wasting and neurological damage. This may be in the trauma patient or the neurologically impaired. The results may affect how the patient is managed at a later stage and changes in reflexes should be reported to the team. Some examples fol-low; this is by no means a comprehensive list and the reader is directed to other texts for more detail: – Pupil reflex: used to check for brain stem function, often
used if a patient shows signs of neurological deterioration (see 3.49 Pupils).
– Deep tendon reflexes (e.g. patella or knee-jerk reflex): used to check the integrity of the reflex arc and the nerve supply of the muscle being tested. This may form part of a compre-hensive assessment in critical care.
PROCEDURE ● Pupil reflex: see 3.49 Pupils for procedure and findings. ● Deep tendon reflexes: a gentle tap is applied to the tendon
with a patella hammer; see Further reading for details of the procedure.
● Plantar reflex: a blunt instrument is drawn up the lateral border of the foot from heel to toe; see Further reading.
FINDINGS ● Deep tendon reflexes: one side should be compared with the
other. ● Plantar reflex: in health the great toe will flex. This response
may be absent or the toe may extend in patients with upper motor nerve lesions or damage.
DOCUMENTATION ● Deep tendon reflexes are described as ‘normal, brisk, absent or
slow’. Record whether right and left are the same. ● Plantar reflex is recorded as normal, absent or upgoing plantar.
Record whether the right and left are the same.
FURTHER READING Day, R., Fox, J., Paul-Taylor, G., 2009. Neuro-musculoskeletal
Clinical Testing: A Clinician's Guide. Churchill Livingstone, Edinburgh, UK.
Jones, K., 2011. Neurological Assessment: A Clinician's Guide. Churchill Livingstone, Edinburgh, UK.

ASSESSMENT TOOLS148
3.53
● RENAL FUNCTION (See under 3.6 BLOOD RESULTS
and 3.31 FLUID BALANCE – pages 49 and 102)
●3.54 RESPIRATORY PATTERN (SEE ALSO 3.55 RESPIRATORY RATE)
DEFINITION The term used by physiotherapists when referring to the observed movements and muscle activity in the thorax (ribs and sternum), shoulder girdle and abdomen during the cycles of inhalation and exhalation is often referred to as the respiratory pattern.
PURPOSE Observation and monitoring of breathing pattern provides infor-mation regarding the possible underlying respiratory disease and can, along with RR, also detect any change in a patient's condition (improvement or deterioration).
PROCEDURE ● Assess alongside RR (see 3.55 Respiratory rate). ● Try to observe without drawing the patient's attention to their
breathing as this is likely to cause it to change. ● If dignity and warmth allow, the patient should be undressed
from the waist up. ● Observe from both the front and the side of the patient. ● Monitor the overall rise and fall of the chest wall and determine
the degree of contribution from the upper chest area (ribs 1–7), the lower chest area (ribs 8–12) and the abdomen.
● Note the patient's posture and any movement of the shoulder girdle (e.g. protraction, elevation).
● Observe the neck and shoulders for signs of muscle activity in the accessory muscles, e.g. sternomastoid, scalenes or pectoralis major during inspiration.
● Observe and palpate the abdomen for any signs of abdominal muscle activity during expiration.
● Observe the head and face for signs of effort, nostril flaring or head bobbing movement.
● Monitor breathing pattern during resting breathing and also during deep breathing manoeuvres.
● During assessment and treatment any changes in breathing pattern can be observed, e.g. change in breathing pattern in response to exercise or in response to nasopharyngeal suction.

149
FINDINGS See Table 3.54.1 .
Breathing pattern Definition/description
Tachypnoea See 3.55 Respiratory rate
Bradypnoea See 3.55 Respiratory rate
Apnoea Total cessation of breathing for greater than 10 seconds
Hypopnoea Term used to describe shallow breathing (<50% of normal) for greater than 10 seconds
Hypoventilation Reduced total ventilation (rate × tidal volume). Most commonly seen with sedation or opiate analgesia. Normally causes a rise in arterial carbon dioxide ( P a CO 2 )
Hyperventilation Increased total ventilation (rate × tidal volume). Most commonly seen with anxiety, pain or hyperventilation syndrome. Normally causes a reduction in arterial carbon dioxide ( P a CO 2 )
Pursed lip breathing
The patient will be seen to oppose their lips during expiration in order to maintain pressure within the thorax and prevent the smaller airways from collapsing (also known as intrinsic PEEP). This is often seen in patients with severe COPD or other airways diseases
Accessory muscle use
Accessory muscles in the neck or shoulder region suggest increased work of breathing that may be related to lung hyperinflation and chronic obstructive disease
Apical breathing When respiratory movement is mainly seen in the upper chest and shoulder area this may be associated with increased respiratory effort and/or anxiety or stress
Diaphragmatic or lower chest breathing
When respiratory movements mainly occur in the lower chest region or abdomen, this may be associated with a more relaxed and efficient pattern with less effort involved
Localized hyperinflation
May signify a pneumothorax (check breath sounds (see 3.3 Auscultation))
Table 3.54.1 Breathing pattern definitions
(Continued)
3.54 Respiratory pattern

ASSESSMENT TOOLS150
DOCUMENTATION The respiratory or breathing pattern should be recorded in the respiratory section of your objective assessment alongside RR. Any recent changes in breathing pattern should also be recorded especially if there has been a noticeable increase or decrease in the rate, or change in pattern of exhalation and inhalation. Any changes in breathing pattern when undergoing physiotherapy should be documented, as well as the time taken for the breathing pattern to return to baseline and whether any additional treatment was required to allow the pattern to return to baseline.
Breathing pattern Definition/description
Reduced expansion or shallow breathing
May suggest restrictive problems such as fibrosing lung disease, muscle weakness or reduced movement due to abdominal distension Unilateral reduced movement may be due to atelectasis, consolidation or localized fibrosis
Increased respiratory movement
At rest suggests increased minute volume. The patient may be hyperventilating (overbreathing), or there may be increased demand for respiration due to infection or injury
Cheyne–Stokes respiration
Irregular breathing with cycles consisting of a few relatively deep breaths followed by a period of progressively shallower breaths (sometimes to the point of apnoea), and then a gradual return to deeper breaths. This is often associated with heart failure, severe neurological disturbances or drugs (e.g. narcotics)
Kussmaul's respiration
Rapid, deep breathing with high minute ventilation (rate × tidal volume). Commonly seen in patients with metabolic acidosis
Ataxic breathing Consists of haphazard, uncoordinated deep and shallow breathing. This may be found in patients with cerebellar disease
Apneustic breathing
Characterized by prolonged inspiration, and is usually the result of brain damage
Table 3.54.1 Breathing pattern definitions—cont'd

1513.55 Respiratory rate (RR)
●3.55 RESPIRATORY RATE (RR)
DEFINITION RR is the number of breaths (inhalation and exhalation) taken in 1 minute. It is usually determined by counting the number of times the chest rises or falls per minute, although it may be moni-tored by a spirometer or capnometer.
PURPOSE A patient's RR is one of the most important clinical assessments as it can give a clear indication of the patient's clinical condition.
A raised RR is a strong and specific predictor of serious adverse events such as cardiac arrest and unplanned ITU admission. An adult with a RR of over 20 breaths per minute at rest is prob-ably unwell, and an adult with a RR of over 24 breaths per minute at rest is likely to be critically ill.
PROCEDURE ● Assess alongside respiratory pattern (see 3.54 Respiratory pattern). ● Try to observe without drawing the patient's attention to their
breathing as this is likely to cause it to change. ● Count the number of breaths taken during 1 minute. (Counting
for only 15 seconds and multiplying by 4 or any other similar technique is not an accurate measure.)
● Non-invasive monitoring equipment may not be accurate for calculating RR.
FINDINGS ● The normal range is 12–16 breaths per minute. ● It is normal for RR to rise during exercise, excitement, pain and
fever. It declines during relaxation and sleep. ● Tachypnoea is defined as a RR of greater than 20 breaths per
minute, whereas bradypnoea is defined as a RR of less than 10 breaths per minute.
● Respiratory apnoea occurs when no breaths are taken or the chest fails to rise or fall. Prolonged apnoea will result in a respi-ratory arrest and is a medical emergency.
Top tip! RR is often the first sign of any improvement or deterioration in the patient's condition.

ASSESSMENT TOOLS152
A patient's RR is a key indicator as to the stability of a patient to undergo physiotherapy treatment. As previously mentioned, it is normal for RR to rise during exercise (including walking) or many physiotherapy treatments (e.g. manual techniques or suction). The degree of rise will be dependent on the patient's exertion. In the absence of illness, this RR will return to normal within a few minutes of ceasing the activity.
Tachypnoea (high breathing rate) can be seen in any form of lung disease and is associated with an increase in work of breath-ing due to increased turbulence in the airways. Tachypnoea can lead to respiratory alkalosis as a result of a reduction in partial pressure of carbon dioxide ( P a CO 2 ). It may also occur with meta-bolic acidosis when the respiratory system is attempting to com-pensate for a metabolic failure.
Bradypnoea (low breathing rate) is a relatively uncommon find-ing, and is usually due to CNS depression by narcotics, sedatives (e.g. morphine) or trauma (e.g. head injury or brain stem infarct). This often leads to an increase in P a CO 2 and therefore leads to respiratory acidosis (see 3.1 Arterial blood gases). Bradypnoea may also be seen in severe chronic bronchitis, when the patient may breathe more slowly to reduce their work of breathing.
DOCUMENTATION The RR should be recorded when documenting a patient's vital signs alongside respiratory pattern. Any recent changes in RR should also be recorded, especially if there has been a noticeable increase or decrease in the rate. Any changes in RR when under-going physiotherapy should be documented, as well as the time taken for RR to return to baseline and whether any additional treatment was required to allow the RR to return to baseline.
●3.56 RESUSCITATION STATUS
DEFINITION The medical team may categorize the patient's status according to whether or not they should be given resuscitation (basic life support). This is commonly shortened to ‘resus status’. It should also be recorded what active treatments are to be provided such as medication (e.g. antibiotics), NG feeding or suction.
PURPOSE Physiotherapists must understand the limitations of treatment and thus adjust their approach accordingly.

3.56 Resuscitation status 153
PROCEDURE Although physiotherapists may be asked their opinion with regard to resuscitation, it is only a senior doctor (generally senior registrar or consultant) who can document a ‘not for resuscitation’ order.
Commonly used terms are:
● Do not attempt resuscitation (DNAR) ● Not for resuscitation (NFR)
Do Not Attempt Cardiopulmonary Resuscitation Order(This form to be kept in the front of the medical records)
Appendix 2
Patient Details
Admission DateAddress label
Patient has refused CPRPatient is clearly in the terminal phase of illnessThe burdens of treatment outweigh the benefits
Reason for DNAR order
This decision must be documented in writing below
Communication with patient/family:
Date of Decision:
Primary Nurse/Senior nursing staff informed:Name:
Yes No
Consultant/GP informed of decision:
Signature:
Interim Signature:*
Review Date: bybybybyby
Consultant/GP
Registered Medical Practitioner
*If consultant/GP has not been contacted at the time of decision
Yes No
Decision by:Consultant/GP (print)
Hospital
Ward
Fig 3.56.1 Example resuscitation form.Used with permission from Cardiff and Vale University Health Board

ASSESSMENT TOOLS154
● Tender loving care (TLC): for supportive care or just to keep comfortable (no other medical interventions); at this point, many hospitals will use an end-of-life pathway.
FINDINGS If a patient is not for resuscitation or there are limitations of care in place, this should be clearly marked at the front of their notes on a resuscitation form ( Fig. 3.56.1 ). If there is no comment on resuscitation status it should always be assumed that the patient is for full active care.
DOCUMENTATION A patient's resuscitation status (and if it changes) should be high-lighted clearly in your physiotherapy database.
3.57
● SEDATION/AGITATION SCORE (SEE ALSO 3.39
LEVEL OF CONSCIOUSNESS)
DEFINITION A scale used to assess sedation and agitation levels in hospital patients – especially critical care areas.
PURPOSE Sedation is used to allow good management of pain, anxiety and sleep. This enables patients to tolerate the hospital environment (be it the ward or critical care) and also the procedures that are required for their management and treatment.
In a critically ill patient, agitation, confusion, or both can result from the original medical condition or from medical complica-tions, or can be the consequence of treatment or the environment. Critical care patients may be agitated, confused, uncomfortable or suffering from critical care delirium. This may affect how they interact with those around them or their ability to participate in treatment.
PROCEDURE The patient is scored against set criteria, which will depend upon the scale being used. This is a subjective scale and two common examples are reflected in Table 3.57.1 .

1553.57 Sedation/agitation score
FINDINGS Changes in score may reflect the level of sedation that the patient requires. If there has been no change in medication and the score deteriorates, this may be due to worsening in the patient's condi-tion. As can be seen from the two common examples, there are very different interpretations for each numbered value, e.g. ‘6’ can mean agitated or unresponsive! It is, therefore, very important to note which scale you are using. Remember that physiotherapy intervention can be a stimulus and that sedation score may change with treatment.
DOCUMENTATION The sedation score should be noted in the CNS section of your assess-ment along with any change in status during your intervention.
Ramsay sedation score Riker Sedation–Agitation Scale
1. Patient is anxious and agitated or restless, or both
7. Dangerous agitation: pulling at ETT, trying to remove catheters, climbing over bedrail, striking at staff, thrashing side-to-side
2. Patient is cooperative, oriented and tranquil
6. Very agitated: requiring restraint and frequent verbal reminding of limits, biting ETT
3. Patient responds to commands only
5. Agitated: anxious or physically agitated, calms to verbal instructions
4. Patient exhibits brisk response to light glabellar tap or loud auditory stimulus
4. Calm and cooperative: calm, easily arousable, follows commands
5. Patient exhibits a sluggish response to light glabellar tap or loud auditory stimulus
3. Sedated: difficult to arouse but awakens to verbal stimuli or gentle shaking, follows simple commands but drifts off again
6. Patient exhibits no response
2. Very sedated: arouses to physical stimuli but does not communicate or follow commands, may move spontaneously
1. Unarousable: minimal or no response to noxious stimuli
Table 3.57.1 Sedation scores

ASSESSMENT TOOLS156
FURTHER READING Ramsay, M.A., Savege, T.M., Simpson, B.R., Goodwin, R., 1974. Contr-
olled sedation with alphaxalone-alphadolone. Br. Med. J. 2, 656–9. Riker, R., Pickard, J., Fraser, G., 1999. Prospective evaluation of the
Sedation-Agitation Scale for adult critically ill patients. Crit. Care Med. 27, 1325–9.
●3.58 SPUTUM ASSESSMENT
DEFINITION A subjective review of the volume and nature of secretions cleared by the patient.
PURPOSE There are many patients who clear sputum as a matter of course (e.g. COPD or bronchiectatic patients). An early sign of an exacerbation can be a change in the nature or volume of the sputum they produce. Changes in sputum may also indi-cate an improvement or deterioration in patients with acute respiratory infection and the patient's response to treatment.
PROCEDURE This information would be gained either in discussion with the patient or by examining what the patient is expectorating
FINDINGS Sputum volume
An estimate of the volume can be made in discussion with the patient. This tends to be done in terms which the patient can understand, either in teaspoon or cups. A teaspoon has the volume of 5 ml. Has there been a change in the volume of sputum that the patient is producing?
Within critical care many units have a scale as to the volume cleared on suction:
● 1 = minimal (barely in the suction catheter) ● 2 = moderate (gets to the head of the suction catheter) ● 3 = copious (gets beyond catheter into the suction tubing).
Colour Has there been a change in the colour of the sputum being produced? The colour is an indication of the clinical pathology, for example:
● white = minimal infection ● yellow or green = infection
1573.59 Surgical incisions
● red = haemoptysis (fresh blood) ● brown = previous haemoptysis or lung tissue damage (old blood).
Large volumes of fresh blood must be reported to the medical team immediately.
Within critical care many units will use a code to describe colour of sputum:
● M = mucoid (clear secretions) ● P = purulent (this means coloured sputum) ● MP = mucopurulent (mixture of M and P) ● B = bloodstained (this may mean flecks of blood or plugs).
Viscosity (rheology) or ease of expectoration The rheology can be formally measured, but this is not often the case in clinical practice. Simple observation of the sputum will give an indication of the viscosity. Does the sputum move in the pot? If not, it is viscous. Does the patient find it easy to clear? Is it difficult to get the sputum up a suction catheter? Again, these would indicate that the sputum was more viscous and so harder to clear.
Smell Anaerobic bacteria or fungal infections may well produce an offen-sive smell, which should be documented.
Taste There is no suggestion at this point that you should taste the spu-tum! However, as in terms of smell, there may be occasions when the patient reports an unpleasant taste in their mouth.
DOCUMENTATION Document sputum production under the headings suggested above in the respiratory section of your assessment and also as an outcome of treatment.
For example:
● ‘Normally clears clear yellow sputum easily’ ● ‘Large volumes of sticky green sputum cleared on suction (3MP)’.
●3.59 SURGICAL INCISIONS
DEFINITION The site of entry or wound for an operative procedure.

ASSESSMENT TOOLS158
PURPOSE Knowledge of incision sites allows physiotherapists to identify patients who are at high risk of postoperative pulmonary compli-cations. Although some operations have a relatively small incision they can have a huge impact on respiratory function!
PROCEDURE An example of common incision sites is shown in Fig. 3.59.1 .
FINDINGS Thoracic and high abdominal incisions will have the greatest impact on the respiratory system. Alongside incision site, pain management should also be considered (see 3.44 Pain score) as both these factors will affect the patient's ability to partici-pate in treatment. Low abdominal and pelvic incisions have a lower risk of pulmonary complications but a higher risk of DVT.
DOCUMENTATION When documenting operation notes in your physiotherapy notes, you should include the incision site and findings of the surgery.
A B
Mediansternotomy
Lateralthoracotomy
Limitedthoracotomy
Left transverselumbar
(nephrectomy)Suprapubic
ThoracolaparotomyLower midline
Bilateral subcostalwith medianextension(liver transplant)
Left paramedian(laparotomy)
Right subcostal(opencholecystectomy)
Horizontaltransabdominal
Appendicectomy
Right inguinal(hernia repair)
Fig 3.59.1 (A,B) Surgical incisions. Reproduced with kind permission from Pryor JA, Prasad SA. 2008 Physiotherapy for Respiratory and Cardiac Problems, 4th Edn. Edinburgh, UK: Churchill Livingstone.

3.60 Swallow assessment 159
3.60 ● SWALLOW ASSESSMENT
DEFINITION An evaluation of a patient's bulbar function (ability to swallow) to ascertain whether a patient is likely to aspirate (food or fluid going into the respiratory tract).
PURPOSE Swallowing is a combination of several phases and disruption of any one of these can affect safe swallowing. Patients with oropha-ryngeal muscle weakness, swelling or loss of airway protective reflexes are at risk of aspiration. At-risk patients include those with acute neurological conditions (such as stroke and head trauma) or chronic neurological diseases (such as motor neurone disease and dementia) and following head and neck surgery. Patients with a tracheostomy are also at greater risk of aspiration. Physiotherapists need to be aware of patients with swallowing difficulties as they are also likely to have problems with secretion management and sputum clearance. It is also important to know whether a patient has been designated as nil by mouth (NBM) because of problems with swallowing.
PROCEDURE A formal swallow assessment should only be carried out by clin-ical staff with appropriate training, i.e. a speech and language therapist.
FINDINGS Patients who are unable to swallow safely will be designated as NBM. Physiotherapists often work closely with speech and language therapists, and, once a patient is recommenced on an oral intake, we may be asked to keep a close eye on respi-ratory function. Those patients who are NBM are often very dry, and this can have an effect on the viscosity (thickness) of secretions.
DOCUMENTATION If a patient has a compromised swallow this should be documented in the database of your notes and any change in function clearly marked on subsequent assessments.

ASSESSMENT TOOLS160
●3.61 TPR (TEMPERATURE, PULSE AND RESPIRATION) CHART
DEFINITION A record of repeated measurements of body temperature, pulse, RR and blood pressure in a graphical format (additional information may include fluid balance, blood results, pain or sedation scores and early warning scores) ( Fig. 3.61.1 ).
PURPOSE Used for monitoring patients in hospital wards or those receiving frequent nursing at home. Identifies any trends or patterns that indicate the patient's health status (e.g. stable, variable, recov-ering or deteriorating). Helps determine suitability for phys-iotherapy treatment. It has particular importance in the early identification of the deteriorating patient at risk of critical illness or death.
PROCEDURE Although normally a nursing procedure, physiotherapists may be required to take these measurements and/or fill in the chart, e.g. when visiting patients as part of a ‘hospital at home’ scheme or when attending a patient who appears acutely unwell.
Body temperature ● Do not measure within 1 hour of the patient having a bath or
vigorous exercise. ● Wait 20 minutes before measuring after a hot or cold drink (if
using the mouth). ● Electronic thermometers can be used at the mouth, axilla, ear
or rectum and give a digital display. Follow the instructions for individual devices.
● Clean the thermometer with an alcohol wipe or as directed by infection control: – Mouth: place under the tongue and close the mouth. Leave
it in place for 3 minutes (or until it beeps). – Axilla: place the thermometer in the armpit, with the arm
pressed against the body for 5 minutes before reading. – Ear: place a new cover over the probe, place the probe in the
ear and press the start/measure key. A digital readout will appear when the machine beeps ( Fig. 3.61.2 ).
● Plastic strip thermometers change colour to indicate tempera-ture. Place the strip on the forehead and read it after 1 minute while the strip is in place.

3.61 TPR (temperature, pulse and respiration) chart 161
Ward/DeptScore
DateHour
Accept < />
Sig
Inspired O2
Date
Name:
Respiratory Rate
TPR chart
Accept < />
Sig Date
O2 Saturations
Accept
Note record both systolicand diastolic pressures butuse systolic only to scoreNote: In atrial fibrillationmeasure the BP manually
< />
Bp of
Accept systolic
For this patient
< />
of bpm
Accept Heart rate
for as normal for thispatient
< />
Accept AVPU of < />
Sig Date
Sig Date
Sig Date
Sig
Limb CMS – Indicateleft or rightCheck with T.O.
AlertVoicePainUnresponsiveBM
ColourMovementSensationLeft
3
3 1 1 1
210Nausea y/n
RightSLR, 4 hourly refer tpcare plan
Pain /sedation scoreRecord:Pain as X in boxSedation as 0 in box
Epidural site checkOBS Performed byQualified Signature
Date
Temperature
Blood Pressure
Heart Rate
Neuro
EWS total score
1 2 3
>30
1/86 8 10 12
>92%90–9285–89
<9
>39
>200190180170160150140130120110100908070605040
15014013012011010090807060504030
38373635
<85
26–3021–25 21
93 94 98 99
2418 1910–20
12°8°6°4°2°1°
<1°
12°8°6°4°2°1°
<1°
12°8°6°4°2°1°
<1°
12°8°6°4°2°1°
<1°
12°8°6°4°2°1°
<1°
12°8°6°4°2°1°
<1°
12°8°6°4°2°1°
<1°
12°8°6°4°2°1°
<1°
12°8°6°4°2°1°
<1°
12°8°6°4°2°1°
<1°
12°8°6°4°2°1°
<1°
12°8°6°4°2°1°
<1°
12°8°6°4°2°1°
<1°
12°8°6°4°2°1°
<1°
12°8°6°4°2°1°
<1°
12°8°6°4°2°1°
<1°
12°8°6°4°2°1°
<1°
12°8°6°4°2°1°
<1°
12°8°6°4°2°1°
<1°
12°8°6°4°2°1°
<1°
Fig 3.61.1 Temperature pulse and respiratory rate chart (also known as a TPR or vital signs chart). Different hospitals use alternative charting systems. Of note this chart includes both early warning and pain scores.Used with permission from Cardiff and Vale University Health Board

ASSESSMENT TOOLS162
Pulse (HR) ● Pulse may be taken manually or using automated machines along-
side BP measurements. For procedure, see 3.34 Heart rate.
Respiration ● For procedure, see 3.55 Respiratory rate.
Blood pressure ● For procedure, see 3.5 Blood pressure.
FINDINGS Body temperature
● Temperature may vary, so it is important to find out what is normal for the patient. It is normally highest in the evening and can be influenced by room temperature and humidity.
Fig 3.61.2 Tympanic (ear) thermometer.
Top tip! RR is often an early marker of deterioration and, if not marked on the chart, you should assess for yourself!

3.61 TPR (temperature, pulse and respiration) chart 163
May be raised by anxiety, pain, physical activity, warm clothing, after eating or by the actions of some drugs. Normal ranges are summarized in Table 3.61.1 .
● Pyrexia (fever) may be diagnosed when temperature increases to more than 1°C above the patient's normal, suggesting an infec-tion which has caused the body's thermal regulatory mecha-nism to ‘reset’ to a higher level.
● Fever may be intermittent or continuous so it is important to look for trends.
● Hyperpyrexia: fever with an extreme elevation of temperature above or equal to 41.5°C (106.7°F). Requires immediate med-ical attention as it constitutes a medical emergency and may be life threatening.
● Hypothermia is defined as a drop in body temperature below 35°C (95°F).
Pulse, BP and RR ● Look for trends. ● A general increase over time in all three measurements (above
normal levels) suggests increased sympathetic activity which may be linked to worsening pathology and/or anxiety/stress. This could eventually lead to fatigue and needs to be high-lighted to the medical team. It may also affect the patient's ability to tolerate physiotherapy or any increase in activity levels.
● An increase in pulse rate seen in combination with a drop in BP is a potentially serious sign of impending circulatory shock and should be highlighted to the medical team (see Documentation below).
Ear 35.7–38.0°C 96.4–100.4°F
Oral 36.5–37.5°C 95.9–99.5°F
Axillary (armpit) 34.7–37.2°C 94.5–99.1°F
Table 3.61.1 Normal temperature ranges
Top tip! After surgery, a reflex pyrexia (when body temperature gradually rises and falls within 24 hours of surgery) is common and does not necessarily imply infection.

ASSESSMENT TOOLS164
● A trend towards decreasing values below normal limits may be due to impaired cerebral function and loss of sympathetic out-flow requiring immediate medical intervention.
● A grossly raised BP compared with HR in a patient with a spi-nal injury above T6 can be a sign of autonomic dysreflexia and should be treated as a medical emergency.
DOCUMENTATION ● These charts vary so find out what is required for your specific
chart. ● Ensure recordings are entered in alignment with the appropri-
ate date and time. ● Use the appropriate ‘scale’ – there are normally separate scales for
temperature, HR and BP together, and respiration ( Fig. 3.61.1 ). ● Temperature, HR and respiration are usually recorded with a
dot, but blood pressure is recorded with a ‘v’ shape at the top representing systolic pressure, an inverted ‘v’ below represent-ing diastolic pressure and a dotted line is drawn between the two ( Fig. 3.61.1 ).
●3.62 VENTILATION–PERFUSION (V/Q) MATCHING
DEFINITION The ratio between ventilation (V) and perfusion (Q) demonstrates the degree of ‘matching’ between the distribution of ventilation in the lungs and the distribution of the blood flow. This is important because the better the two are matched, the better the gas exchange.
Top tip! If you are unsure about unusual measurements on a TPR chart, it is important to highlight your concerns to a senior – you may be the first person to have identified a problem.
Top tip! Unlike Fig 3.61.1 some charts have HR and BP on the same scale. Here, the ‘v’ at the top of the BP column (systolic pressure reading) looks a bit like a seagull and the dot for the pulse represents the seagull's dropping. You would expect to see the dropping below the bird! If the dropping is above the bird, this is an indication of physiological com-promise which needs addressing promptly. (see 3.5 Blood pressure).

3.62 Ventilation–perfusion (V/Q) matching 165
PURPOSE It is useful for the physiotherapist to identify when a lung, lobe or segment is well ventilated but not well perfused (or perfused but not well ventilated) because it may be possible to improve ventilation and/or perfusion through a change of position (see Findings).
PROCEDURE Physiotherapists are not involved in the formal assessment of ventila-tion and perfusion matching. This can be assessed in the radiology department using a ventilation–perfusion scan or CTPA (see 3.14 Chest imaging (including chest radiographs)). However, it is use-ful for us to be aware of the principles of ventilation and perfusion matching.
Gas exchange can be monitored by oxygen saturations, ABGs and RR (see relevant sections). If a patient is hypoxae-mic, or very breathless, it is useful to consider whether a change in the patient's body position might improve oxygenation or breathlessness.
FINDINGS Key terms
● Shunt: an area with no ventilation – so can be viewed as wasted perfusion.
● Dead space: an area with no perfusion – so could be viewed as wasted ventilation.
Normal lungs (adults) In health, in the upright position, blood flow is preferentially distributed to the dependent areas of the lungs, as is the ven-tilation (e.g. in standing this would be the bases of the lungs). This results in a good match of the ventilation and perfusion. Less effective ventilation and perfusion occurs in the non-dependent areas of the lung (e.g. in standing this would be the apices). Thus, position affects ventilation and perfusion. However, there are pathologies in which the two may not match as well and this can lead to hypoxaemia or increased work of breathing.
A mismatch could be caused by a defect in perfusion, e.g. a pul-monary embolus, which will lead to dead space. Alternatively, it could be due to a defect in ventilation, such as atelectasis or con-solidation in one lung (or in one or more lobe or segment, e.g. a lobar pneumonia). This will lead to a shunt.

ASSESSMENT TOOLS166
As physiotherapists we may be able to improve ventilation to a lung, or lobe, through positioning, breathing techniques or positive pressure devices. The therapist can also affect the per-fusion to the lungs. Blood flow is affected by gravity, so perfu-sion of the lungs can be influenced by posture .For example, a patient with a right lower lobe pneumonia will have a V/Q mis-match because of a lack of ventilation in that area. Positioning the patient in left side lying will allow more perfusion to the well-ventilated left lung. This position may also aid drainage of secretions from the right lower lobe. See Further reading.
If this patient is on a ventilator (i.e. positive pressure) the V/Q matching will change. Perfusion will remain the same because of gravity, but the area of best ventilation will be in the opposite direction of the self-ventilating adult (this is because positive pres-sure takes the path of least resistance). In this situation, positioning a patient with a right lower lobe pneumonia in left side lying will increase perfusion to the left lung but will reduce its ventilation. This may cause a detrimental effect on the patient's blood gases (see section 3.1 Arterial blood gases). See also Further reading.
DOCUMENTATION Record the posture in which the patient has optimal respiratory status in terms of saturations and RR. If the patient is saturating better in one position, this should be noted within your documen-tation. Similarly, if they have a tendency to desaturate in a particu-lar position this should be noted.
FURTHER READING West, J.B., 2008. Respiratory Physiology: The Essentials, 8th edn.
Lippincott, Williams and Wilkins, Baltimore, MD.
●3.63 VENTILATOR OBSERVATIONS
DEFINITION Ventilator observations are the measurements of different ventila-tion parameters that are shown on the ventilator display, includ-ing measures such as the type of ventilation mode, tidal volume, minute volume and RR.
PURPOSE It is important for the physiotherapist to distinguish between patients for whom the ventilator is completely controlling the breathing pattern (controlled modes of ventilation/fully

3.63 Ventilator observations 167
ventilated, e.g. CMV) and those where the ventilator is simply supporting the patient's own breathing (supported modes of ven-tilation, e.g. CPAP and pressure support). This may affect what you can do; for example, if a patient is fully ventilated they can-not breathe if disconnected from a ventilator and will be unable to participate in treatment. However, if a patient is on a supported mode, it may be possible for you to work with them to affect their breathing, e.g. using active cycle of breathing technique. The reader is directed towards the Findings and Further reading sections.
Ventilation observations can be used as an objective marker, e.g. lung compliance may increase following physiotherapy and the pressure required to ventilate the patient may be reduced.
Some physiotherapists alter ventilator settings as part of their role, e.g. for weaning purposes or in some cases to set up and manage NIV. This is only appropriate for senior staff with appro-priate training!
PROCEDURE This is a straightforward process as most ventilators used in an acute setting, both invasive and non-invasive, have digital displays, and some have digital readings and graphs of pressure tracings. Therefore, it is simple to read off the volumes delivered and the pressures achieved. Find out by asking nursing staff and observing.
Additionally, for patients on ventilators at home, there are software packages which allow healthcare professionals to download informa-tion to study how the ventilator is used for further information.
FINDINGS Know your ventilator! Different manufacturers use slightly differ-ent terminology. So ensure that you are being consistent with the machine your patient is on. Within this text generic terms will be used ( Table 3.63.1 ).
The efficacy of ventilation should be viewed in conjunction with other clinical findings, such as the ABGs. Is the level of ven-tilation adequate for this patient? The ventilator parameters may need to be altered. However, it is not the role of the inexperienced physiotherapist to do this!
Modes of ventilation broadly fall into one of three categories: control modes in which the ventilator is completely controlling the breathing pattern of the patient such as controlled manda-tory ventilation (CMV); support modes in which the ventilator is helping the patient to breathe, such as pressure support (PS); or transitional modes in which the ventilator will allow patients to

ASSESSMENT TOOLS168
breathe by themselves; however, if they do not breathe adequately, the machine will take over. An example of this would be syn-chronized intermittent mandatory ventilation (SIMV). Another classification of ventilation is dependent on how the desired vol-ume is achieved. This can be performed in two ways: either by set-ting a volume or by setting pressures.
Having established the patient on respiratory support, the obvious questions to ask are: Is the patient adequately supported? Are adequate tidal volumes being achieved? What pressures are being delivered?
DOCUMENTATION In part this is determined by the ventilator make. Different manu-facturers will have produced minor variations on ventilator modes and so the documentation will be specific to that machine. The minimum should include:
● mode of ventilation (e.g. SIMV) ● amount of oxygen being delivered, and oxygen saturations ● tidal volumes (set versus delivered in volume control modes) ● RR (both set and measured) ● pressures (e.g. pressure control, pressure support and PEEP).
CMV Continuous mandatory ventilation: a form of ventilation that completely controls the breathing pattern of the patient
SIMV Synchronized intermittent mandatory ventilation: ventilation that provides mandatory breaths of a set rate and volume while attempting to synchronize with the patient's spontaneous breathing pattern
PS or ASB Pressure support or assisted spontaneous breathing: a support mode that provides pressure support to a patient's own spontaneous breathing
PEEP or CPAP Positive end-expiratory pressure or continuous positive airways pressure: assists to overcome the resistance of the ETT and to splint the airways open to aid oxygenation
Volume regulation
Delivery of the gas to the patient is regulated according to a prescribed volume (measured in ml)
Pressure regulation
Delivery of the gas to the patient is regulated according to a prescribed pressure (measured in cmH 2 O)
NIV Non-invasive ventilation: a form of respiratory support delivered without an ETT via a mask applied over the face
Table 3.63.1 Ventilator terminology

3.64 Work of breathing 169
For example, ‘SIMV via ETT, TV 450 ml, set rate 14 breaths per minute (nil spont), PEEP 5, PS 8, F i O 2 0.40, S p O 2 98%’.
This tells you that the patient is on SIMV via an endotracheal tube. They have a set tidal volume and, as there are no spontaneous breaths, the machine is doing all the work. They are on low levels of PEEP (to splint open the airways) and although they have a pressure support set they are not using it as they are not breathing for themselves.
FURTHER READING Bersten, A., Soni, N., 2008. Oh's Intensive Care Manual, 6th edn.
Butterworth-Heinemann, Edinburgh, UK. http://emedicine.medscape.com/article/810126-overview http://www.ccmtutorials.com Simonds, A.K., 2007. Non-Invasive Respiratory Support: A Practical
Handbook, 3rd edn. Hodder Arnold, London, UK. Singer, M., Webb, A., 2009. Oxford Handbook of Critical Care.
Oxford University Press, Oxford, UK.
●3.64 WORK OF BREATHING
DEFINITION Work of breathing is the observed results of increasing load on the respiratory muscles. This is closely linked to dyspnoea, the subjective experience of breathing discomfort and breathlessness. Patients with increased work of breathing will undoubtedly feel breathless (see also 3.8 Breathlessness (dyspnoea) scales).
PURPOSE Physiotherapists need to be able to recognize patients with an increased work of breathing because, if the load applied to the respiratory muscles is increased steadily, they will eventually reach a point when they can no longer cope owing to fatigue. As this occurs the patient slips into respiratory failure. Recognizing and avoiding this will allow early intervention and treatment of the underlying problem.
PROCEDURE
Top tip! How does your patient look? If they look like they have just fin-ished a workout, but are sat in bed, distressed and uncomfortable, this is a warning sign – time to act.

ASSESSMENT TOOLS170
Work of breathing can be measured objectively using inva-sive techniques but these are usually reserved for research work. Clinically, this tends to be the result of observations.
Look ● The RR will increase as the work of breathing increases. However,
if the muscles then become fatigued, the RR will fall – at this point the patient is critically ill (see 3.55 Respiratory rate).
● Respiratory pattern: look for the use of accessory muscles (sca-leni, sternocleidomastoid and the upper fibres of trapezius). A paradoxical (reciprocal) breathing pattern (in which the abdomen is drawn in as the patient inhales) and pursed lipped breathing are signs of increased work of breathing (see 3.54 Respiratory pattern).
● It is also worth looking at ABGs if they are available (see 3.1 Arterial blood gases) as type 1 respiratory failure transform-ing to type 2 respiratory failure may be observable. This would indicate that the patient is fatiguing.
Listen ● Ask yourself the following: on auscultation are there adequate
breath sounds and is there adequate ventilation? If not, this may be due to fatigue. Does the breathing sound laboured?
Feel ● When palpating for expansion, is it equal (see 3.45 Palpation)?
FINDINGS The observed work of breathing combines all these measures. It should be discussed with supervisors, who can guide you and link your theory to observation in practice.
Remember:
● Respiratory muscle strength: normal muscles cannot cope with an increase in load and will eventually fail. Initially, accessory muscles will be used to compensate. In some pathologies, this can occur even during normal ventilation. For example, patients with motor neurone disease, in which respiratory muscles are becoming progressively weaker and the patient eventually slips into respiratory failure.
● Load: the workload includes the chest wall itself, lung compli-ance and airways resistance.
● Chest wall: a heavy or stiff chest wall will result in the respira-tory muscles needing to work harder. This occurs in restrictive disorders such as obesity and kyphoscoliosis.

3.64 Work of breathing 171
● Lung compliance (stiffness of the lungs or the ability of the lungs to respond to stretch): stiffer lungs are harder to move. This occurs in progressive fibrotic lung disease, or acute condi-tions such as acute respiratory distress syndrome.
● Resistance of the airways: air flow obstruction will also result in an increase on the load of the respiratory muscle. This occurs in diseases such as asthma and COPD.
DOCUMENTATION Increased work of breathing can form part of a problem list of the assessment. It can also be documented under observation, e.g. ‘patient has increased work of breathing – use of accessories and pursed lip breathing’.
Changes in work of breathing must also be documented as part of a systematic assessment or as part of a treatment analysis.
