chapter – 1 general introduction to chromatography and...
TRANSCRIPT
Chapter-1 Page 1
CHAPTER – 1
General introduction to Chromatography and
Pharmaceutical products

Chapter-1 Page 2
1.1. INTRODUCTION
Pharmaceutical analysis is the branch of science which deals with
identification of substances and determination of amount present in particular
sample. Pharmaceutical analysis covers the bulk materials, dosage forms and more
recently, biological samples in support of bio-pharmaceutical and pharmacokinetic
studies. Analysis can be divided into areas called qualitative and quantitative
analysis. Pharmaceutical products synthesized and identified using instrumental
techniques.1
The Laboratory controls shall include the establishment of sound and
appropriate specification standards and test procedure to assure that the final drug
substances conforms to the required standards of identity, strength, quality and
purity. Modern physical methods of analysis are extremely sensitive, providing
precise and accurate information about the standards of chemicals or drugs up to
nanogram levels like HPLC2. These methods are used extensively in the quality
assurance of raw materials, in process quality assessment, stability of the drugs on
storage and monitoring drugs concentrations in various body fluids or tissues.
1.2. PHARMACEUTICAL INDUSTRY
The pharmaceutical industry develops, produces, and markets drugs
licensed for use as medications. Pharmaceutical companies are allowed to deal
in generic or brand medications and medical devices. They are subject to a variety of
laws and regulations regarding the patenting, testing and ensuring safety and
efficacy and marketing of drugs.
Drug discovery is the process by which potential drugs are discovered or
designed. In the past most drugs have been discovered either by isolating the active
ingredient from traditional remedies (or) by serendipitous discovery.
Modern biotechnology often focuses on under-standing the metabolic path-
ways related to a disease state or pathogen, and manipulating these pathways
using molecular biology or biochemistry. A great deal of early-stage drug discovery
has traditionally been carried out by universities and research institutions.
Chapter-1 Page 3
Drug development refers to activities undertaken after a compound is
identified as a potential drug in order to establish its suitability as a medication.
Objectives of drug development are to determine appropriate. Research in these
areas generally includes a combination of in vitro studies, in vivo studies,
and clinical trials. The amount of capital required for late stage development has
made it a historical strength of the larger pharmaceutical companies.
Suggested citation: Tufts Center for the Study of drug development, annual
impact report, Often, large multinational corporations exhibit vertical integration,
participating in a broad range of drug discovery and development, manufacturing
and quality control, marketing, sales, and distribution. Smaller organizations, on the
other hand, often focus on a specific aspect such as discovering drug candidates or
developing formulations. Often, collaborative agreements between research
organizations and large pharmaceutical companies are formed to explore the
potential of new drug substances.
1.3. ANALYTICAL CHEMISTRY
The types of analysis can be distinguished in two ways:
Qualitative Analysis: To refer identity of product, i.e., it yields useful clues from
which the molecular or atomic species, the structural features, or the functional
groups in the sample can be identified.
Quantitative Analysis: To refer the purity of the product, i.e., the results are in the
form of numerical data corresponding to the concentration of analytes.
Types of Analytical Methods :
The various methods of analysis3 can be grouped into two categories. They are:
1. Chemical methods.
2. Instrumental methods.
Chemical Methods:
In these methods, volume and mass are used as means of detection.
1. Titrimetrical methods like acid-base, oxidation-reduction, non-aqueous,
complexometric and precipitation titrations.

Chapter-1 Page 4
2. Gravimetric and thermo gravimetric methods.
3. Volumetric methods.
Instrumental Methods:
Based on principles different Instrumental methods are available. These
methods are based on the measurement of specific and non-specific physical
properties of a substance. Table-1.1 represents the instrumental methods and
principles.
Table No-1.1: Table showing list of instrumental methods.
S.No. Principle Instrument Method
1. Emission of radiation. X-ray emission spectrometry.
Fluorescence spectrometry.
2. Absorption of radiation. UV/Visible and I.R Spectrophotometry.
NMR Spectroscopy. ESR Spectroscopy.
Atomic absorption spectrometry.
3. Mass to charge ratio. Mass spectrometry.
4. Refraction of radiation. Refractometry.
5. Scattering of radiation. Nephelometry.
6. Rotation of radiation. Polarimetry.
7. Electrical potential. Potentiometry.
8. Electrical current. Amperometry, Polargraphy.
9. Electrical resistance. Conductometry.
10. Thermal properties. Differential thermal analysis. Differential
Scanning Calorimetry. Thermogravimetry.
11. Partition / Adsorption. Chromatographic Techniques.
Chapter-1 Page 5
1.4. CHROMATOGRAPHY
Chromatography (from Greek chroma, color and graphein to write) is the
collective term for a set of laboratory techniques for the separation of mixtures. It
involves passing a mixture dissolved in a "mobile phase" through a stationary phase,
which separates the analyte to be measured from other molecules in the mixture
based on differential partitioning between the mobile and stationary phases. Subtle
differences in a compound's partition coefficient result in differential retention on
the stationary phase and thus changing the separation. Chromatography may be
preparative or analytical. The purpose of preparative chromatography is to separate
the components of a mixture for further use (and is thus a form of purification).
Analytical chromatography is done normally with smaller amounts of material and
is for measuring the relative proportions of analytes in a mixture. The two are not
mutually exclusive.
The history of chromatography begins during the mid-19th century.
Chromatography, literally "color writing", was used and named in the first decade of
the 20th century, primarily for the separation of plant pigments such as chlorophyll.
New types of chromatography developed during the 1930s and 1940s made the
technique useful for many types of separation process. Some related techniques
were developed during the 19th century (and even before), but the first true
chromatography is usually attributed to Russian botanist M.Tswett, who used
columns of calcium carbonate for separating plant pigments during the first decade
of the 20th century during his research of chlorophyll.
Chromatography terms
� The analyte is the substance to be separated during chromatography.
� Analytical chromatography is used to determine the existence and possibly
also the concentration of analyte(s) in a sample.
� A bonded phase is a stationary phase that is covalently bonded to the support
particles or to the inside wall of the column tubing.
Chapter-1 Page 6
� A chromatogram is the visual output of the chromatograph. In the case of an
optimal separation, different peaks or patterns on the chromatogram
correspond to different components of the separated mixture.
Plotted on the x-axis is the retention time and plotted on the y-axis a signal (for
example obtained by a spectrophotometer, mass spectrometer or a variety of
other detectors) corresponding to the response created by the analytes exiting
the system. In the case of an optimal system the signal is proportional to the
concentration of the specific analyte separated.
� A chromatograph is equipment that enables a sophisticated separation e.g.
gas chromatographic or liquid chromatographic separation.
� Chromatography is a physical method of separation in which the components
to be separated are distributed between two phases, one of which is stationary
(stationary phase) while the other (the mobile phase) moves in a definite
direction.
� The eluent is the mobile phase leaving the column.
� An eluotropic series is a list of solvents ranked according to their eluting
power.
� An immobilized phase is a stationary phase which is immobilized on the
support particles, or on the inner wall of the column tubing.
� The mobile phase is the phase which moves in a definite direction. It may be a
liquid (LC), a gas (GC), or a supercritical fluid (supercritical-fluid
chromatography, SFC). The mobile phase consists of the sample being
separated/analyzed and the solvent that moves the sample through the
column. In the case of HPLC the mobile phase consists of a non-polar solvent(s)
such as hexane in normal phase or polar solvents in reverse phase
chromatography and the sample being separated. The mobile phase moves
through the chromatography column (the stationary phase) where the sample
interacts with the stationary phase and is separated.
� Preparative chromatography is used to purify sufficient quantities of a
substance for further use, rather than analysis.

Chapter-1 Page 7
� The retention time is the characteristic time it takes for a particular analyte to
pass through the system (from the column inlet to the detector) under set
conditions.
� The sample is the matter analyzed in chromatography. It may consist of a
single component or it may be a mixture of components. When the sample is
treated in the course of an analysis, the phase or the phases containing the
analytes of interest is/are referred to as the sample whereas everything out of
interest separated from the sample before or in the course of the analysis is
referred to as waste.
� The solute refers to the sample components in partition chromatography.
� The solvent refers to any substance capable of solubilizing other substance,
and especially the liquid mobile phase in LC.
� The stationary phase is the substance which is fixed in place for the
chromatography procedure. Examples include the silica layer in thin layer
chromatography
� Techniques by chromatographic bed shape:
Column chromatography
Planar chromatography
� Paper chromatography
� Thin layer chromatography
� Displacement chromatography
� Techniques by physical state of mobile phase:
Gas chromatography
Liquid chromatography
• Affinity chromatography
Supercritical fluid chromatography
• Techniques by separation mechanism:
Ion exchange chromatography
Size exclusion chromatography
Chapter-1 Page 8
• Special techniques:
Reversed-phase chromatography
Two-dimensional chromatography
Simulated moving-bed chromatography
Pyrolysis gas chromatography
Fast protein liquid chromatography
Countercurrent chromatography
Chiral chromatography.
1.5. HIGH PERFORMANCE LIQUID CHROMATOGRAPHY(4-8)
High Pressure Liquid Chromatography (HPLC), sometimes called High
Performance liquid chromatography, is a separation that can be used for the
analysis of organic molecules and ions. HPLC is based on mechanisms of adsorption,
partition, ion exchange or size exclusion, depending on the type of stationary phase
used. HPLC involves a solid stationary phase, normally packed inside a stainless-
steel column, and a liquid mobile phase. Separation of the components of a solution
results from the difference in the relative distribution ratios of the solutes between
the two phases.
The rate of distribution of drugs between stationary and mobile phase is
controlled by diffusion process, if diffusion is minimized, a faster and effective
separation can be achieved. The techniques of HPLC are so called because of its
improved performance when compared to classical column chromatography.
Advances in column technology, high pressure pumping system and sensitive
detectors have transformed liquid column chromatography into high speed,
efficient, accurate and highly resolved method of separation.
HPLC is a form of column chromatography used frequently in biochemistry
and analytical chemistry to separate, identify, and quantify compounds. HPLC
utilizes a column that holds chromatographic packing material (stationary phase), a
pump that moves the mobile phase(s) through the column, and a detector that
shows the retention times of the molecules. Retention time varies depending on the
Chapter-1 Page 9
interactions between the stationary phase, the molecules being analyzed and the
solvent(s) used. It offers following advantages:
� Speed (many analysis can be accomplished in 20 minutes or less)
� Greater sensitivity (various detectors can be employed)
� Reusable columns (expensive columns but can be used for many analysis)
� Ideal for the substances of low volatility.
� Easy sample recovery, handling and maintenance.
� Instrumentation leads itself to automation and quantitation.
� Precise and reproducible.
� Calculations are done by integrator itself.
� Suitable for preparative liquid chromatography on a much larger scale.
1.6 TYPES OF HPLC
� Based on the mode of separation
Normal phase chromatography
Reverse phase chromatography
Partition chromatography
Displacement chromatography
� Based on principle of separation
Adsorption chromatography
Ion exchange chromatography
Size exclusion chromatography
Affinity chromatography
Chiral phase chromatography
Ion pair chromatography
� Based on elution technique
Isocratic separation
Gradient separation
� Based on the scale of operation
Analytical HPLC
Preparative HPLC

Chapter-1 Page 10
Based on the mode of separation:
Normal phase chromatography:
It was one of the first kinds of HPLC that chemists developed. In this type
stationary phase used is polar in nature and the mobile phase used is non-polar and
non aqueous in nature. If the affinity between the stationary phase and the analyte
increases the selection time (RT) of the analyte also increases and vice versa. The
interaction strength depends not only on the functional groups in the analyte
molecule but also on steric factors. The effect of sterics on interaction strength
allows this method to resolve (separate) structural isomers.
Reverse phase chromatography
In reverse phase technique, a non-polar stationary phase is used and the
mobile phase is polar in nature. Hence polar components get eluted first and non-
polar compounds are retained for a longer time. Since most of the drugs and
pharmaceuticals are polar in nature, they are not retained for a longer time and
eluted faster, columns used in the mode of chromatogram are ODS (Octadecyl
silane) or C18, C8, C4, etc.
Partition chromatography
Partition chromatography was the first kind of chromatography that
chemists developed. The partition coefficient principle has been applied in paper
chromatography, thin layer chromatography, gas phase and liquid-liquid
applications. Partition chromatography uses a retained solvent, on the surface or
within the grains or fibers of an "inert" solid supporting matrix as with paper
chromatography; or takes advantage of some additional columbic and/or hydrogen
donor interaction with the solid support. Molecules equilibrate (partition) between
a liquid stationary phase and the eluent separate analytes based on the polar
differences is known as Hydrophilic interaction chromatography (HILIC). Partition
HPLC has been used historically on unbonded silica or alumina supports. Each
works effectively for separating analytes by relative polar differences. However,
HILIC has the advantage of separating acidic, basic and neutral solutes in a single
chromatogram.

Chapter-1 Page 11
Displacement Chromatography
The basic principle of displacement chromatography is a molecule with a
high affinity for the chromatography matrix (the displacer) will compete effectively
for binding sites and thus displace all molecules with lesser affinities. In elution
mode, substances typically emerge from a column in narrow Gaussian peaks. Wide
separation of peaks, preferably to baseline, is desired in order to achieve maximum
purification. The speed at which any component of a mixture travels down the
column in elution mode depends on many factors. But for two substances to travel
at different speeds and thereby be resolved there must be substantial differences in
some interaction between the bio molecules and the chromatography matrix.
Operating parameters are adjusted to maximize the effect of this difference. In many
cases, baseline separation of the peaks can be achieved only with gradient elution
and low column loadings. Thus, two drawbacks to elution mode chromatography,
especially at the preparative scale, are operational complexity, due to gradient
solvent pumping, and low throughput, due to low column loadings. Displacement
chromatography has advantages over elution chromatography in that components
are resolved into consecutive zones of pure substances rather than “peaks”.
Based on principle of separation:
Adsorption chromatography:
When a mixture of compounds (adsorbate) dissolved in the mobile phase
(eluent) moves through a column of stationary phase (adsorbent) they travel
according to their relative affinities. The compound which has more affinity towards
stationary phase travels slower, if less affinity towards stationary phase travels
faster.
Ion exchange chromatography:
It is the process by which a mixture of similar charged ions can be separated
using ion exchange resin. There is a reversible exchange of ions between the ions
present in the column. And those present in the ion exchange resin. For cations,
cation exchange resin and for anions, an anion exchange resin is used.
1) Cation exchange eg: Sulfonated polystyrenes
Chapter-1 Page 12
2) Anion exchange resin eg: Carboxylic methacrylate
Size exclusion chromatography:
It is the process by which mixture of compounds with molecular sizes are
separated by using gels. The gel used acts as molecular sieve. It can be separated by
steric and diffusion effects of pores in the gels. The compound can separate
according to the molecular sizes and the stationary phase is a porous matrix.
Eg: separation of proteins and polysaccharides.
Chiral phase chromatography:
In this type of chromatography, separation of optical isomers can be done by
using chiral stationary phases i.e., levo and dextro form can be separated by using
chiral stationary phases. Eg: chemically bonded silica gel.
Ion pair chromatography:
In this chromatography, a reverse phase column is converted temporarily
into ion exchange column by using ion pairing agents like pentane or hexane.
Based on the scale of operation:
Analytical HPLC: It is used for analysis of samples. But recovery of samples is not
done since the samples used are at very low level. Eg: microgram quantities.
Preparative HPLC: It is used for separation and collection of compound mixture,
where the individual and pure compounds can be collected using fraction collector.
And the collector samples are reused. Eg: separation of few grams of mixtures.
1.7. HPLC INSTRUMENTATION 9
The main components of HPLC are:
� Solvent Reservoir
� Pump
� Injection Port
� Column
� Detector
� Data Acquisition System
Chapter-1 Page 13
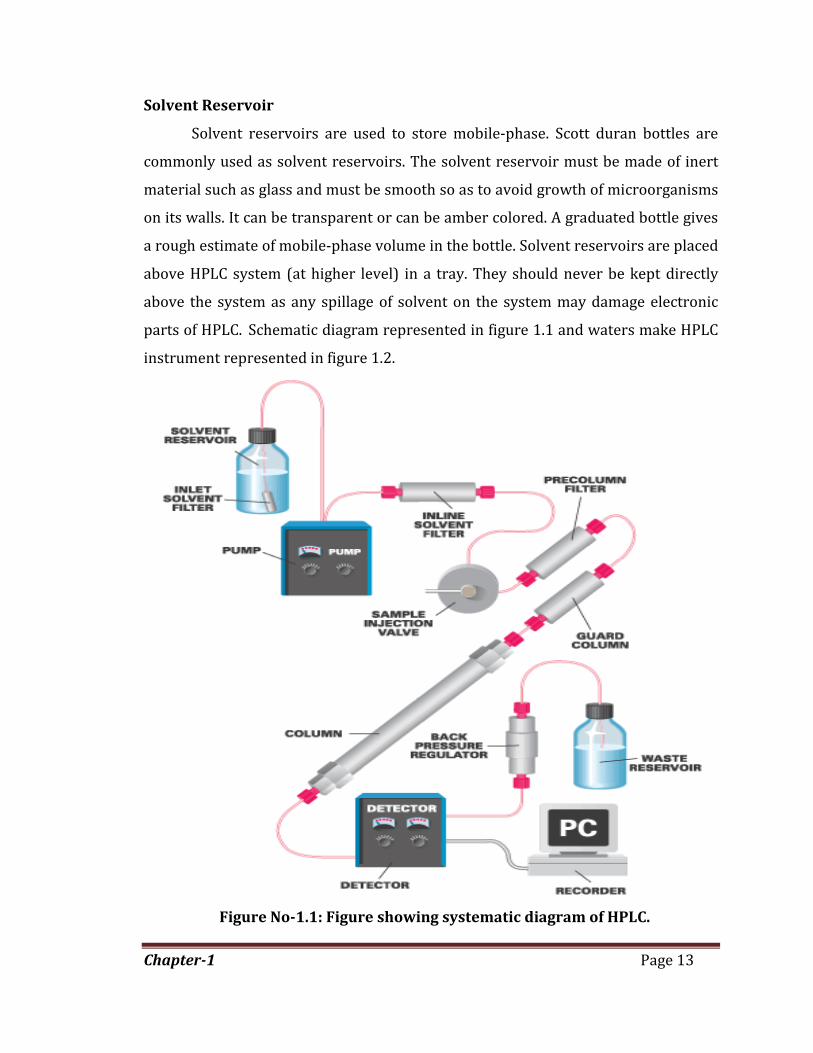
Solvent Reservoir
Solvent reservoirs are used to store mobile-phase. Scott duran bottles are
commonly used as solvent reservoirs. The solvent reservoir must be made of inert
material such as glass and must be smooth so as to avoid growth of microorganisms
on its walls. It can be transparent or can be amber colored. A graduated bottle gives
a rough estimate of mobile-phase volume in the bottle. Solvent reservoirs are placed
above HPLC system (at higher level) in a tray. They should never be kept directly
above the system as any spillage of solvent on the system may damage electronic
parts of HPLC. Schematic diagram represented in figure 1.1 and waters make HPLC
instrument represented in figure 1.2.
Figure No-1.1: Figure showing systematic diagram of HPLC.
Chapter-1 Page 14
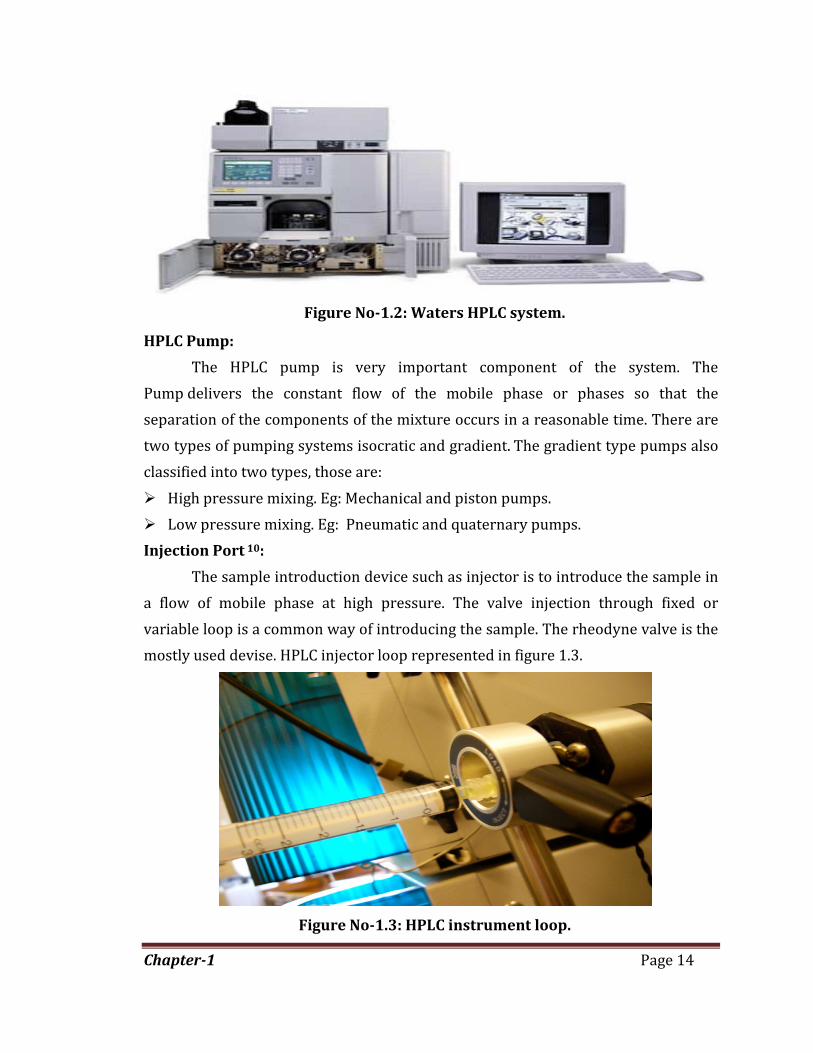
Figure No-1.2: Waters HPLC system.
HPLC Pump:
The HPLC pump is very important component of the system. The
Pump delivers the constant flow of the mobile phase or phases so that the
separation of the components of the mixture occurs in a reasonable time. There are
two types of pumping systems isocratic and gradient. The gradient type pumps also
classified into two types, those are:
� High pressure mixing. Eg: Mechanical and piston pumps.
� Low pressure mixing. Eg: Pneumatic and quaternary pumps.
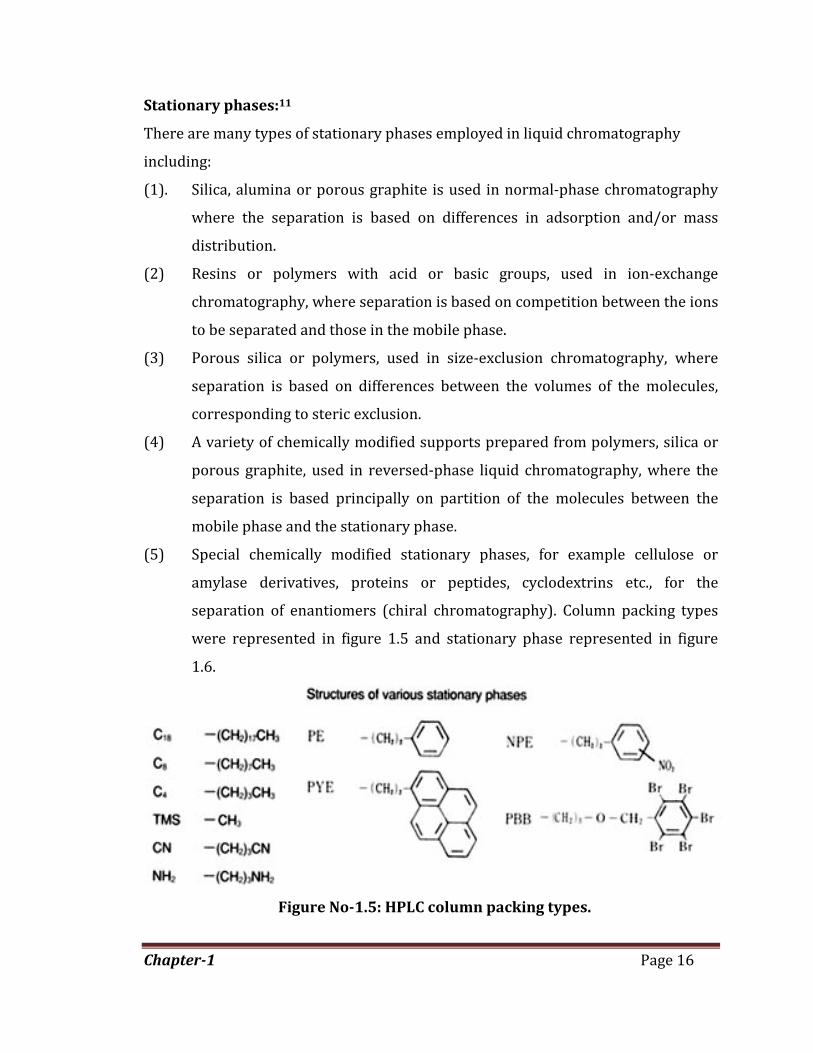
Injection Port 10:
The sample introduction device such as injector is to introduce the sample in
a flow of mobile phase at high pressure. The valve injection through fixed or
variable loop is a common way of introducing the sample. The rheodyne valve is the
mostly used devise. HPLC injector loop represented in figure 1.3.
Figure No-1.3: HPLC instrument loop.

Chapter-1 Page 15
HPLC Column:
The HPLC Column holds the stationary phase for separating the components
of the sample. The columns are usually made up of SS-316 grade steel. Apart from
columns, the material of construction of tubing and fittings, plumbing and
connections are also very critical. Apart from resistively to corrosion, connections
and plumbing should have very low dead volume. Column hard ware represented in
figure 1.4. and columns selection represented in table 1.2.
Figure No-1.4: HPLC column packing.
Table No-1.2: List of column selection chart.
Column selection chart: molecular weight > 2000 g/mol
Water soluble Organic
solvent soluble
LC mode
(packing
)
RP
bonde
d (C18,
phenyl,
C4)
aqueous
gel
filtratio
n (SEC)
Ion
exchang
e
hydrophobi
c interaction
affinit
y
size exclusion
chromatograph
y
Chapter-1 Page 16
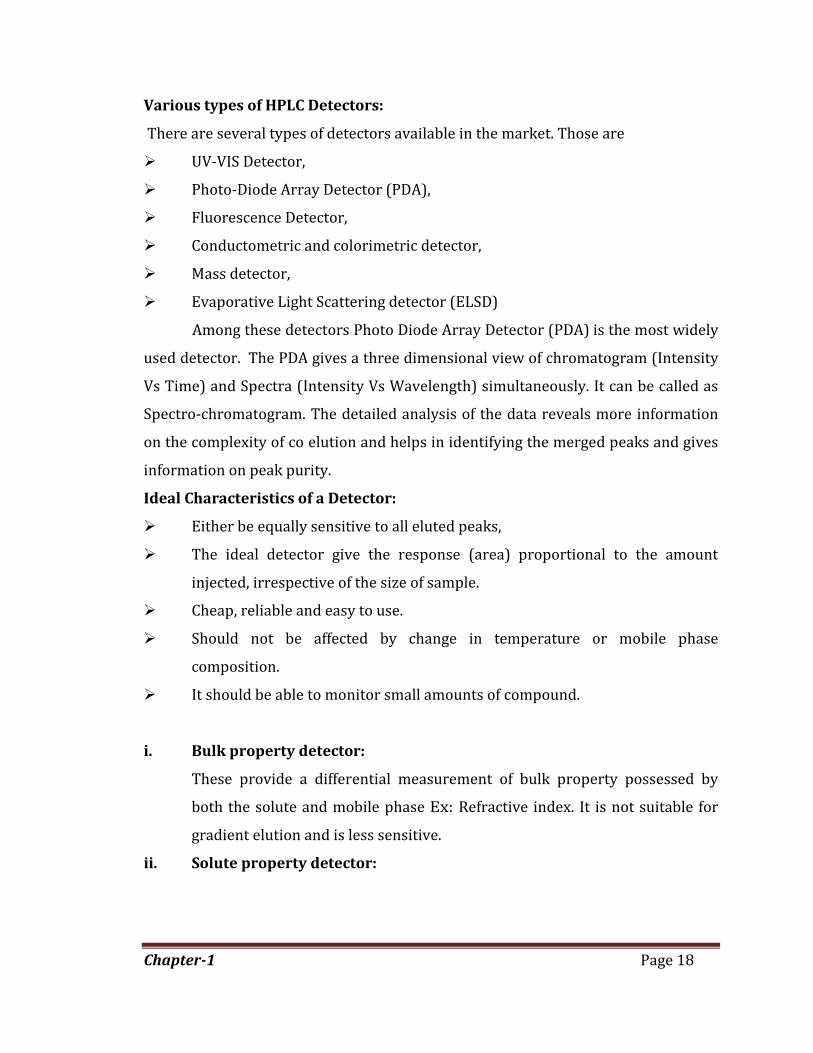
Stationary phases:11
There are many types of stationary phases employed in liquid chromatography
including:
(1). Silica, alumina or porous graphite is used in normal-phase chromatography
where the separation is based on differences in adsorption and/or mass
distribution.
(2) Resins or polymers with acid or basic groups, used in ion-exchange
chromatography, where separation is based on competition between the ions
to be separated and those in the mobile phase.
(3) Porous silica or polymers, used in size-exclusion chromatography, where
separation is based on differences between the volumes of the molecules,
corresponding to steric exclusion.
(4) A variety of chemically modified supports prepared from polymers, silica or
porous graphite, used in reversed-phase liquid chromatography, where the
separation is based principally on partition of the molecules between the
mobile phase and the stationary phase.
(5) Special chemically modified stationary phases, for example cellulose or
amylase derivatives, proteins or peptides, cyclodextrins etc., for the
separation of enantiomers (chiral chromatography). Column packing types
were represented in figure 1.5 and stationary phase represented in figure
1.6.
Figure No-1.5: HPLC column packing types.

Chapter-1
Detectors detect various compounds as they elute out from column. The
detector gives response in terms of a millivolt (mv) signal that is then processed by
the computer (integrator) to obtain you a chromatogram. Basically detector consists
of a flow-cell through which the mobile phase and resolved sample moves optic
shine through the detector cell and variation in optical properties are detected.
The Photo Diode Array Detector (PDA)
The PDA gives a three dimensional view of chromatogram (Intensity Vs Time) and
Spectra (Intensity Vs Wavelength) simultaneously. It can be called as Spectro
chromatogram. The detailed analysis of the data reveals more information on the
complexity of co elution and helps in ide
information on peak purity.
Figure No-1.6: Column stationary phase.
HPLC Detectors12
detect various compounds as they elute out from column. The
detector gives response in terms of a millivolt (mv) signal that is then processed by
the computer (integrator) to obtain you a chromatogram. Basically detector consists
hrough which the mobile phase and resolved sample moves optic
shine through the detector cell and variation in optical properties are detected.
The Photo Diode Array Detector (PDA) is the most used detector in LC today.
dimensional view of chromatogram (Intensity Vs Time) and
Spectra (Intensity Vs Wavelength) simultaneously. It can be called as Spectro
chromatogram. The detailed analysis of the data reveals more information on the
complexity of co elution and helps in identifying the merged peaks and gives
information on peak purity.
Page 17
detect various compounds as they elute out from column. The
detector gives response in terms of a millivolt (mv) signal that is then processed by
the computer (integrator) to obtain you a chromatogram. Basically detector consists
hrough which the mobile phase and resolved sample moves optic
shine through the detector cell and variation in optical properties are detected.
is the most used detector in LC today.
dimensional view of chromatogram (Intensity Vs Time) and
Spectra (Intensity Vs Wavelength) simultaneously. It can be called as Spectro-
chromatogram. The detailed analysis of the data reveals more information on the
ntifying the merged peaks and gives
Chapter-1 Page 18
Various types of HPLC Detectors:
There are several types of detectors available in the market. Those are
� UV-VIS Detector,
� Photo-Diode Array Detector (PDA),
� Fluorescence Detector,
� Conductometric and colorimetric detector,
� Mass detector,
� Evaporative Light Scattering detector (ELSD)
Among these detectors Photo Diode Array Detector (PDA) is the most widely
used detector. The PDA gives a three dimensional view of chromatogram (Intensity
Vs Time) and Spectra (Intensity Vs Wavelength) simultaneously. It can be called as
Spectro-chromatogram. The detailed analysis of the data reveals more information
on the complexity of co elution and helps in identifying the merged peaks and gives
information on peak purity.
Ideal Characteristics of a Detector:
� Either be equally sensitive to all eluted peaks,
� The ideal detector give the response (area) proportional to the amount
injected, irrespective of the size of sample.
� Cheap, reliable and easy to use.
� Should not be affected by change in temperature or mobile phase
composition.
� It should be able to monitor small amounts of compound.
i. Bulk property detector:
These provide a differential measurement of bulk property possessed by
both the solute and mobile phase Ex: Refractive index. It is not suitable for
gradient elution and is less sensitive.
ii. Solute property detector:
Chapter-1 Page 19
This measures physical or chemical property that is specific to the solute
only. Ex: U.V detector, conductivity detector. These can be used for gradient
elution.
The detection of the separated compounds in the elute from the column is
based up on the bulk properties of the elute are the solute property of the
individual components generally, a detector is selected that will respond to a
particular property of the substances being separated, and ideally it should
be sensitive to at least 10-8g ml-1 and give a linear response over a wide
concentration range.
Detector selection depends on the nature of molecule structure, refractive
index, fluorescence. Generally used detectors are UV, RID, ELSD, fluorescence
and chemical detector.
UV/Visible detector:
UV detectors function on the capacity of many compounds to absorb light in
the wavelength range 180 to 400nm with deuterium and tungsten lamp. Figure-1.7
shows the UV photo diode array detector (PDA). The sensor cell usually consists of a
cylindrical cavity about 1.0mm internal diameter (ID) and a few mm long, having a
capacity that ranges from about two micro-liters to eight micro-liters. Light from a
UV light sources passes through the sensor onto a photoelectric cell, the output from
which is electronically modified and presented on a potentiometer recorder, a
computer screen or printer. Alternatively a broad band light source can be used and
the light after passing through the cell can be optically dispersed by prism or grating
and allowed to fall onto a diode array. Schematic diagram represented in figure 1.7.
Chapter-1
Figure No-1.7: Schematic diagram of UV photo diode array detector
Refractive Index Detector (RID):
The refractive index detector is one of the least sensitive LC detectors. It is
very sensitive to changes in ambient temperature,
changes; and cannot be used for gradient elution. Despite these disadvantages, this
detector is extremely useful for detecting those compounds that are nonionic, do not
adsorb in the UV and do not possess the fluorescence. Be
refractive index detector (RID). Schematic diagram represented in figure 1.8.
Figure No-1.8:
Schematic diagram of UV photo diode array detector
Refractive Index Detector (RID):
The refractive index detector is one of the least sensitive LC detectors. It is
very sensitive to changes in ambient temperature, pressure changes and flow
changes; and cannot be used for gradient elution. Despite these disadvantages, this
detector is extremely useful for detecting those compounds that are nonionic, do not
adsorb in the UV and do not possess the fluorescence. Below Figure represents the
refractive index detector (RID). Schematic diagram represented in figure 1.8.
1.8: represents the refractive index detector (RID).
Page 20
Schematic diagram of UV photo diode array detector.
The refractive index detector is one of the least sensitive LC detectors. It is
pressure changes and flow-rate
changes; and cannot be used for gradient elution. Despite these disadvantages, this
detector is extremely useful for detecting those compounds that are nonionic, do not
low Figure represents the
refractive index detector (RID). Schematic diagram represented in figure 1.8.
represents the refractive index detector (RID).
Chapter-1 Page 21
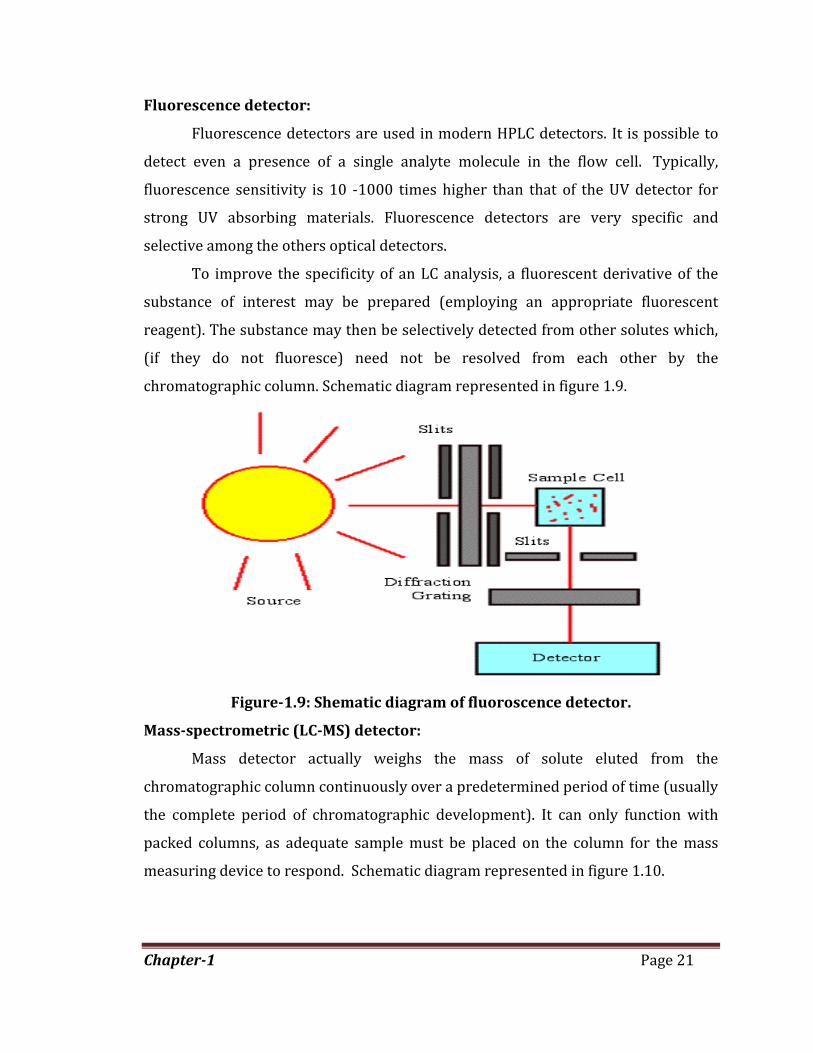
Fluorescence detector:
Fluorescence detectors are used in modern HPLC detectors. It is possible to
detect even a presence of a single analyte molecule in the flow cell. Typically,
fluorescence sensitivity is 10 -1000 times higher than that of the UV detector for
strong UV absorbing materials. Fluorescence detectors are very specific and
selective among the others optical detectors.
To improve the specificity of an LC analysis, a fluorescent derivative of the
substance of interest may be prepared (employing an appropriate fluorescent
reagent). The substance may then be selectively detected from other solutes which,
(if they do not fluoresce) need not be resolved from each other by the
chromatographic column. Schematic diagram represented in figure 1.9.
Figure-1.9: Shematic diagram of fluoroscence detector.
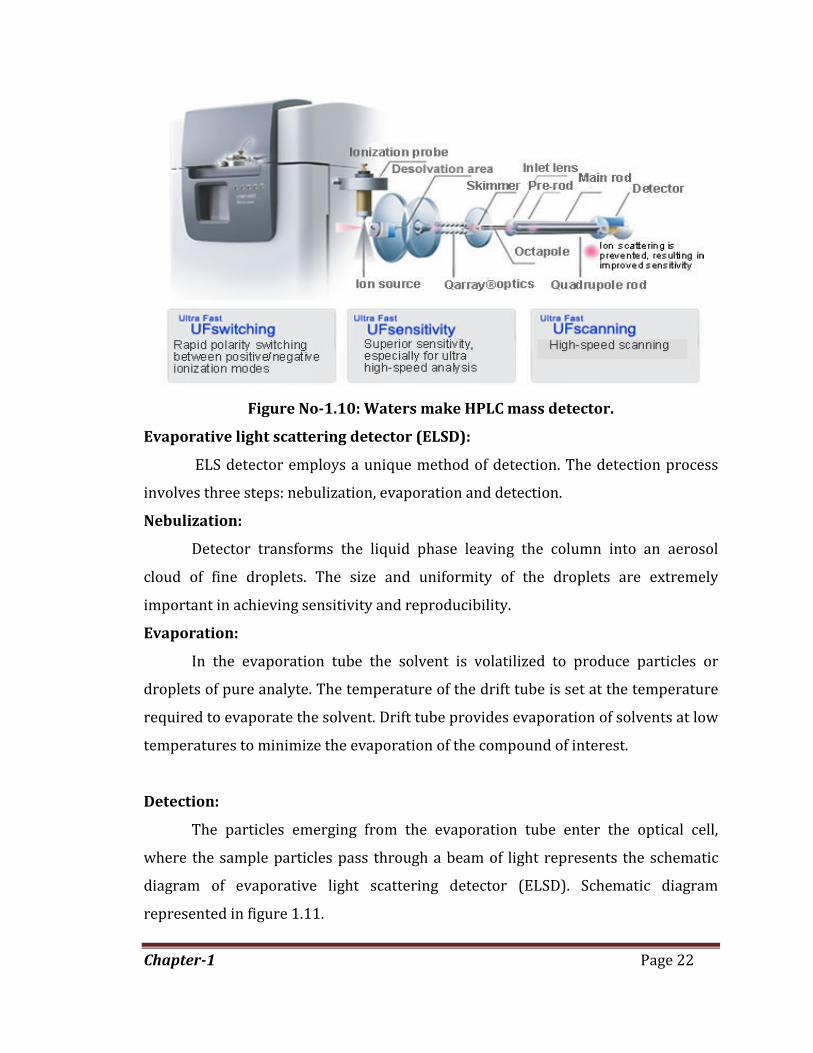
Mass-spectrometric (LC-MS) detector:
Mass detector actually weighs the mass of solute eluted from the
chromatographic column continuously over a predetermined period of time (usually
the complete period of chromatographic development). It can only function with
packed columns, as adequate sample must be placed on the column for the mass
measuring device to respond. Schematic diagram represented in figure 1.10.
Chapter-1 Page 22
Figure No-1.10: Waters make HPLC mass detector.
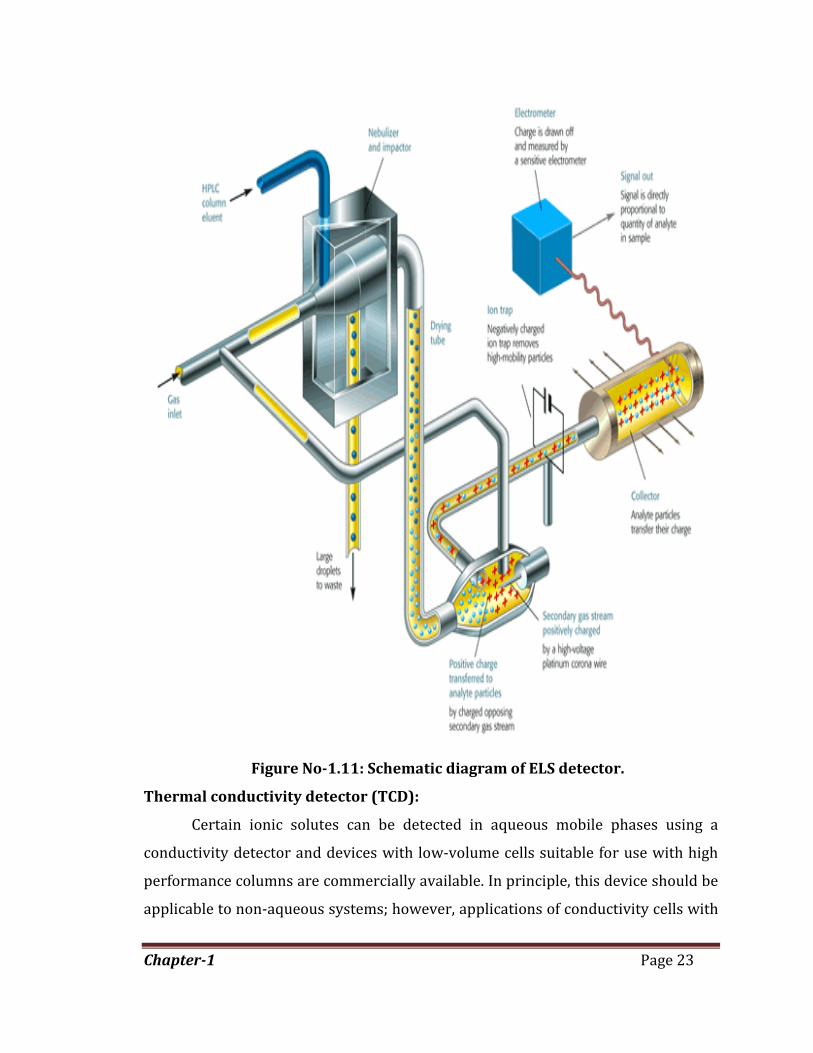
Evaporative light scattering detector (ELSD):
ELS detector employs a unique method of detection. The detection process
involves three steps: nebulization, evaporation and detection.
Nebulization:
Detector transforms the liquid phase leaving the column into an aerosol
cloud of fine droplets. The size and uniformity of the droplets are extremely
important in achieving sensitivity and reproducibility.
Evaporation:
In the evaporation tube the solvent is volatilized to produce particles or
droplets of pure analyte. The temperature of the drift tube is set at the temperature
required to evaporate the solvent. Drift tube provides evaporation of solvents at low
temperatures to minimize the evaporation of the compound of interest.
Detection:
The particles emerging from the evaporation tube enter the optical cell,
where the sample particles pass through a beam of light represents the schematic
diagram of evaporative light scattering detector (ELSD). Schematic diagram
represented in figure 1.11.
Chapter-1 Page 23
Figure No-1.11: Schematic diagram of ELS detector.
Thermal conductivity detector (TCD):
Certain ionic solutes can be detected in aqueous mobile phases using a
conductivity detector and devices with low-volume cells suitable for use with high
performance columns are commercially available. In principle, this device should be
applicable to non-aqueous systems; however, applications of conductivity cells with
Chapter-1 Page 24
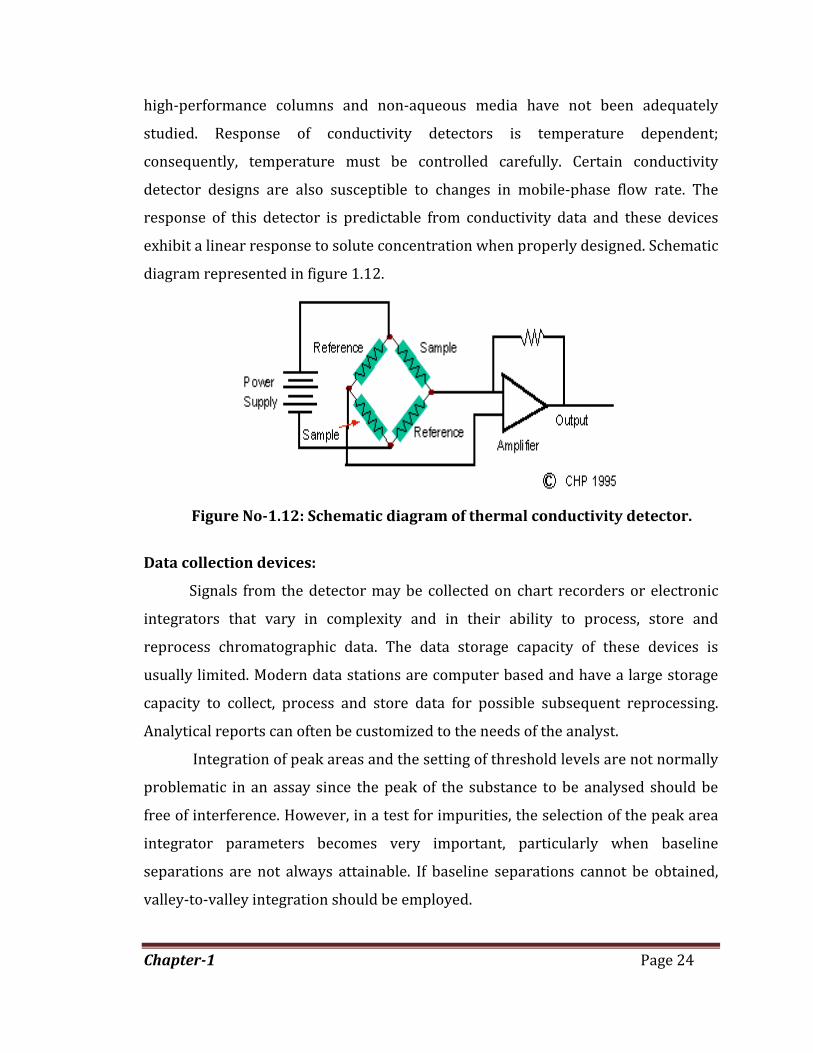
high-performance columns and non-aqueous media have not been adequately
studied. Response of conductivity detectors is temperature dependent;
consequently, temperature must be controlled carefully. Certain conductivity
detector designs are also susceptible to changes in mobile-phase flow rate. The
response of this detector is predictable from conductivity data and these devices
exhibit a linear response to solute concentration when properly designed. Schematic
diagram represented in figure 1.12.
Figure No-1.12: Schematic diagram of thermal conductivity detector.
Data collection devices:
Signals from the detector may be collected on chart recorders or electronic
integrators that vary in complexity and in their ability to process, store and
reprocess chromatographic data. The data storage capacity of these devices is
usually limited. Modern data stations are computer based and have a large storage
capacity to collect, process and store data for possible subsequent reprocessing.
Analytical reports can often be customized to the needs of the analyst.
Integration of peak areas and the setting of threshold levels are not normally
problematic in an assay since the peak of the substance to be analysed should be
free of interference. However, in a test for impurities, the selection of the peak area
integrator parameters becomes very important, particularly when baseline
separations are not always attainable. If baseline separations cannot be obtained,
valley-to-valley integration should be employed.
Chapter-1 Page 25
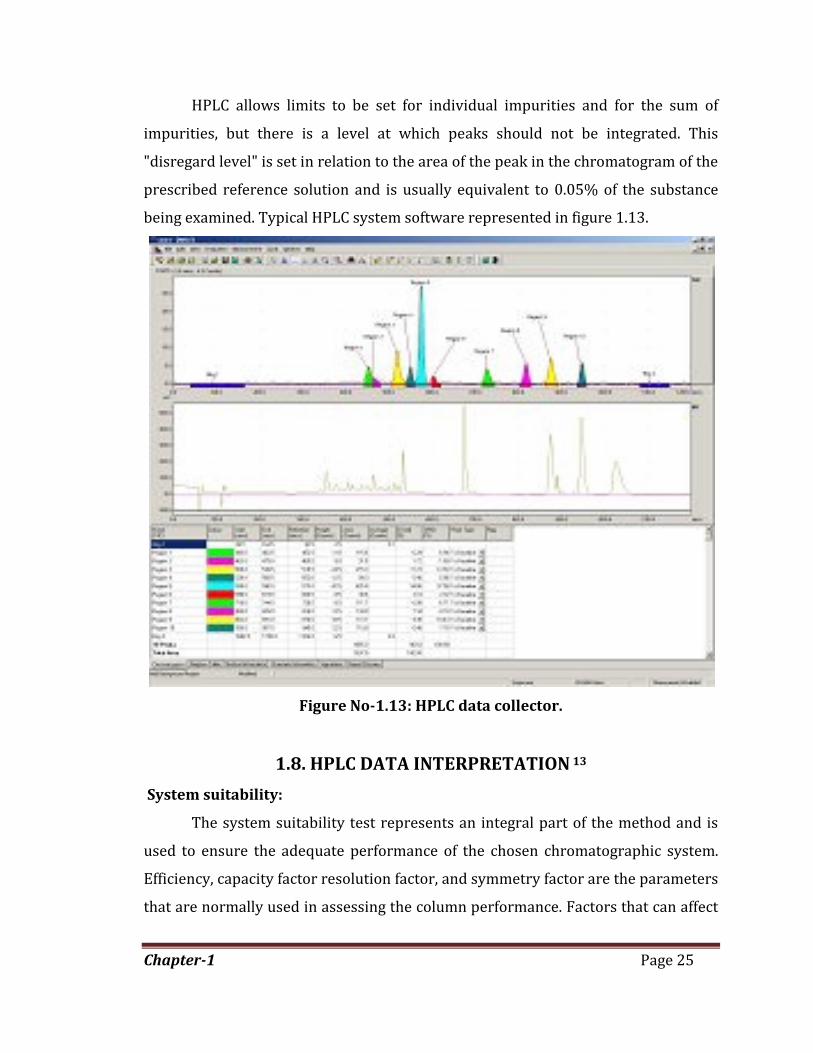
HPLC allows limits to be set for individual impurities and for the sum of
impurities, but there is a level at which peaks should not be integrated. This
"disregard level" is set in relation to the area of the peak in the chromatogram of the
prescribed reference solution and is usually equivalent to 0.05% of the substance
being examined. Typical HPLC system software represented in figure 1.13.
Figure No-1.13: HPLC data collector.
1.8. HPLC DATA INTERPRETATION 13
System suitability:
The system suitability test represents an integral part of the method and is
used to ensure the adequate performance of the chosen chromatographic system.
Efficiency, capacity factor resolution factor, and symmetry factor are the parameters
that are normally used in assessing the column performance. Factors that can affect
Chapter-1
chromatographic behavior include mobile phase composition, temperature, ionic
strength, apparent pH, flow rate and column length and stationary phase
characteristics such as porosity, par
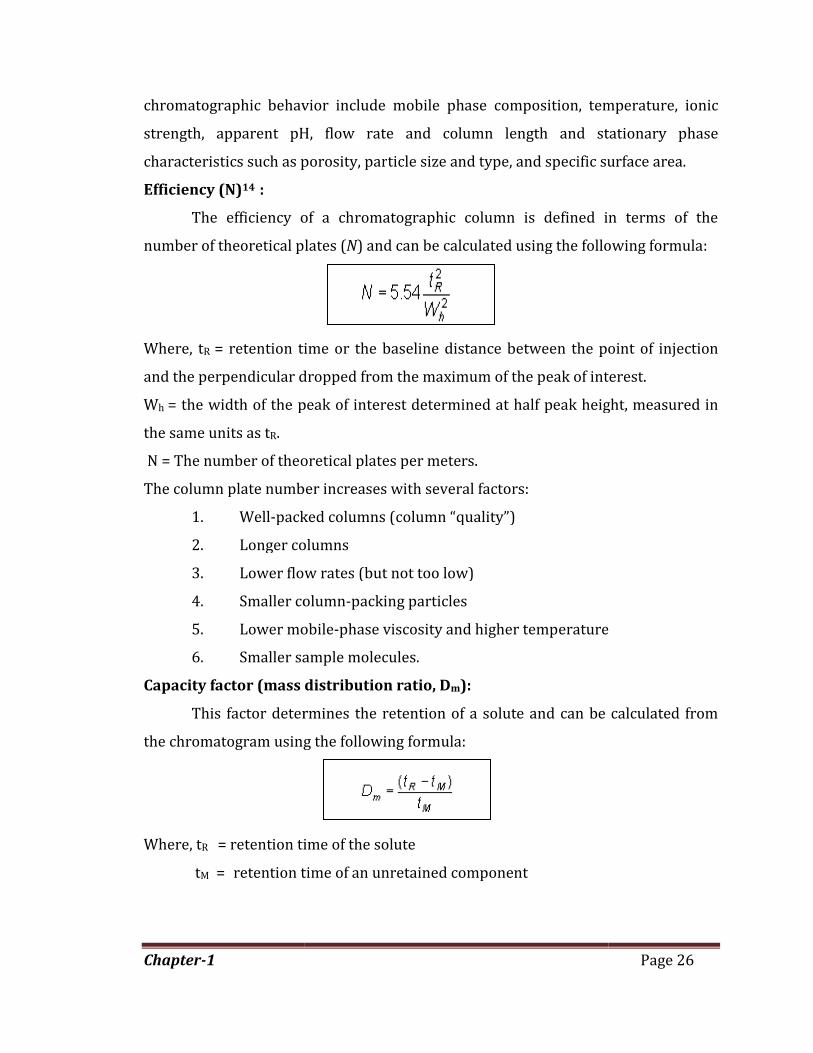
Efficiency (N)14 :
The efficiency of a chromatographic column is defined in terms of the
number of theoretical plates (
Where, tR = retention time
and the perpendicular dropped from the maximum of the peak of interest.
Wh = the width of the peak of interest determined at half peak height, measured in
the same units as tR.
N = The number of theoretical plates per meters.
The column plate number increases with several factors:
1. Well-packed columns (column “quality”)
2. Longer columns
3. Lower flow rates (but not too low)
4. Smaller column
5. Lower mobile
6. Smaller sample molecules.
Capacity factor (mass distribution ratio, D
This factor determines the retention of a solute and can be calculated from
the chromatogram using the following formula:
Where, tR = retention time of the solute
tM = retention time of an unretained component
chromatographic behavior include mobile phase composition, temperature, ionic
strength, apparent pH, flow rate and column length and stationary phase
characteristics such as porosity, particle size and type, and specific surface area.
The efficiency of a chromatographic column is defined in terms of the
number of theoretical plates (N) and can be calculated using the following formula:
= retention time or the baseline distance between the point of injection
and the perpendicular dropped from the maximum of the peak of interest.
= the width of the peak of interest determined at half peak height, measured in
N = The number of theoretical plates per meters.
The column plate number increases with several factors:
packed columns (column “quality”)
Longer columns
Lower flow rates (but not too low)
Smaller column-packing particles
Lower mobile-phase viscosity and higher temperature
Smaller sample molecules.
Capacity factor (mass distribution ratio, Dm):
This factor determines the retention of a solute and can be calculated from
the chromatogram using the following formula:
= retention time of the solute
retention time of an unretained component
Page 26
chromatographic behavior include mobile phase composition, temperature, ionic
strength, apparent pH, flow rate and column length and stationary phase
ticle size and type, and specific surface area.
The efficiency of a chromatographic column is defined in terms of the
) and can be calculated using the following formula:
or the baseline distance between the point of injection
and the perpendicular dropped from the maximum of the peak of interest.
= the width of the peak of interest determined at half peak height, measured in
and higher temperature
This factor determines the retention of a solute and can be calculated from

Chapter-1
A low Dm value indicates that the peak elutes close to the solvent front, which
may compromise selectivity. A minimum
of interest.
The retention time of the test substance can be varied, if necessary, by
changing the relative proportion or composition of solvents in the mobile phase.
Generally, an increase in the proportion of a more polar solvent will lead to a
shorter retention time on a normal
reversed-phase column.
Resolution factor (Rs):
It is measure of the extent of separation of two compounds and the baseline
separation is achieved.
The resolution between two peaks of
be calculated using the following formula:
Where, tR1 and tR2 = retention times or baseline distances between the point of
injection and the perpendicular dropped from the maximum of each of the two
peaks.
Wb1 and Wb2 = the respective peak widths determined at half peak height, measured
in the same units as tR1 and
The value of Rs for a baseline separation between peaks of similar height should be
at least two. Resolution graphs represented in figure 1.14.
Figure No
value indicates that the peak elutes close to the solvent front, which
may compromise selectivity. A minimum Dm value of 1 is recommended for the peak
The retention time of the test substance can be varied, if necessary, by
changing the relative proportion or composition of solvents in the mobile phase.
Generally, an increase in the proportion of a more polar solvent will lead to a
etention time on a normal-phase column and a longer retention time on a
phase column.
):
It is measure of the extent of separation of two compounds and the baseline
The resolution between two peaks of similar height in a chromatogram can
be calculated using the following formula:
= retention times or baseline distances between the point of
injection and the perpendicular dropped from the maximum of each of the two
= the respective peak widths determined at half peak height, measured
and tR2.
for a baseline separation between peaks of similar height should be
at least two. Resolution graphs represented in figure 1.14.
Figure No-1.14: Resolution calculation graphs
Page 27
value indicates that the peak elutes close to the solvent front, which
value of 1 is recommended for the peak
The retention time of the test substance can be varied, if necessary, by
changing the relative proportion or composition of solvents in the mobile phase.
Generally, an increase in the proportion of a more polar solvent will lead to a
phase column and a longer retention time on a
It is measure of the extent of separation of two compounds and the baseline
similar height in a chromatogram can
= retention times or baseline distances between the point of
injection and the perpendicular dropped from the maximum of each of the two
= the respective peak widths determined at half peak height, measured
for a baseline separation between peaks of similar height should be
Chapter-1
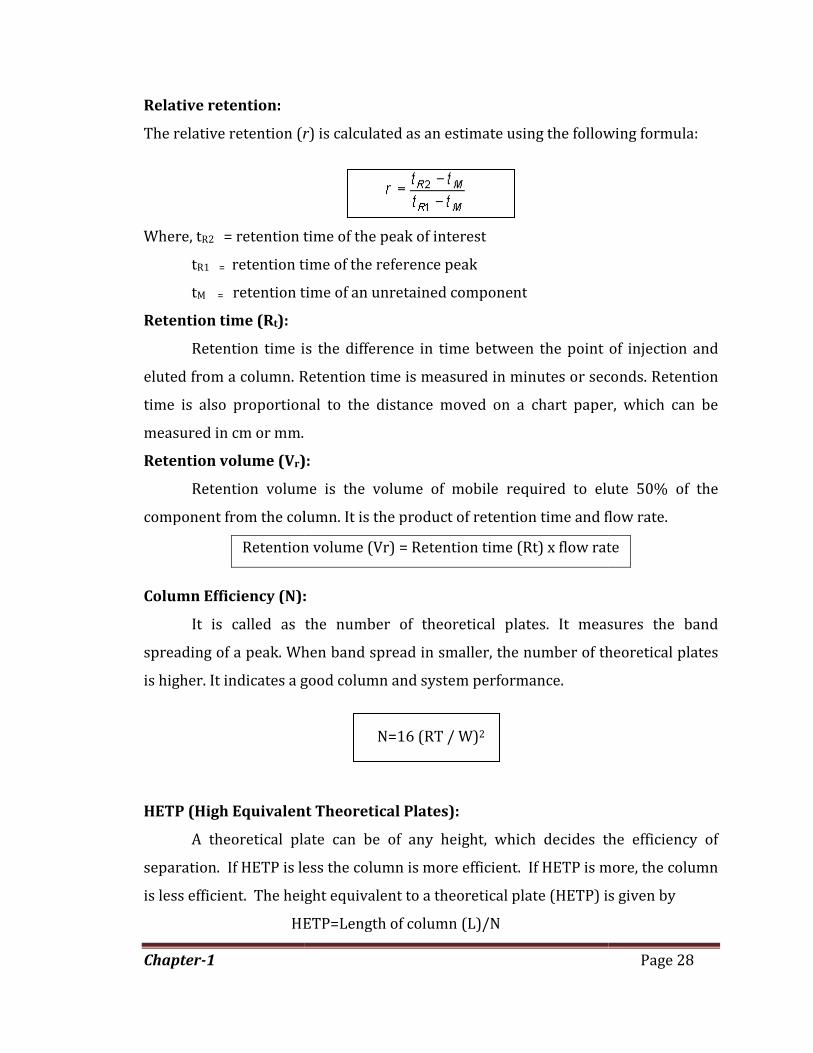
Relative retention:
The relative retention (r
Where, tR2 = retention time of the peak of interest
tR1 = retention time of the reference peak
tM = retention time of an unretained component
Retention time (Rt):
Retention time is the difference in time between the point of injection and
eluted from a column. Retention time is measured in minutes or se
time is also proportional to the distance moved on a chart paper, which can be
measured in cm or mm.
Retention volume (Vr):
Retention volume is the volume of mobile required to elute 50% of the
component from the column. It is the product
Retention volume (Vr) = Retention time (Rt) x flow rate
Column Efficiency (N):
It is called as the number of theoretical plates. It measures the band
spreading of a peak. When band spread in smaller, the number of
is higher. It indicates a good column and system performance.
HETP (High Equivalent Theoretical Plates):
A theoretical plate can be of any height, which decides the efficiency of
separation. If HETP is less the column is more efficient. If HETP is more, the column
is less efficient. The height equivalent to a theoretical plate (HETP) is given by
HETP=Length of column (L)/N
r) is calculated as an estimate using the following formula:
= retention time of the peak of interest
retention time of the reference peak
retention time of an unretained component
Retention time is the difference in time between the point of injection and
eluted from a column. Retention time is measured in minutes or seconds. Retention
time is also proportional to the distance moved on a chart paper, which can be
):
Retention volume is the volume of mobile required to elute 50% of the
component from the column. It is the product of retention time and flow rate.
Retention volume (Vr) = Retention time (Rt) x flow rate
Column Efficiency (N):
It is called as the number of theoretical plates. It measures the band
spreading of a peak. When band spread in smaller, the number of theoretical plates
is higher. It indicates a good column and system performance.
N=16 (RT / W)2
HETP (High Equivalent Theoretical Plates):
A theoretical plate can be of any height, which decides the efficiency of
separation. If HETP is less the column is more efficient. If HETP is more, the column
is less efficient. The height equivalent to a theoretical plate (HETP) is given by
HETP=Length of column (L)/N
Page 28
) is calculated as an estimate using the following formula:
Retention time is the difference in time between the point of injection and
conds. Retention
time is also proportional to the distance moved on a chart paper, which can be
Retention volume is the volume of mobile required to elute 50% of the
of retention time and flow rate.
Retention volume (Vr) = Retention time (Rt) x flow rate
It is called as the number of theoretical plates. It measures the band
theoretical plates
A theoretical plate can be of any height, which decides the efficiency of
separation. If HETP is less the column is more efficient. If HETP is more, the column
is less efficient. The height equivalent to a theoretical plate (HETP) is given by

Chapter-1
Where N = plates per meter
RT = retention time of the components.
W = width of the base of the component peak using tangent method.
L = column length in meters
Symmetry factor (As):
The symmetry factor for a peak can be calculated using the following
formula:
Where, Wx = width at 5% of peak height measured from the baseline.
d = baseline distance between the perpendicular dropped from the peak maximum
and the leading edge of the peak at 5% of the peak height, measured in the same
units as Wx.
Values of As which are greater than 2 may lead to incorrect integration,
resulting in erroneous quantitation. The main factors that influence peak symmetry
depend upon retention, solvent effects, incompatibility of the solute with the mobile
phase or development of an excessive void at the inlet of the column. In reversed
phase chromatography
silanol groups in the stationary phase may lead to tailing (poor peak symmetry).
Tailing Factor (T):
The Tailing Factor T, a measure of peak symmetry is unity for perfectly
symmetrical peaks and its va
some cases, values less than 1 may be observed. As peak asymmetry increases
integration and hence precision becomes less reliable.
Where, W0.05 = width of peak at 5% height
f = Distance from the peak maximum to the leading edge of the peak, the distance
being measured at a point 5% of the peak height from the baseline Limit :
Where N = plates per meter
RT = retention time of the components.
W = width of the base of the component peak using tangent method.
= column length in meters
The symmetry factor for a peak can be calculated using the following
= width at 5% of peak height measured from the baseline.
baseline distance between the perpendicular dropped from the peak maximum
and the leading edge of the peak at 5% of the peak height, measured in the same
which are greater than 2 may lead to incorrect integration,
roneous quantitation. The main factors that influence peak symmetry
depend upon retention, solvent effects, incompatibility of the solute with the mobile
phase or development of an excessive void at the inlet of the column. In reversed
phase chromatography, adsorption phenomena due to the presence of residual
silanol groups in the stationary phase may lead to tailing (poor peak symmetry).
The Tailing Factor T, a measure of peak symmetry is unity for perfectly
symmetrical peaks and its value increases as tailing becomes more pronounced. In
some cases, values less than 1 may be observed. As peak asymmetry increases
integration and hence precision becomes less reliable.
= width of peak at 5% height
Distance from the peak maximum to the leading edge of the peak, the distance
being measured at a point 5% of the peak height from the baseline Limit :
T= W0.05 /2f
Page 29
W = width of the base of the component peak using tangent method.
The symmetry factor for a peak can be calculated using the following
= width at 5% of peak height measured from the baseline.
baseline distance between the perpendicular dropped from the peak maximum
and the leading edge of the peak at 5% of the peak height, measured in the same
which are greater than 2 may lead to incorrect integration,
roneous quantitation. The main factors that influence peak symmetry
depend upon retention, solvent effects, incompatibility of the solute with the mobile
phase or development of an excessive void at the inlet of the column. In reversed-
, adsorption phenomena due to the presence of residual
silanol groups in the stationary phase may lead to tailing (poor peak symmetry).
The Tailing Factor T, a measure of peak symmetry is unity for perfectly
lue increases as tailing becomes more pronounced. In
some cases, values less than 1 may be observed. As peak asymmetry increases
Distance from the peak maximum to the leading edge of the peak, the distance
being measured at a point 5% of the peak height from the baseline Limit : ≤ 2 .

Chapter-1 Page 30
1.9. HPLC METHOD DEVELOPMENT
The need to save method development time and improve accuracy is forcing
today’s analytical chemists to look for better, faster ways to develop stability
indicating methods. Starting with HPLC columns that offer excellent reproducibility,
column lifetime and sensitivity this step-by-step protocol can save the method
development chemist time and money required to establish new method. This
approach is consistent with developing process.
Reverse phase chromatography is the most popular analytical technique in
the pharmaceutical industry. It is widely used for assay and impurity profiling of
pharmaceutical substances. The quality of HPLC methods has become increasingly
important. The requirements for methods usually depend on the stage of
development of the drug. In early phases, the focus is mainly on high throughput
and rapid turn-round time, while methods for late phase pharmaceutical
development need to be simple and technically straightforward, moreover robust
and rugged.
General properties
Compare the structure of impurities, starting materials, byproducts,
intermediates and degradation products with the structure of drug substances and
arrive at the polarity whether they are less polar or more polar than the compound
of interest. By observing the molecule based on the functional groups it can be
determined whether the molecule is acid, basic or neutral. Based on the nature of
the compound, pH of the mobile phase can be selected. If compound is acidic, acidic
mobile phase is preferable, for basic compounds low pH and basic mobile phases are
preferable. For a neutral compound neutral mobile phase is suitable. Elution of the
compounds is based on polarity. The more hydrophobic the analyte, the longer it is
retained. When an analyte is ionized, it becomes less hydrophobic and, therefore, its
retention decreases.
Chapter-1 Page 31
Literature review
Literature of selected and similar molecules may be collected from USP, EP,
JP, IP, chromatography journals and patents. If method is available check the
suitability of the method to meet the requirements or modify the method to suit the
requirements such as resolution of possible impurities as per the synthetic process.
Impurities to be considered are intermediates, process impurities and degradants.
Collect samples, standards and all possible impurities in each stage and also collect
information on physico-chemical properties.
Procedure (Protocol) For Method Development:
Literature Survey
Conduct literature survey and collect information available from the following
references
� Chemical abstracts
� Analytical abstracts
� Journals
� National library of medicines etc,
And collect the following literature from survey .
Solubility profile: Solubility of drug in different solvents at different pH conditions
which is useful while selecting the diluents for standard solution and extraction
solvents for test solution.
Analytical profile: Physico-chemical and spectroscopic properties, impurity and
degradation profile of drug substance. Spectral profile is useful in the selection of
detector wavelength for analysis, where as degradation profile helps to develop the
method for separation of all possible impurities and degradants from API.
Stability profile: Stability of the drug with storage conditions. This helps to adopt
suitable and adequate precautions while handling drug substances and its solutions.
The various parameters that include to be optimized during method development
are:
� Selection of mode of separation
� Selection and optimization of mobile phase
Chapter-1 Page 32
� Selection of detector wavelength
� Selection of column
� Selection of solvent delivery systems
� Selection of flow rate
� Selection of column temperature
� Selection of diluent and extraction procedure
� Selection of test concentration and injection volume
� Establishment of stability of the solutions
� Establishment of system suitability
Selection of Mode of Separation
In reverse phase mode, the mobile phase is comparatively more polar than the
stationary phase. For the separation of polar or moderately polar compounds, the
most preferred mode is reverse phase. The nature of the analyte is the primary
factor in the selection of the mode of separation. A second factor is the nature of the
matrix.
Selection and Optimization of Mobile Phase
The primary objective in selection and optimization of mobile phase is to
achieve optimum separation of all individual impurities and degradants from
analyte peak. The selection of mobile phase is done always in combination with
selection of column (stationary phase). The following are the parameters, which
shall be taken into consideration during the selection and optimization of mobile
phase.
� pH and pKa value
� Buffer, if any and its strength
� Selection of buffer
� pH of buffer or pH of mobile phase
� Mobile phase composition
� pH and pKa value

Chapter-1 Page 33
� Based on pH or pKa values the nature of the compound and polarity of the
compound can be assumed. When pH is equivalent to pKa, the compound is
half ionized. Almost all the pH related change occurs with in ± 1.5 units of the
pKa value. Outside this range the compound is either ionized or non-ionized,
and its retention does not change much with pH.
Buffer if any and its strength
Buffer and its strength play an important role in deciding the peak
symmetries and separation. Various types of buffers can be employed for achieving
the required separation. The following are some of the most commonly used ones.
� Phosphate buffers : KH2PO4, K2HPO4, Na2HPO4, H3PO4
� Acetate buffers : Ammonium acetate, Sodium acetate
� Amine buffers : Triethyl amine/ Diethyl amine
� Buffers with various ion pair reagents like Tetra Butyl ammonium hydrogen
sulphate.
� Butane sulphonic acid, Hexane sulphonic acid, Heptane sulphonic acid etc,
It is important to use the buffers with suitable strength to cope up for the
injection load on the column otherwise peak tailing may arise due to changes in
ionic form during chromatography. The retention times also depends on the molar
strength of the buffer since molar strength is inversely proportional to retention
time.
Ideally, the strength of the buffer shall be adopted in-between 0.05M to 0.2M.
The selection of the buffer and its strength is done always in combination with
selection of organic phase composition in mobile phase. The strength of the buffer
can be altered if necessary to achieve the required separation. But it has to be
ensured that the higher strength of the buffer shall not result in
precipitation/turbidity either in mobile phase or in standard and test solution while
allowed standing in bench top or in refrigerator. Experiments shall be conducted
using different buffers having different strength to obtain the required separation.
The buffer having a particular strength, which gives separation of all
individual impurities from API peak, shall be selected. Then strength of the buffer
Chapter-1 Page 34
can be varied by about 10 to 20 % from the selected buffer strength and the effect of
variation shall be studied. After reviewing the results of variation, the buffer and its
strength shall be selected, this is rugged for at least 2% variation in strength.
Selection of Buffer
In reversed phase HPLC, the retention of analytes is related to their hydro
phobicity. The more hydrophobic the analyte, the longer it is retained. When an
analyte is ionized, it becomes less hydrophobic and, therefore, its retention
decreases. Acids lose a proton and become ionized when pH increases and bases
gain a proton and become ionized when pH decreases. Therefore, when separating
mixtures containing acids and/or bases by reversed phase HPLC, it is necessary to
control the pH of the mobile phase using an appropriate buffer in order to achieve
reproducible results.
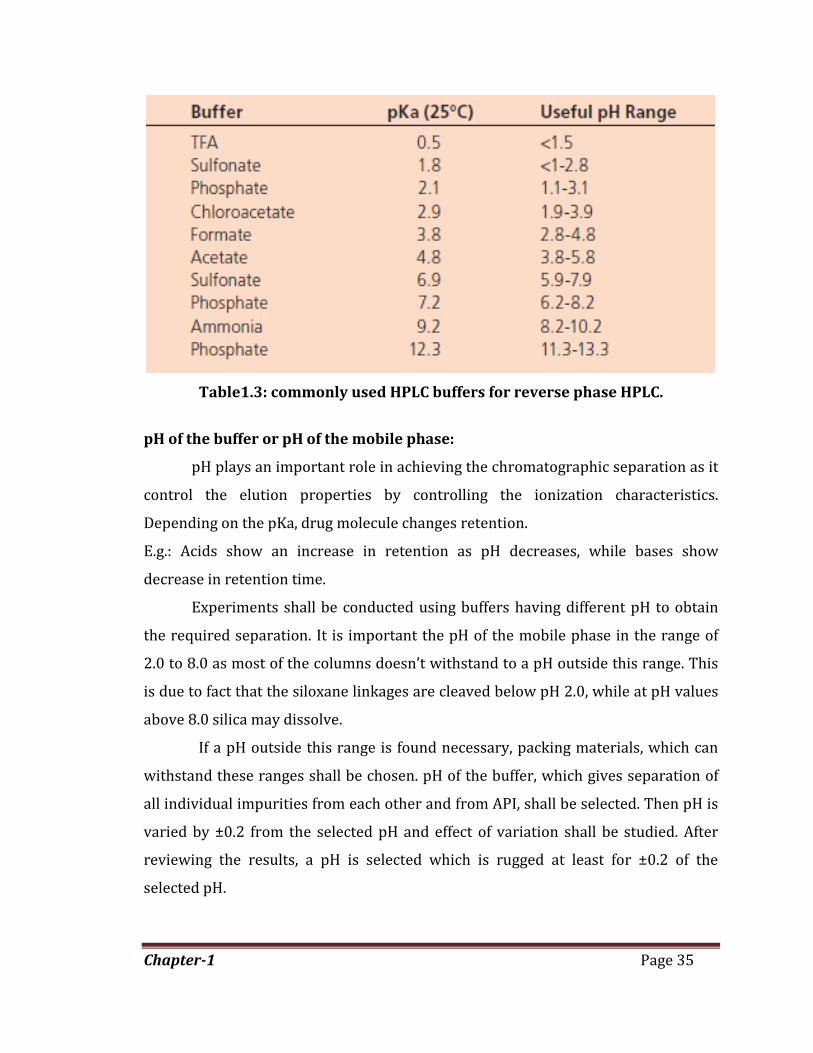
Ideally the buffer should transmit light below 220nm. All buffers are most
soluble in methanol and least soluble in tetrahydrofuran. Ammonium acetate is the
most soluble buffer salt, ammonium phosphate is less soluble, and potassium
phosphate is the least soluble buffer salt in each aqueous-organic mixture.
Phosphate buffers at pH 3.0 are more soluble than phosphate buffers at pH 7.0.
Commonly used HPLC buffers are showed in table 1.2. Optimum buffering capacity
occurs at a pH equal to the pKa of the buffer. In general, most buffers may provide
adequate buffering capacity for controlling mobile phase pH only within ±1 unit of
their pKa, beyond that, buffering capacity will be inadequate. A buffer concentration
in the range of 25 to 50 mM is adequate for most reversed phase applications.
Chapter-1 Page 35
Table1.3: commonly used HPLC buffers for reverse phase HPLC.
pH of the buffer or pH of the mobile phase:
pH plays an important role in achieving the chromatographic separation as it
control the elution properties by controlling the ionization characteristics.
Depending on the pKa, drug molecule changes retention.
E.g.: Acids show an increase in retention as pH decreases, while bases show
decrease in retention time.
Experiments shall be conducted using buffers having different pH to obtain
the required separation. It is important the pH of the mobile phase in the range of
2.0 to 8.0 as most of the columns doesn’t withstand to a pH outside this range. This
is due to fact that the siloxane linkages are cleaved below pH 2.0, while at pH values
above 8.0 silica may dissolve.
If a pH outside this range is found necessary, packing materials, which can
withstand these ranges shall be chosen. pH of the buffer, which gives separation of
all individual impurities from each other and from API, shall be selected. Then pH is
varied by ±0.2 from the selected pH and effect of variation shall be studied. After
reviewing the results, a pH is selected which is rugged at least for ±0.2 of the
selected pH.
Chapter-1 Page 36
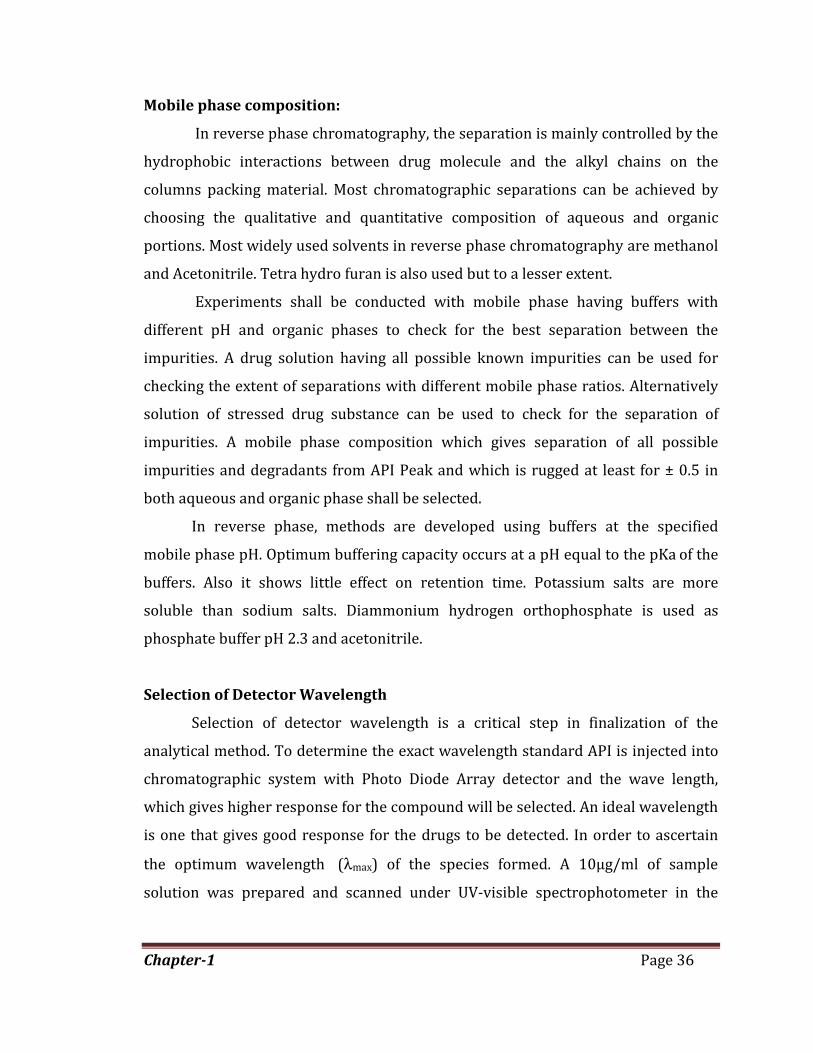
Mobile phase composition:
In reverse phase chromatography, the separation is mainly controlled by the
hydrophobic interactions between drug molecule and the alkyl chains on the
columns packing material. Most chromatographic separations can be achieved by
choosing the qualitative and quantitative composition of aqueous and organic
portions. Most widely used solvents in reverse phase chromatography are methanol
and Acetonitrile. Tetra hydro furan is also used but to a lesser extent.
Experiments shall be conducted with mobile phase having buffers with
different pH and organic phases to check for the best separation between the
impurities. A drug solution having all possible known impurities can be used for
checking the extent of separations with different mobile phase ratios. Alternatively
solution of stressed drug substance can be used to check for the separation of
impurities. A mobile phase composition which gives separation of all possible
impurities and degradants from API Peak and which is rugged at least for ± 0.5 in
both aqueous and organic phase shall be selected.
In reverse phase, methods are developed using buffers at the specified
mobile phase pH. Optimum buffering capacity occurs at a pH equal to the pKa of the
buffers. Also it shows little effect on retention time. Potassium salts are more
soluble than sodium salts. Diammonium hydrogen orthophosphate is used as
phosphate buffer pH 2.3 and acetonitrile.
Selection of Detector Wavelength
Selection of detector wavelength is a critical step in finalization of the
analytical method. To determine the exact wavelength standard API is injected into
chromatographic system with Photo Diode Array detector and the wave length,
which gives higher response for the compound will be selected. An ideal wavelength
is one that gives good response for the drugs to be detected. In order to ascertain
the optimum wavelength (λmax) of the species formed. A 10µg/ml of sample
solution was prepared and scanned under UV-visible spectrophotometer in the
Chapter-1 Page 37
range of 200 to 400nm against diluent as blank. The wave length selected based on
the maximum absorption occurred.
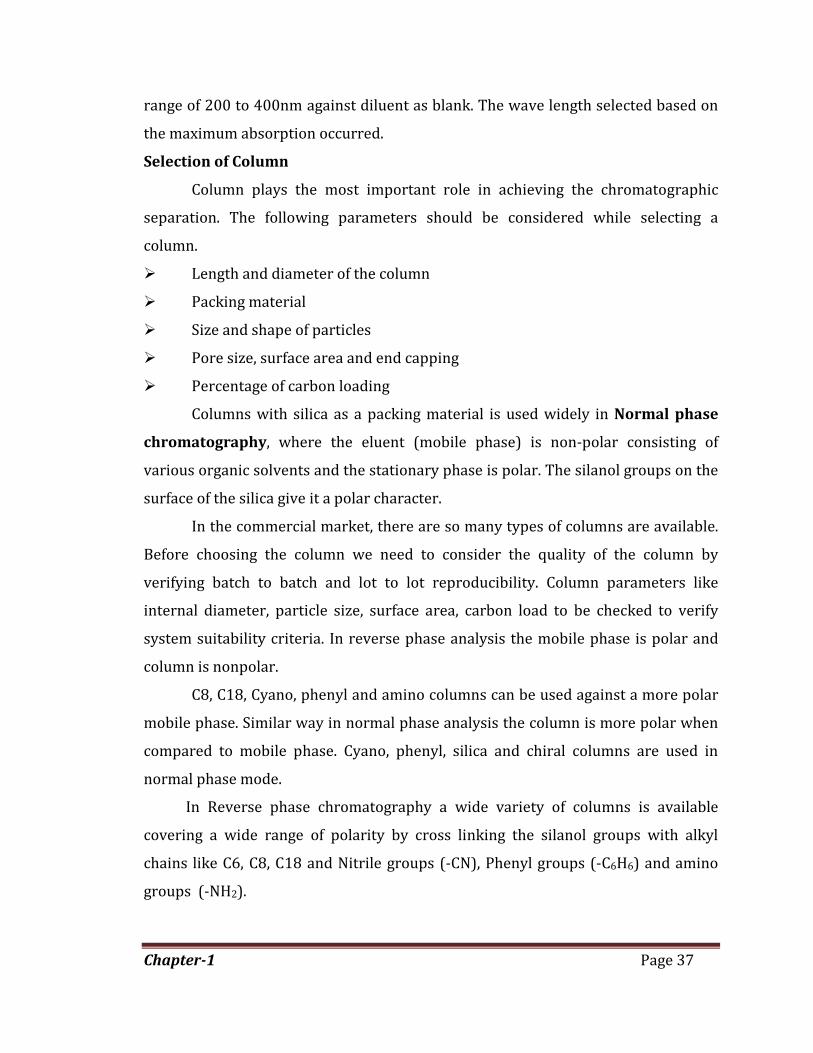
Selection of Column
Column plays the most important role in achieving the chromatographic
separation. The following parameters should be considered while selecting a
column.
� Length and diameter of the column
� Packing material
� Size and shape of particles
� Pore size, surface area and end capping
� Percentage of carbon loading
Columns with silica as a packing material is used widely in Normal phase
chromatography, where the eluent (mobile phase) is non-polar consisting of
various organic solvents and the stationary phase is polar. The silanol groups on the
surface of the silica give it a polar character.
In the commercial market, there are so many types of columns are available.
Before choosing the column we need to consider the quality of the column by
verifying batch to batch and lot to lot reproducibility. Column parameters like
internal diameter, particle size, surface area, carbon load to be checked to verify
system suitability criteria. In reverse phase analysis the mobile phase is polar and
column is nonpolar.
C8, C18, Cyano, phenyl and amino columns can be used against a more polar
mobile phase. Similar way in normal phase analysis the column is more polar when
compared to mobile phase. Cyano, phenyl, silica and chiral columns are used in
normal phase mode.
In Reverse phase chromatography a wide variety of columns is available
covering a wide range of polarity by cross linking the silanol groups with alkyl
chains like C6, C8, C18 and Nitrile groups (-CN), Phenyl groups (-C6H6) and amino
groups (-NH2).
Chapter-1 Page 38
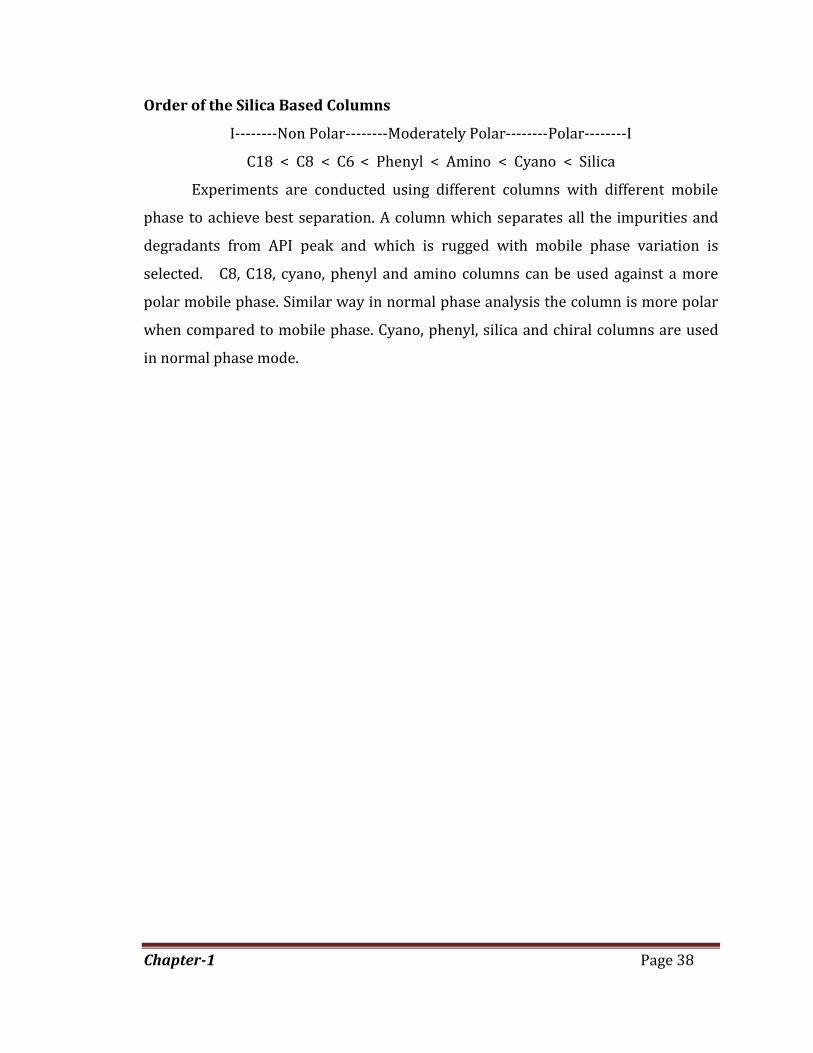
Order of the Silica Based Columns
I--------Non Polar--------Moderately Polar--------Polar--------I
C18 < C8 < C6 < Phenyl < Amino < Cyano < Silica
Experiments are conducted using different columns with different mobile
phase to achieve best separation. A column which separates all the impurities and
degradants from API peak and which is rugged with mobile phase variation is
selected. C8, C18, cyano, phenyl and amino columns can be used against a more
polar mobile phase. Similar way in normal phase analysis the column is more polar
when compared to mobile phase. Cyano, phenyl, silica and chiral columns are used
in normal phase mode.
Chapter-1 Page 39
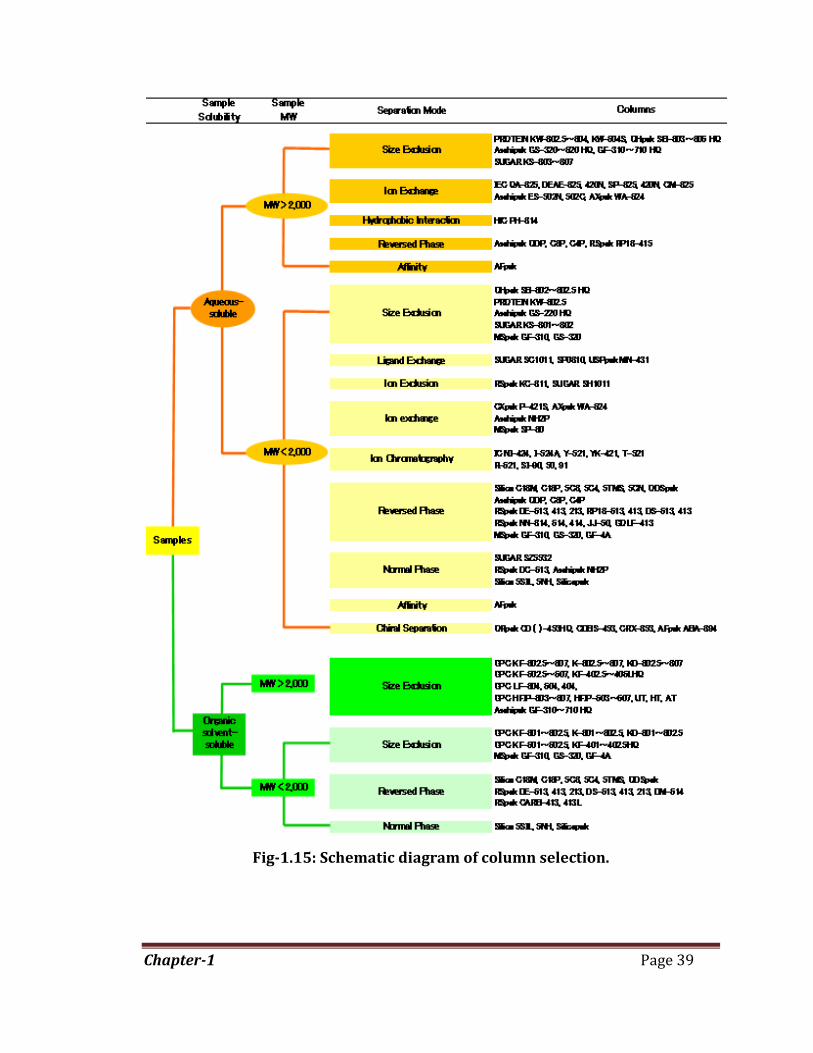
Fig-1.15: Schematic diagram of column selection.
Chapter-1 Page 40
Selection of Solvent Delivery Systems
Chromatographic separations with single eluent i.e., all the constituents of
mobile phase is mixed and pumped as single eluent is called isocratic elution and is
always preferable. However gradient elution is a powerful tool in achieving
separation between closely eluting compounds having different polarities. The
importance of gradient elution is that the polarity and ionic strength of the mobile
phase can be changed during the run. Gradient elution is of two types
1. Low pressure gradient and
2. High pressure gradient elution
Low pressure gradient is one in which mobile phases are mixed at pre
determined ratios and in High pressure Gradient mobile phase are pumped at
different flow rates to achieve the required composition and mixed in mixing
chamber and then introduced to the column. Low pressure gradient is opted when
NMT 80% of organic phase has to be pumped. High pressure gradient is opted when
more than 80% of organic phase has to be pumped. While optimizing the gradient
elution it is important to monitor the following
� The graph is to be monitored so as to ensure that the overall system pressure
will not cross 300 bars at any point during the run.
� Flow rate is to be physically cross checked by collecting the output from the
detector during the run at different time intervals. This avoids pumping
problems which may arise due to higher organic phase compositions.
Selection of flow rate
Flow rate is selected based on the following factors
� Retention time
� Column composition
� Separation impurities
� Peak symmetry
Preferably flow rate shall not be more than 2.5 mL/Min. A flow rate that
gives least retention times, good peak symmetries, least back pressure and better
separation of impurities from API peak shall be selected.
Chapter-1 Page 41
Selection of Column Temperature
Ambient temperature is always preferred as column temperature. However
if the peak symmetry could not be achieved then the column temperature can be
varied between 30° to 80°C. If a column temperature above 80°C is found necessary,
packing material which can withstand to that temperature shall be chosen. The
increase in column temperature generally will result in reduction in peak
asymmetry and peak retentions.
For developing a method, the type of column being used and functionality,
structure, pKa and reactivity must be considered. Optimize the temperature and
adjust the mobile phase compositions to achieve best separation. Usually the silica
column temperatures stable up to 60°C, optimized flow rate achieve the shortest
analysis and adequate resolution and efficiency. In isocratic method performs the
analysis at 50°c. Reduce the amount of organic modifier in the mobile phase is
necessary to produce the good separation. Some column pre heaters are used to
preheat the mobile phase to avoid broad broadening. Also use peltier chip for
precise temperature and controls the column effluent. Silica based stationary phases
stable at up to 60°c some instances up to 90°c.the higher temperature will leads the
shorter column life time. At elevated temperature the solute transfer from mobile
phase to the stationary phase is more efficient.
Selection of diluent and extraction procedure
Diluent for test preparation is selected initially based on solubility of the
drug substance. It is selected in such a way that the drug substance is soluble in
which the extraction is complete, due to which there won’t be any interference and
in which peak symmetry and resolution between impurities and API Peak is found
satisfactory. General methods followed for extraction are sonication, rotarary
shaking or both. In some cases where API is not extracted by above methods then
heating is adopted if substance is stable and it should not precipitate upon cooling to
room temperature.
Experiments are conducted to optimize the extraction of API in the presence
of excipients at different test concentrations using the diluents chosen based on

Chapter-1 Page 42
solubility at different time intervals of sonication time or rotary shaking or both and
select the test concentrations at which the extraction is most efficient.
Selection of test concentration and injection volume
The test concentration is generally chosen based upon the response of API
peak at the selected detector wavelength. However test concentration is finalized
after it is proved that API is completely extractable at the selected test
concentration. Generally an injection volume of 10 to 20µL is recommended for
estimation of API. However if the extractions are found to be difficult then the test
concentration can be kept low and the injection volume can be increased up to 50µL.
But it is to be ensured that at the selected volume the column is not overloaded.
Establishment of Stability of the Solutions
The assessment of stability of the solution is carried out by keeping the test
solution at Room Temperature and at 2o to 8oC and this test solution is injected
along with the freshly prepared standard and %RSD of the standard solution and
test solution is calculated. An acceptance criterion here is that the %RSD should not
be NMT 2%.
Establishment of System Suitability
System suitability parameter has to be selected based on the Tailing factor,
Plate count, Resolution, and RSD. In general resolution factor for the closely eluting
compounds is selected as a system suitability requirement. If the separation of
impurities from each other and from API peak is found to be satisfactory, there is no
need to keep a resolution factor as system suitability parameter. In such cases only
standard reproducibility and symmetry of standard peak can be adopted as a
system suitability requirement.
1.10. HPLC METHOD VALIDATION15-21
According to ICH and FDA guidelines, Validation defined as an act of proving
that any procedures, process, equipment, materials, activity or system performs as
expected under a given set of conditions. Basically validation is proving that the
performance is as intended when extended to an analytical procedure, depending
Chapter-1 Page 43
upon the application, it means that a method works reproducibly, when carried out
by some different persons, in same or different laboratories using different reagents,
different equipments etc.
According to U. S. FDA defines the term “Validation is a process of
establishing documented evidence which provides a high degree of assurance that a
specific process will consistently produce meeting, its predetermined specifications
and quality attributes”.
According to USP, “Validation of an analytical method is the process by which
it is established by laboratory studies that the performance characteristic of the
method meets the requirements for the intended in analytical applications”.
Purpose of Validation:
1. Enable the scientists to communicate scientifically and effectively on
technical matter.
2. Setting the standards of evaluation procedures for checking compliance and
taking remedial action.
3. Economic: Reduction in cost associated with process sampling and testing.
4. As quality of the product cannot always be assured by routine quality
control because of testing of statistically insignificant number of samples.
Types of Analytical Procedures to be validated
The discussion of the validation of analytical procedures is directed to the
four most common types of analytical procedures:
� Identification tests;
� Quantitative tests for impurities content;
� Limit tests for the control of impurities;
� Quantitative tests of the active moiety in samples of drug substance or drug
product or other selected component(s) in the drug product.
Although there are many other analytical procedures, such as dissolution
testing for drug products or particle size determination for drug substance, these
have not been addressed in the initial text on validation of analytical procedures.

Chapter-1 Page 44
Validation of these additional analytical procedures are equally important to those
listed here in and may be addressed in subsequent documents.
A brief description of the types of tests considered in this document is
provided below.
1. Identification tests are intended to ensure the identity of an analyte in a
sample. This is normally achieved by comparison of a property of the sample
(e.g., spectrum, chromatographic behavior, chemical reactivity, etc) to that of
a reference standard.
2. Assay procedures are intended to measure the analyte present in a given
sample. In the context of this document, the assay represents a quantitative
measurement of the major component(s) in the drug substance. For the drug
product, similar validation characteristics also apply when assaying for the
active or other selected component(s). The same validation characteristics
may also apply to assays associated with other analytical procedures (e.g.,
dissolution).
Typical validation characteristics which should be considered are listed below:
� Accuracy
� Precision
� Repeatability
� Intermediate precision
� Specificity
� Detection limit
� Quantitation limit
� Linearity range
Furthermore revalidation may be necessary in the following circumstances:
� Changes in the synthesis of the drug substance
� Changes in the composition of the finished product
� Changes in the analytical procedure

Chapter-1
The degree of revalidation required depends o
Certain other changes may require validation as well. Method validation flow chart
represented in figure 1.16.
Figure No-
Accuracy:
It is the closeness of agreement between the actual value of the drug and the
measured value. Spike and recovery Studies are performed to measure accuracy, a
known sample is added to the excipients and the actual drug value is compared to
the value found by the assay. Accuracy is expressed as the bias or the % error
between the observed value and the true value (assay value/actual value x 100%).
Precision:
The precision of an analytical procedure expresses the closeness of
agreement (degree of scatter) betwee
multiple sampling of the same homogeneous sample under the prescribed
conditions. Precision may be considered at three levels: repeatability, intermediate
precision and reproducibility.
Precision should be investig
However, if it is not possible to obtain a homogeneous sample it may be investigated
using artificially prepared samples or a sample solution.
The precision of an analytical procedure is usually expressed as the
standard deviation or coefficient of variation of a series of measurements.
The degree of revalidation required depends on the nature of the changes.
Certain other changes may require validation as well. Method validation flow chart
represented in figure 1.16.
-1.16: Figure showing validation parameters.
is the closeness of agreement between the actual value of the drug and the
measured value. Spike and recovery Studies are performed to measure accuracy, a
known sample is added to the excipients and the actual drug value is compared to
he assay. Accuracy is expressed as the bias or the % error
between the observed value and the true value (assay value/actual value x 100%).
The precision of an analytical procedure expresses the closeness of
agreement (degree of scatter) between a series of measurements obtained from
multiple sampling of the same homogeneous sample under the prescribed
conditions. Precision may be considered at three levels: repeatability, intermediate
precision and reproducibility.
Precision should be investigated using homogeneous, authentic samples.
However, if it is not possible to obtain a homogeneous sample it may be investigated
using artificially prepared samples or a sample solution.
The precision of an analytical procedure is usually expressed as the
standard deviation or coefficient of variation of a series of measurements.
Page 45
n the nature of the changes.
Certain other changes may require validation as well. Method validation flow chart
1.16: Figure showing validation parameters.
is the closeness of agreement between the actual value of the drug and the
measured value. Spike and recovery Studies are performed to measure accuracy, a
known sample is added to the excipients and the actual drug value is compared to
he assay. Accuracy is expressed as the bias or the % error
between the observed value and the true value (assay value/actual value x 100%).
The precision of an analytical procedure expresses the closeness of
n a series of measurements obtained from
multiple sampling of the same homogeneous sample under the prescribed
conditions. Precision may be considered at three levels: repeatability, intermediate
ated using homogeneous, authentic samples.
However, if it is not possible to obtain a homogeneous sample it may be investigated
The precision of an analytical procedure is usually expressed as the variance,
standard deviation or coefficient of variation of a series of measurements.

Chapter-1 Page 46
Repeatability:
Repeatability expresses the precision under the same operating conditions
over a short interval of time. Repeatability is also termed intra-assay precision.
Intermediate precision:
Intermediate precision expresses with in-laboratories variations: different
days, different analysts, different equipment, etc.
Reproducibility:
Reproducibility expresses the precision between laboratories (collaborative
studies, usually applied to standardization of methodology).
It is expressed as the coefficient of variation (% CV). CV is the standard
deviation of the assay values divided by the concentration of the analyte. Several
types of precision can be measured: intra-assay precision (repeatability) is the % CV
of multiple determinations of a single sample in a single test run; inter-assay
precision (also called intermediate precision) measures the % CV for multiple
determinations of a single sample, controls and reagents analyzed in several assay
runs in the same laboratory.
Linearity:
A linearity study verifies that the sample solutions are in concentrations
range where analyte response is generally performed by preparing standard
solutions at five concentration levels from 50 to 150% of the target analyte
concentrations five levels are required to allow detection of curvature in the plotted
data.
Validation over a wide range provides confidence that the routine range
provides confidence that the routine standard levels are well removed from non
linear response concentrations that the method covers a wide enough range to
incorporate the limits of content uniformity testing.
Acceptance of linear data is often judged by examining the correlation
coefficient >0.999 is generally considered as evidence of acceptable fit of the data.
For the evaluation of linearity five different concentrations of standard solutions
were prepared. The concentration ranges that prepared were between 25 to 125

Chapter-1 Page 47
µg/mL for A graph is plotted to “area” versus amount found”. The co-relation
coefficient was found to be 0.999. It is the ability of an assay to obtain test results,
which are directly proportional to the concentration of an analyte in the sample. The
determination of this parameter will identify the range of the analytical assay. It can
be measured as slope of the regression line and its variance or as the coefficient of
determination and correlation coefficient (r2).
Range:
The range of an analytical method is the interval between the upper and
lower levels (including these levels) that have been demonstrated to be determined
with precision, accuracy and linearity using the method as written. The range is
normally expressed in the same units as the test results (e.g., percentage, parts per
million) obtained by the analytical method.
Specificity:
Specificity is the ability to assess unequivocally the analyte in the presence of
components which may be expected to be present. Typically these might include
impurities, degradants, matrix, etc. Lack of specificity of an individual analytical
procedure may be compensated by other supporting analytical procedure(s).
This definition has the following implications: identification: to ensure the
identity of an analyte.
Purity Tests: to ensure that all the analytical procedures performed allow an
accurate statement of the content of impurities of an analyte, i.e. related substances
test, heavy metals, residual solvents content, etc.
Assay (content or potency): To provide an exact result which allows an
accurate statement on the content or potency of the analyte in a sample.
Limit of Detection (LOD):
It is the lowest amount of the analyte in a sample that can be detected but not
necessarily be quantitated as an exact concentration or amount. The detection limit
of an individual analytical procedure is the lowest amount of an analyte in the
sample that can be detected but not necessarily quantitated as an exact value. The
Limit of LOD value is 3.

Chapter-1 Page 48
For determining LOD initially standard deviation and slope of calibration
curve was calculated.
Where,S1 = slope of calibration curve
SD = standard deviation of peak response
S = signal obtained from the LOD solution.
N = average base line noise.
Limit of Quantification (LOQ):
It is the lowest amount of an analyte that can be measured quantitatively in a
sample with acceptable accuracy and precision. The LOQ is a parameter for tests
measuring impurities in a drug product.
The quantification limit of an individual procedure is the lowest amount of
analyte in the sample that can be quantitatively determined with suitable precision
and accuracy. The limit of LOQ value is 10.
For determining LOQ initially standard deviation and slope of calibration
curve was calculated.
LOQ = 10 (SD/S)
Or
LOQ = S/N
Robustness:
It is the capacity of an assay to remain un affected by deliberate changes to
various parameters of the method and gives an indication of its reliability during
normal assay conditions. The variations could be in room or incubator temperature
or humidity, variations in incubation times, minor variations in pH of a reagent, etc.
System Suitability:
Tailing factor for the peaks in standard solution should not be more than 1.5.
Theoretical plates for the peaks in standard solution should not be less than 2500.
LOD = 3.3 SD/S1
LOD = S/N

Chapter-1 Page 49
1.11. PHARMACETIUCAL PRODUCTS
1.11.1: DRUG SUBSTANCES:
A. Zolmitriptan: (22-25)
Zolmitriptan is a selective serotonin receptor agonist of the 1B and 1D sub
types. It is a triptan, used in the acute treatment of migraine attacks with or without
aura and cluster headaches. Zolmitriptan is used for the acute treatment of
migraines with or without aura in adults. Zolmitriptan is not intended for the
prophylactic therapy of migraine or for use in the management of hemiplegic or
basilar migraine. Zolmitriptan should not be given to patients with ischemic heart
disease (angina pectoris, history of myocardial infarction, or documented silent
ischemia) or to patients who have symptoms or findings consistent with ischemic
heart disease, coronary artery vasospasm, including Prinzmetal's angina, or other
significant underlying cardiovascular disease.
Zolmitriptan may increase blood pressure, it should not be given to patients
with uncontrolled hypertension, should not be used within 24 hours of treatment
with another 5-HT1 agonist, or an ergotamine-containing or ergot-type medication
like dihydroergotamine or methysergide, and should not be administered to
patients with hemiplegic or basilar migraine
Chemical details
Chemical Name : (S)-4-({3-[2-(dimethylamino)ethyl]-1H-indol-5-yl}
methyl)-1,3-oxazolidin-2-one
CAS Number : 139264-17-8
M. Formula : C16H21N3O2
Molecular Weight : 287.357
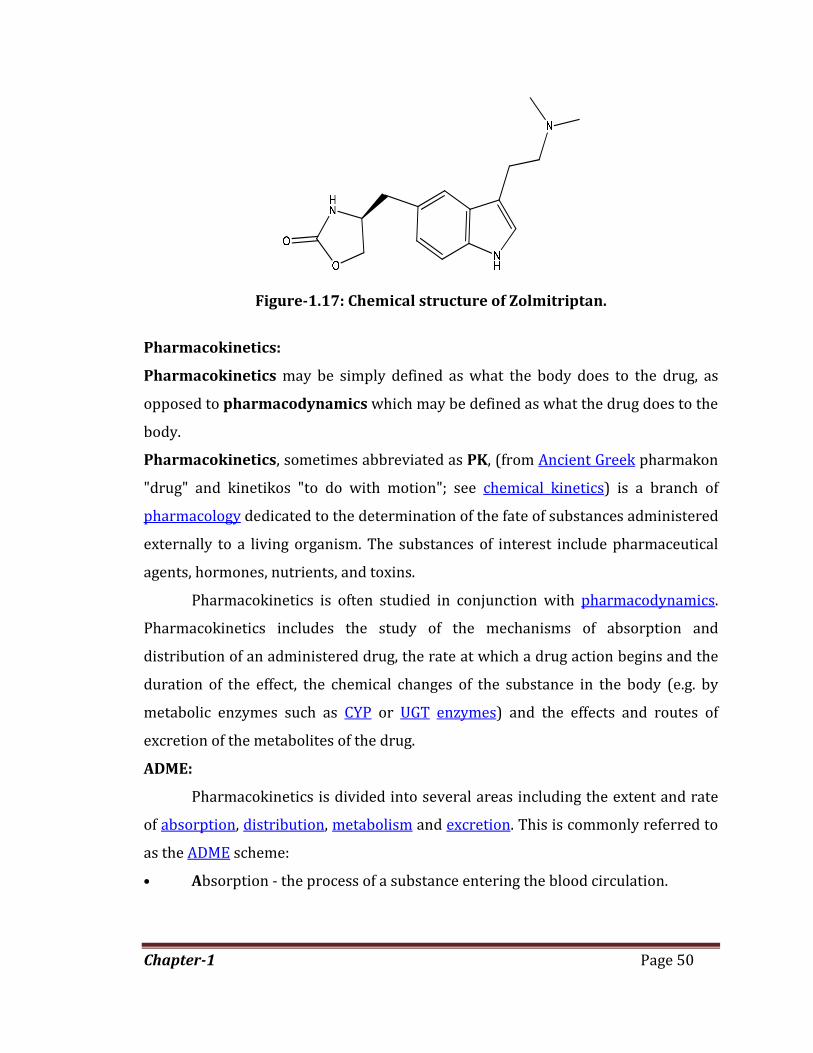
Chapter-1 Page 50
Figure-1.17: Chemical structure of Zolmitriptan.
Pharmacokinetics:
Pharmacokinetics may be simply defined as what the body does to the drug, as
opposed to pharmacodynamics which may be defined as what the drug does to the
body.
Pharmacokinetics, sometimes abbreviated as PK, (from Ancient Greek pharmakon
"drug" and kinetikos "to do with motion"; see chemical kinetics) is a branch of
pharmacology dedicated to the determination of the fate of substances administered
externally to a living organism. The substances of interest include pharmaceutical
agents, hormones, nutrients, and toxins.
Pharmacokinetics is often studied in conjunction with pharmacodynamics.
Pharmacokinetics includes the study of the mechanisms of absorption and
distribution of an administered drug, the rate at which a drug action begins and the
duration of the effect, the chemical changes of the substance in the body (e.g. by
metabolic enzymes such as CYP or UGT enzymes) and the effects and routes of
excretion of the metabolites of the drug.
ADME:
Pharmacokinetics is divided into several areas including the extent and rate
of absorption, distribution, metabolism and excretion. This is commonly referred to
as the ADME scheme:
• Absorption - the process of a substance entering the blood circulation.

Chapter-1 Page 51
• Distribution - the dispersion or dissemination of substances throughout the
fluids and tissues of the body.
• Metabolism (or Biotransformation) - the irreversible transformation of
parent compounds into daughter metabolites.
• Excretion - the removal of the substances from the body. In rare cases, some
drugs irreversibly accumulate in body tissue.
Elimination is the result of metabolism and excretion.
Pharmacokinetics describes how the body affects a specific drug after
administration. Pharmacokinetic properties of drugs may be affected by elements
such as the site of administration and the dose of administered drug. These may
affect the absorption rate
A fifth process, Liberation has been highlighted as playing an important role
in pharmacokinetics:
Liberation - the process of release of drug from the formulation.
Hence LADME may sometimes be used in place of ADME in reference to the
core aspects of pharmacokinetics.
B. Dutasteride: (26-29)
Dutasteride is a dual 5-α reductase inhibitor that inhibits conversion of
testosterone to dihydrotestosterone (DHT). Dutasteride is FDA approved for
treatment of benign prostatic hyperplasia (BPH) and is also prescribed off-label for
treatment of male pattern baldness (MPB). Dutasteride is approved for the
treatment of benign prostatic hyperplasia (BPH) (also known as enlarged prostate).
Figure-1.18 represents the chemical structure of Dutasteride.

Chapter-1
Figure
Chemical details
Chemical Name :
CAS Number :
Molecular formula :
Molecular Weight :
The teratogenic effect
dutasteride is harmful to male children. Women who are pregnant should not
handle the capsules, as inadvertent consumption
birth defects of the male fetus. The adverse effects would be similar to
reductase deficiency, where a dev
reductase type II, and thus unable to synthesize it. As Dutasteride blocks the same
process, developing males would have a DHT deficiency with its adverse effects as a
result of the drug. Men who are tak
to its long half-life, should also not donate blood for at least 6 months after the
cessation of treatment. These precautions are to be taken in order to prevent the
potential risk of causing birth defects i
transfusion with blood that contains Dutasteride.
Figure-1.18: Chemical structure of Dutasteride.
5α, 17β)-N-{2,5 bis(trifluoromethyl) phenyl}
azaandrost-1-ene-17-carboxamide.
164656-23-9
C27H30F6N2O2
528.58
teratogenic effect (abnormalities of physiological development) from
dutasteride is harmful to male children. Women who are pregnant should not
handle the capsules, as inadvertent consumption, such as skin contact, could cause
birth defects of the male fetus. The adverse effects would be similar to
, where a developing male child is naturally deficient in 5
reductase type II, and thus unable to synthesize it. As Dutasteride blocks the same
process, developing males would have a DHT deficiency with its adverse effects as a
result of the drug. Men who are taking dutasteride should not donate blood, and due
life, should also not donate blood for at least 6 months after the
cessation of treatment. These precautions are to be taken in order to prevent the
potential risk of causing birth defects in a pregnant woman who receives a
transfusion with blood that contains Dutasteride.
Page 52
{2,5 bis(trifluoromethyl) phenyl}-3-oxo-4-
(abnormalities of physiological development) from
dutasteride is harmful to male children. Women who are pregnant should not
, such as skin contact, could cause
birth defects of the male fetus. The adverse effects would be similar to 5-alpha-
eloping male child is naturally deficient in 5-alpha
reductase type II, and thus unable to synthesize it. As Dutasteride blocks the same
process, developing males would have a DHT deficiency with its adverse effects as a
ing dutasteride should not donate blood, and due
life, should also not donate blood for at least 6 months after the
cessation of treatment. These precautions are to be taken in order to prevent the
n a pregnant woman who receives a

Chapter-1 Page 53
Pharmacokinetics:
Absorption :(skin), a route by which substances can enter the body through
the skin. Pharmacokinetics may be simply defined as what the body does to the
drug, as opposed to pharmacodynamics which may be defined as what the drug
does to the body.
Leslie Z. Benet, Pharmacokinetics: Basic Principles and Its use as a tool in
drug metabolism, p.199 in: Drug metabolism and drug toxicity, JR Mitchell and MG
Horning (eds.), Raven Press, New York (1984).
Pharmacokinetics, sometimes abbreviated as PK, (from Ancient Greek
pharmakon "drug" and kinetikos "to do with motion"; see chemical kinetics) is a
branch of pharmacology dedicated to the determination of the fate of substances
administered externally to a living organism. The substances of interest include
pharmaceutical agents, hormones, nutrients, and toxins.
Pharmacokinetics is often studied in conjunction with pharmacodynamics.
Pharmacokinetics includes the study of the mechanisms of absorption and
distribution of an administered drug, the rate at which a drug action begins and the
duration of the effect, the chemical changes of the substance in the body (e.g. by
metabolic enzymes such as CYP or UGT enzymes) and the effects and routes of
excretion of the metabolites of the drug.
C. Piperazine: (30-31)
Piperazine (diethylenediamine) is widely used in medicine as an effective
antihelminthic agent. However, the method recommended in the State
Pharmacopoeia for determining piperazine in medicinal forms is very
cumbersome and time-consuming, since the procedure is based on precipitation
processes. Therefore, it is important to develop a simple, rapid, and sufficiently
precise technique for piperazine determination. Chemical structure of Piperazine
represented in figure-1.19.
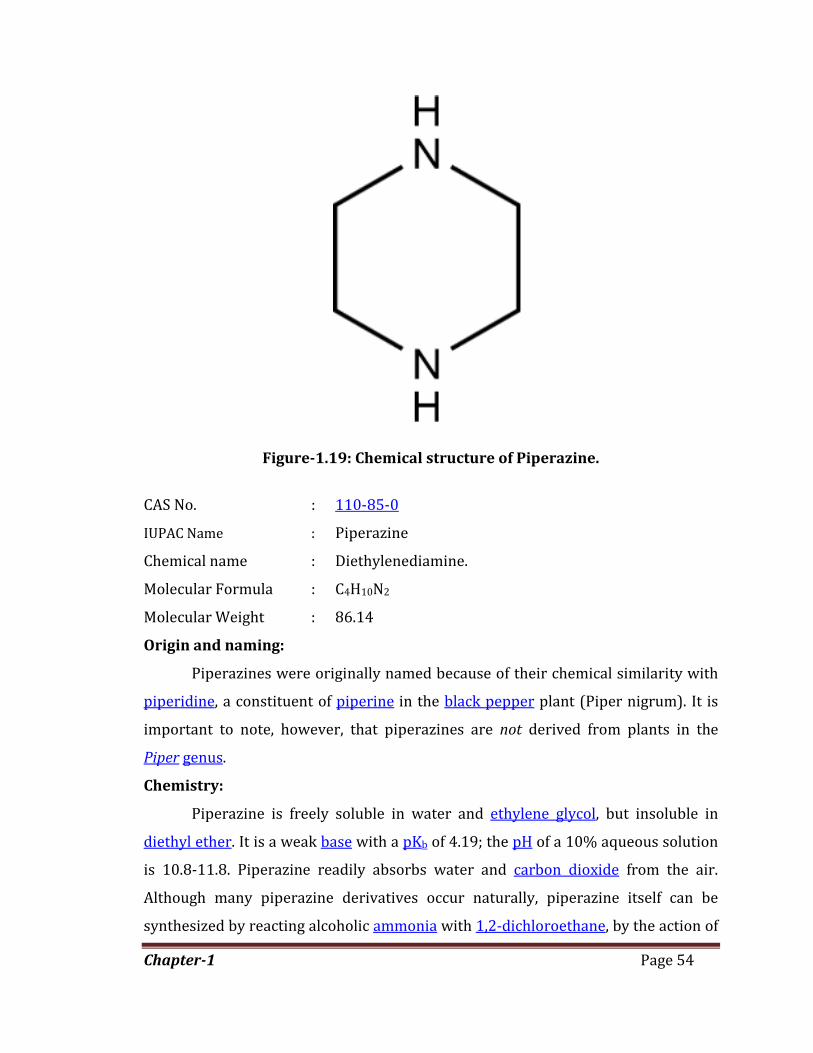
Chapter-1 Page 54
Figure-1.19: Chemical structure of Piperazine.
CAS No. : 110-85-0
IUPAC Name : Piperazine
Chemical name : Diethylenediamine.
Molecular Formula : C4H10N2
Molecular Weight : 86.14
Origin and naming:
Piperazines were originally named because of their chemical similarity with
piperidine, a constituent of piperine in the black pepper plant (Piper nigrum). It is
important to note, however, that piperazines are not derived from plants in the
Piper genus.
Chemistry:
Piperazine is freely soluble in water and ethylene glycol, but insoluble in
diethyl ether. It is a weak base with a pKb of 4.19; the pH of a 10% aqueous solution
is 10.8-11.8. Piperazine readily absorbs water and carbon dioxide from the air.
Although many piperazine derivatives occur naturally, piperazine itself can be
synthesized by reacting alcoholic ammonia with 1,2-dichloroethane, by the action of

Chapter-1 Page 55
sodium and ethylene glycol on ethylene diamine hydrochloride, or by reduction of
pyrazine with sodium in ethanol.
Industrial Production :
Piperazine is formed as a co-product in the ammoniation of 1,2-
dichloroethane or ethanolamine. These are the only routes to the chemical used
commercially. The piperazine is separated from the product stream, which contains
ethylenediamine, diethylenetriamine and other related linear and cyclic chemicals
of this type.
Piperazine was first introduced as an [[anthelmintic]] in 1953. A large
number of piperazine compounds have anthelmintic action. Their mode of action is
generally by [[paralysis|paralysing]] [[parasitism|parasites]], which allows the host
body to easily remove or expel the invading organism. This action is mediated by its
[[agonist]] effects upon the inhibitory [[GABA receptor|GABA(γ-aminobutyric acid)
receptor]]. Its selectivity for [[helminths]] is because [[vertebrates]] only use
[[GABA]] in the [[Central nervous system|CNS]] and the helminths' GABA receptor is
a different isoform to the vertebrate's one. ''Piperazine hydrate'' and ''piperazine
citrate'' are the main anthelminthic piperazines. These drugs are often referred to
simply as "piperazine" which may cause confusion between the specific
anthelmintic drugs and the entire class of Containing compounds other uses .
Piperazines are also used in the manufacture of plastics, resins, pesticides, brake
fluid and other industrial materials. Piperazines, especially BZP and TFMPP have
become an extremely common adulterant in the club and rave scene, often being
passed off as MDMA, although they do not share many similarities in their
effects.Piperazine is also a fluid used for CO2 and H2S scrubbing in association with
methyl diethanolamine (MDEA).
Piperazine was introduced to [[medicine]] as a solvent for [[uric acid]]. When
taken into the body the drug is partly [[redox|oxidized]] and partly eliminated
unchanged. Outside the body, piperazine has a remarkable power to dissolve uric
acid and producing a soluble [[urate]], but in clinical experience it has not proved

Chapter-1 Page 56
equally successful. [[Lycetol]], [[lysidine (chemical)|lysidine]] and [[sidonal]] are
compounds having similar action.
D. Fluoroquinolonic acid: (32-36)
Fluoroquinolonic acid has the chemical name 7-chloro-1-cyclopropyl-6-
fluoro-1,4-dihydro-4-oxoquinoline-3-carboxylic acid. It is a white solid substance
with a molecular formula of C13H9ClFNO3. Fluoroquinolones are broad-spectrum
antibacterial agents. For nearly five decades it has been known that
fluoroquinolones inhibit bacterial growth by blocking the enzymatic action of type II
topoisomerases such as DNA gyrase and topoisomerase IV.
Recently has it been discovered that some Fluoroquinolones are capable of
a mechanism that results in fragmented DNA and leads to rapid bacterial cell
death. This is key starting material for familiar products like Ciprofloxacin,
Moxifloxacin, Norfloxacin and Levofloxacin. Therefore, it is important to develop a
simple, rugged and robust precise technique for determination of related
substances by HPLC.
N
OH
OO
F
Cl
Figure-1.20: Chemical Structure of Fluoroquinolonic acid.
CAS No. : 139264-17-8
Chemical name : 7-chloro-1-cyclopropyl-6-fluoro-1,4-dihydro-4-
oxoquinoline-3-carboxylic acid .
Molecular formula : C13H9ClFNO3.
Molecular weight : 281.66
Special precautions:
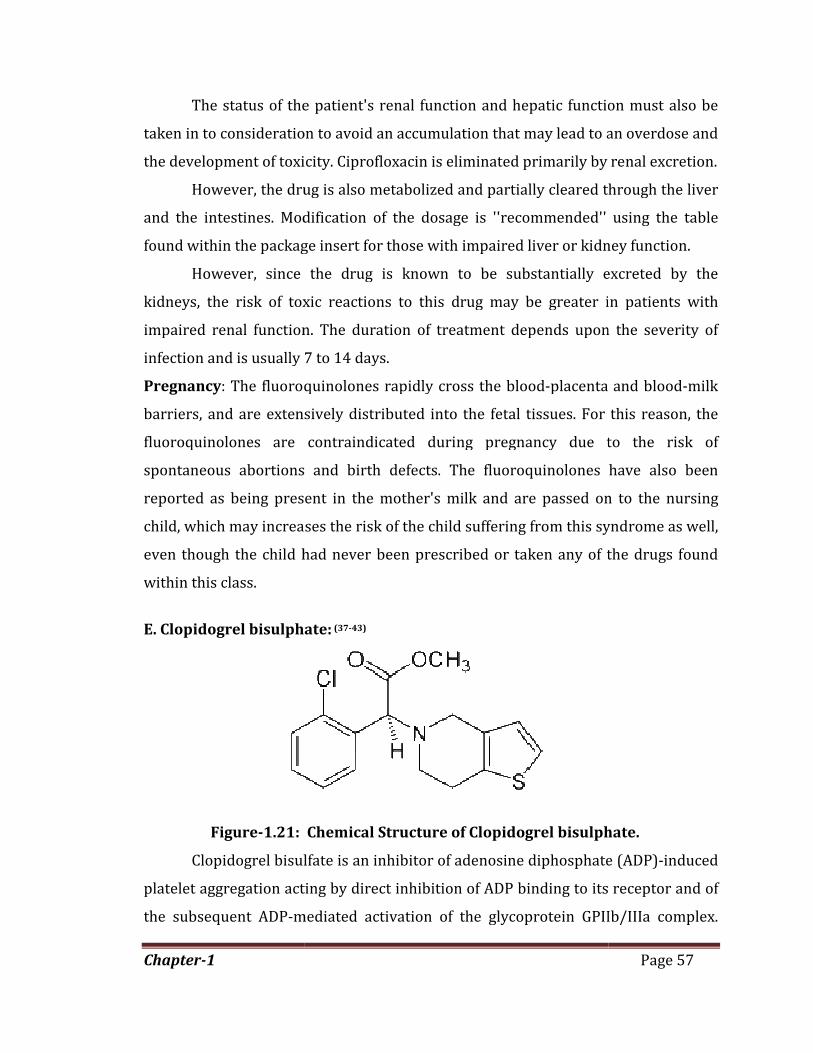
Chapter-1
The status of the patient's renal function and hepatic function must also be
taken in to consideration to avoid an accumulation that may lead to an overdose and
the development of toxicity. Ciprofloxacin is elimin
However, the drug is also metabolized and partially cleared through the liver
and the intestines. Modification of the dosage is ''recommended'' using the table
found within the package insert for those with impaired live
However, since the drug is known to be substantially excreted by the
kidneys, the risk of toxic reactions to this drug may be greater in patients with
impaired renal function. The duration of treatment depends upon the severity of
infection and is usually 7 to 14 days.
Pregnancy: The fluoroquinolones rapidly cross the blood
barriers, and are extensively distributed into the fetal tissues. For this reason, the
fluoroquinolones are contraindicated during
spontaneous abortions and birth defects. The fluoroquinolones have also been
reported as being present in the mother's milk and are passed on to the nursing
child, which may increases the risk of the child suffering from this s
even though the child had never been prescribed or taken any of the drugs found
within this class.
E. Clopidogrel bisulphate
Figure-1.21:
Clopidogrel bisulfate is an inhibitor of adenosine diphosphate (ADP)
platelet aggregation acting by direct inhibition of ADP binding to its receptor and of
the subsequent ADP-mediated activation of the glycoprotein GPIIb/IIIa complex.
The status of the patient's renal function and hepatic function must also be
n to consideration to avoid an accumulation that may lead to an overdose and
evelopment of toxicity. Ciprofloxacin is eliminated primarily by renal excretion.
However, the drug is also metabolized and partially cleared through the liver
and the intestines. Modification of the dosage is ''recommended'' using the table
within the package insert for those with impaired liver or kidney function.
However, since the drug is known to be substantially excreted by the
kidneys, the risk of toxic reactions to this drug may be greater in patients with
impaired renal function. The duration of treatment depends upon the severity of
fection and is usually 7 to 14 days.
The fluoroquinolones rapidly cross the blood-placenta and blood
barriers, and are extensively distributed into the fetal tissues. For this reason, the
fluoroquinolones are contraindicated during pregnancy due to the risk of
spontaneous abortions and birth defects. The fluoroquinolones have also been
reported as being present in the mother's milk and are passed on to the nursing
child, which may increases the risk of the child suffering from this syndrome as well,
even though the child had never been prescribed or taken any of the drugs found
E. Clopidogrel bisulphate: (37-43)
Chemical Structure of Clopidogrel bisulphate
Clopidogrel bisulfate is an inhibitor of adenosine diphosphate (ADP)
platelet aggregation acting by direct inhibition of ADP binding to its receptor and of
mediated activation of the glycoprotein GPIIb/IIIa complex.
Page 57
The status of the patient's renal function and hepatic function must also be
n to consideration to avoid an accumulation that may lead to an overdose and
ated primarily by renal excretion.
However, the drug is also metabolized and partially cleared through the liver
and the intestines. Modification of the dosage is ''recommended'' using the table
r or kidney function.
However, since the drug is known to be substantially excreted by the
kidneys, the risk of toxic reactions to this drug may be greater in patients with
impaired renal function. The duration of treatment depends upon the severity of
placenta and blood-milk
barriers, and are extensively distributed into the fetal tissues. For this reason, the
pregnancy due to the risk of
spontaneous abortions and birth defects. The fluoroquinolones have also been
reported as being present in the mother's milk and are passed on to the nursing
yndrome as well,
even though the child had never been prescribed or taken any of the drugs found
bisulphate.
Clopidogrel bisulfate is an inhibitor of adenosine diphosphate (ADP)-induced
platelet aggregation acting by direct inhibition of ADP binding to its receptor and of
mediated activation of the glycoprotein GPIIb/IIIa complex.

Chapter-1 Page 58
Clopidogrel' splatelet inhibiting activity makes it an effective drug for reducing the
incidence ischemic strokes, heartattacks or claudication due to vascular diseases
such asatherosclerosis. By inhibiting platelet aggregation, Clopidogrel reduces the
chance of arterial blockage,thus preventing strokes and heart attacks .
Chemical name : (+)-(S)-α-(2-chlorophenyl)-6,7-dihydrothieno[3,2-
c]pyridine-5(4H)-acetate sulfate(1:1).
CAS No. : 113665-84-2
Molecular formula : C16H16ClNO2S•H2SO4
Molecular weight : 419.9
Pharmacogenetics:
CYP2C19 is an important drug-metabolizing enzyme that catalyzes the
biotransformation of many clinically useful drugs including antidepressants,
barbiturates, proton pump inhibitors, antimalarial and antitumor drugs. Clopidogrel
is one of the drugs metabolized by this enzyme. Several recent landmark studies
have proven the importance of 2C19 genotyping in treatment using clopidogrel or
Plavix. In March 2010, the FDA put a black box warning on Plavix to make patients
and healthcare providers aware that CYP2C19 poor metabolizers, representing up
to 14% of patients, are at high risk of treatment failure and that testing is available.
Researchers have found that patients with variants in cytochrome P-450 2C19
(CYP2C19) have lower of the active metabolite of clopidogrel, less inhibition of
platelets, and a 3.58 times greater risk for major adverse cardiovascular events such
as death, heart attack, and stroke; the risk was greatest in CYP2C19 poor
metabolizers.
Clopidogrel (top left)being activated. The first step is an oxidation mediated
(mainly) by CYP2C19, unlike the activation of the related drug prasugrel. The two
structures at the bottom are tautomers of each other; and the final step is a
hydrolysis. The active metabolite (top right) has Z configuration at the double bond
C3–C16 and possibly R configuration at the newly asymmetric C4.
Chapter-1 Page 59
After repeated 75 mg oral doses of clopidogrel (base), plasma concentrations
of the parent compound, which has no platelet inhibiting effect, are very low and are
generally below the quantification limit (0.258 µg/L) beyond two hours after
dosing.Clopidogrel is a pro-drug activated in the liver by cytochrome P450 enzymes,
including CYP2C19. Due to opening of the thiophene ring, the chemical structure of
the active has three sites that are stereochemically relevant, making a total of eight
possible isomers. These are: a stereocentre at C4 (attached to the —SH thiol group),
a double bond at C3—C16, and the original stereocentre at C7. Only one of the eight
structures is an active antiplatelet drug. This has the following configuration: Z
configuration at the C3—C16 double bond, the original S configuration at C7, and
although the stereocentre at C4 can't be directly determined, as the thiol group is
too reactive, work with the active metabolite of the related drug prasugrel suggests
the at R-configuration of the C4 group is critical for P2Y12 and platelet-inhibitory
activity.
The active metabolite has an elimination half-life of about eight hours and
acts by forming a disulfide bridge with the platelet ADP receptor. Patients with a
variant allele of CYP2C19 are 1.5 to 3.5 times more likely to die or have
complications than patients with the high-functioning allele. Following an oral dose
of 14C-labeled clopidogrel in humans, approximately 50% was excreted in the urine
and approximately 46% in the feces in the five days after dosing.
Effect of food: Administration of clopidogrel bisulfate with meals did not
significantly modify the bioavailability of clopidogrel as assessed by the
pharmacokinetics of the main circulating metabolite.
Absorption and distribution:Clopidogrel is rapidly absorbed after oral
administration of repeated doses of 75 mg clopidogrel (base), with peak plasma
levels (approx. 3 mg/L) of the main circulating metabolite occurring approximately
one hour after dosing. The pharmacokinetics of the main circulating metabolite are
linear (plasma concentrations increased in proportion to dose) in the dose range of
50 to 150 mg of Clopidogrel. Absorption is at least 50% based on urinary excretion
of Clopidogrel-related metabolites. Clopidogrel and the main circulating metabolite

Chapter-1
bind reversibly in vitro to human plasma proteins (98% and 94%, respectively). The
binding is nonsaturable
elimination: In vitro and
carboxylic acid derivative. In plasma and urine, the glucuronide of the carboxylic
acid derivative is also observed.
In March 2010, the U.S.
boxedwarning to Plavix alerting that the drug can be less effective in people who
cannot metabolize the dr
aspirin, for the prevention of [[thrombosis]] after placement of intracoronary or as
an alternative antiplatelet drug for patients who are intolerant to aspirin.
E. Ziprasidone HCl: (44-
Figure-1.22: Structure of Ziprasidone Hydrochloride monohydrate
Chemical name
CAS Registry Number
Molecular formula
Molecular weight
Therapeutic category
to human plasma proteins (98% and 94%, respectively). The
binding is nonsaturable in vitro up to a concentration of 110 μg/mL.
and in vivo, Clopidogrel undergoes rapid hydrolysis into its
derivative. In plasma and urine, the glucuronide of the carboxylic
acid derivative is also observed.
In March 2010, the U.S. Food and Drug Administration
boxedwarning to Plavix alerting that the drug can be less effective in people who
metabolize the drug to convert it to its active form. It is also used, along with
aspirin, for the prevention of [[thrombosis]] after placement of intracoronary or as
an alternative antiplatelet drug for patients who are intolerant to aspirin.
-54)
: Structure of Ziprasidone Hydrochloride monohydrate
: 5-[2-[4-(1,2-benzisothiazol-3-yl)-1-piperazinyl]ethyl]
6-chloro-1,3-dihydro-2H-indol-2-one
: 146939-27-7
: C21H21 CLN4OS
: 412.936
: Schizophrenia and acute mania.
Page 60
to human plasma proteins (98% and 94%, respectively). The
up to a concentration of 110 μg/mL.Metabolism and
undergoes rapid hydrolysis into its
derivative. In plasma and urine, the glucuronide of the carboxylic
(FDA) added a
boxedwarning to Plavix alerting that the drug can be less effective in people who
ug to convert it to its active form. It is also used, along with
aspirin, for the prevention of [[thrombosis]] after placement of intracoronary or as
an alternative antiplatelet drug for patients who are intolerant to aspirin.
: Structure of Ziprasidone Hydrochloride monohydrate.
piperazinyl]ethyl]-

Chapter-1 Page 61
Ziprasidone (marketed as Geodon, Zeldox by Pfizer) was the fifth a typical
antipsychotic to gain approval (February 2001) in the United States. It is approved
by the U.S. Food and Drug Administration (FDA) for the treatment of schizophrenia,
and acute mania and mixed states associated with bipolar disorder. Its
intramuscular injection form is approved for acute agitation in schizophrenic
patients for whom treatment with just ziprasidone is appropriate.
Ziprasidone is also used off-label for depression, bipolar maintenance, mood
disorders, anxiety, aggression, dementia, attention deficit hyperactivity disorder,
obsessive compulsive disorder, autism, and post-traumatic stress disorder, though
Pfizer was penalized for promoting such uses in US. The brand name Geodon has
been suggested to bring to mind the phrase 'down (don) to earth (geo)' referring to
the goals of the medication.
The oral form of ziprasidone is the hydrochloride salt, ziprasidone
hydrochloride. The intramuscular form, on the other hand, is the mesylate salt,
ziprasidone mesylate trihydrate, and is provided as a lyophilized powder.
Geodon was one of four drugs which Pfizer pleaded guilty to misbranding
"with the intent to defraud or mislead" in 2009 as a result of a qui tam lawsuit by
Stefan P. Kruszewski. Pfizer was found to have illegally promoted four of its drugs
for (legal) use in conditions that had not been approved by the FDA. Pfizer agreed to
pay $2.3 billion (£1.4 billion) in settlement, and entered a corporate integrity
agreement.
Correspondance to clinical effects:
Ziprasidone's affinities for most of the dopamine and serotonin receptors
and the α1-adrenergic explain some of its side effects, such as sedation and
orthostatic hypotension. Unlike many other antipsychotics, ziprasidone has no
significant affinity for the mACh receptors, and as such lacks any anticholinergic side
effects receptor are high and its affinity for the histamine H1 receptor is moderate. It
also displays some inhibition of synaptic reuptake of serotonin and norepinephrine,
though not dopamine.
Chapter-1 Page 62
Ziprasidone's efficacy in treating the positive symptoms of schizophrenia is
believed to be mediated primarily via antagonism of the dopamine receptors,
specifically D2. Blockade of the 5-HT2A receptor may also play a role in its
effectiveness against positive symptoms, though the significance of this property in
antipsychotic drugs is still debated among researchers. Blockade of 5-HT2A and 5-
HT2C and activation of 5-HT1A as well as inhibition of the reuptake of serotonin and
norepinephrine may all contribute to its ability to alleviate negative symptoms. The
relatively weak antagonistic actions of Ziprasidone on the α1-adrenergic and H1
receptors likely in part.
Pharmacokinetics:
The systemic bioavailability of Ziprasidone administered intramuscularly is
100%, or 60%, administered orally with food. After a single dose intramuscular
administration, the peak serum concentration typically occurs at about 60 minutes
after the dose is administered, or earlier. Steady state plasma concentrations are
achieved within one to three days. The mean half-life ranges from two to five hours.
Exposure increases in a dose-related manner and following three days of
intramuscular dosing, little accumulation is observed.
Ziprasidone absorption is optimally achieved when administered with food.
Without a meal preceding dose, the bioavailability of the drug is reduced by
approximately 50%.
1.12. OBJECTIVE
The main objective of this study is to develop the methods for
pharmaceutical drug Substances by using high performance liquid chormatography
(HPLC). Some of products were selected for this research work, the selected
products are,
1. Zolmitriptan.
2. Dutasteride.
3. Ziprasidone key starting material(KSM)
4. Fluoroquinolonic acid .

Chapter-1 Page 63
5. Clopidogrel bisulphate.
6. Ziprasidone hydrochloride monohydrate.
Developed and validated the related substances and assay methods as per
ICH and USFDA guidelines.

Chapter-1 Page 64
1.13. REFERENCES
1. Sethi.PD. HPLC Quantitative analysis of pharmaceutical formulations, Ed-1st,
CBS Publishers and distributors, New Delhi, 2001, pp: 94-105.
2. Glajch L, Kirkaland J and Snyder R. Practical HPLC method development, Ed-
2nd, John Wiley and sons, INC, New York, 1999, pp: 234-260.
3. Ashutoshkar S. Pharmaceutical Drug Analysis, Ed-2nd, New age international
(p) limited publishers, 2005, pp: 452-474.
4. http://en.wikipedia.org/wiki/Chromatography.
5. U.S.P. Asian Edition United Pharmacopoeial Convention Inc, Rockville, 2005,
pp: 2386-2389.
6. James.W Munson. Modern Methods of Pharmaceutical Analysis, Medical Book
Distributors, Mumbai, 2001, pp: 17-54.
7. Sethi P.D. High Performance Liquid Chromatography and Quantitative
analysis Pharmaceutical Formulations, Ed-1st, CBS Publishers and
Distributors, 2001, pp: 3-5.
8. Erwing, G. W. Instrumental Methods of Chemical Analysis, Ed-2nd , McGraw
Hill Book Company, 1960, pp: 3-5.
9. GurdeepR.Chatwal and Sham K.Anand. Instrumental Methods of Chemical
Analysis, Ed-5th, Himalaya Publishing House, pp: 1.2 – 1.5.
10. Sharma B.K. Instrumental Method of Chemical Analysis, Ed-23rd, Goal
publication House, 1991, Merrut, pp: 7-10.
11. RamaRao, G.Murthy, S.S.N and Khadgapathi P. High Performance Liquid
Chromatograpy and its role in pharmaceutical analysis, Eastern Pharmacist,
1986, 20 (346), pp: 53-59.
12. Sastry C.S.P., Prasad T.N.V. and Rao E.V. Recent application of High
Performance Liquid Chromatography in Pharmaceutical Analysis, Indian.
Pharm. Education, 1987, 21, pp: 37-40.
13. Loyd. K. Snyder, Joseph. J. Kirkland and joseph. L. Glajch. Practical HPLC
Method Development, Ed-2nd, Wiley – Interscience Publication, USA, pp: 742-
747.

Chapter-1 Page 65
14. Willard, H.Y. Merritt L.L., Dean J.A. and Settle F.A. Instrumental Methods of
Analysis, Ed-7th, CBS Publishers and Distributors, New Delhi,1991, pp: 436-
439.
15. The International Conference on Harmonization (ICH)-Validation of
Analytical Procedures: Methodology (Q2B), Food and Drug Administration,
USA, Nov.1996.
16. http://www.standardbase.hu/tech/HPLC%20validation%20PE.pdf.
17. International Conference on Harmonization, "Q2A: Text on Validation of
18. Analytical Procedures," Federal Register 60(40), 11260–11262 (1995).
19. International Conference on Harmonization, "Q2B: Validation of Analytical
Procedures: Methodology; Availability," Federal Register 62(96), 27463–
27467 (1997).
20. FDA, "Analytical Procedures and Methods Validation: Chemistry,
Manufacturing and Controls Documentation; Availability," Federal Register
(Notices) 65(169), 52776–52777 (2000).
21. www.fda.gov/cder/guidance/cmc3.pdf.
22. "2008 Top 200 generic drugs by retail dollars" PDF (332 KB). Drug
Topics(May 26, 2009).Retrieved on August 25, 2009.
23. http://www.drugs.com/availability/generic-zomig-zmt.html
24. http://www.actavis.com/en/media+center/newsroom/articles/migraine_zo
lmitriptan_eu.htm.
25. Newman LC, Lipton RB (2001). "Migraine MLT-Down: An Unusual
Presentation of Migraine in Patients With Aspartame-Triggered Headaches"
(abstract). Headache: the Journal of Head and Face Pain 41 (9): 899–901.
doi:10.1046/j.1526-4610.2001.01164.x.
26. Avodart Information | Drugs.com
27. Managing the progression of lower urinary tract symptoms/benign prostatic
hyperplasia: therapeutic options for the man at risk | UroToday.
28. Propecia (Finasteride) - See "Increasing the Dose" | Bernstein Medical Center
for Hair Restoration.

Chapter-1 Page 66
29. Leslie Z. Benet, Pharmacokinetics: Basic Principles and Its Use as a Tool in
Drug Metabolism, p.199 in: Drug Metabolism and Drug Toxicity, JR Mitchell
and MG Horning(eds.), Raven Press, New York (1984).
30. The Merck index, 10th Ed. (1983), p. 1076, Rahway:Merck & Co.
31. Ashford’s Dictionary of Industrial Chemicals, 3rd edition, 7332.
32. Andriole, VT The Quinolones. Academic Press, 1989.
33. Andersson, MI, MacGowan, AP. Development of the quinolones. J. Antimicrob.
Chemother. (2003)51,Suppl.S1, 1–11 DOI: 10.1093/jac/dkg212.
34. Ivanov DV, Budanov SV (2006). "[Ciprofloxacin and antibacterial therapy of
respiratory tract infections]" (in Russian). Antibiot. Khimioter. 51 (5): 29–37.
PMID 17310788.
35. sanofi-aventis U.S. LLC (September 2008). "NegGram Caplets (nalidixic acid,
USP)"(PDF).USA:FDA.
http://www.accessdata.fda.gov/drugsatfda_docs/label/2009/014214s058lb
l.pdf.
36. Wentland MP: In memoriam: George Y. Lesher, Ph.D., in Hooper DC, Wolfson
JS (eds): Quinolone antimicrobial agents, ed 2., Washington DC, American
Society for Microbiology : XIII - XIV, 1993.
37. Savi, P; Zachayus JL; Delesque-Touchard N; et al. (July 2006). "The active
metabolite of Clopidogrel disrupts P2Y12 receptor oligomers and partitions
them out of lipid rafts". Proceedings of the National Academy of Sciences of
theUSA103(29):11069–11074.
38. Rossi S, editor. Australian Medicines Handbook 2006. Adelaide: Australian
Australian Medicines Handbook; 2006. ISBN 0-9757919-2-3.
39. Michael D Randall; Karen E Neil (2004). Disease management. 2nd ed.
London: Pharmaceutical Press. 159.
40. Pereillo JM, Maftouh M, Andrieu A, Uzabiaga MF, Fedeli O, Savi P, Pascal M,
Herbert JM, Maffrand JP, Picard C (2002). "Structure and stereochemistry of
the active metabolite of clopidogrel". Drug Metab. Dispos. 30 (11): 1288–95.

Chapter-1 Page 67
41. "FDA Announces New Boxed Warning on Plavix: Alerts patients, health care
professionals to potential for reduced effectiveness" (Press release).
FoodandDrugAdministration(FDA).March12,2010.
http://www.fda.gov/NewsEvents/Newsroom/PressAnnouncements/ucm20
4253.htm. Retrieved March 13, 2010.
42. "FDA Drug Safety Communication: Reduced effectiveness of Plavix
(clopidogrel) in patients who are poor metabolizers of the drug". Food and
DrugAdministration(FDA).March12,2010.
http://www.fda.gov/Drugs/DrugSafety/PostmarketDrugSafetyInformationf
orPatientsandProviders/ucm203888.htm. Retrieved March 13, 2010.
43. PGxNews.Org (June 2009). "FDA updates Plavix label with PGx data".
PGxNews.Org. http://www.pgxnews.org/web/the-news/1-latest-news/47-
fda-updates-plavix-label-with- pgx-data. Retrieved 2009-06-13.
44. http://www.stopmedicarefraud.gov/pfizerfactsheet.html. Stop Medicare
Fraud, US Dept of Health & Human Svc, and of US Dept of Justice. Retrieved
2012-07-04.
45. "Pfizer agrees record fraud fine". BBC News. British Broadcasting
Corporation.2September2009.
http://news.bbc.co.uk/2/hi/business/8234533.stm.
46. "GeodonPrescribingInformation".Pfizer,Inc..
http://www.pfizer.com/pfizer/download/uspi_geodon.pdf. Retrieved 2009-
01-26.
47. Miceli JJ, Glue P, Alderman J, Wilner K (2007). "The effect of food on the
absorption of oral ziprasidone". Psychopharmacology Bulletin 40 (3): 58–68.
PMID 18007569
48. Sandson NB, Armstrong SC, Cozza KL (2005). "An overview of psychotropic
drug-drug interactions". Psychosomatics 46 (5): 464–94.
49. Miceli JJ, Anziano RJ, Robarge L, Hansen RA, Laurent A (2000). "The effect of
carbamazepine on the steady-state pharmacokinetics of ziprasidone in
Chapter-1 Page 68
healthy volunteers". British Journal of Clinical Pharmacology 49 Suppl 1:
65S–70S.PMC2015057.PMID10771457.
50. Miceli JJ, Smith M, Robarge L, Morse T, Laurent A (2000). "The effects of
ketoconazole on ziprasidone pharmacokinetics--a placebo-controlled
crossover study in healthy volunteers". British Journal of Clinical
Pharmacology 49 Suppl 1: 71S–76S. PMC 2015056. PMID 10771458.
51. Nemeroff CB, Lieberman JA, Weiden PJ, et al. (November 2005). "From
clinical research to clinical practice: a 4-year review of ziprasidone". CNS
Spectrums10(11Suppl17):1–20.PMID16381088.
52. Tatsumi M, Jansen K, Blakely RD, Richelson E (March 1999).
"Pharmacological profile of neuroleptics at human monoamine transporters".
European Journal of Pharmacology 368 (2-3): 277–83. doi:10.1016/S0014-
2999(99)00005-9. PMID 10193665.
53. Heinz Lüllmann; Klaus Mohr (2006). Pharmakologie und Toxikologie:
Arzneimittelwirkungen verstehen- Medikamente gezielt einsetzen; ein
Lehrbuch für Studierende der Medizin, der Pharmazie und der
Biowissenschaften, eine Informationsquelle für Ärzte, Apotheker und
Gesundheitspolitiker. Georg Thieme Verlag. ISBN 978-3-13-368516-0.
54. Alan F. Schatzberg; Charles B. Nemeroff (10 February 2006). Essentials of
Clinical Psychopharmacology. American Psychiatric Pub. p. 297. ISBN 978-1-
58562-243.