chapter 9 potential of reducing ghg emission from redd+ ... · non-forest area (apl). referring to...
TRANSCRIPT
Chapter 9
Potential of Reducing GHG Emission from
REDD+ Activities in Indonesia
Rizaldi Boer
Abstract Loss of forest cover in large scale in tropical region will have impact on
climate significantly. This will change air pressure distribution and shift the typical
global circulation patterns and change rainfall distribution. Its contribution to the
increase of greenhouse gas emission will also enhance global warming and may
increase the frequency and intensity of extreme climate events. Deforestation in the
three tropical regions, Amazon, Central Africa, and Southeast Asia, still continues.
Without significant change in forest protection efforts, the loss of forests in these
three regions by 2050 will reach about 29, 98, and 44 %, respectively.
Indonesia has the largest tropical forest in SEA; the contribution of emission
from land use change and forest (LUCF) reached 60 % of the total national
emission, much higher than energy sector. During the period 1990–2013, the total
loss of natural forest reached about 19.7 million hectares or about 0.822 million ha
per year. Without significant change in forest protection program, within the period
2010–2050, Indonesia may lose 43.4 million ha of forest or equivalent to defores-
tation rate of 1.08 million ha per year. Potential of reducing emission from REDD+
activities is quite big. By increasing expenses of the government by 1 % annually on
top of the external investment for technology change, without necessity of direct
forest protection (e.g., increasing agriculture productivity reduces pressure on
forests), the deforestation rate could reduce to about 0.337 million ha per year.
The issuance of innovative financing and incentive policies for improving land
and forest management may further increase the potential of reducing emission
from REDD+ activities. Some of the policies include the use of debt-for-nature
swap (DNS) scheme for accelerating the development of forest management units
in open access area, incentive for permit holders for accelerating the development
of timber plantation on degraded land, and increase community access to fund for
green investment. The incentive system for the permit holders is for handling land
tenurial issues or conflicts. The incentive could be in the form of reducing or
exemption of administration/retribution fees for certain period of time depending
on the level of conflicts. Policy allowing for transferring the funds to a financing
system is relatively easy to be accessed by the community such as blending
R. Boer (*)
Centre for Climate Risk and Opportunity Management in Southeast Asia and Pacific, Bogor
Agricultural University; CCROM SEAP-IPB, Bogor, Indonesia
e-mail: [email protected]
© The Author(s) 2016
S. Nishioka (ed.), Enabling Asia to Stabilise the Climate,DOI 10.1007/978-981-287-826-7_9
177
financing, a financing system that synergizes all financial sources such as CSR
funding; government funding such as state budget (APBN); and local government
budget (APBD) funds, banking, and international funding. This system can help
leverage private funding and supports regional development by supporting com-
munity activities in urban agriculture and agroforestry including building human
resource capacity through assistance and training activities.
Keywords Extreme weather/climate events • Tropical forest • Greenhouse gas
emissions • REDD+ activities • Financing policies • Incentive and disincentive
policies
Key Message to Policy Makers
• Loss of large scale of tropical forest will bring more and intensify extreme
weather/climate events.
• Loss of forest in Indonesia 1990–2013 accounts for most of deforestation
in Southeast Asia with average loss of about 0.822 Mha per year.
• From the period 2010–2050, Indonesia potentially can reduce its defores-
tation rate more than half of the current rate to 0.337 Mha per year.
• The potential reduction of the deforestation may be achieved by facilitat-
ing changes in technologies without necessity of direct forest protection.
• Implementation of innovative financing policies and incentive/disincen-
tive system may further reduce emission from REDD+ activities.
• The payment from REDD+ activities might offset the government addi-
tional expenses incurred in facilitating the changes.
9.1 Introduction
Forest plays a significant role in regulating our climate. Regional climates were
sensitive to change of types and density of vegetation (Dickinson and Henderson-
Sellers 1988; Shukla et al. 1990; Dale 1997; Avisar and Werth 2005). Loss of forest
cover in large scale directly alters the reflectance of the earth’s surface, induces localwarming or cooling, and finally changes air pressure distribution. The changes in air
pressure distribution shift the typical global circulation patterns and change rainfall
distribution. At present, deforestation of tropical regions continues at high rate
(Houghton et al. 2012). The major impact of tropical deforestation on precipitation
may occur in and near the deforested regions themselves. However, a strong impact
will be propagated by teleconnections along the equatorial regions and tomid-latitudes
and even high latitudes even though not as strong as in the low latitude. Based on
climate modeling analysis, deforestation of tropical regions (Amazon, Central Africa,
and Southeast Asia) significantly affects precipitation at mid- and high latitudes
through hydrometeorological teleconnections (Avisar and Werth 2005). Without
178 R. Boer
significant change in forest protection efforts, the loss of forests in these three regions
by 2050 will reach about 29, 98, and 44 %, respectively (Schmitz et al. 2014).
Deforestation will also contribute to the increase of GHG emission to the
atmosphere. In the long term, the increasing GHG concentration in the atmosphere
will cause an increase in global temperature and global climate. New finding from
the 5th AR of IPCC indicated that agriculture, forest, and other land uses represent
20–24 % of global emission. Without mitigation efforts, the contribution of this
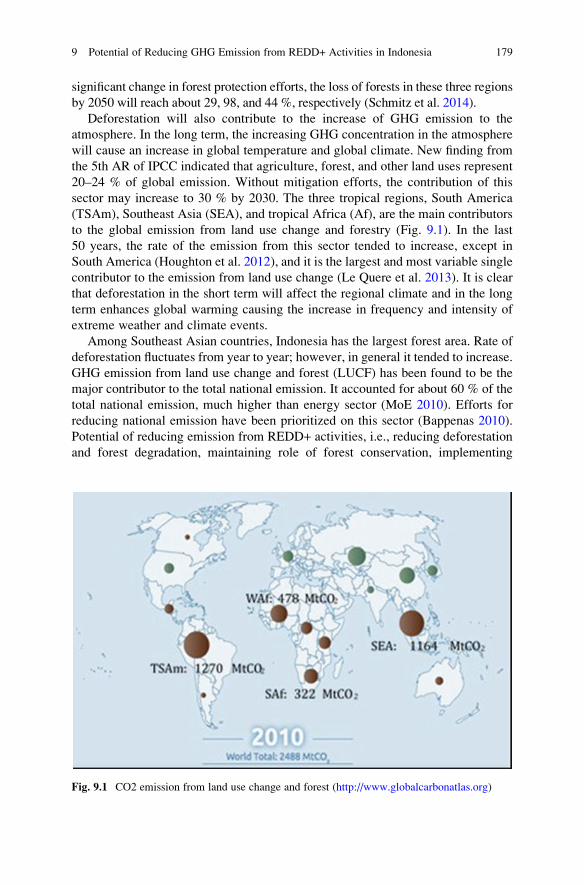
sector may increase to 30 % by 2030. The three tropical regions, South America
(TSAm), Southeast Asia (SEA), and tropical Africa (Af), are the main contributors
to the global emission from land use change and forestry (Fig. 9.1). In the last
50 years, the rate of the emission from this sector tended to increase, except in
South America (Houghton et al. 2012), and it is the largest and most variable single
contributor to the emission from land use change (Le Quere et al. 2013). It is clear
that deforestation in the short term will affect the regional climate and in the long
term enhances global warming causing the increase in frequency and intensity of
extreme weather and climate events.
Among Southeast Asian countries, Indonesia has the largest forest area. Rate of
deforestation fluctuates from year to year; however, in general it tended to increase.
GHG emission from land use change and forest (LUCF) has been found to be the
major contributor to the total national emission. It accounted for about 60 % of the
total national emission, much higher than energy sector (MoE 2010). Efforts for
reducing national emission have been prioritized on this sector (Bappenas 2010).
Potential of reducing emission from REDD+ activities, i.e., reducing deforestation
and forest degradation, maintaining role of forest conservation, implementing
Fig. 9.1 CO2 emission from land use change and forest (http://www.globalcarbonatlas.org)
9 Potential of Reducing GHG Emission from REDD+ Activities in Indonesia 179
sustainable forest management, and enhancing forest carbon sequestration, is quite
big. Potentially the LUCF sector can become net sink by 2030 (MoE 2010).
However, a number of innovative policies are required to realize this.
9.2 Indonesian Forest
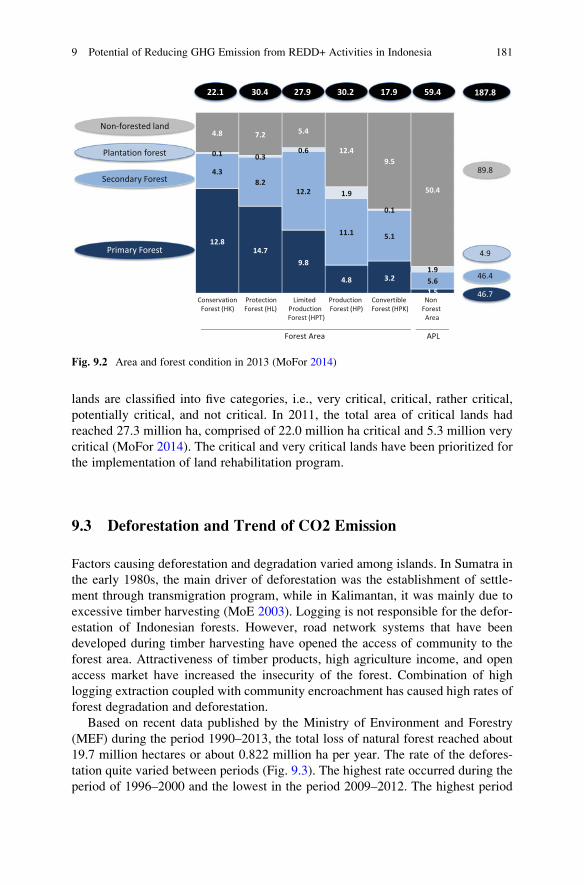
In 2013, Indonesia has forest area of about 128.4 million ha and 59.4 million ha of
non-forest area (APL; MoFor 2014). By function, the forest area is classified into
5 categories, namely, conservation forest (HK), protection forest (HL), limited
production forest (HPT), production forest (HP), and convertible production forest
(HPK). Conservation forest is designated for conservation purposes (Act
No. 5/1990, Sanctuary Reserve area, Nature conservation, and Game Hunting
Park), while protection forest to serve life support system, maintain hydrological
system, prevent of flood, erosion control, and seawater intrusion, and maintain soil
fertility. Production forest is aimed for timber and non-timber production, while
convertible production forest (HPK) is for non-forest-based activities such as
agriculture, settlement, etc. Thus, this forest can be released to become a
non-forest area (APL).
Referring to its function, forest clearing and conversion of forest land in HK and
HL to other land uses are not allowed. Deforestations occurred in these forests
mostly from illegal activities such as logging, forest encroachments, and forest
fires. On the contrary, forest clearings are permitted within HP and HPT, especially
over unproductive forested areas for the purpose of establishing timber plantation.
Unproductive forests comprised of forest areas with less than 25 core tress/ha with
dbh of 20 cm up, less than 10 parent trees/ha, and insufficient/very few regeneration
(numbers of seedling are less than 1000/ha, sapling less than 240/ha, and poles less
than 75/ha). It is thus obvious that not all degraded forests could be converted into
plantation forests. HPK is legally designed for other uses, mainly for agriculture,
transmigration, plantations, and settlements, thus all forest clearing activities.
Deforestation and forest degradation occurred in all types of forest functions
either due to legal or illegal activities. Level of degradation of the secondary forest
also varied from heavily to lightly degraded. With proper treatments, lightly to
medium degraded forests can recover to reach climax forests. On the other hand,
due to improper management and less strict law enforcement, degraded forests
continue deteriorating resulting in severely degraded forests and meet unproductive
forest criteria. In 2012, many of forest areas are not covered by forests, particularly
in the production forest, and more than half of the remaining forests were secondary
forests with various levels of degradation (Fig. 9.2).
High lost of forest cover in forest and implementation of unsustainable land
management practices in non-forest area also caused serious damage on land.
Forest functions as water retention, erosion control, nutrient cycling, microclimate
regulator, and carbon retention were completely depleted. Many of the lands in both
forest and non-forest areas are critical. Based on the level of damage, the critical
180 R. Boer
lands are classified into five categories, i.e., very critical, critical, rather critical,
potentially critical, and not critical. In 2011, the total area of critical lands had
reached 27.3 million ha, comprised of 22.0 million ha critical and 5.3 million very
critical (MoFor 2014). The critical and very critical lands have been prioritized for
the implementation of land rehabilitation program.
9.3 Deforestation and Trend of CO2 Emission
Factors causing deforestation and degradation varied among islands. In Sumatra in
the early 1980s, the main driver of deforestation was the establishment of settle-
ment through transmigration program, while in Kalimantan, it was mainly due to
excessive timber harvesting (MoE 2003). Logging is not responsible for the defor-
estation of Indonesian forests. However, road network systems that have been
developed during timber harvesting have opened the access of community to the
forest area. Attractiveness of timber products, high agriculture income, and open
access market have increased the insecurity of the forest. Combination of high
logging extraction coupled with community encroachment has caused high rates of
forest degradation and deforestation.
Based on recent data published by the Ministry of Environment and Forestry
(MEF) during the period 1990–2013, the total loss of natural forest reached about
19.7 million hectares or about 0.822 million ha per year. The rate of the defores-
tation quite varied between periods (Fig. 9.3). The highest rate occurred during the
period of 1996–2000 and the lowest in the period 2009–2012. The highest period
Fig. 9.2 Area and forest condition in 2013 (MoFor 2014)
9 Potential of Reducing GHG Emission from REDD+ Activities in Indonesia 181
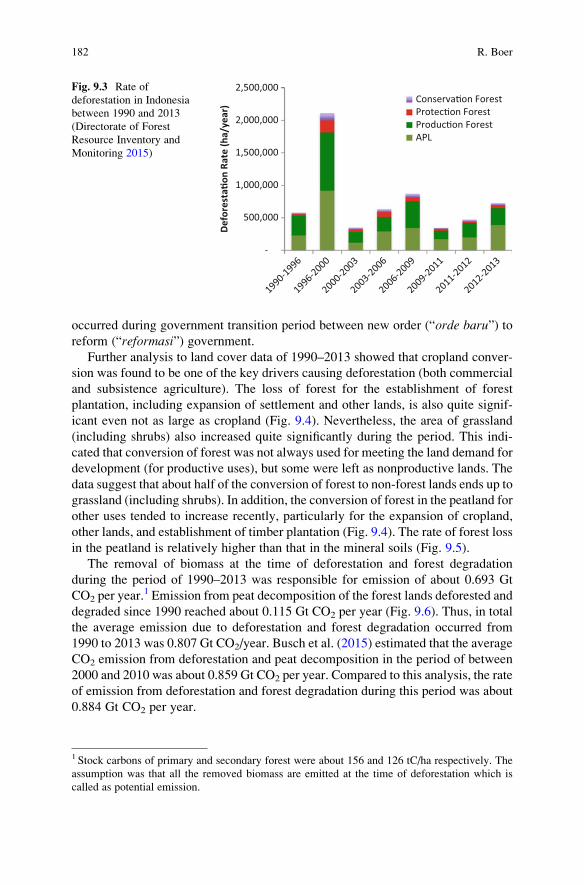
occurred during government transition period between new order (“orde baru”) toreform (“reformasi”) government.
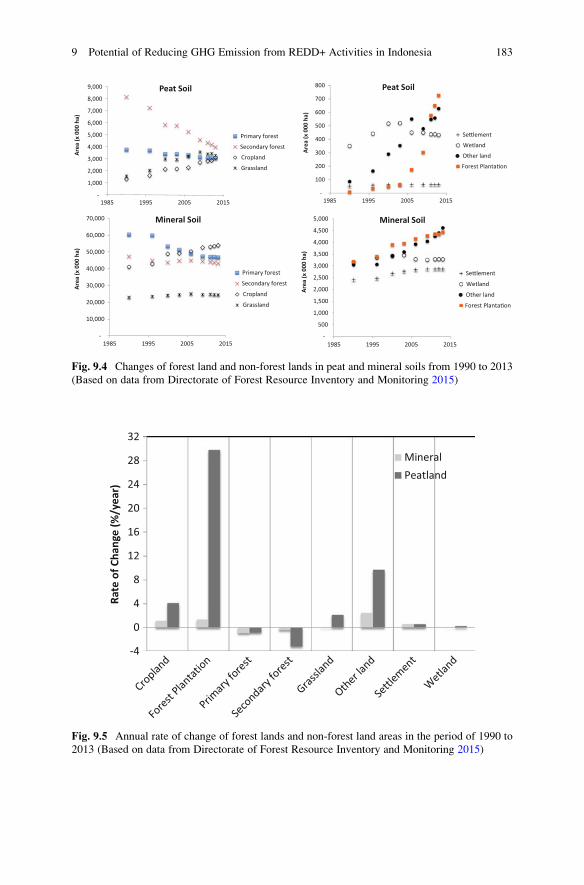
Further analysis to land cover data of 1990–2013 showed that cropland conver-
sion was found to be one of the key drivers causing deforestation (both commercial
and subsistence agriculture). The loss of forest for the establishment of forest
plantation, including expansion of settlement and other lands, is also quite signif-
icant even not as large as cropland (Fig. 9.4). Nevertheless, the area of grassland
(including shrubs) also increased quite significantly during the period. This indi-
cated that conversion of forest was not always used for meeting the land demand for
development (for productive uses), but some were left as nonproductive lands. The
data suggest that about half of the conversion of forest to non-forest lands ends up to
grassland (including shrubs). In addition, the conversion of forest in the peatland for
other uses tended to increase recently, particularly for the expansion of cropland,
other lands, and establishment of timber plantation (Fig. 9.4). The rate of forest loss
in the peatland is relatively higher than that in the mineral soils (Fig. 9.5).
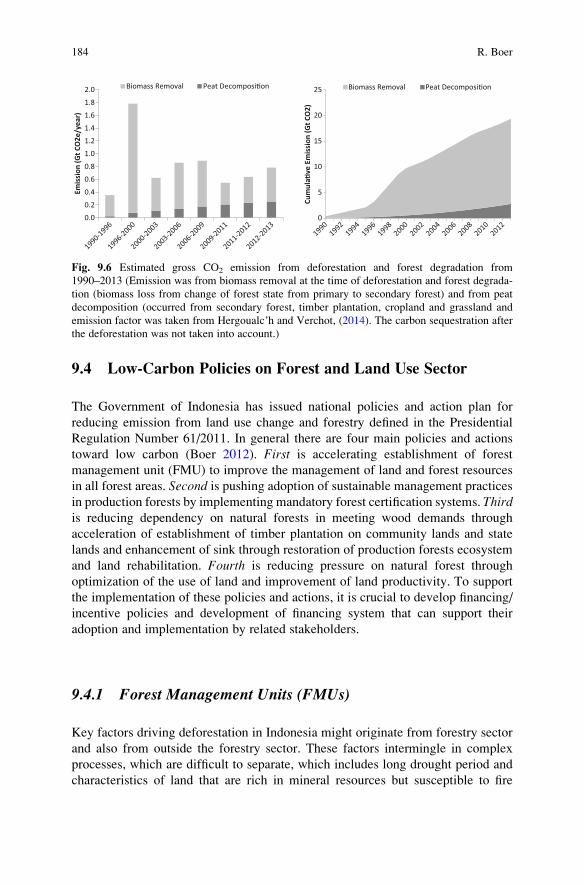
The removal of biomass at the time of deforestation and forest degradation
during the period of 1990–2013 was responsible for emission of about 0.693 Gt
CO2 per year.1 Emission from peat decomposition of the forest lands deforested and
degraded since 1990 reached about 0.115 Gt CO2 per year (Fig. 9.6). Thus, in total
the average emission due to deforestation and forest degradation occurred from
1990 to 2013 was 0.807 Gt CO2/year. Busch et al. (2015) estimated that the average
CO2 emission from deforestation and peat decomposition in the period of between
2000 and 2010 was about 0.859 Gt CO2 per year. Compared to this analysis, the rate
of emission from deforestation and forest degradation during this period was about
0.884 Gt CO2 per year.
-
500,000
1,000,000
1,500,000
2,000,000
2,500,000
Defo
rest
a�on
Rat
e (h
a/ye
ar) Conserva�on Forest
Protec�on ForestProduc�on ForestAPL
Fig. 9.3 Rate of
deforestation in Indonesia
between 1990 and 2013
(Directorate of Forest
Resource Inventory and
Monitoring 2015)
1 Stock carbons of primary and secondary forest were about 156 and 126 tC/ha respectively. The
assumption was that all the removed biomass are emitted at the time of deforestation which is
called as potential emission.
182 R. Boer
-
1,000
2,000
3,000
4,000
5,000
6,000
7,000
8,000
9,000
1985 1995 2005 2015
Area
(x 0
00 h
a)
Peat Soil
Primary forest
Secondary forest
Cropland
Grassland
-
100
200
300
400
500
600
700
800
1985 1995 2005 2015
Area
(x 0
00 h
a)
Peat Soil
Se�lement
Wetland
Other land
Forest Planta�on
-
10,000
20,000
30,000
40,000
50,000
60,000
70,000
1985 1995 2005 2015
Area
(x 0
00 h
a)
Mineral Soil
Primary forest
Secondary forest
Cropland
Grassland
-
500
1,000
1,500
2,000
2,500
3,000
3,500
4,000
4,500
5,000
1985 1995 2005 2015
Area
(x 0
00 h
a)
Mineral Soil
Se�lement
Wetland
Other land
Forest Planta�on
Fig. 9.4 Changes of forest land and non-forest lands in peat and mineral soils from 1990 to 2013
(Based on data from Directorate of Forest Resource Inventory and Monitoring 2015)
-4
0
4
8
12
16
20
24
28
32
Rate
of C
hang
e (%
/yea
r)
MineralPeatland
Fig. 9.5 Annual rate of change of forest lands and non-forest land areas in the period of 1990 to
2013 (Based on data from Directorate of Forest Resource Inventory and Monitoring 2015)
9 Potential of Reducing GHG Emission from REDD+ Activities in Indonesia 183
9.4 Low-Carbon Policies on Forest and Land Use Sector
The Government of Indonesia has issued national policies and action plan for
reducing emission from land use change and forestry defined in the Presidential
Regulation Number 61/2011. In general there are four main policies and actions
toward low carbon (Boer 2012). First is accelerating establishment of forest
management unit (FMU) to improve the management of land and forest resources
in all forest areas. Second is pushing adoption of sustainable management practices
in production forests by implementing mandatory forest certification systems. Thirdis reducing dependency on natural forests in meeting wood demands through
acceleration of establishment of timber plantation on community lands and state
lands and enhancement of sink through restoration of production forests ecosystem
and land rehabilitation. Fourth is reducing pressure on natural forest through
optimization of the use of land and improvement of land productivity. To support
the implementation of these policies and actions, it is crucial to develop financing/
incentive policies and development of financing system that can support their
adoption and implementation by related stakeholders.
9.4.1 Forest Management Units (FMUs)
Key factors driving deforestation in Indonesia might originate from forestry sector
and also from outside the forestry sector. These factors intermingle in complex
processes, which are difficult to separate, which includes long drought period and
characteristics of land that are rich in mineral resources but susceptible to fire
0.0
0.2
0.4
0.6
0.8
1.0
1.2
1.4
1.6
1.8
2.0
Emiss
ion
(Gt C
O2e
/yea
r)Biomass Removal Peat Decomposi�on
0
5
10
15
20
25
Cum
ula�
ve E
miss
ion
(Gt C
O2)
Biomass Removal Peat Decomposi�on
Fig. 9.6 Estimated gross CO2 emission from deforestation and forest degradation from
1990–2013 (Emission was from biomass removal at the time of deforestation and forest degrada-
tion (biomass loss from change of forest state from primary to secondary forest) and from peat
decomposition (occurred from secondary forest, timber plantation, cropland and grassland and
emission factor was taken from Hergoualc’h and Verchot, (2014). The carbon sequestration after
the deforestation was not taken into account.)
184 R. Boer

interlink with management practices as well as political decision and economical
considerations in the allocation of land uses, its utilizations and enforcement of
rules. They both intend to pursue the goal of national development in forms of
economical growth, political stability, as well as social equity and ecological
sustainability. It is difficult to identify which key driver comes first and further
stimulates the emergences of others. Some key drivers observed from current
practices and have consequences on land use and land cover changes are forest
fire, logging, timber plantation, agriculture expansion, mining, and political admin-
istration expansion.
Establishment of forest management unit (FMU) at site level has been consid-
ered as a prioritized program for improving management of forest resources and
controlling deforestation and forest degradation. Urgency of FMU development
especially outside Java2 is driven by the fact that (Nugroho et al. 2011):
1. Intensive management of forest resource at site level is required as mandated by
Act No. 41 Year 1999 on Forestry which states that “All forests within the
territory of the Republic of Indonesia, including natural resources contained
therein is controlled by the State for the greatest prosperity of the people”.
2. Management of forest resources given to the private sector through the licensing
mechanism for forest (IUPHH) has limited time, and when it is over, the forest
area becomes unmanaged. In addition, nature of the transfer of rights to holders
of the license also required close monitoring from government over the behavior
of the license holders.
3. Many of investments for land and forest rehabilitation implemented in forest
area (GERHAN) often fail as due to the absence of manager in the site who will
manage the maintenance of the planted trees.
4. Programs for giving access to public in playing active role in managing forest
resources such as community-based plantation forest (HTR), village forest, and
community forest (HKm) are slowly realized, due to the absence of companion
at the implementation level.
Duties and functions of the FMU (PP. 6/2007 jo PP. 3/2008) include
(1) implementing management of forest resources which includes forest arrange-
ment and management plan, utilization of forest area and resources, rehabilitation
and reclamation of forest area, and protection and conservation of forest area;
(2) translating national, provincial, and district/city forest policy to be implemented
at site level; (3) implementing forest management activities in the region starting
from planning, organizing, implementing, and monitoring and control; and
(4) implementing the monitoring and the assessment of implementation forest
management activities in its territory and opening investment opportunities to
support the achievement of forest management objectives.
2 FMU had already existed long before in all forest area in Java under the management of State
Forest Company Perum Perhutani and called KPH (Kesatuan Pemangku Hutan).
9 Potential of Reducing GHG Emission from REDD+ Activities in Indonesia 185
FMU is targeted to be developed 600 units throughout forest area, and by
February 2014, only 120 units were established. However, operationalization of
these first 120 units remains problematic (Nugroho et al. 2014). Some of the
problems include:
1. Scope and authorities of FMU in managing forest area. FMU authority is
actually very powerful, but this is supported by a number of different regula-
tions, not summarized in one single regulation. So KPH management team is
not functioning optimally. As an example, annual working plan of concession
holder (RKT) should be approved via KPH once a respective area has
established its KPH. Articles 71–78 of government law No. 6/2007 regulate
this issue. However, none of RKT now is submitted to KPH. Its function on
monitoring and evaluation of concessions does not work. Therefore, it is
necessary to compile a list authority of KPH mandated by regulations and
laws and issue a strategic regulation on this.
2. Capacity of stakeholders and supports from local government (Province/dis-
trict) are still diverse. Dynamics of local politics also very much influence their
commitments in running FMU.
3. Sectoral ego does exist. There is a doubt that some functions of forestry-related
agencies will be taken over by FMU.
4. Regulation No. 23/2014 about local government authority on forestry issue
(incl. KPHP and FMU for protection forest (KPHL)) results a concurrent
between central government and provincial government (Article 14 (1)). The
regulation also indicates less role of district government. However, sites are
located within administrative authority of district government.
5. Many FMUs have been legalized by MoF decree, yet do not have any organi-
zation at site level (8 out of 120 units).
6. Barriers in regulating concessions incl. RHL and issue of coordination between
FMU and concession holders.
7. Independence of FMU needs to be improved. A number of regulations such as
No. 61/2007 about technical guidance of general service budget management
(PPK – BLUD).
8. Lack of human resources and funding.
9. Need a synchronized policy and coordination among Echelon 1 at ministry of
forestry to support operationalization of FMU.
10. Socialization of FMU development has been concentrated to forestry agency at
provincial level. While communication on FMU policies by central govern-
ment has not touched strategic decision making at local level.
11. Mechanism on national budget is not flexible for supporting FMU.
12. Land tenure conflicts as a consequence of non-FMU area rights. Local com-
munity often claims those areas. Ministry of forestry has very weak power on
this type of areas.
13. Lack of leadership and entrepreneurship in FMU directors/heads.
As mentioned above (Problem No. 7), FMU independence is needed because
often local government, i.e., majorly ask for benefits – specifically financial benefits
186 R. Boer
of KPH for their district. On the other side, running FMU needs independent
financial support. State budget is limited, while to develop FMU as a full business
entity will violate main objective of FMU. Proper format of FMU would be a quasi-
government body like BLUD. Central government should pay attention more on
strategic regulation for this PPK BLUD then.
According to the ministry of domestic affairs regulation No. 61/2007, BLUD is
SKPD or nonprofit working unit under local government, which is established to
support and provide services for the respective areas. BLUD has flexibility in
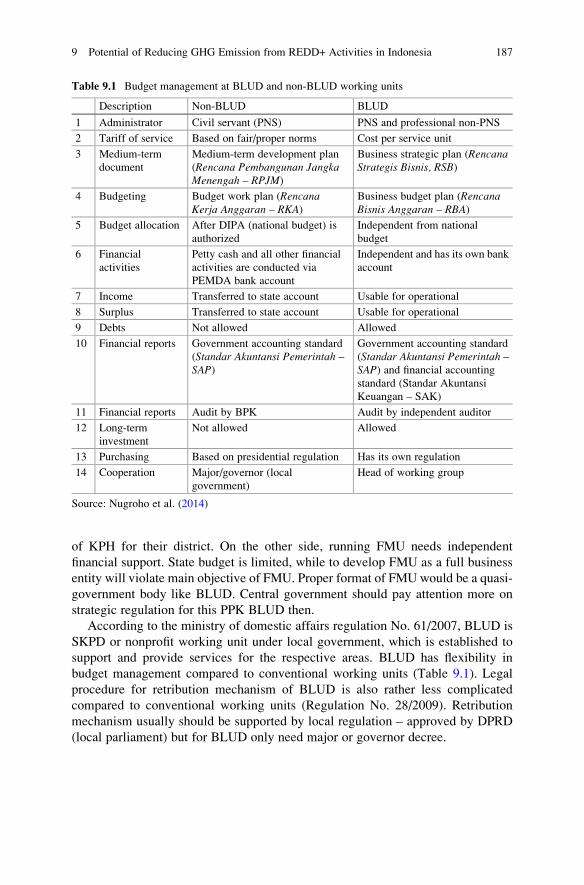
budget management compared to conventional working units (Table 9.1). Legal
procedure for retribution mechanism of BLUD is also rather less complicated
compared to conventional working units (Regulation No. 28/2009). Retribution
mechanism usually should be supported by local regulation – approved by DPRD
(local parliament) but for BLUD only need major or governor decree.
Table 9.1 Budget management at BLUD and non-BLUD working units
Description Non-BLUD BLUD
1 Administrator Civil servant (PNS) PNS and professional non-PNS
2 Tariff of service Based on fair/proper norms Cost per service unit
3 Medium-term
document
Medium-term development plan
(Rencana Pembangunan JangkaMenengah – RPJM)
Business strategic plan (RencanaStrategis Bisnis, RSB)
4 Budgeting Budget work plan (RencanaKerja Anggaran – RKA)
Business budget plan (RencanaBisnis Anggaran – RBA)
5 Budget allocation After DIPA (national budget) is
authorized
Independent from national
budget
6 Financial
activities
Petty cash and all other financial
activities are conducted via
PEMDA bank account
Independent and has its own bank
account
7 Income Transferred to state account Usable for operational
8 Surplus Transferred to state account Usable for operational
9 Debts Not allowed Allowed
10 Financial reports Government accounting standard
(Standar Akuntansi Pemerintah –SAP)
Government accounting standard
(Standar Akuntansi Pemerintah –SAP) and financial accounting
standard (Standar Akuntansi
Keuangan – SAK)
11 Financial reports Audit by BPK Audit by independent auditor
12 Long-term
investment
Not allowed Allowed
13 Purchasing Based on presidential regulation Has its own regulation
14 Cooperation Major/governor (local
government)
Head of working group
Source: Nugroho et al. (2014)
9 Potential of Reducing GHG Emission from REDD+ Activities in Indonesia 187
In terms of giving more authority to FMU, based on inputs from local stake-
holders, FMU which currently is only authorized to manage state forest area should
also be given authority to manage non-forest area (CER Indonesia and CCAP
2010). By giving this authority, FMU can assist in managing REDD activities
both within and outside forest areas. FMU should take the form of BLUD (BadanLayanan Umum Daerah – Local Service Unit). Having effective, strong, and
independent FMU might be a key factor to the success of implementation of sus-
tainable forest management.
9.4.2 Forest Certification System
Degradation of production forest is mainly triggered by the higher demand of wood
for industry. Supply of timber from natural forests is not enough to meet the
capacity of timber industry, and this leads to the increase of illegal logging
activities. It is estimated that an additional supply of timber from illegal logging
may be equal to that from the legal logging. The highest logging activities occurred
in production forests (60 %) and then in the protected forest (30 %) and forest
conservation (10 %). The level of illegal logging is estimated to be very high in the
non-concession forest area of production forests (Tim Pokja Kementrian Kehutanan2010). In other Asian countries, fuel wood collection and charcoal production for
meeting domestic and local demand are also drivers of forest degradation
(Hosonuma et al. 2012), even if their impact is not as much as that of illegal
logging.
To reduce trading of illegal logs and to push application of sustainable forest
management practices, the Government of Indonesia has established Timber Legal-
ity Assurance System (TLAS) through the issuance by the Minister of Forestry of
Regulation Number P.38/Menhut-II/2009 on Standard for Evaluating Performance
of Implementation of Sustainable Production Forest Management (PK-PHPL) and
Verification of Legality of Logs (SVLK). This regulation is followed by the
issuance by the Directorate General of Production Forest Regulation Number
P.06/VI-Set/2009 and P2/VI-Set/2010. In TLAS, the assessment and verification
of the timber products were done by independent third party, i.e., Entity for
Evaluation of Performance and Independent Verifier (LP and VI) accredited by
National Accreditation Committee (KAN). Other independent third parties such as
Civil Society Organization and NGOs do the monitoring, i.e., for accommodating
complaint from communities to the results of works from the LP and VI. With such
process, TLAS will meet the good governance principles (transparency, account-
ability, and participatory), credibility (do not include government institution), and
representativeness.
PK-PHPL is mandatory for all permit holders in state forests (IUPHHK-HA,
IPPHHK-HT, IUPHHK-RE, HKm, and HTR) and private forests (Hutan Rakyat or
188 R. Boer

HR), and SVLK is mandatory for all permit holders in state forests and private
forests and also for all upstream and downstream wood industries (IUIPHHK). In
principle, permit holders who already have certificate of PHPL will not require to
have SVLK. Validity of the certificate is only for 3 years, and every year it is subject
to surveillance. Up to January 2013, total forest areas that have been granted for
IUPHHK-HA (logging concessions), IUPHHK-HT (Industrial Timber Plantation),
and IUPHHK-RE (Restoration of Production Forest Ecosystem) were
20,899,673 ha, 10.106.540 ha, and 397,878 ha, respectively. community forest
plantations (HTR and HKm) were 752,297 ha (MoFor 2014).
In addition to the mandatory certification, there are also some voluntary certifi-
cations of SFM using standard Lembaga Ecolabelling Indonesia (LEI), Forest
Stewardship Council (FSC), and some others. However, the progress of the imple-
mentation of certification is quite slow. Since June 2011, the total number of
companies who already have mandatory certification of SFM had only been
230 certificates covering a total area of about 19 million ha and for voluntary
certification had only been 25 certificates (Table 9.2). A number of factors that need
attention for accelerating the achievement of SFM are (Bahruni 2011):
1. Governance and regulations which promote forest good behavior and reduce
inefficiency of bureaucracy, encourage professionalism in forest management,
push high responsibility of forest management units in using their given rights
and authorities, and implement improvement program in organization capacity
and forest management skill including resolving land uncertainty issues (tenure
and spatial layout)
2. Provision of incentive and disincentives for forest management units with good
performance and bad performance (SFM and non-SFM units) and allowing
non-SFM units to improve their performance by planning and conducting
concrete actions within clear timeline to meet SFM
3. Development of carbon accounting system to evaluate the performance of forest
management units in minimizing forest degradation
Table 9.2 Number of companies who already have certification of SFM
Category Total concession area (ha)1
Mandatory certificates
(up to June 2011)2
Voluntary
certificates (up to
June 2011)3
Number Area (ha) Number Area (ha)
IUPHHK-HA 22,710,256 140 14,225,443 5 834,452
Very good-good na 31 3,449,955 na na
Average na 35 3,307,789 na na
Poor or expire na 74 7,467,699 na na
IUPHHK-HT 9,963,770 90 4,914,301 3 544,705
Good na 19 2,499,280 na na
Expire na 71 2,415,021 na na
HR 1,570,315 Na na 17 242,931
9 Potential of Reducing GHG Emission from REDD+ Activities in Indonesia 189

To encourage the concession holders applying for the certification, the govern-
ment needs to revisit the SFM performance indicators used by forest management
units (FMUs) that have different nature of activities, i.e., between management of
forest resources (IPHHK-HA) and management of forest ecosystem (IUPHHK-RE;
Nugroho et al. 2011). Different from IPHHK-HA, holders of IUPHHK-RE will
have no cash inflow for a number of years until forests are restored as the timber
will be harvested after reaching the equilibrium of ecosystems (e.g., 35 years).
Applying for the certification will increase the cost, while the IUPHHK-RE holders
are burdened with the obligation to pay various fees as applied to IUPHHK-HA. It
is understandable that none of IUPHHK-RE (restoration of ecosystem) holders
apply for the mandatory certification. A number of studies have proven that
applying SFM practices will ensure the sustainable wood production and reduce
the degradation (see Box 9.1). The reduction of emission from forest degradation by
applying SFM practices could reach 9.79 tCO2 ha�1 year�1.
On the other hand, to conserve forests particularly forested land in forest area
that have been released for non-forest-based activities, the Government of Indone-
sia also plans to apply mandatory certification system for palm oil called Indonesian
Sustainable Palm Oil (ISPO). With this policy, all palm oil plantation companies
will be obliged to conserve High Conservation Value (HCV) areas in their conces-
sion and to apply good practices in reducing GHG emissions. This policy is
expected also to reduce deforestation. The ISPO will be officially effective as of
March 2012, and it is targeted that all oil palm plantation companies will obtain the
ISPO certificates by 2014. ISPO is launched to speed up the implementation of
sustainable palm oil. ISPO is the same as existing sustainable standard RSPO
(Roundtable on Sustainable Palm Oil); the only difference is that ISPO is compul-
sory, while RSPO is voluntary. Companies that have been certified by RSPO can
receive ISPO certification after fulfilling some additional criteria. The regulation of
ISPO is defined in the Ministry of Agriculture Regulation No. 19/Permentan/
OT.140/3/2011. ISPO is a response of the Government of Indonesia to meet
increasing demand of market for sustainable and green products and participate
in mitigating climate change.
The mandatory certification system may also be followed by other non-forest-
based activities that may directly affect forest resources such as mining. It has been
well known that Indonesian forests store mineral deposits underneath which are
needed to develop the country. Rights to use the resources are granted by the
government through the scheme of pinjam pakai or land leasing for certain period
of time. Mining of the deposit starts by clear off not only woody biomass of the
forest but also other biomasses stored underneath the soil. The activities produces
high emission which will be difficult to restore them back as fertility of the soil will
be gone. In many cases, most of forest areas left by the mining after the termination
of its permit are under heavily degraded condition.
190 R. Boer
To ensure the implementation of sustainable management principles and
community economic development in exploiting natural resources (including
mining), it may be necessary to introduce policy for limiting GHG emission
(emission cap) from certain forest industries/concessionaires. The cap could be
determined based on the result of the environmental impact assessment (EIA).
Under current regulation, all forest industries/concessionaires obliged to conduct
EIA. With the introduction of this policy, each entity must include the assessment
of GHG emission level from their activities given all mandatory environmental
management activities are met. Once the level of GHG emission is defined and
estimated, this level of emission will be treated as “emission cap” of these
entities. Theoretically entities that implement their environmental management
plan defined in the EIA, the level of emission, should be low. Thus, companies
that release more than the allowable emissions (emission cap) shall offset the
excess.
Box 9.1 Impact of Sustainable Forest Management (SFM) Practices
on Carbon Stock Change at Logging Concession Companies (Source:
Bahruni 2011)
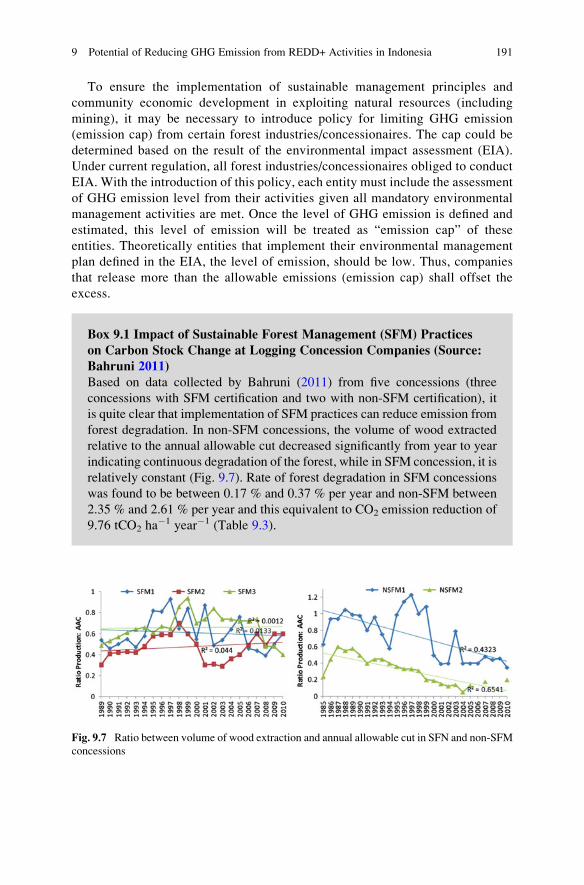
Based on data collected by Bahruni (2011) from five concessions (three
concessions with SFM certification and two with non-SFM certification), it
is quite clear that implementation of SFM practices can reduce emission from
forest degradation. In non-SFM concessions, the volume of wood extracted
relative to the annual allowable cut decreased significantly from year to year
indicating continuous degradation of the forest, while in SFM concession, it is
relatively constant (Fig. 9.7). Rate of forest degradation in SFM concessions
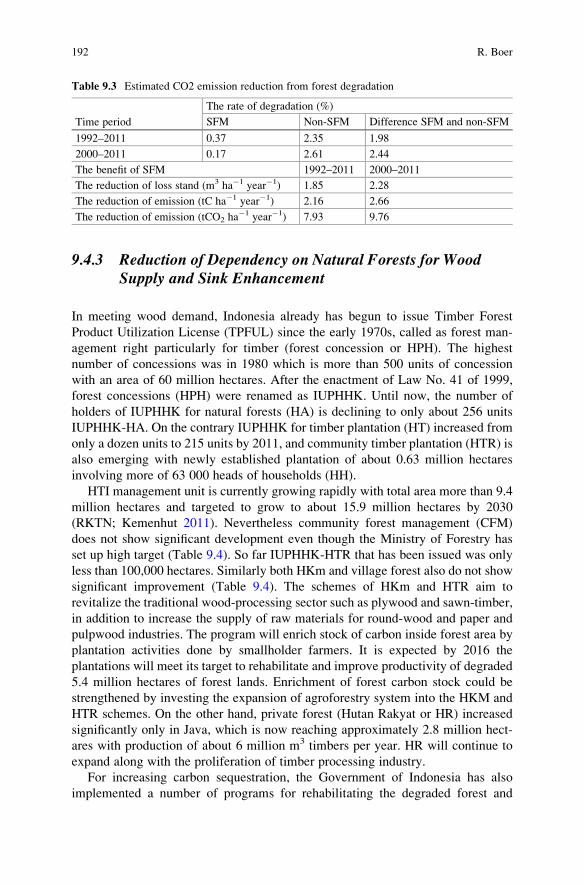
was found to be between 0.17 % and 0.37 % per year and non-SFM between
2.35 % and 2.61 % per year and this equivalent to CO2 emission reduction of
9.76 tCO2 ha�1 year�1 (Table 9.3).
Fig. 9.7 Ratio between volume of wood extraction and annual allowable cut in SFN and non-SFM
concessions
9 Potential of Reducing GHG Emission from REDD+ Activities in Indonesia 191
9.4.3 Reduction of Dependency on Natural Forests for WoodSupply and Sink Enhancement
In meeting wood demand, Indonesia already has begun to issue Timber Forest
Product Utilization License (TPFUL) since the early 1970s, called as forest man-
agement right particularly for timber (forest concession or HPH). The highest
number of concessions was in 1980 which is more than 500 units of concession
with an area of 60 million hectares. After the enactment of Law No. 41 of 1999,
forest concessions (HPH) were renamed as IUPHHK. Until now, the number of
holders of IUPHHK for natural forests (HA) is declining to only about 256 units
IUPHHK-HA. On the contrary IUPHHK for timber plantation (HT) increased from
only a dozen units to 215 units by 2011, and community timber plantation (HTR) is
also emerging with newly established plantation of about 0.63 million hectares
involving more of 63 000 heads of households (HH).
HTI management unit is currently growing rapidly with total area more than 9.4
million hectares and targeted to grow to about 15.9 million hectares by 2030
(RKTN; Kemenhut 2011). Nevertheless community forest management (CFM)
does not show significant development even though the Ministry of Forestry has
set up high target (Table 9.4). So far IUPHHK-HTR that has been issued was only
less than 100,000 hectares. Similarly both HKm and village forest also do not show
significant improvement (Table 9.4). The schemes of HKm and HTR aim to
revitalize the traditional wood-processing sector such as plywood and sawn-timber,
in addition to increase the supply of raw materials for round-wood and paper and
pulpwood industries. The program will enrich stock of carbon inside forest area by
plantation activities done by smallholder farmers. It is expected by 2016 the
plantations will meet its target to rehabilitate and improve productivity of degraded
5.4 million hectares of forest lands. Enrichment of forest carbon stock could be
strengthened by investing the expansion of agroforestry system into the HKM and
HTR schemes. On the other hand, private forest (Hutan Rakyat or HR) increased
significantly only in Java, which is now reaching approximately 2.8 million hect-
ares with production of about 6 million m3 timbers per year. HR will continue to
expand along with the proliferation of timber processing industry.
For increasing carbon sequestration, the Government of Indonesia has also
implemented a number of programs for rehabilitating the degraded forest and
Table 9.3 Estimated CO2 emission reduction from forest degradation
Time period
The rate of degradation (%)
SFM Non-SFM Difference SFM and non-SFM
1992–2011 0.37 2.35 1.98
2000–2011 0.17 2.61 2.44
The benefit of SFM 1992–2011 2000–2011
The reduction of loss stand (m3 ha�1 year�1) 1.85 2.28
The reduction of emission (tC ha�1 year�1) 2.16 2.66
The reduction of emission (tCO2 ha�1 year�1) 7.93 9.76
192 R. Boer

lands. At present due to the unsustainable practices of forest management, about
55.62 million hectares of production forest have been degraded (MoFor 2014). The
level of degradation can be seen in Table 9.5. Production forests under categories
2 and 3 are allocated for restoration of production forest ecosystem. Up to 2013,
total area of degraded production forests that have been granted with IUPPHK-RE
was only 397,878 ha. To increase the interest of private sector to invest in the
restoration of production forest ecosystem (IUPHHK-RE), the government may
need to revisit its policy and regulations as RE activity has different nature of
activities with IPHHK-HA. An incentive system should also be introduced.
As previously mentioned, the holders of IUPHHK-RE may not have cash inflow
for a number of years until forests are restored as the timber will be harvested after
reaching the equilibrium of ecosystems (e.g., 35 years). On the other hand, before
the business permit is issued, they are burdened with the obligation to pay many
fees as applied to IUPHHK-HA. In most cases, the holders of IUPHHK-RE can
Table 9.5 Condition of production forest
Category Production forest condition
Area
(million ha)
1 Production forests with medium to very low level of degradation and
now are still under management of concessionaires (IUPHHK-HA)
6.75
2 Production forests with medium level of degradation
(no concessionaires operate in the area)
6.40
3 Production forest with medium to very high level of degradation
(no concessionaires operate in the area)
14.15
4 Production forest with very high level of degradation (not meet forest
definition anymore)
27.33
Total 55.62
Source: Based on MoFor (2014) and Bahruni (2011)
Table 9.4 Target, allocation, verification, and license issuance of community-based forestry up
to 2010
Community-
based
forestry
program
Target up
to 2014
(Ha)
Allocation
(Ha)
Verification
(Ha)
License issuance
by the Ministry
of Forestry (Ha)
License issuance
by the governor/
head of district
(Ha)
Community
forestry
(HKm)
2.000.000 400.000 203.573 80.181 30.485,55
Community
forest plan-
tation
(HTR)
5.400.000 631.628 90.414,89
Forest vil-
lage (HD)
500.000 179.187 144.730 13.351 10.310,00
Total 7.900.000 1.210.815 93.532 120.910,44
Source: Sub-Direktorat HKm, HD dan HTR Kemenhut (in Nugroho et al. 2011)
9 Potential of Reducing GHG Emission from REDD+ Activities in Indonesia 193
survive as they received grants from foreign donors who request for preservation of
the forest ecosystem. Nugroho et al. (2011) recommended restructuring the regu-
lations on forest ecosystem restoration by involving the managers of ecosystem
restoration, government, and society. First is that ecosystem restoration business is
not profit-oriented business so that the treatments should be different from
IUPHHK-HA. Second, the current regulations PP. 3/2007 jo PP. No.03/2008 and
ministry regulations should be revised to incorporate fundamental substantial
changes, particularly on rights and obligations of license holders. Third is intro-
ducing incentive system for holders of IUPHHK-RE as they actually carry out
government obligation in restoring, conserving, and preserving forests that nearly
have no beneficial products.
Policy to prioritize the use of degraded forest for establishment of timber
plantation will enhance sink as carbon stock of timber plantation is much higher
than the degraded land and forest. In addition, the government for many years has
also implemented a program for rehabilitating lands in forest area (programreforestasi) and non-forest area (program penghijauan). In the last 10 years, the
Government of Indonesia has accelerated this program through GERHAN
(Gerakan Rehabilitasi Lahan dan Hutan). In the period of between 2003 and
2008, total areas planted through GERHAN reached 1,767,559 ha or equivalent
to about 300 thousand hectares per year or almost double than those implemented
before this period. In the National Forestry Plan (RKTN; Kemenhut 2011), it is
estimated that total degraded land in forest area that needs to be rehabilitated until
2030 is about 11.6 million ha. Therefore, rehabilitation of degraded land will be
accelerated. Annually, it is targeted that at least 580 thousand hectares of degraded
land is planted for rehabilitation.
Based on past experience in the implementation of the land rehabilitation
program, it was found that the level of success of this program is still low due to
lack of maintenance system (see Box 9.2) and no responsible management unit
exists to maintain the planted trees. Without changing strategy in the implementa-
tion of GERHAN, the target being defined in the RKTN will not be achieved. For
future program, the targeted area for GERHAN should be implemented in area
where the FMU already exists, and whenever possible, its implementation should
be integrated with CBFM program.
9.4.4 Reduction of Pressure on Natural Forest by OptimizingLand Use and Improving Land Productivityand Community Livelihood
In many regions, conversion of forest is mainly for agriculture activities either by
community or by company. Community normally encroached to forest area ille-
gally for planting annual crops or plantation, while company converted the forest to
agriculture plantation after having permit. The encroachment occurred in all forest
194 R. Boer

function but mainly in production forests. Therefore, many of forest areas are not
covered by forest. On the other hand, the Ministry of Forestry releases conversion
forest to local government to be used for non-forest-based activities where part of
the area is still covered by forest, while the other part is already deforested and used
by community. This condition often creates conflict between the community and
company when local government issued permit to a company to use the land for
plantation. Local government normally leaves the problem to company to solve,
and this creates high social cost for the company. When this problem is not properly
handled by companies, community will find new land and do encroachment again.
In other case, communities expand their agriculture land through encroachment
when their demand for land increases as the number of family increases. Looking at
this condition, pressure on natural forest will continue if integrated efforts across
related ministries and local governments are not in place.
Box 9.2 Survival Rate of Trees Under GERHAN Program
Based on assessment conducted by an independent consultant, PT Equality
Indonesia on GERHAN Program implemented in 2006/2007 at West Java
Province, it was found that the planted trees that can survive and form forest
stand were only 20 % even the total area planted over 80 % of the target. On
average based on evaluation in 13 districts in West Java Province, realization
of GERHAN program reached 84 %, but the ones that survive were only
about 53 % (note: based on regulation from the Ministry of Forestry, theGERHAN program is considered to be successful if the survival rate over56 %, without considering the condition of the trees). Further evaluation
indicated that of the 53 %, the survived trees with healthy condition were
only 42 % (Fig. 9.8). Based on this condition, number of trees that can survive
until forest stand on average will be about 18 % (0.84*0.53*0.42).
(continued)
0
10
20
30
40
50
60
70
80
90
100
Perc
enta
ge
Realiza�on of plan�ng target Growing Trees Healthy TreesFig. 9.8 Percentage of
realization of planting area,
survive trees, and healthy
trees (Analyzed from data
of PT. Equality Indonesia
2007)
9 Potential of Reducing GHG Emission from REDD+ Activities in Indonesia 195

Box 9.2 (continued)
Based on observation, implementation of GERHAN program in Java
islands was relatively better than those outside Java. Considering these
findings, it can be estimated that the level of success of GERHAN program
may be around 20 %. If there is no change in the implementation system of
the GERHAN program, with average planting rate of about 300 thousand
hectares per year, GERHAN areas which are able to form forest stand will be
only 60 thousand hectare.
Policies and potential programs that have been discussed and proposed by
stakeholders in reducing threat on natural forests and deforestation include the
following:
1. Enforcement of plantation companies to engage community in their plantation as
plasma farmers. Regulation on this is already available, i.e., Ministry of Agricul-
ture Regulation No. 26/Permentan/OT.140/2/2007 about Guidance on Permit for
Agriculture Plantation. In this regulation every plantation company is obliged to
establish plasma plantation at least 20 % of the total plantation area. However,
many companies have not met this obligation. Following the implementation of
mandatory certification system for plantations such as ISPO for palm oil, all
companies are very likely to meet their obligation. In the case, where a company
has already used all its land for plantation, the company will need to find land
outside their plantation. If agriculture plantation commodities are allowed to be
planted in forest area, this can be nicely integrated with community-based forest
management (CBFM) program such as community timber plantation (HTR),
community forest (HKm), and hutan desa (village forest). At present, one of
agriculture plantation commodity allowed to be planted in forest area is rubber
tree, while palm oil is still not allowed. In South Sumatra, HTR program has been
implemented in reforesting production forest area using rubber tree.
2. Improvement of crop productivity of small holder farmers. Most of communities
that occupy forest area for agriculture activities are poor farmers and have little
knowledge in good agriculture practices. For example, based on discussion with
farmers who occupy Kerinci Seblat National Park (KSNP) in South Sumatra, it
was stated that community tended to expand their agriculture lands to meet food
demand and income of their family as their family is growing. By increasing
crop productivity, the demand for land is expected to decrease (see Box 9.3).
Creation of other alternative income for this community as well as their institu-
tional capacity can increase the effectiveness of this program in reducing
pressure on the forest. Development of synergy or integration of community
empowerment programs from various sector and private (CSR) would be needed
to enhance the effectiveness of this program.
3. Optimization of the use of non-forested land for agriculture activities by changing
forest function. As shown in Figs. 9.1 and 9.2, more than 10 Mha of land in
conversion forest is forested land, while about 20 Mha land in production forests is
196 R. Boer
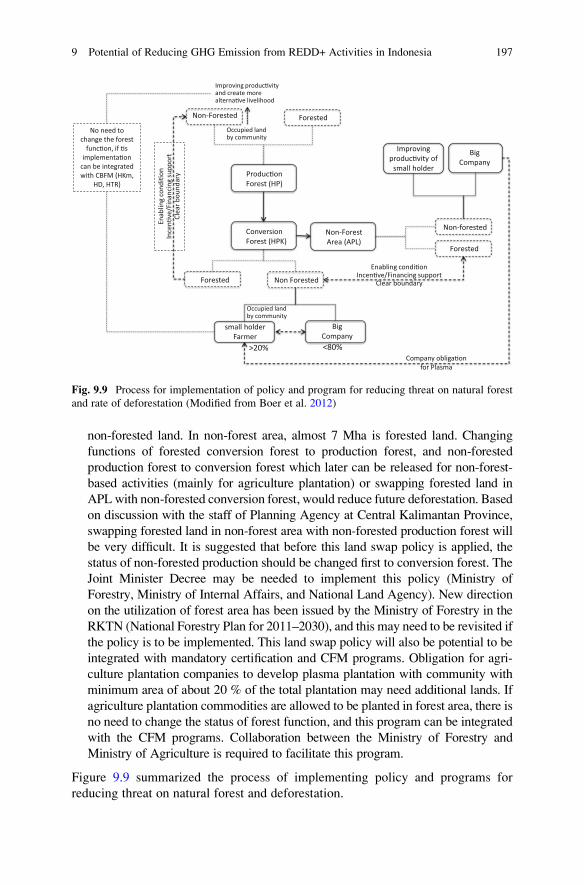
non-forested land. In non-forest area, almost 7 Mha is forested land. Changing
functions of forested conversion forest to production forest, and non-forested
production forest to conversion forest which later can be released for non-forest-
based activities (mainly for agriculture plantation) or swapping forested land in
APLwith non-forested conversion forest, would reduce future deforestation. Based
on discussion with the staff of Planning Agency at Central Kalimantan Province,
swapping forested land in non-forest area with non-forested production forest will
be very difficult. It is suggested that before this land swap policy is applied, the
status of non-forested production should be changed first to conversion forest. The
Joint Minister Decree may be needed to implement this policy (Ministry of
Forestry, Ministry of Internal Affairs, and National Land Agency). New direction
on the utilization of forest area has been issued by the Ministry of Forestry in the
RKTN (National Forestry Plan for 2011–2030), and this may need to be revisited if
the policy is to be implemented. This land swap policy will also be potential to be
integrated with mandatory certification and CFM programs. Obligation for agri-
culture plantation companies to develop plasma plantation with community with
minimum area of about 20 % of the total plantation may need additional lands. If
agriculture plantation commodities are allowed to be planted in forest area, there is
no need to change the status of forest function, and this program can be integrated
with the CFM programs. Collaboration between the Ministry of Forestry and
Ministry of Agriculture is required to facilitate this program.
Figure 9.9 summarized the process of implementing policy and programs for
reducing threat on natural forest and deforestation.
Produc�on Forest (HP)
Conversion Forest (HPK)
Non-Forest Area (APL)
Big Company
Improving produc�vity of
small holder
Non-forested
Forested
Big Company
small holder Farmer
Forested Non Forested
Non-Forested Forested Occupied land by community
Improving produc�vity and create more alterna�ve livelihood
Enabling condi�on Incen�ve/Financing support
Clear boundary
Company obliga�on for Plasma
>20% <80%
Enab
ling
cond
i�on
In
cen�
ve/F
inan
cing
supp
ort
Clea
r bou
ndar
y
No need to change the forest
func�on, if �s implementa�on
can be integrated with CBFM (HKm,
HD, HTR)
Occupied land by community
Fig. 9.9 Process for implementation of policy and program for reducing threat on natural forest
and rate of deforestation (Modified from Boer et al. 2012)
9 Potential of Reducing GHG Emission from REDD+ Activities in Indonesia 197
9.5 Financing and Incentive Policies for Supporting
the Implementation of SFM and REDD+
To support the implementation of the above four key policies and actions, there are
a number of financing and incentive policies that may need to be considered. These
include (1) financing policies for the acceleration of FMU establishment, (2) incen-
tive policies for the certification system, (3) financing and incentive policy for
accelerating the establishment of timber plantation on degraded land and CFM for
sink enhancement, and (4) incentive and financing policies for conserving forest
carbon and land swap.
9.5.1 Financial Policy for Development of FMUs
As discussed above, the total number of FMUs that need to be established in
Indonesia is about 600 units. Following target defined in the National Action Plan
for reducing GHG emission (Appendix President Regulation 61/2011) within
5 years (2010–2014), the total number of FMUs that will be established is
120 units. With the total number of 600 FMUs, the time required to complete the
establishment of FMU all over Indonesia would be 25 years. It is long process, with
assumption that rate of deforestation in the future under the absence of FMUs
follows historical rate; within the next 25 years, about 25 Mha of forest may be lost.
Following Bappenas’ assumption that the cost for establishing an FMU with self-
funded capacity is 40 billion IDR (5 years), total cost required for the 600 units will
be about 24 trillion IDR or 2.7 billion USD. Considering that this program will be a
key for the success of REDD+, acceleration of FMUs establishment is necessary.
Clear Roadmap on the Establishment of the all FMUs should be developed with
secure budget. The Government of Indonesia may negotiate with donor countries to
use debt-for-nature swap (DNS) scheme to secure budget to support the establish-
ment of the FMU.
Box 9.3 Reducing Pressure on Kerinci Seblat National Park (Source:
CER Indonesia and CCAP 2011)
Kerinci Seblat National Park (KSNP) is a part of the Bukit Barisan Mountain
Range, stretching north to south along Sumatra Island. The park’s locationmakes KSNP one of the richest conservation areas in terms of biodiversity.
However, KSNP is under great threat of deforestation and forest degradation.
A number of square kilometers of forest have been lost annually in the
national park, severely reducing the natural environment for animals and
other forest-dwelling life. The main drivers of deforestation and forest
(continued)
198 R. Boer

Box 9.3 (continued)
degradation in KSNP are encroachment by the community for agricultural
activities, illegal logging, and fires (Fig. 9.10).
Most of the villagers surrounding KSNP are involved in agricultural
activities such as rubber and coffee production. Each household has
1–25 ha of land for agriculture; although illegal, some of this is done inside
the KSNP area. Villagers enter the park because they need a large amount of
land for agriculture. The productivity of coffee is very low, i.e., only 0.4
ton/ha or about one twentieth of normal yield (6–10 ton/ha). By increasing
productivity of the crop just up to 4 t/ha will reduce the demand for land by
ten times from the usual one. At least there are four programs that can be
implemented for improving communities’ agriculture practices, namely,
(1) improving seed quality as in the usual practices communities get seed
from forest or from their garden, (2) improving maintenance and inputs as in
the usual practices farmers do not use fertilizer and there are no regular
weeding and spraying, (3) improving timing for harvesting to improve quality
of coffee as in usual practices farmers tend to harvest the coffee before it gets
mature, and (4) improving post-harvest management.
Enhancing capacity of farmers for improving agriculture practices could
increase productivity and their income and thereby reduce the demand for
land. This can be expected to reduce deforestation in KSNP. Strong assistance
for the community will be essential to maintain KSNP.
The roadmap for the establishment of FMU may include at least the following
aspects: (1) development of criteria and indicator for prioritizing forest area for
FMU’s establishment, (2) strategy on FMU institutional capacity building,
(3) development of strategic work plan of the FMU, and (4) monitoring and
evaluation system. The first aspect is very important to develop as level of risk
and problems vary across regions. The availability of criteria and indicator will help
the government in putting priority where FMU should be first established and
Fig. 9.10 (a) Slash and burn activity in KSNP, (b): agricultural land inside KSNP
9 Potential of Reducing GHG Emission from REDD+ Activities in Indonesia 199
ensure the presence of FMU will have significant impact on the improvement of
performance in forest management or keep good forest management system to
continue. The second aspect refers to steps of actions that would be implemented in
developing capacity of the FMU organization. The third aspect refers to readiness
of the FMU to carry out its role and function, and the fourth aspect refers to
development of system to monitor and evaluate the performance of the FMU
which will be needed for the development of improvement plan of the FMU.
Kartodihardjo et al. (2011) proposed at least eight criteria for evaluating the FMU
development performance, namely, (1) area stability, (2) forest use planning,
(3) management plan, (4) organizational capacity, (5) inter-strata relations within
government and regulations, (6) investment mechanism, (7) availability of access
and community rights, and (8) forestry dispute settlement mechanism. In each
typology indicators need to be developed for these criteria.
In terms of FMU organization capacity, capacity development should enable the
FMU (1) to promote forestry professionalism and be able to perform management
that can produce economic value from forest utilization that is balanced with the
conservation, protection, and social functions of the forest; (2) to develop invest-
ments and provide work opportunities; (3) to prepare spatial-based planning and
monitoring/evaluation; (4) to protect forest interests (including the public interest in
the forest); (5) to respond to the range of local, national, and global forest manage-
ment impacts (e.g., the forest’s role in mitigating global climate change); and (6) to
adjust to local conditions/typology as well as strategic environmental changes
affecting forest management (Kartodihardjo et al. 2011).
9.5.2 Incentive System for Certification
As discussed above, the Government of Indonesia has issued a number of manda-
tory certification systems. These mandatory certification systems as mentioned
previously are applied for all forest management/business entities (from large to
small scale), namely, IUPHHK-HA, IUPHHK-HT, and IUPHHK-RE, and commu-
nity forest management (CFM),3 namely, HTR and HKm (with permit utilization)
and/or village forest/Adat forest (with management rights) and Hutan Rakyat
(private forest, forest management on an owned land) as well as wood industries.
For community-based forest management entities, obligation for doing certification
may add burden as this will increase cost of production. On the other hand, some
also argued the effectiveness of applying mandatory forest certification system,
such as SFM/SVLK, in reducing illegal logging may also not be significant as the
3 Community forest management (CFM) combines two things: a type of resource (forest) and a
group of owner/manager (community). The term CFM broadly refers to various forms: Participa-
tory Forest Management (PFM), Joint Forest Management (JFM), joint forest management (forest
co-management), and Community-Based Forest Management (CBFM).
200 R. Boer
certified company only able to manage the illegal activities within its company site,
while market for illegal wood still exists.
Applying same rules for IUPHHK-RE (ecosystem restoration) as applied to
other wood business forest activities in certification process may also be counter-
productive. In the IUPHHK-RE, forest management units (concessionaires) are not
allowed to do wood logging until forest reaches equilibrium conditions (may take
time for about 35 years). Thus, in the short term, there will be noncash inflow to the
concessionaires. While at present, treatments in term of fee and procedure for
getting the permit (IUPHHK-RE) are similar to IUPHHK-HA (HPH) and
IUPHHK-HT (timber plantation) as well as obligation for having certification.
Without changing this policy, interest of private to do investment for production
forest ecosystem restoration will be very low. Based on data from Purnama and
Daryanto (2006), more than 10 million ha of production forest is suitable for
IUPHHK-RE, while until now the total area of degraded production forests granted
with IUPPHK-RE was only 185,005 ha.
Another mandatory certification system for agriculture plantation such ISPO
which will oblige plantation companies to develop plasma farmer with minimum
area of 20 % of the total area of the plantation will also face dilemma. For new
plantation, it may not be difficult to establish such plasma; however, for old
plantation, this will be difficult as all their plantation areas are already planted.
The only alternative ways is to find additional lands to be used for plasma. This will
be very costly if no support mechanism from government.
Considering the above dilemma, incentive system for certification may need to
be expanded. Some of potential incentive policies in supporting the mandatory
certification system may include the following:
1. Expanding type of incentive for small business entity in getting certification. In
the context of SVLK, program for increasing awareness of community on the
importance of using certified wood product for saving environment should be
progressively implemented. In reality, many wood consumers in developing
nations do not care too much on this issue; the consumers are more interested
in buying cheaper products. Based on discussion with stakeholder in East Java,
price of illegal wood could be half of that the legal ones, so that wood products
produced from these will be much cheaper. At present, the government has
provided support for small holder company via government budget (APBN) to
cover the cost for certification. This subsidy is still not enough as the cost for
producing one unit product from certified timber is still higher than the one used
illegal ones. In this regard, the incentive4 for small holder may need to increase
so that the price of certified wood product can compete with the non-certified
one. At the same time, the awareness-raising programs for community for
consuming certified wood products have to be promoted. The subsidy can be
4 Incentive could also be given in form of direct inputs subsidy.
9 Potential of Reducing GHG Emission from REDD+ Activities in Indonesia 201
gradually reduced when domestic market for certified wood products increases.
This type of policy could be also negotiated for debt-for-nature swap program.
2. Providing subsidy for business entities focusing on ecosystem restoration in
having the mandatory certification.
3. Providing incentive for plantation companies in getting lands for plasma farmers
as support for the company in meeting certification obligations. Implementation
of this policy could be integrated with CFM programs.
9.5.3 Incentive and Financial Policy for Acceleratingthe Establishment of Timber Plantation on DegradedLand and CFM for Sink Enhancement
Many of degraded lands in forest area are claimed by community. When permit for
using the land has been granted to an entity, conflict on the land normally emerges
between the entity and the communities. For this reason, private entities prefer to
use forested land in forest area for timber plantation or peatland as these areas
normally have no or less conflict (no community claim on the land). Ideally, the
government should issue permit on safe and conflict-free (clean and clear) forest
areas. However, in most cases this is not the case, and the permit holders have to
solve this land conflict problem. Level of conflict varies between regions, and social
cost that has to be covered by the permit holder in the establishment of plantation
will also vary. The high social costs prevent the permit holders to establish
plantation. In this regard, the government needs to create incentive system for
permit holders in handling this land conflict problem, and the types of the incentive
may be varied depending on level of conflicts. The incentive could be in the form of
reducing or exemption of administration/retribution fees for certain period of time
depending on level of conflict. With this incentive policy, establishment of timber
plantation in degraded land can be accelerated, and the dependency on natural
forest for supplying wood will also reduce.
In managing the land conflict issue, the MoF also implements CFM program.
The program gives access and right to communities to use the forest area or
formalize/legalize the use of the land by the community. The communities have
to apply for getting the permits (HTR, HKm, village, and Adat forests). However,
the process for getting the permits is too complex for communities, and it is also a
lengthy process. Without any assistance from their partners, communities are
mostly unable to have the permits. Financial support from the government to
communities in implementing the CFM is also available via BLU-P3H (General
Services Agency). The amount of funding available for supporting the CFM is also
huge, i.e., over a billion of USD. However, the absorption of fund is also very low,
less than 1 %. Simplifying the process of getting permit and accessing fund from the
BLU-P3H will also be crucial for accelerating the implementation of the CFM. As
mentioned above, up to now the realization of the CFM program is far from target
(see Table 9.4).
202 R. Boer
Acceleration of the ecosystem restoration program which will have significant
contribution to sink enhancement also needs incentive from the government.
Incentive in the form of reducing administration/retribution fees for certain period
or exemption from some of administration/retribution fees is recommended.
9.5.4 Incentive and Financial Policies for Conserving ForestCarbon and Land Swap
Implementation of land swap policies and exchange of forest functions in order to
avoid deforestation (conserving carbon stock in forest) will need incentive and
financial policy supports. Nurrochmat (2011) proposed a number of incentive and
financial policy for supporting local government in implementing the policies.
These include:
1. Financial policy on special allocation fund (Dana Alokasi Kusus, DAK) for
conservation. This policy is an incentive from the national government to local
government that commits to conserve forest for environmental services. Special
allocation fund given to the conservation region should compensate the benefit
loss coming from natural resource extraction or forest land conversion (conver-
sion value). The Ministry of Finance plans to accommodate this in revision of
Act No. 33/2004 (Ministry of Finance 2011).
2. Revision of fiscal balance law to enforcing “liability rule.” The present fiscal
balance law regulates the benefit sharing of natural resource extraction between
national and local governments, as well as among local governments. The
magnitude of sharing depends on the magnitude income that comes from the
extraction of natural resources. In this case, the higher the number of the natural
resources extracted by certain region, the bigger the benefit sharing received by
the region. Revision of the existing fiscal balance law to be a more green fiscal
balance is needed to avoid overexploitation and further destruction of natural
resources in the regions due to short-term economic interest. A green fiscal
balance shall give a proportional attention both in the reward side and in the
punishment side to ensure the sustainability of nature resource management.
From the above discussion, it is quite clear that the issue of forest boundary (safe
and conflict-free forest areas) and policy on the issuance of permit on the use forest
area are two factors that will contribute to the achievement of SFM and REDD+
implementation. Development of boundaries between non-forest and forest areas
needs acceleration. In regard with the forest boundary issues, Kemenhut (2011)
reported that up to 2010 length of boundary between forest and non-forest areas and
between forest functions reach 281,873 km covering area of about 14,238,516 Ha or
about 10 % of total forest area of Indonesia. This condition is considered as one of
the important factors causing conflict of land right and access in all provinces. At
present there is about 22.5–24.4 Mha of forest area in conflict, and a number of
9 Potential of Reducing GHG Emission from REDD+ Activities in Indonesia 203
villages within forest area reach 19,420 villages (Dephut and BPS 2009 in
Kartodihardjo et al. 2011).
The cost of developing forest boundary is quite expensive. Following the
regulation from the MoF, cost for changing forest functions that include developing
forest boundary is 3.4 billion IDR per 12,000 ha. To reduce the cost, the process of
the development of the forest boundary could be integrated with the development of
FMU and conducted through participatory mapping process. In line with recom-
mendation from Kartodihardjo et al. (2011), in addressing this boundary issue in
connection with FMU establishment, there are several strategic directives that
should be adopted depending on conditions in the FMU. These directives include:
1. Localization of all areas that have serious tenurial conflict into areas of
noneffective production as a transitional policy and gradually building a collab-
oration to optimize achievement of sustainable forest management objectives.
2. Development of micro-spatial arrangements together with the community in
order to reach mutual agreement with the community on the utilization norms for
each spatial function.
3. Recommendation of legal settlement through the mechanism of revising the
spatial arrangements in areas with serious tenurial conflict that is unlikely to be
retained as forest areas.
4. Accommodation of community access to forest resources by rearranging the
norms for utilizing such resources in accordance with sustainability principles.
5. Development of a mechanism for recognizing community management rights in
areas of serious/minor tenurial conflict in the context of sustainable forest
management. This mechanism serves as the basis for FMU managers to prepare
licensing recommendations for communities.
6. Engagement of law enforcement for all issues relating to illegal activities.
Another important key factor for achieving SFM is availability and accessibility
of funds for supporting SFM practices, particularly for engagement of communities
in CFM. With the current system, the available fund to support CFM managed by
the BLU-P3H as discussed above is not easily accessed by community due to the
administration procedure. Policy allowing for transferring the funds to a financing
system relatively easy to be accessed by community is required. Two types of
financing systems that can be generated at regional level and may meet this need are
“blending financing” and “hybrid micro-financing systems” (CER Indonesia and
CCAP 2010). Blending financing system is a financing system that synergizes all
financial sources such as CSR funding, government funding such as state budget
(APBN), and local government budget (APBD) funds, banking, and international
funding. This system can help leverage private funding and supports regional
development by supporting community activities in urban agriculture and agrofor-
estry including building human resource capacity through assistance and training
activities.
Unlike the blending financing model, the hybrid micro-financing system will
utilize more government funds than private funds. Funding to support CFM (HTR,
HKm, HD/HAd), which is currently managed by BLU-P3H, would be part of this
204 R. Boer
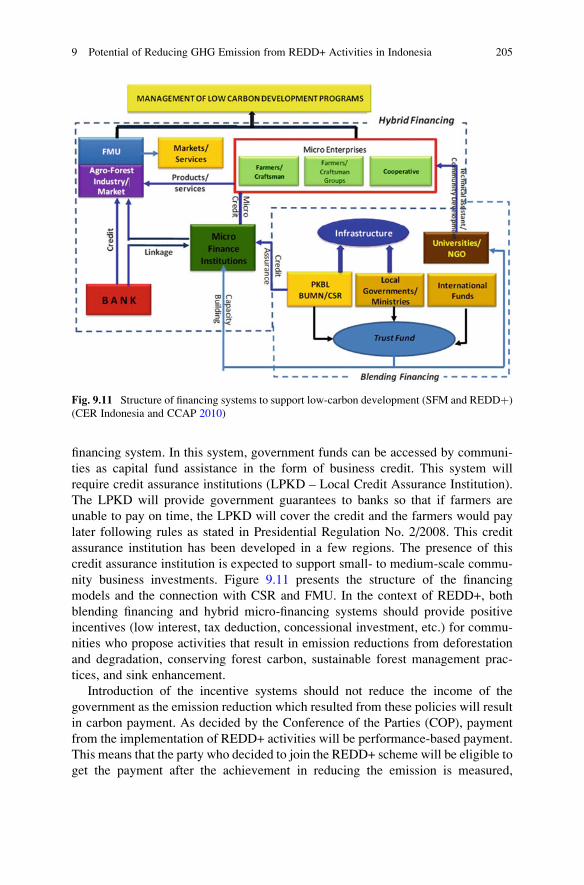
financing system. In this system, government funds can be accessed by communi-
ties as capital fund assistance in the form of business credit. This system will
require credit assurance institutions (LPKD – Local Credit Assurance Institution).
The LPKD will provide government guarantees to banks so that if farmers are
unable to pay on time, the LPKD will cover the credit and the farmers would pay
later following rules as stated in Presidential Regulation No. 2/2008. This credit
assurance institution has been developed in a few regions. The presence of this
credit assurance institution is expected to support small- to medium-scale commu-
nity business investments. Figure 9.11 presents the structure of the financing
models and the connection with CSR and FMU. In the context of REDD+, both
blending financing and hybrid micro-financing systems should provide positive
incentives (low interest, tax deduction, concessional investment, etc.) for commu-
nities who propose activities that result in emission reductions from deforestation
and degradation, conserving forest carbon, sustainable forest management prac-
tices, and sink enhancement.
Introduction of the incentive systems should not reduce the income of the
government as the emission reduction which resulted from these policies will result
in carbon payment. As decided by the Conference of the Parties (COP), payment
from the implementation of REDD+ activities will be performance-based payment.
This means that the party who decided to join the REDD+ scheme will be eligible to
get the payment after the achievement in reducing the emission is measured,
Fig. 9.11 Structure of financing systems to support low-carbon development (SFM and REDDþ)
(CER Indonesia and CCAP 2010)
9 Potential of Reducing GHG Emission from REDD+ Activities in Indonesia 205
reported, and verified by the third independent parties. The magnitude of the
emission reduction is measured against the reference emission level being used.
The study of Schmitz et al. (2014) indicated that by increasing investment in
forest sector for facilitating change in technology (TC) at rate of 1 % per year on top
of the external investment, the forest destruction might decrease. The hypothesis of
this scenario is that higher investments in TC can reduce the rate of forest destruc-
tion without any forest protection (e.g., investing in agricultural productivity
reduces pressure on tropical forests without the necessity of direct protection; see
section 9.6.5). Their study suggested that in the Pacific Asia (most of forest in
Indonesia) without any significant change in forest protection program from Busi-
ness as Usual (called as reference scenario), by 2050 the loss of forest cover might
reach 43 % of that of 2010. If this figure is used for Indonesia, under the reference
scenario, the remaining Indonesia forest cover by 2050 would be about 55.7 million
ha or equivalent to total forest loss of about 43.4 million ha or about 1.08 million ha
per year. This figure is slightly higher than the historical deforestation rate in the
period 1990–2013, i.e., 0.822 million ha per year (see Sect. 9.3). With the increase
of investment by 1 % per year from the top of the external investment for the TC, it
is expected that the forest loss in Indonesia would be only 13.5 million ha or
equivalent to rate of deforestation of 0.337 million ha per year. As discussed
above, the implementation of the above innovative financing and incentive policies
might improve land and forest management, and this may further increase the
potential of reducing emission from REDD+ activities.
Open Access This chapter is distributed under the terms of the Creative Commons Attribution
Noncommercial License, which permits any noncommercial use, distribution, and reproduction in
any medium, provided the original author(s) and source are credited.
References
Avisar R, Werth D (2005) Global hydroclimatological teleconnections resulting from tropical
deforestation. J Hydrometeorol 6:134–145
Bahruni (2011) Conduct study and analysis on economic incentive framework of SFM as impor-
tant option for forest based climate change mitigation-to reduce emission from and by tropical
forest. ITTO Project Report RED-PD 007/09 Rev.2 (F)
Bappenas (2010) Naskah Akademis Rencana Aksi Nasional Penurunan Emisi Gas Rumah Kaca
(GRK) 2010–2020. Badan Perencanaan Pembangunan Nasional, Republik Indonesia, Jakarta
Boer R (2009) Reduction emission from deforestation and forest degradation and sustainable
development in Indonesia. In: Habito CF, Kojima S (eds) Mainstreaming sustainable devel-
opment policies in East Asia. ERIA research project report 2008 No. 6–2. http://www.eria.org/
pdf/research/y2008/no6-2/Appendix3.pdf
Boer R (2012) Sustainable forest management, forest based carbon, carbon stock, co2 sequestra-
tion and green product in order to reduce emission from deforestation and forest degradation.
Technical Report: Indonesia’s Ministry of Forestry International Tropical Timber Organization
RED-PD 007/09 Rev. 2 (F): Enhancing Forest Carbon Stock to Reduce Emissions from
Deforestation and Degradation through Sustainable Forest Management (SFM) Initiatives in
Indonesia, Jakarta
206 R. Boer
Boer R, Nurrrochmat DR, Ardiansyah M, Purwawangsa H, Hariyadi, Ginting G (2012). Reducing
agricultural expansion into forests in Central Kalimantan-Indonesia: analysis of implementa-
tion and financing gaps. Research report submitted to Prince of York. Bogor
Busch J, Ferretti-Gallon K, Engelmann J, Wright M, Austin KG, Stolle F, Turubanova S, Potapov
PV, Margono B, Hansen MH, Baccini A (2015) Reductions in emissions from deforestation
from Indonesia’s moratorium on new oil palm, timber, and logging concessions. PNAS
112:1328–1333
CER Indonesia and CCAP (2010) Establishing integrated forest policies to reduce greenhouse gas
emissions from deforestation and forest degradation at the District Level. Phase 1: the District
of Musi Rawas, South Sumatra. Carbon Environmental Research Indonesia (CER Indonesia)
and Centre for Clean Air Policy (CCAP), Bogor
CER Indonesia and CCAP (2011). Establishing Integrated Forest Policies to Reduce Greenhouse
Gas Emissions from Deforestation and Forest Degradation at the District Level. Phase 2: The
District of Musi Rawas, South Sumatra. Carbon Environmental Research Indonesia (CER
Indonesia) and Centre for Clean Air Policy (CCAP), Bogor
Dale VH (1997) The relationship between land-use change and climate change. Ecol Appl
7:753–769
Dickinson R, Henderson-Sellers A (1988) Modelling tropical deforestation: a study of GCM land-
surface parameterizations. Quart J R Meteor Soc 114:439–462
Directorate of Forest Resource Inventory and Monitoring (2015) Data dan Informasi Geospasial
Dasar dan Tematik Kehutanan Terkini Tingkat Nasional. Presentation for Workshop on
“Working Preparation for 2015”, Auditorium Utama Manggala Wanabakti, 2 Maret 2015,
Jakarta
Ditjen BUK (2011) Data Release Ditjen BUK Triwulan 1 Tahun 2011. Direktorat Jendral Bina
Usaha Kehutanan, Jakarta. www.dephut.go.id
Hergoualc’h K, Verchot LV (2014) Greenhouse gas emission factors for land use and land-use
change in Southeast Asian peatlands. Mitig Adapt Strateg Glob Change 19:789–807
Hosonuma N, Herold M, De Sy V, De Fries RS, Brockhaus M, Verchot L, Angelsen A, Romijn E
(2012) An assessment of deforestation and forest degradation drivers in developing countries.
Environ Res Lett 7 (12pp). doi:0.1088/1748-9326/7/4/044009
Houghton RA, House JI, Pongratz J, van der Werf GR, De- Fries RS, Hansen MC, Le Quere C,
Ramankutty N (2012) Carbon emissions from land use and land-cover change. Biogeosciences
9:5125–5142. doi:10.5194/bg-9-5125-2012
Kartodihardjo H, Nugroho B, Putro HR (2011) Forest Management Unit Development (FMU):
concept, legislation and implementation. Directorate General of Forestry Planning, Ministry of
Forestry, Jakarta
Kemenhut (2011) Rencana Kehutanan Tingkat Nasional (RKTN) tahun 2011–2030. Kementrian
Kehutanan Republik Indonesia. Jakarta
Le Quere C, Andres RJ, Boden T, Conway T, Houghton RA, House JI, Marland G, Peters GP, van
der Werf GR, Ahlstrom A, Andrew RM, Bopp L, Canadell JG, Ciais P, Doney SC, Enright C,
Friedlingstein P, Huntingford C, Jain AK, Jourdain C, Kato E, Keeling RF, Klein Goldewijk K,
Levis S, Levy P, Lomas M, Poulter B, Raupach MR, Schwinger J, Sitch S, Stocker BD,
Viovy N, Zaehle S, Zeng N (2013) The global carbon budget 1959–2011. Earth Syst Sci Data
5:165–185. doi:10.5194/essd-5-165-2013
Ministry of Finance (2011) Policy brief: instrument and financing mechanism on reducing GHG
emission. Fiscal Policy Agency, Ministry of Finance, Jakarta
MoE (2003) National strategy study on CDM in forestry sector. Ministry of Environment, Jakarta
MoE (2010) Indonesian second national communication to UNFCCC. Ministry of Environment-
Republic of Indonesia, Jakarta
MoFor (2014) Ministry of forestry statistics year 2013. Ministry of Forestry, Jakarta
Nugroho B, Sukardi D, Widyantoro B (2011) Study and analyze regulations concerning sustain-
able forest management, forest based carbon, carbon stock, CO2 sequestration and green
product. ITTP Project Report RED-PD 007/09 Rev.2 (F)
9 Potential of Reducing GHG Emission from REDD+ Activities in Indonesia 207
Nugroho B, Ridwan M, Hendri, Kartikasari K, Boer R (2014) Development of FMU as one of the
strategies for ensuring the sustainability of emission reduction commitment. Technical report
for LAMA-I Project, ICRAF, Bogor
Nurrochmat DR (2011) Review infrastructure framework and mechanism related to SFM as
Important option in reducing emission from deforestation and forest degradation. Report
submitted to Indonesia Ministry of Forestry and International Tropical Timber Organization,
Jakarta
PT. Equality Indonesia (2007) Laporan akhir Pekerjaan Penilaian Tanaman GN-RHL/Gerhan
tahun 2006/2007 Wilayah Propinsi Jabar. Bogor
Rusolono T, Tiryana T (2011) Review of existing sustainable forest management (SFM)-based
projects in Indonesia. ITTO Project Report RED-PD 007/09 Rev.2 (F)
Schmitz C, Kreidenweis U, Lotze-Campen H, Popp A, Krause M, Dietrich JP, Muller C (2014)
Agricultural trade and tropical deforestation: interactions and related policy options. Reg
Environ Change, 16pp. doi:10.1007/s10113-014-0700-2
Shukla J, Nobre C, Sellers PJ (1990) Amazon deforestation and climate change. Science
247:1322–1325
Tim Pokja Kementrian Kehutanan (2010) Laporan Kelompok Kerja Kebijakan Kehutanan.
Kementrian Kehutanan, Jakarta
208 R. Boer