chapter 9 multiscale modeling of rna structure and dynamics
TRANSCRIPT

1Chapter 92Multiscale Modeling of RNA Structure3and Dynamics
4Feng Ding and Nikolay V. Dokholyan
5Abstract We have developed a multiscale approach for RNA folding using dis-6crete molecular dynamics (DMD), a rapid conformational sampling algorithm. We7use a coarse-grained representation to effectively model RNA structures. Bench-8mark studies suggest that the DMD-based RNA model is able to accurately fold9small RNA molecules (<50 nucleotides). However, the large conformational space10and force field inaccuracies make it difficult to computationally identify the native11states of large RNA molecules. We devised an automated modeling approach for12prediction of large and complex RNA structures using experimentally derived13structural constraints and tested it on several RNA molecules with known experi-14mental structures. In all cases, we were able to bias the DMD simulations to the15native states of these RNA molecules. Therefore, a combination of experimental16and computational approaches has the potential to yield native-like models for the17diverse universe of functionally important RNAs, whose structures cannot be18characterized by conventional structural methods.
199.1 Introduction
20RNA molecules play a wide range of functional roles in gene expression, from21regulating transcription and translation [e.g., riboswitch regulator motifs (Edwards22et al. 2007)] to decoding genetic messages (tRNA), catalyzing mRNA splicing23[spliceosome RNA or self-splicing introns (Vicens and Cech 2006)] and protein24synthesis (rRNA). Knowledge of the underlying RNA structure in these and many25other molecules is a fundamental prerequisite to a complete understanding of RNA26function. Methods such as X-ray crystallography and NMR spectroscopy offer critical
F. Ding • N.V. Dokholyan (*)Department of Biochemistry and Biophysics, School of Medicine, University of North Carolina,Chapel Hill, NC 27599, USAe-mail: [email protected]
N. Leontis and E. Westhof (eds.), RNA 3D Structure Analysis and Prediction,Nucleic Acids and Molecular Biology 27, DOI 10.1007/978-3-642-25740-7_9,# Springer-Verlag Berlin Heidelberg 2012

27 insight into the details of RNA structure–function relationships. However, many28 RNAs contain both structured and functionally important but flexible elements.29 These RNAs are not amenable to structure determination in their intact forms by30 crystallography or NMR. Hence, molecular modeling of RNA to predict three-31 dimensional structure and dynamics is crucial for our understanding ofRNA functions.32 Currently, RNA folding tools focus mainly on predicting RNA secondary33 structure (Hofacker 2003; Mathews 2006; Zuker 2003). Using a dynamic program-34 ming approach (Eddy 2004), secondary structures are inferred by scoring nearest-35 neighbor stacking interactions with adjacent base pairs (Mathews 2006). These36 RNA secondary structure prediction methods play an important role in the current37 study of RNA. However, in order to model the tertiary structure of RNA molecules,38 it is necessary to explicitly model RNA in 3D. Cao and Chen designed a simplified39 diamond-lattice model for predicting folded structure and thermodynamics of RNA40 pseudoknots (Cao and Chen 2005, 2006). This approach quantitatively predicts the41 free energy landscape for sequence-dependent folding of RNA pseudoknots, in42 agreement with experimental observations (Cao and Chen 2005, 2006). However,43 due to lattice constraints and the dynamic issues associated with predefined Monte44 Carlo moves (Baumgartner 1987), off-lattice models are necessary to accurately45 model RNA 3D structure.46 Computational tools for manually constructing RNA models have been devel-47 oped for RNA 3D structure prediction (Shapiro et al. 2007). These methods use48 comparative sequence analysis to manually construct 3D models, with or without49 reference to a known, homologous 3D structure. Their accuracy is enhanced by use50 of experimental probes of secondary or tertiary structure and libraries of modular51 3D motifs (Jossinet and Westhof 2005; Major et al. 1991, 1993; Massire et al. 1998;52 Massire and Westhof 1998; Shapiro et al. 2007; Tsai et al. 2003). Recently,53 significant progress has been made toward ab initio modeling of RNA 3D structures54 (Das and Baker 2007; Ding et al. 2008; Parisien and Major 2008). These studies55 show that starting only with sequence, it is possible to predict the structures of some56 small RNA motifs with atomic-level accuracy. However, as RNA length increases,57 the conformational space increases exponentially and the inherent inaccuracies of58 the force field accumulate, limiting the ability of current methods to predict the59 structures of large RNAs automatically. De novo prediction of large RNA60 structures with nontrivial tertiary folds from sequence alone remains beyond the61 realm of current ab initio algorithms.62 We have developed a multiscale approach (Ding and Dokholyan 2005) for RNA63 modeling based on a coarse-grained RNA model for discrete molecular dynamics64 (DMD) simulations (Ding et al. 2008). DMD is a special type of molecular dynamics65 simulation in which pairwise interactions are approximated by stepwise functions.66 This approximation enables DMD to sample conformational space more efficiently67 than traditional molecular dynamics simulations (Dokholyan et al. 1998). Using the68 coarse-grained RNAmodel with DMD simulations, we were able to accurately fold a69 set of 150 small RNA molecules (<50 nt) within 6 A (a majority within 4 A) to their70 native states (Ding et al. 2008). To solve the folding problem of large RNAmolecules71 with complex tertiary 3D structures, we proposed to incorporate experimentally
F. Ding and N.V. Dokholyan

72derived structural information into our structure determination protocol. Long-range73constraints for RNA modeling can be inferred from a variety of biochemical and74bioinformatic techniques, ranging from chemical footprinting and cross linking to75sequence covariation (Gutell et al. 1992; Juzumiene et al. 2001; Michel and Westhof761990; Ziehler and Engelke 2001). Experimental constraints derived from these bio-77chemical and bioinformatics techniques are generally of lower than atomic resolution,78but can be readily incorporated into the coarse-grained RNA model for structure79determination. The all-atom RNA model can then be reconstructed from the coarse-80grained structural model.81First, we will describe our coarse-grained representation of RNA models for82DMD simulations. Then, we will describe and evaluate the applications of the83DMD–RNA procedure to ab initio folding of a set of small RNA models and84structure determination using experimental constraints.
859.2 Coarse-Grained RNA Modeling Using Discrete Molecule86Dynamics
87We use DMD as the conformational sampling engine. A detailed description of the88DMD algorithm can be found elsewhere (Dokholyan et al. 1998; Rapaport 2004;89Zhou and Karplus 1997). The difference between discrete molecular dynamics and90traditional molecular dynamics is in the interaction potential functions. Interatomic91interactions in DMD are governed by stepwise potential functions (Fig. 9.1a).92Neighboring interactions (such as bonds, bond angles, and dihedrals) are modeled93by infinitely high square well potentials (Fig. 9.1b). By approximating the continu-94ous potential functions with step functions of pairwise distances, DMD simulations95are reduced to event-driven (collision) molecular dynamics simulation. In a DMD96simulation, atoms move with constant velocity until they collide with another atom.97As soon as the potential of interaction between the two atoms changes (i.e., the98pairwise distance is at the step of the stepwise potential function), the velocities of99the two interacting atoms change instantaneously (Fig. 9.1a). These velocity100changes are required to conform to the conservation laws of energy, momentum,101and angular momentum. Each such collision is termed an “event.” The sampling102efficiency of DMD over traditional MD is mainly due to rapid processing of103collision events and localized updates of collisions (only colliding atoms are104updated at each collision). In the limit of infinitesimally small steps, the discrete105step function approaches the continuous potential function, and DMD simulations106become equivalent to traditional molecular dynamics.107We approximate the single-stranded RNA molecule as a coarse-grained “beads-108on-a-string” polymer with three beads representing each nucleotide, one for sugar (S),109one for phosphate (P), and one for nucleotide base (B) (Fig. 9.2a). The P and S beads110are positioned at the centers of mass of the corresponding phosphate group and the1115-atom ring sugar, respectively. For both purines (adenine and guanine) and
9 Multiscale Modeling of RNA Structure and Dynamics

112 pyrimidines (uracil and cytosine), we represent the base bead (B) as the center of the113 6-atom ring. The neighboring beads along the sequence, whichmay representmoieties114 that belong to the same or a neighboring nucleotide, are constrained tomimic the chain115 connectivity and local chain geometry (Fig. 9.2a). Types of constraints include116 covalent bonds (solid lines), bond angles (dashed lines), and dihedral angles117 (dotted–dashed lines). The parameters for bonded interactions mimic the folded118 RNA structure and are derived from a high-resolution RNA structure database119 (Murray et al. 2003) (Table 9.1). Nonbonded interactions are crucial to model the120 folding dynamics of RNA molecules. In our model, we include base-pairing121 (Watson–Crick pairs of A–U and G–C and Wobble pair of U–G), base-stacking,122 short-range phosphate–phosphate repulsion, and hydrophobic interactions, which123 are described in the following section with the parameterization procedure.124 Base Pairing. Two base-paired nucleotides have bases facing each other with the125 corresponding sugar and base beads aligned linearly. We use the “reaction” algorithm126 to model the orientation dependence of base-pairing interactions. The details of the127 algorithm can be found in (Ding et al. 2003). Briefly, to model the orientation128 dependence, we introduce auxiliary interactions in addition to the distance-dependent129 interactions between hydrogen bond donor and acceptor atoms (Fig. 9.2b). For130 example, when the two nucleotides (e.g., A–U, G–C, or U–G, represented as Bi and131 Bj in Fig. 9.2b) approach the interaction range, we evaluate the distances between SiBj
132 and SjBi, which define the relative orientations of these two nucleotides. A hydrogen133 bond is allowed to form only when the distances fall within predetermined ranges. A134 schematic of the auxiliary interaction potential is shown in Fig. 9.2c, and the135 corresponding interaction parameters are listed in Table 9.2.136 Hydrophobic Interactions and Overpacking. Buried inside the double-helix, the137 planar surface of bases are hydrophobic in nature. We include a weak attraction
a b
mi
mj
Vi Vi,
Vj,Vj
3–0.35
0.35
0.7
0
4 5 6 7 8 9Distance, Å Distance, Å
Pot
entia
l, K
cal/m
ol
Fig. 9.1 Discrete molecular dynamics simulations. (a) Schematic of the DMD potential. Thestepwise function used in DMD is the approximation of the continuous function in traditionalmolecular dynamics. The insert depicts the collision of two atoms with masses of mi and mj at theinitial position of ri and rj, respectively. The two atoms move with constant velocities (v) until theymeet at distance of Rij. (b) Schematic of the potential energy of bonds in DMD. The atom pairsremain within the distance range during the simulation
F. Ding and N.V. Dokholyan

138between all the base beads. Due to the coarse-graining feature of our model, the139assignment of attraction between bases results in overpacking (e.g., the symmetri-140cally attractive interactions tend to form close packing). In order to avoid the141artifact of overpacking, we first evaluate the packing observed in experimental1423D structures (http://ndbserver.rutgers.edu). We compute for each base the number143of neighboring bases within a cutoff distance of 6.5 A. The histogram of the number144of neighbors is shown in Fig. 9.2d. Indeed, we find that the average number of145neighbors is much smaller than that of close packing, 12. In order to avoid unreal-146istic close-packing due to the coarse-graining process, we introduce an effective147energy term to penalize overpacking of bases:
Eoverpack ¼ dEY nc " nmaxð Þ; (9.1)
Fig. 9.2 Coarse-grained structural model of RNA employed in DMD simulations. (a) Threeconsecutive nucleotides, indexed i"1, i, i + 1 are shown. The S, P, and B symbols correspond toloci of sugar, phosphate, and base beads in the RNA, respectively. Covalent interactions are shownas thick lines, angular constraints as dashed lines, and dihedral constraints as dashed–dotted lines.Additional steric constraints are used to model base stacking. (b) Hydrogen bonding in RNA basepairing. The base-pairing contacts between bases Bi"1:Bj+1 and Bi:Bj are shown in dashed lines. Areaction algorithm is used (see Methods) for modeling the hydrogen-bonding interaction betweenspecific nucleotide base pairs. (c) Schematic of the potential function for the auxiliary base-pairinginteractions. (d) Histogram of the number of neighboring bases within a cutoff of 6.5 A
9 Multiscale Modeling of RNA Structure and Dynamics
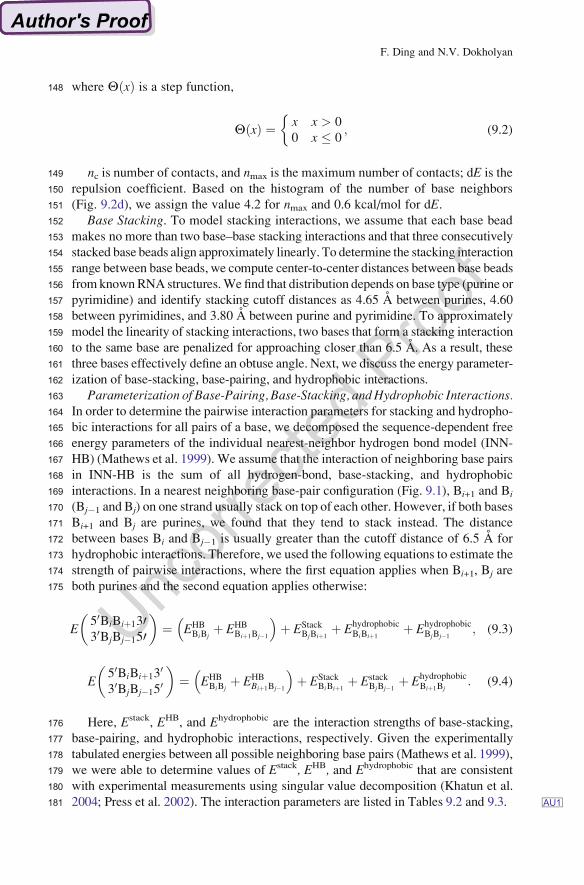
148 where YðxÞ is a step function,
YðxÞ ¼ x x > 00 x % 0
!; (9.2)
149 nc is number of contacts, and nmax is the maximum number of contacts; dE is the150 repulsion coefficient. Based on the histogram of the number of base neighbors151 (Fig. 9.2d), we assign the value 4.2 for nmax and 0.6 kcal/mol for dE.152 Base Stacking. To model stacking interactions, we assume that each base bead153 makes no more than two base–base stacking interactions and that three consecutively154 stacked base beads align approximately linearly. To determine the stacking interaction155 range between base beads, we compute center-to-center distances between base beads156 fromknownRNA structures.We find that distribution depends on base type (purine or157 pyrimidine) and identify stacking cutoff distances as 4.65 A between purines, 4.60158 between pyrimidines, and 3.80 A between purine and pyrimidine. To approximately159 model the linearity of stacking interactions, two bases that form a stacking interaction160 to the same base are penalized for approaching closer than 6.5 A. As a result, these161 three bases effectively define an obtuse angle. Next, we discuss the energy parameter-162 ization of base-stacking, base-pairing, and hydrophobic interactions.163 Parameterization of Base-Pairing, Base-Stacking, andHydrophobic Interactions.164 In order to determine the pairwise interaction parameters for stacking and hydropho-165 bic interactions for all pairs of a base, we decomposed the sequence-dependent free166 energy parameters of the individual nearest-neighbor hydrogen bond model (INN-167 HB) (Mathews et al. 1999). We assume that the interaction of neighboring base pairs168 in INN-HB is the sum of all hydrogen-bond, base-stacking, and hydrophobic169 interactions. In a nearest neighboring base-pair configuration (Fig. 9.1), Bi+1 and Bi
170 (Bj"1 and Bj) on one strand usually stack on top of each other. However, if both bases171 Bi+1 and Bj are purines, we found that they tend to stack instead. The distance172 between bases Bi and Bj"1 is usually greater than the cutoff distance of 6.5 A for173 hydrophobic interactions. Therefore, we used the following equations to estimate the174 strength of pairwise interactions, where the first equation applies when Bi+1, Bj are175 both purines and the second equation applies otherwise:
E50BiBiþ13030BjBj"150
" #¼
$EHBBiBj
þ EHBBiþ1Bj"1
%þ EStack
BjBiþ1þ Ehydrophobic
BiBiþ1þ Ehydrophobic
BjBj"1; (9.3)
E50BiBiþ13
0
30BjBj"150
" #¼
$EHBBiBj
þ EHBBiþ1Bj"1
%þ EStack
BiBiþ1þ Estack
BjBj"1þ Ehydrophobic
Biþ1Bj: (9.4)
176 Here, Estack, EHB, and Ehydrophobic are the interaction strengths of base-stacking,177 base-pairing, and hydrophobic interactions, respectively. Given the experimentally178 tabulated energies between all possible neighboring base pairs (Mathews et al. 1999),179 we were able to determine values of Estack, EHB, and Ehydrophobic that are consistent180 with experimental measurements using singular value decomposition (Khatun et al.181 2004; AU1Press et al. 2002). The interaction parameters are listed in Tables 9.2 and 9.3.
F. Ding and N.V. Dokholyan

Table 9.1 The averages andstandard deviations of thebonded atom pairs
Bonded atom pair Distance range (A) t1:1
Pi Si 4.55 ' 0.09 t1:2
Si Pi+1 4.10 ' 0.07 t1:3
Si Ai 4.85 ' 0.15 t1:4
Si Ui 3.74 ' 0.08 t1:5
Si Gi 4.81 ' 0.14 t1:6
Si Ci 3.70 ' 0.13 t1:7
Pi Pi+1 6.25 ' 0.95 t1:8
Si Si+1 5.72 ' 0.45 t1:9
Pi Ai 7.45 ' 0.45 t1:10
Pi Ui 5.57 ' 0.37 t1:11
Pi Gi 7.43 ' 0.43 t1:12
Pi Ci 5.57 ' 0.37 t1:13
Ai Pi+1 7.25 ' 0.42 t1:14
Ui Pi+1 6.40 ' 0.20 t1:15
Gi Pi+1 7.20 ' 0.43 t1:16
Ci Pi+1 6.40 ' 0.20 t1:17
Pi-1 Si 9.25 ' 0.95 t1:18
Si-1 Pi+1 8.96 ' 0.44 t1:19
Ai-1 Si 5.68 ' 0.68 t1:20
Ui-1 Si 6.38 þ 0.73 t1:21
Gi"1 Si 5.68 ' 0.68 t1:22
Ci"1 Si 6.38 ' 0.73 t1:23
Si"1 Ai 7.25 ' 0.60 t1:24
Si"1 Ui 5.66 ' 0.54 t1:25
Si"1 Gi 7.25 ' 0.60 t1:26
Si"1 Ci 5.66 ' 0.54 t1:27
t1:28All the bonds, angles, and dihedrals are effectively modeled usinga bonded interaction in the DMD simulations (Fig. 9.1b). A, U, G,and C corresponds to four types of bases (B)
t2:1Table 9.2 The parameters for base pairing, modeled by hydrogen bonds between A–U, G–C,and U–G
Atom pair dmin (A) d0, (A) d1, (A) dmax (A) t2:2
Ci–Gj base pair t2:3
Si Gj 7.70 8.08 8.63 9.00 t2:4
Ci Sj 9.74 10.10 10.53 10.82 t2:5
Ai–Uj base pair t2:6
Si Uj 9.76 9.94 10.50 10.76 t2:7
Ai Sj 7.72 7.92 8.82 9.00 t2:8
Ui–Gj base pair t2:9
Si Gj 7.00 7.44 8.24 8.70 t2:10
Ui Sj 9.50 10.25 10.80 11.35 t2:11
t2:12The details of the DMD algorithm for the hydrogen bond can be found in Ding et al. (2003). Theschematic interaction potential is shown in Fig. 9.2c. The hydrogen bond strengths, EHB, for A–U,G–C, and U–G are 0.5, 1.2, and 0.5 Kcal/mol, respectively. The interaction potential between thedonor and acceptor is "EHB
9 Multiscale Modeling of RNA Structure and Dynamics

182 Loop Entropy. Loop entropy plays a pivotal role in RNA folding kinetics and183 thermodynamics (Tinoco and Bustamante 1999). Hence, RNA folding prediction184 methods should take this entropic effect into account, either implicitly as in all-185 atomMD simulations (Sorin et al. 2004) or explicitly as in Monte Carlo or dynamic186 programming methods (Mathews 2006; Rivas and Eddy 1999). However, the187 reduction of degrees of freedom in our simplified RNA model causes entropy to188 be underestimated in DMD simulations. For example, we often observe formation of189 large loops that traps RNA molecules in nonnative conformations for significant190 simulation times. To overcome such artifacts arising from the coarse-graining pro-191 cess, we developed a simple modification of DMD simulation to model loop entropy192 explicitly. We use the free energy estimations for different types of loops, including193 hairpin, bulge, and internal loops (Mathews et al. 1999). Loop free energies were194 obtained from experimental fitting for small loops and extended to arbitrary lengths195 according to polymer theory. We compute the effective loop free energy in DMD196 simulations based on the set of base pairs formed in simulations. Upon the formation197 or breaking of each base pair, the total loop free energy changes according to the198 changes in either the number or size of loops. We estimate the changes in loop free199 energy, DGloop, for each base pair formed during the simulation and determine the200 probability of forming such a base pair by coupling to a Monte Carlo procedure using201 a Metropolis algorithm with probability p ¼ exp("bDGloop). If the base pair is202 allowed to form stochastically, the particular base pair will form only if the kinetic203 energy is sufficient to overcome the possible potential energy difference before and204 after the base-pair formation. Upon breaking of a base pair, the stochastic procedure205 is not invoked since base-pair breakage is always entropically favorable. The break-206 ing of a base pair is only governed by the conservation of momentum, energy, and207 angular momentum before and after the base-pair breakage.
t3:1 Table 9.3 The stacking and hydrophobic interaction strengths, expressed in kcal/mol units
EStack AU UA GC CG GU UGt3:2
AU "0.45 "0.50 "0.75 "0.95 "0.42 "0.70t3:3
UA "0.50 "0.40 "0.55 "0.60 "0.35 "0.35t3:4
GC "0.75 "0.55 "0.81 "0.95 "0.48 "0.92t3:5
CG "0.95 "0.60 "0.95 "1.10 "0.47 "0.51t3:6
GU "0.42 "0.35 "0.48 "0.47 "0.52 0.62t3:7
UG "0.70 "0.35 "0.51 "0.51 0.62 "0.44t3:8
EHydrophobic AU UA GC CG GU UGt3:9
AU "0.25 "0.40 "0.40 "0.50 "0.25 "0.35t3:10
UA "0.40 "0.30 "0.25 "0.25 "0.25 "0.25t3:11
GC "0.40 "0.25 "0.25 "0.45 "0.25 "0.41t3:12
CG "0.50 "0.25 "0.45 "0.50 "0.25 "0.41t3:13
GU "0.25 "0.25 "0.25 "0.25 "0.30 0.25t3:14
UG "0.35 "0.25 "0.41 "0.41 0.25 "0.25t3:15
t3:16 The subscript indicates that the base bead is paired. For example, AU is a base bead A that has beenpaired with a U bead. The cutoff distance for stacking interactions is 6.0 A. The cutoff distance forhydrophobic interactions is 6.5 A. The hardcore distance between all beads is set as 3.0 A
F. Ding and N.V. Dokholyan

208The total potential energy, E, is obtained by adding all interaction terms, as given209in (9.5):
E ¼ EBonded þ EHbond þ EStack þ EHydrophobic þ Eoverpacking þ Gloop; (9.5)
210and is used to perform DMD simulations of RNA molecules. The energy landscape211of RNA molecules is very rugged with a vast number of local minima due to the212high degeneracy of nucleotide types (only 4 compared to the 20 different amino213acids found in proteins). In order to efficiently sample the conformational space of214RNAs, we utilize the replica-exchange sampling scheme (Okamoto 2004; Zhou215et al. 2001).216Replica Exchange DMD. In replica exchange computing, multiple simulations217or replicas of the same system are performed in parallel at different temperatures.218Individual simulations are coupled through Monte Carlo-based exchanges of simu-219lation temperatures between replicas at periodic time intervals. For two replicas,220i and j, maintained at temperatures Ti and Tj and with energies Ei and Ej,221temperatures are exchanged according to the canonical Metropolis criterion with222exchange probability p, where p ¼ 1 if D ¼ 1=kBTi " 1" kBTj
& 'Ej " Ei
& '% 0,
223and p ¼ exp "Dð Þ, if D>0. For simplicity, we use the same set of eight temperatures224in all replica exchange simulations: 0.200, 0.208, 0.214, 0.220, 0.225, 0.230, 0.235,225and 0.240. The temperature is in the abstract unit of kcal/(mol kB). Note that we226approximate the pairwise potential energy between coarse-grained beads with the227experimentally determined free energy of nearest neighboring base pairs, instead of228the actual enthalpy. As a result, the temperature does not directly correspond to229physical temperatures. In DMD simulations, we maintain constant temperature230using an Anderson thermostat (Andersen 1980).231Since the DMD code is highly optimized, we have found that the computa-232tional timescales linearly with respect to the system size. The folding simulation233of a 50-nucleotide-long RNA sequence (median size of RNA chains in the234sample) for 2 ( 106 DMD simulation time units takes approximately 7 h of235total wall-clock time, utilizing eight 2.33-GHz Intel Xeon compute nodes.
2369.3 Ab Initio Folding of Small RNA Molecules
237For each RNA molecule, we initially generated a linear conformation using the238nucleotide sequence alone. Starting from this extended conformation, we239performed replica exchange simulations at different temperatures as described240above. From the simulation trajectories, we extracted sampled RNA conforma-241tional states, including the lowest energy state, the folding intermediate state, and242the corresponding thermodynamic data. In Fig. 9.3, we illustrate the folding243trajectory of one of the replicas for a turnip yellow mosaic virus (TYMV)244pseudoknot (PDB ID: 1A60). An RNA pseudoknot structure has nonnested base245pairing and minimally comprises base pairing between a loop region and a down-246stream RNA segment. Pseudoknots serve diverse biological functions, including
9 Multiscale Modeling of RNA Structure and Dynamics

247 formation of protein recognition sites that mediate replication and translational248 initiation, participation in self-cleaving ribozyme catalysis, and induction of249 frameshifts in translation of mRNA by ribosomes (Staple and Butcher 2005). For250 example, 1A60 is composed of a 50-stem and a 30-pseudoknot (Fig. 9.3c). From the251 simulation trajectory (Fig. 9.3), we observe folding of the RNA model within 5 A252 root-mean-square deviation (RMSD) to the native state, and the lowest RMSD from253 the simulations is 2.03 A. The lowest potential energy conformation, computed254 across all replicas using the effective free energy function in (9.5), has all native255 base pairs formed and an RMSD of 4.58 A to the native state. Interestingly, we find256 that during the folding process the RNA molecule samples a stable folding inter-257 mediate state (Fig. 9.3a, b). The intermediate state forms a 50-stem and a partially258 folded 30-pseudoknot with one of the stems. Our identified folding intermediate259 state is consistent with the NMR studies of the solution structures of the TYMV260 pseudoknot and its 30-stem (Kolk et al. 1998). Therefore, our DMD simulation not
Fig. 9.3 Folding of a pseudoknot. For one replica, we present the RMSD (a) and energy (b) as thefunction of simulation time. Before folding into its native state (c), the molecule samples a foldingintermediate state (d). (e) Specific heat is computed from the replica exchange trajectories usingWHAM. (f) Two-dimensional potential of mean force 2D-PMF (potential mean force) forpseudoknot folding at T* ¼ 0.245 (corresponds to the major peak in the specific heat). The twointermediate states and the native state are indicated by I1, I2, and N, respectively. (g) The 2D-PMFplot at T* ¼ 0.21
F. Ding and N.V. Dokholyan
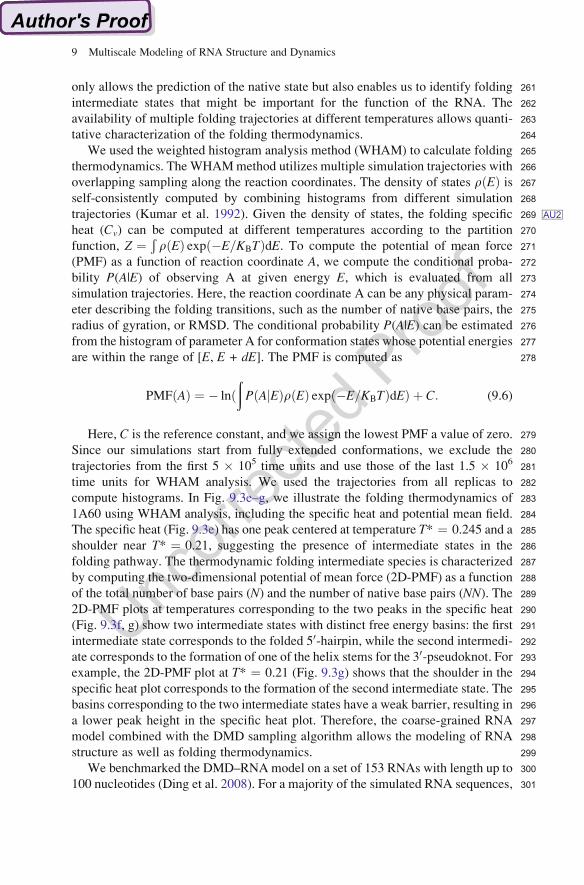
261only allows the prediction of the native state but also enables us to identify folding262intermediate states that might be important for the function of the RNA. The263availability of multiple folding trajectories at different temperatures allows quanti-264tative characterization of the folding thermodynamics.265We used the weighted histogram analysis method (WHAM) to calculate folding266thermodynamics. The WHAMmethod utilizes multiple simulation trajectories with267overlapping sampling along the reaction coordinates. The density of states rðEÞ is268self-consistently computed by combining histograms from different simulation269trajectories ( AU2Kumar et al. 1992). Given the density of states, the folding specific270heat (Cv) can be computed at different temperatures according to the partition271function, Z ¼
ÐrðEÞ expð"E=KBTÞdE. To compute the potential of mean force
272(PMF) as a function of reaction coordinate A, we compute the conditional proba-273bility P(A|E) of observing A at given energy E, which is evaluated from all274simulation trajectories. Here, the reaction coordinate A can be any physical param-275eter describing the folding transitions, such as the number of native base pairs, the276radius of gyration, or RMSD. The conditional probability P(A|E) can be estimated277from the histogram of parameter A for conformation states whose potential energies278are within the range of [E, E + dE]. The PMF is computed as
PMFðAÞ ¼ " lnððPðAjEÞrðEÞ expð"E=KBTÞdEÞ þ C: (9.6)
279Here, C is the reference constant, and we assign the lowest PMF a value of zero.280Since our simulations start from fully extended conformations, we exclude the281trajectories from the first 5 ( 105 time units and use those of the last 1.5 ( 106
282time units for WHAM analysis. We used the trajectories from all replicas to283compute histograms. In Fig. 9.3e–g, we illustrate the folding thermodynamics of2841A60 using WHAM analysis, including the specific heat and potential mean field.285The specific heat (Fig. 9.3e) has one peak centered at temperature T* ¼ 0.245 and a286shoulder near T* ¼ 0.21, suggesting the presence of intermediate states in the287folding pathway. The thermodynamic folding intermediate species is characterized288by computing the two-dimensional potential of mean force (2D-PMF) as a function289of the total number of base pairs (N) and the number of native base pairs (NN). The2902D-PMF plots at temperatures corresponding to the two peaks in the specific heat291(Fig. 9.3f, g) show two intermediate states with distinct free energy basins: the first292intermediate state corresponds to the folded 50-hairpin, while the second intermedi-293ate corresponds to the formation of one of the helix stems for the 30-pseudoknot. For294example, the 2D-PMF plot at T* ¼ 0.21 (Fig. 9.3g) shows that the shoulder in the295specific heat plot corresponds to the formation of the second intermediate state. The296basins corresponding to the two intermediate states have a weak barrier, resulting in297a lower peak height in the specific heat plot. Therefore, the coarse-grained RNA298model combined with the DMD sampling algorithm allows the modeling of RNA299structure as well as folding thermodynamics.300We benchmarked the DMD–RNAmodel on a set of 153 RNAs with length up to301100 nucleotides (Ding et al. 2008). For a majority of the simulated RNA sequences,
9 Multiscale Modeling of RNA Structure and Dynamics

302 the lowest energy structures from simulations have a percentage of native base303 pairs, or Q-value, close to unity, suggesting the correct formation of native base304 pairs in simulations. Here, we only considered the base pairs of A–U, G–C, and305 U–G. The other commonly observed Wobble pairing, A–G, was not included in the306 benchmark study but will be included in future studies. The average Q-value for all307 153 RNA molecules studied is 94%. For comparison with available secondary308 structure prediction methods, we also computed the Q-values using Mfold, which309 yielded an average Q-value of 91%. Given the high percentage of correctly310 predicted base pairs (94%) and the relatively simple topology of the studied RNA311 molecules, the average number of incorrectly predicted base pairs is less than one.312 The RMSD between predicted and experimental structures is often computed to313 evaluate the accuracy of predicted tertiary structures. Although the RMSD calculation314 does not provide detailed information on local structural features such as base pairing315 and base stacking, it gives a straightforward measure of the overall structure predic-316 tion. Recently, we have developed an approach to evaluate the statistical significance317 of RNA 3D structure prediction with a given RMSD for different lengths (Hajdin et al.318 2010). Alternatively, Parisien et al. (2009) have proposed new metrics to account for319 both local and global structural information during structural comparison. However,320 their calculation requires the atomic structure of the prediction. To evaluate the overall321 3D fold of our coarse-grained models, we computed the RMSD to compare our322 predictions with experimental structures. We found that for RNA molecules with323 nucleotide length < 50 nt, the RMSD of predicted structures are less than 6 A.324 Predictions of longer RNAs exhibit larger RMSD due to the highly flexible nature325 of RNAmolecules. Among the 153 sequences simulated, 84%of the predicted tertiary326 structures have an RMSD of<4 A with respect to the experimentally derived native327 RNA structure. The benchmark results highlight the predictive power of the328 DMD–RNA methodology, at least for small RNA molecules.329 Three out of 153 RNA molecules studied are longer than 65 nucleotides, where330 the DMD–RNA method cannot be applied to predict the native secondary and331 tertiary structure from sequence alone. The challenges to predict large RNA folding332 ab initio arise from the exponentially increasing size of the conformational space333 and inaccuracies in the force field. Therefore, it is important to develop new334 approaches to predict the 3D fold of large RNA molecules.
335 9.4 Automated RNA Structure Determination Using336 Experimental Constraints
337 RNA structural information including secondary structure and some tertiary338 interactions can often be derived experimentally and computationally prior to the339 determination of high-resolution 3D structure. Accurate RNA secondary structures340 can be obtained from comparative sequence analysis (Gutell et al. 2002; Michel and341 Westhof 1990) and experimentally constrained prediction (Deigan et al. 2009a).
F. Ding and N.V. Dokholyan

342SHAPE chemistry (selective 20-hydroxyl acylation analyzed by primer extension)343was recently shown to be a powerful approach for analyzing secondary structure at344single nucleotide resolution for RNAs of any length (Merino et al. 2005; Wilkinson345et al. 2006). SHAPE exploits the discovery that the 20-OH group in unconstrained or346flexible nucleotides reacts preferentially with hydroxyl-selective electrophilic347reagents. In contrast, nucleotides constrained by base-pairing or tertiary348interactions are unreactive. The resulting reactivity information can be used, in349concert with a secondary structure prediction algorithm, to obtain accurate second-350ary structures (Deigan et al. 2009b; Mathews et al. 2004; Mortimer and Weeks3512007; Wang et al. 2008; Wilkinson et al. 2008). Long-range interactions of RNA352molecules can also be inferred by biochemical and bioinformatic methods, such as353dimethyl sulfate (DMS) modification (Jan and Sarnow 2002; Flor et al. 1989),354hydroxyl radical protection (Murphy and Cech 1994), mutational analysis355(Kanamori and Nakashima 2001; De la Pena et al. 2003; Khvorova et al. 2003;356Murphy and Cech 1994; Wang et al. 1995), and sequence covariation (Cannone357et al. 2002). Therefore, we propose to incorporate experimentally determined358secondary and tertiary structure information into DMD simulations to reconstruct359a conformational ensemble that is consistent with experimental measurements.360In general, existing programs for modeling complex RNAs use either computa-361tionally intensive all-atom reconstruction, which limits their applications to small362RNAs, or overly simplifiedmodels that omit key structural details. Other challenges in363many current approaches are requirements for high levels of expert user intervention364or comparative sequence information and the reliance on chemical intuition derived365from preexisting information on tertiary interactions [reviewed in (Shapiro et al.3662007)]. Here, we developed an approach for accurate de novo determination of367RNA tertiary fold that does not require expert user intervention nor impose heavy368computational requirements, and that is efficient for large RNAs (Fig. 9.4). The369approach takes an input list of base pairs and distance constraints between specific370pairs of nucleotides and outputs a structural ensemble that is consistent with the input371constraints. Starting from the extended conformation, we performed DMD372simulations with biased potential for base-pairing constraints. Iterative DMD optimi-373zation was performed until all base pairs formed. After base-pair formation was374confirmed, long-range interaction constraints were added for DMD simulated375annealing simulations. At the end of each simulated annealing simulation, we devised376filters to evaluate the simulation results, including radius of gyration and/or number of377satisfied long-range constraints. We performed iterative annealing simulations until378all filters were satisfied and, after constructing the structural ensemble from simulation379trajectories, performed cluster analysis to identify representative structures. In all380DMD simulations, only serial computation (instead of replica exchange) was used,381which also reduced the computational requirement.382We tested the automated structure refinement method on tRNAasp (Gherghe et al.3832009). Base pairing from the X-ray crystallography structure was consistent with the384SHAPE-derived secondary structures. Long-range distance constraints were deter-385mined using a site-directed footprinting experiment. An Fe(II)-EDTA moiety was386tethered specifically to RNA using the site-selective intercalation reagent
9 Multiscale Modeling of RNA Structure and Dynamics

387 methidiumpropyl-EDTA (MPE) (Hertzberg and Dervan 1982). MPE preferentially388 intercalates at CpG steps in RNA at sites adjacent to a single-nucleotide bulge (White389 and Draper 1987; White and Draper 1989), which can be introduced by mutations in390 helical regions. To apply the cleavage information to bias DMD simulations, we391 developed a generic approach to interpret each cleavage event as a distance constraint392 (Fig. 9.5). The interaction potential features a “soft” energy wall at 25 A, with smaller393 energy bonuses extending out to 35 A (Fig. 9.5). The 25-A barrier corresponds to the394 distance cutoff within which the nucleotides exhibit strong cleavage and beyond395 which the nucleotides have weak cleavage. The interaction strength is assigned396 according to the cleavage intensity [E / ln(I/<I>)]. This approach has two397 advantages: (1) no user input is required to decide whether a given cleavage is398 significant or not and (2) structure refinement is highly tolerant of measurement errors399 inherent in any hydroxyl radical footprinting experiment. By using this structure400 determination approach (Fig. 9.5), we were able to refine the structure of tRNAasp to401 6.4 A RMSD relative to the crystal structure (Gherghe et al. 2009).402 Recently, we applied the structure refinement methodology on four RNAs:403 domain III of the cricket paralysis virus internal ribosome entry site (CrPV)
Primary sequence ANDBase-pairs determined by
SHAPE chemistry
DMD Optimization
All base-pair formed?No
Randomize velocity with DMDsimulation at a high temperature
Add potential forlong-range constraints
Long-range constraintsFrom experiments
Assign biased potential forbase-pair constraints
Yes
DMD Simulated Annealing
Filters, e.g. Rgand/or number of long-range
constraint violations,satisfied?
Randomize velocity with DMDSimulation at a high temperature
No
Construct the structure ensemble consistent with experimentalmeasurement and perform the cluster analysis to identifyrepresentative structures for all-atom reconstruction.
Yes
Fig. 9.4 Flowchart of the DMD–RNA structure determination method using experimentallyderived structural information
F. Ding and N.V. Dokholyan

404(49 nts), a full-length hammerhead ribozyme from S. mansoni (HHR) (67 nts),405S. cerevisiae tRNAAsp (75 nts), and the P546 domain of the T. thermophilia group406I intron (P546) (158 nts). Each of these RNAs has a complex three-dimensional fold,407involving more than simple intrahelix interactions. Prior to publication of the high-408resolution structures (Cate et al. 1996; Costantino et al. 2008;Martick and Scott 2006;409Westhof et al. 1988), significant biochemical or bioinformatic data describing tertiary410interactionswere available for each RNA. The secondary structure was also known to411high accuracy in each case. Only this prior information was used during DMD412refinement. In all cases, we were able to generate a low-RMSD structure. The413RMSD between the predicted structure and the native state for the CrPV, HHR,414tRNAAsp, and P546 RNAs are 3.6, 5.4, 6.4, and 11.3 A, respectively (Lavender et al.4152010). Calculations were performed on a Linux workstation (Intel Pentium 4 proces-416sor, 3.2 GHz) and the CPU times ranged from 18 (CrPV, 49 nts) to 42 h (P546,417158 nts). Therefore, the combination of efficient DMD simulations and sufficient418biochemical experiments can accurately determineRNA structure of arbitrary length.
4199.5 Conclusions
420We have developed a multiscale RNA modeling approach to model 3D structure421and dynamics of RNAs having a wide range of lengths. We use a coarse-grained422representation of the RNA to efficiently model the conformational space. For short423RNA molecules (<50 nt), we are able to capture the folded state from the sequence424alone. The availability of replica-exchange simulation trajectories at multiple425temperatures allows for the characterization of folding thermodynamics as well426as capture of the final folded state. To efficiently sample the exponentially increas-427ing conformational space of large RNA molecules, we devised an automated428modeling approach to determine large and complex RNA structures using experi-429mentally derived structural information. A benchmark study (Lavender et al. 2010)430highlights the application of combining DMD simulation and experimental struc-431tural information to yield native-like models for the diverse universe of functionally432important RNAs whose structures cannot be characterized by conventional433methods.
Fig. 9.5 Potential functionused to convert experimentalcleavage information intoDMD potential energyconstraints
9 Multiscale Modeling of RNA Structure and Dynamics

434 References
435 Andersen HC (1980) Molecular dynamics simulations at constant pressure and/or temperature.436 J Chem Phys 72:10437 Baumgartner A (1987) Applications of the Monte-Carlo simulations in statistical physics.438 Springer, New York439 Cannone J, Subramanian S, Schnare M, Collett J, D’Souza L, Du Y, Feng B, Lin N, Madabusi L,440 M€uller K et al (2002) The comparative RNA web (CRW) site: an online database of compara-441 tive sequence and structure information for ribosomal, intron, and other RNAs. BMC Bioin-442 formatics 3:e2443 Cao S, Chen SJ (2005) Predicting RNA folding thermodynamics with a reduced chain representa-444 tion model. RNA 11:1884–1897445 Cao S, Chen SJ (2006) Predicting RNA pseudoknot folding thermodynamics. Nucleic Acids Res446 34:2634–2652447 Cate JH, Gooding AR, Podell E, Zhou K, Golden BL, Kundrot CE, Cech TR, Doudna JA (1996)448 Crystal structure of a group I ribozyme domain: principles of RNA packing. Science449 273:1678–1685450 Costantino DA, Pfingsten JS, Rambo RP, Kieft JS (2008) tRNA-mRNAmimicry drives translation451 initiation from a viral IRES. Nat Struct Mol Biol 15:57–64452 Das R, Baker D (2007) Automated de novo prediction of native-like RNA tertiary structures. Proc453 Natl Acad Sci 104:14664–14669454 De la Pena M, Gago S, Flores R (2003) Peripheral regions of natural hammerhead ribozymes455 greatly increase their self-cleavage activity. EMBO J 22:5561–5570456 Deigan KE, Li TW, Mathews DH, Weeks KM (2009a) Accurate SHAPE-directed RNA structure457 determination. Proc Natl Acad Sci USA 106:97–102458 AU3Deigan KE, Li TW, Mathews DH, Weeks KM (2009b) Accurate SHAPE-directed RNA structure459 determination. Proc Natl Acad Sci USA 106, in press460 Ding F, Borreguero JM, Buldyrey SV, Stanley HE, Dokholyan NV (2003) Mechanism for the461 alpha-helix to beta-hairpin transition. Proteins 53:220–228462 Ding F, Dokholyan NV (2005) Simple but predictive protein models. Trends Biotechnol463 23:450–455464 Ding F, Sharma S, Chalasani V, Demidov V, Broude NE, Dokholyan NV (2008) Ab initio RNA465 folding by discrete molecular dynamics: from structure prediction to folding mechanisms.466 RNA 14:1164–1173467 Dokholyan NV, Buldyrev SV, Stanley HE, Shakhnovich EI (1998) Discrete molecular dynamics468 studies of the folding of a protein-like model. Fold Des 3:577–587469 Eddy SR (2004) How do RNA folding algorithms work? Nat Biotechnol 22:1457–1458470 Edwards TE, Klein DJ, Ferre-D’Amare AR (2007) Riboswitches: small-molecule recognition by471 gene regulatory RNAs. Curr Opin Chem Biol 17:273–279472 Flor PJ, Flanegan JB, Cech TR (1989) A conserved base pair within helix P4 of the Tetrahymena473 ribozyme helps to form the tertiary structure required for self-splicing. EMBO J 8:3391–3399474 Gherghe CM, Leonard CW, Ding F, Dokholyan NV, Weeks KM (2009) Native-like RNA tertiary475 structures using a sequence-encoded cleavage agent and refinement by discrete molecular476 dynamics. J Am Chem Soc 131:2541–2546477 Gutell RR, Lee JC, Cannone JJ (2002) The accuracy of ribosomal RNA comparative structure478 models. Curr Opin Struct Biol 12:301–310479 Gutell RR, Power A, Hertz GZ, Putz EJ, Stormo GD (1992) Identifying constraints on the higher-480 order structure of RNA: continued development and application of comparative sequence481 analysis methods. Nucleic Acids Res 20:5785–5795482 Hajdin CE, Ding F, Dokholyan NV, Weeks KM (2010) On the significance of an RNA tertiary483 structure prediction. RNA 16:1340–1349484 Hertzberg RP, Dervan PB (1982) Cleavage of double helical DNA by (Methidiumpropyl-EDTA)485 iron(II). J Am Chem Soc 104:313–315
F. Ding and N.V. Dokholyan

486Hofacker IL (2003) Vienna RNA secondary structure server. Nucleic Acids Res 31:3429–3431487Jan E, Sarnow P (2002) Factorless ribosome assembly on the internal ribosome entry site of cricket488paralysis virus. J Mol Biol 324:889–902489Jossinet F, Westhof E (2005) Sequence to Structure (S2S): display, manipulate and interconnect490RNA data from sequence to structure. Bioinformatics 21:3320–3321491Juzumiene D, Shapkina T, Kirillov S, Wollenzien P (2001) Short-range RNA-RNA crosslinking492methods to determine rRNA structure and interactions. Methods 25:333–343493Kanamori Y, Nakashima N (2001) A tertiary structure model of the internal ribosome entry site494(IRES) for methionine-independent initiation of translation. RNA 7:266–274495Khatun J, Khare SD, Dokholyan NV (2004) Can contact potentials reliably predict stability of496proteins? J Mol Biol 336:1223–1238497Khvorova A, Lescoute A, Westhof E, Jayasena SD (2003) Sequence elements outside the498hammerhead ribozyme catalytic core enable intracellular activity. Nat Struct Biol 10:708–712499Kolk MH, van der Graaf M, Fransen CT, Wijmenga SS, Pleij CW, Heus HA, Hilbers CW (1998)500Structure of the 30-hairpin of the TYMV pseudoknot: preformation in RNA folding. EMBO J50117:7498–7504502Kumar S, Bouzida D, Swendswn RH, Kollman PA, Rosenberg JM (1992) The weighted histogram503analysis method for free-energy calculations on biomolecules .1. The method. J Computat504Chem 13:11505Lavender CA, Ding F, Dokholyan NV, Weeks KM (2010) Robust and generic RNA modeling506using inferred constraints: a structure for the hepatitis C virus IRES pseudoknot domain.507Biochemistry 49:4931–4933508Major F, Gautheret D, Cedergren R (1993) Reproducing the three-dimensional structure of a tRNA509molecule from structural constraints. Proc Natl Acad Sci U S A 90:9408–9412510Major F, Turcotte M, Gautheret D, Lapalme G, Fillion E, Cedergren R (1991) The combination of511symbolic and numerical computation for three-dimensional modeling of RNA. Science512253:1255–1260513Martick M, Scott WG (2006) Tertiary contacts distant from the active site prime a ribozyme for514catalysis. Cell 126:309–320515Massire C, Jaeger L, Westhof E (1998) Derivation of the three-dimensional architecture of516bacterial ribonuclease P RNAs from comparative sequence analysis. J Mol Biol 279:773–793517Massire C, Westhof E (1998) MANIP: an interactive tool for modelling RNA. J Mol Graph Model51816(197–205):255–197519Mathews DH (2006) Revolutions in RNA secondary structure prediction. J Mol Biol 359:526–532520Mathews DH, Disney MD, Childs JL, Schroeder SJ, Zuker M, Turner DH (2004) Incorporating521chemical modification constraints into a dynamic programming algorithm for prediction of522RNA secondary structure. Proc Natl Acad Sci USA 101:7287–7292523Mathews DH, Sabina J, Zuker M, Turner DH (1999) Expanded sequence dependence of thermo-524dynamic parameters improves prediction of RNA secondary structure. J Mol Biol 288:911–940525Merino EJ, Wilkinson KA, Coughlan JL, Weeks KM (2005) RNA structure analysis at single526nucleotide resolution by selective 20-hydroxyl acylation and primer extension (SHAPE). J Am527Chem Soc 127:4223–4231528Michel F, Westhof E (1990) Modelling of the three-dimensional architecture of group I catalytic529introns based on comparative sequence analysis. J Mol Biol 216:585–610530Mortimer SA, Weeks KM (2007) A fast-acting reagent for accurate analysis of RNA secondary531and tertiary structure by SHAPE chemistry. J Am Chem Soc 129:4144–4145532Murphy FL, Cech TR (1994) GAAA tetraloop and conserved bulge stabilize tertiary structure of a533group I intron domain. J Mol Biol 236:49–63534Murray LJ, Arendall WB 3rd, Richardson DC, Richardson JS (2003) RNA backbone is rotameric.535Proc Natl Acad Sci U S A 100:13904–13909536Okamoto Y (2004) Generalized-ensemble algorithms: enhanced sampling techniques for Monte537Carlo and molecular dynamics simulations. J Mol Graph Model 22:425–439
9 Multiscale Modeling of RNA Structure and Dynamics

538 Parisien M, Cruz JA, Westhof E, Major F (2009) New metrics for comparing and assessing539 discrepancies between RNA 3D structures and models. RNA 15:1875–1885540 Parisien M, Major F (2008) The MC-Fold and MC-Sym pipeline infers RNA structure from541 sequence data. Nature 452:51–55542 Press WH, Teukolsky SA, Vetterling WT, Flannery BP (2002) Numerical Recipes in C, 2nd edn.543 Cambridge University Press, Cambridge544 Rapaport DC (2004) The art of molecular dynamics simulation. Cambridge University Press,545 Cambridge546 Rivas E, Eddy SR (1999) A dynamic programming algorithm for RNA structure prediction547 including pseudoknots. J Mol Biol 285:2053–2068548 Shapiro BA, Yingling YG, Kasprzak W, Bindewald E (2007) Bridging the gap in RNA structure549 prediction. Curr Opin Struct Biol 17:157–165550 Sorin EJ, Nakatani BJ, Rhee YM, Jayachandran G, Vishal V, Pande VS (2004) Does native state551 topology determine the RNA folding mechanism? J Mol Biol 337:789–797552 Staple DW, Butcher SE (2005) Pseudoknots: RNA structures with diverse functions. PLoS Biol 3:553 e213554 Tinoco I Jr, Bustamante C (1999) How RNA folds. J Mol Biol 293:271–281555 Tsai HY, Masquida B, Biswas R, Westhof E, Gopalan V (2003) Molecular modeling of the three-556 dimensional structure of the bacterial RNase P holoenzyme. J Mol Biol 325:661–675557 Vicens Q, Cech TR (2006) Atomic level architecture of group I introns revealed. Trends Biochem558 Sci 31:41–51559 Wang B, Wilkinson KA, Weeks KM (2008) Complex ligand-induced conformational changes in560 tRNAAsp revealed by single nucleotide resolution SHAPE chemistry. Biochemistry561 47:3454–3461562 Wang C, Le SY, Ali N, Siddiqui A (1995) An RNA pseudoknot is an essential structural element of563 the internal ribosome entry site located within the hepatitis C virus 50 noncoding region. RNA564 1:526–537565 Westhof E, Dumas P, Moras D (1988) Restrained refinement of 2 crystalline forms of yeast566 aspartic-acid and phenylalanine transfer-Rna crystals. Acta Crystallographica Sect A567 44:112–123568 White SA, Draper DE (1987) Single base bulges in small RNA hairpins enhance ethidium binding569 and promote an allosteric transition. Nucleic Acids Res 15:4049–4064570 White SA, Draper DE (1989) Effects of single-base bulges on intercalator binding to small RNA571 and DNA hairpins and a ribosomal RNA fragment. Biochemistry 28:1892–1897572 Wilkinson KA, Gorelick RJ, Vasa SM, Guex N, Rein A, Mathews DH, Giddings MC, Weeks KM573 (2008) High-throughput SHAPE analysis reveals structures in HIV-1 genomic RNA strongly574 conserved across distinct biological states. PLoS Biol 6:e96575 Wilkinson KA, Merino EJ, Weeks KM (2006) Selective 20-hydroxyl acylation analyzed by primer576 extension (SHAPE): quantitative RNA structure analysis at single nucleotide resolution. Nat577 Protocol 1:1610–1616578 Zhou R, Berne BJ, Germain R (2001) The free energy landscape for beta hairpin folding in explicit579 water. Proc Natl Acad Sci U S A 98:14931–14936580 Zhou Y, Karplus M (1997) Folding thermodynamics of a model three-helix-bundle protein. Proc581 Natl Acad Sci USA 94:14429–14432582 Ziehler WA, and Engelke DR (2001). Probing RNA structure with chemical reagents and583 enzymes. Curr Protoc Nucleic Acid Chem Chapter 6, Unit 6 1584 Zuker M (2003) Mfold web server for nucleic acid folding and hybridization prediction. Nucleic585 Acids Res 31:3406–3415
F. Ding and N.V. Dokholyan