chapter 9 financial plan - z0sqrs-a.akamaihd.net
TRANSCRIPT

Chapter 9 Financial Plan

KEY WEST INTERNATIONAL AIRPORT SEPTEMBER 2019
Master Plan Update Funding Plan [9-1]
Table of Contents
9. Funding Plan ......................................................................................................................................... 9-1
9.1 Airport Financial Structure .................................................................................................... 9-2
9.2 Capital Improvement Program – Projects and Funding Plan ............................................ 9-3 9.2.1 PROJECTS ................................................................................................................................................................... 9-3 9.2.2 CAPITAL IMPROVEMENT PROGRAM FUNDING PLAN .............................................................................. 9-7
9.3 Operating and Maintenance Expenses ............................................................................... 9-17
9.4 Airport Revenues – Non-Airline and Airline ...................................................................... 9-17 9.4.1 NON-AIRLINE REVENUES .................................................................................................................................. 9-17 9.4.2 AIRLINE REVENUES .............................................................................................................................................. 9-19
9.5 Application of Revenues and Key Financial Metrics ......................................................... 9-23
9.6 Conclusion ............................................................................................................................. 9-26
List of Tables
Table 9-1: Capital Improvement Program Estimated Costs and Annual Expenditures ............................................... 9-4
Table 9-2: Capital Improvement Program Funding Sources .................................................................................................. 9-8
Table 9-3: Projected Airport Improvement Program Entitlement Grants .......................................................................9-11
Table 9-4: Projected Passenger Facility Charge Revenues ...................................................................................................9-13
Table 9-5: Projected Amortization by Cost Center ..................................................................................................................9-15
Table 9-6: Projected Debt Service ..................................................................................................................................................9-16
Table 9-7: Projected Operating and Maintenance and Security Expenses ....................................................................9-18
Table 9-8: Projected Non-Airline Revenues ................................................................................................................................9-20
Table 9-9: Projected Terminal Rental Rates and Revenues ..................................................................................................9-21
Table 9-10: Projected Landing Fee Rates and Revenues .......................................................................................................9-22
Table 9-11: Application of Revenues .............................................................................................................................................9-24
Table 9-12: Summary of Key Financial Metrics .........................................................................................................................9-25

KEY WEST INTERNATIONAL AIRPORT SEPTEMBER 2019
Master Plan Update Funding Plan [9-1]
9. Funding Plan
This section presents a potential funding plan for implementing the CIP projects recommended in the MPU. It also assesses the ability of the County to fund the recommended projects associated with the preferred alternatives. These projects are designed to provide the required improvements and facilities at the Airport from fiscal year (FY) 2018 through FY 2035 (Planning Period).
The actual implementation schedule for the various construction projects will be influenced by demand, funding availability, the County’s priorities, and other relevant factors, and it may not correspond precisely to the schedule described in this section. For purposes of the illustrative financial analysis, a specific implementation schedule was assumed. However, it should be noted that this schedule and the resulting financial analyses are intended only to demonstrate financial feasibility. Actual funding strategies for each project will be determined at the time of project implementation.
The following actions were taken to conduct the MPU’s financial analysis:
Review the Airport’s financial structure and obtain financial information.
Compile a list of proposed capital development projects, including estimated project construction costs andconstruction start and end dates.
Identify potential funding sources; analyze the potential availability of funding from those sources, asapplicable.
Calculate debt service for projects funded, in part, with future bond proceeds.
Calculate amortization for Airport-funded projects.
Develop projections of operating and maintenance (O&M) expenses and non-airline revenues.
Calculate airline revenues and rates and charges to assess the impact of the projects on key financial metrics,such as airline rates and charges, cost per enplaned passenger (CPE), and debt service coverage.
KEY WEST INTERNATIONAL AIRPORT SEPTEMBER 2019
Master Plan Update Funding Plan [9-2]
9.1 Airport Financial Structure
The County owns and operates the Airport through the Monroe County Board of County Commissioners (BOCC) as a separate enterprise fund of the County. The BOCC manages the Airport through the County Administrator, the Senior Director of Airports, and the Assistant Director of Airports, who oversee daily operations. The Airport is not a legally separate or fiscally independent unit of the County. Therefore, it is considered a part of the County’s primary government, and it is included as such in the Monroe County Comprehensive Annual Financial Report. The County and Airport operate on a 12-month FY ending September 30.
Airline use agreements between the County and the airlines serving the Airport expired on June 30, 2000. Subsequently, it was determined that future airline rates, fees, and charges should be calculated using a compensatory cost-recovery method. This methodology calculates airline rates and charges by allocating costs from the Airport’s annual budget of costs and expenses to various functional cost centers. These costs are recovered from the users of each cost center. With this compensatory methodology of calculating rates and charges, the airlines only pay the costs associated with the space and facilities they use. In addition, without an airline use agreement, the airlines are free to enter or depart the market at will, with no residual financial obligations. The County is entitled to use non-airline revenues in the terminal and other facilities for contingencies and to further develop the Airport.
Since the airline-use agreements expired in 2000, landing fees and terminal rents at the Airport have been recalculated in consultation with the airlines serving the Airport and have been established by County ordinance annually. The most recent airline rates and charges were recalculated for FY 2018 and adopted by the County on October 18, 2017. As of FY 2018, the airlines providing scheduled service to the Airport are American Airlines, Delta Air Lines, Silver Airways, and United Airlines.
The County’s expenses and revenues are categorized into cost centers, which include areas or functional activities of the Airport that are used for the purposes of accounting for revenues, O&M expenses, contractual services for security, and debt service, as applicable. The following are the Airport’s cost centers:
Airfield: portions of the Airport provided for the landing, taking off, and taxiing of aircraft, includingrunways, taxiways, approach and runway protection zones, safety areas, infield areas, landing andnavigational aids, aircraft parking apron, and land areas required by or related to aeronautical use of theAirport
Terminal: commercial airline facilities at the Airport, including the terminal building and associated land,facilities, and equipment, whether owned, operated, or maintained by the County
General Aviation (GA): properties and areas designated for GA use
Other: all other properties and areas associated with the Airport
KEY WEST INTERNATIONAL AIRPORT SEPTEMBER 2019
Master Plan Update Funding Plan [9-3]
9.2 Capital Improvement Program – Projects and Funding Plan
The CIP presents a comprehensive list of projects identified as part of the master planning process (Master Plan Projects) and projects currently listed on the existing ACIP that are not discussed in detail in the MPU (Non–Master Plan Projects). These CIP projects address recommended improvements throughout the Planning Period. Projects are scheduled within one of three planning phases: FY 2018 through FY 2023 (short-term improvements), FY 2024 through FY 2029 (intermediate-term improvements), and FY 2030 through FY 2035 (long-term improvements).
Although projects are organized by phase, implementation of these projects may be adjusted to accommodate actual growth and demand at the Airport. Project costs were escalated to consider the effect of inflation and to consider costs related to construction, engineering, construction management/administration, and other contingencies. The costs should be considered preliminary, and it must be recognized that each project may require additional planning, environmental documentation, and/or design.
9.2.1 PROJECTS
Table 9-1 presents the estimated costs of the CIP projects expected to be implemented through FY 2035. The total estimated cost of the CIP in escalated dollars is approximately $150.6 million. Estimated costs were escalated from 2018 dollars at an annual rate of 3.0 percent, and they include construction contingencies, construction administration, and engineering/design services. For these projects, it was assumed that design would occur in one fiscal year, with construction commencing in the following fiscal year.
Recognizing the conceptual nature of a master plan, implementation of certain capital development projects would occur only after further refinement through advanced planning and programming, as well as through engineering and architectural analyses. Therefore, the estimated CIP costs developed for purposes of this funding plan must be viewed as preliminary; they reflect a master plan level of detail subject to refinement in subsequent implementation phases.
9.2.1.1 Master Plan Projects
As shown in Table 9-1, Master Plan Projects are estimated to total approximately $98.9 million. These costs are associated with landside, taxiway, support facilities, environmental documentation, apron, planning study, and terminal projects. The following are the key Master Plan Projects grouped by planning phase:
Short Term
Terminal Arrivals Curb Modifications (depicted as project LS1): This $1.4 million project consists ofimprovements to Faraldo Circle to maintain two lanes through the terminal core and eliminate the existingmerge lane.
New Access Road (listed as project LS2): This approximately $2.2 million project consists of the constructionof a new access roadway to the FBO facilities directly from S. Roosevelt Boulevard. In addition, this projecteliminates two existing access points on S. Roosevelt Boulevard and provides dedicated access to theexisting Department of Motor Vehicles from the newly constructed roadway (approximately 2,200 squareyards).

KEY WEST INTERNATIONAL AIRPORT SEPTEMBER 2019
Master Plan Update Funding Plan [9-4]
Table 9-1 (1 of 2): Capital Improvement Program Estimated Costs and Annual Expenditures
ESTIMATED ANNUAL PROJECT EXPENDITURES
SHORT-TERM INTERMEDIATE TERM LONG TERM
PROJECT ID 1/ PROJECT DESCRIPTION
TOTAL COSTS 2/ 2018 2019 2020 2021 2022 2023 2024 2025 2026 2027 2028 2029 2030 2031 2032 2033 2034 2035
Master Plan Projects
LS 1 Terminal Arrivals Curb Modifications $1,400,000 $1,400,000 $- $- $- $- $- $- $- $- $- $- $- $- $- $- $- $- $-
LS 2 New Access Road $2,200,000 $2,200,000 $- $- $- $- $- $- $- $- $- $- $- $- $- $- $- $- $-
TW 1 Taxiway A Rehabilitation, Geometry Improvements, and Lighting - Design $610,000 $610,000 $- $- $- $- $- $- $- $- $- $- $- $- $- $- $- $- $-
LS 3 Greyhound Bus Station $110,000 $- $110,000 $- $- $- $- $- $- $- $- $- $- $- $- $- $- $- $-
TW 2 Taxiway A Rehabilitation, Geometry Improvements, and Lighting - Construction $6,500,000 $- $6,500,000 $- $- $- $- $- $- $- $- $- $- $- $- $- $- $- $-
SF 1 Maintenance Building - Design and Construction $460,000 $- $460,000 $- $- $- $- $- $- $- $- $- $- $- $- $- $- $- $-
SF 2 Maintenance Building - Design and Construction $1,300,000 $- $- $1,300,000 $- $- $- $- $- $- $- $- $- $- $- $- $- $- $-
ED 1 Environmental Assessment - Taxiway A and Commercial Apron Extension $750,000 $- $750,000 $- $- $- $- $- $- $- $- $- $- $- $- $- $- $- $-
SF 3 Consolidated Maintenance Building - Construction $930,000 $- $- $- $930,000 $- $- $- $- $- $- $- $- $- $- $- $- $- $-
TW 3 Taxiway A Extension and Apron Expansion- Design and Permitting $850,000 $- $- $850,000 $- $- $- $- $- $- $- $- $- $- $- $- $- $- $-
TW 4 Taxiway A Extension and Apron Extension- Construction $10,000,000 $- $- $- $10,000,000 $- $- $- $- $- $- $- $- $- $- $- $- $- $-
AP 1 Commercial Apron Expansion - Design and Permitting $850,000 $- $- $- $850,000 $- $- $- $- $- $- $- $- $- $- $- $- $- $-
AP 2 Commercial Apron Expansion - Construction $10,000,000 $- $- $- $- $10,000,000 $- $- $- $- $- $- $- $- $- $- $- $- $-
LS 4 Public Parking Lot - Surface Lot - Design $420,000 $- $- $- $- $- $- $420,000 $- $- $- $- $- $- $- $- $- $- $-
ED 2 Environmental Documentation $240,000 $- $- $- $- $- $- $240,000 $- $- $- $- $- $- $- $- $- $- $-
LS 6 Security Screening Checkpoint Expansion $1,930,000 $- $- $- $- $- $- $1,930,000 $- $- $- $- $- $- $- $- $- $- $-
PS 7 Terminal Expansion and Renovation - Preliminary Design $1,000,000 $- $1,000,000 $- $- $- $- $- $- $- $- $- $- $- $- $- $- $- $-
LS 5 Public Parking Lot - Surface Lot - Construction $3,100,000 $- $- $- $- $- $- $- $3,100,000 $- $- $- $- $- $- $- $- $- $-
TE 5 Terminal Expansion and Renovation - Design $2,000,000 $- $- $- $- $2,000,000 $- $- $- $- $- $- $- $- $- $- $- $- $-
TE 7 Terminal Expansion and Renovation - Construction $35,000,000 $- $- $- $- $- $35,000,000 $- $- $- $- $- $- $- $- $- $- $- $-
ED 3 Environmental Assessment - Overflow Aircraft Parking Ramp Expansion (Phase 2) $700,000 $- $- $- $- $- $- $- $- $- $- $700,000 $- $- $- $- $- $- $-
AP 3 Overflow Aircraft Parking Ramp Expansion Phase 2 - Design $1,100,000 $- $- $- $- $- $- $- $- $- $- $- $1,100,000 $- $- $- $- $- $-
PS 8 Airport Master Plan Update $1,400,000 $- $- $- $- $- $- $- $- $- $- $- $1,400,000 $- $- $- $- $- $-
AP 4 Overflow Aircraft Parking Ramp Expansion Phase 2 - Construction $11,000,000 $- $- $- $- $- $- $- $- $- $- $- $- $11,000,000 $- $- $- $- $-
PS 9 Consolidate Rental Car Facilities $- $- $- $- $- $- $- $- $- $- $- $- $- $- $- $- $- $- $-
AP 6 Taxiway D Relocation $5,080,000 $- $- $- $- $- $- $- $- $- $- $- $- $- $5,080,000 $- $- $- $-
AP 7 Runway 27 Bypass Taxiway and Safety Improvements $- $- $- $- $- $- $- $- $- $- $- $- $- $- $- $- $- $- $-
Total Master Plan Projects $98,930,000 $4,210,000 $8,820,000 $2,150,000 $11,780,000 $12,000,000 $35,000,000 $2,590,000 $3,100,000 $- $- $700,000 $2,500,000 $11,000,000 $5,080,000 $- $- $- $-

KEY WEST INTERNATIONAL AIRPORT SEPTEMBER 2019
Master Plan Update Funding Plan [9-5]
Table 9-1 (2 of 2): Capital Improvement Program Estimated Costs and Annual Expenditures
ESTIMATED ANNUAL PROJECT EXPENDITURES
SHORT-TERM INTERMEDIATE TERM LONG TERM
PROJECT ID 1/ PROJECT DESCRIPTION
TOTAL COSTS 2/ 2018 2019 2020 2021 2022 2023 2024 2025 2026 2027 2028 2029 2030 2031 2032 2033 2034 2035
Non-Master Plan Projects
TE 1 Terminal Improvements - Chillers $200,000 $200,000 $- $- $- $- $- $- $- $- $- $- $- $- $- $- $- $- $-
TE 2 Terminal Restrooms and Pet Relief Design $230,000 $230,000 $- $- $- $- $- $- $- $- $- $- $- $- $- $- $- $- $-
NP 1 Noise Insulation Program - Phase 1 $6,100,000 $6,100,000 $- $- $- $- $- $- $- $- $- $- $- $- $- $- $- $- $-
TE 3 Customs Expansion (Phase 3) $4,780,000 $- $4,780,000 $- $- $- $- $- $- $- $- $- $- $- $- $- $- $- $-
SI 1 Airport Buildings and Security Improvements $460,000 $460,000 $- $- $- $- $- $- $- $- $- $- $- $- $- $- $- $- $-
SI 2 Airport Buildings and Security Improvements $500,000 $- $500,000 $- $- $- $- $- $- $- $- $- $- $- $- $- $- $- $-
SI 3 Airport Buildings and Security Improvements $300,000 $- $- $300,000 $- $- $- $- $- $- $- $- $- $- $- $- $- $- $-
SI 4 Airport Buildings and Security Improvements $300,000 $- $- $- $300,000 $- $- $- $- $- $- $- $- $- $- $- $- $- $-
SI 5 Airport Buildings and Security Improvements $300,000 $- $- $- $- $300,000 $- $- $- $- $- $- $- $- $- $- $- $- $-
SI 6 Airport Buildings and Security Improvements $300,000 $- $- $- $- $- $300,000 $- $- $- $- $- $- $- $- $- $- $- $-
NP 2 Noise Insulation Program - Phase 2 $9,200,000 $- $9,200,000 $- $- $- $- $- $- $- $- $- $- $- $- $- $- $- $-
EQ 1 Replace Existing Airport Beacon $410,000 $- $410,000 $- $- $- $- $- $- $- $- $- $- $- $- $- $- $- $-
EQ 2 Essential Airport Equipment $200,000 $- $- $200,000 $- $- $- $- $- $- $- $- $- $- $- $- $- $- $-
EQ 3 Essential Airport Equipment $300,000 $- $- $- $300,000 $- $- $- $- $- $- $- $- $- $- $- $- $- $-
EQ 4 Essential Airport Equipment $350,000 $- $- $- $- $350,000 $- $- $- $- $- $- $- $- $- $- $- $- $-
EQ 5 ARFF/Fire Support Equipment $1,000,000 $- $- $- $- $1,000,000 $- $- $- $- $- $- $- $- $- $- $- $- $-
EQ 6 Essential Airport Equipment $300,000 $- $- $- $- $- $300,000 $- $- $- $- $- $- $- $- $- $- $- $-
TE 4 Terminal Annex Modifications II & III/ Customs Upgrades (including EOC) $2,170,000 $- $2,170,000 $- $- $- $- $- $- $- $- $- $- $- $- $- $- $- $-
TE 5 Restroom Renovation and SARA $1,700,000 $- $1,700,000 $- $- $- $- $- $- $- $- $- $- $- $- $- $- $- $-
NP 3 Noise Insulation Program - Phase 3 $4,500,000 $- $- $4,500,000 $- $- $- $- $- $- $- $- $- $- $- $- $- $- $-
NP 4 Noise Insulation Program - Phase 4 $4,500,000 $- $- $- $4,500,000 $- $- $- $- $- $- $- $- $- $- $- $- $- $-
NP 5 Noise Insulation Program - Phase 5 $4,100,000 $- $- $- $- $4,100,000 $- $- $- $- $- $- $- $- $- $- $- $- $-
NP 6 Noise Insulation Program - Phase 6 $3,900,000 $- $- $- $- $- $3,900,000 $- $- $- $- $- $- $- $- $- $- $- $-
NP 7 Noise Insulation Program - Phase 7 $2,600,000 $- $- $- $- $- $- $2,600,000 $- $- $- $- $- $- $- $- $- $- $-
NP 8 Noise Insulation Program - Phase 8 $3,000,000 $- $- $- $- $- $- $- $3,000,000 $- $- $- $- $- $- $- $- $- $-
Total Non-Master Plan Projects $51,700,000 $6,990,000 $18,760,000 $5,000,000 $5,100,000 $5,750,000 $4,500,000 $2,600,000 $3,000,000 $- $- $- $- $- $- $- $- $- $-
Total CIP $150,630,000 $11,200,000 $27,580,000 $7,150,000 $16,880,000 $17,750,000 $39,500,000 $5,190,000 $6,100,000 $0 $0 $700,000 $2,500,000 $11,000,000 $5,080,000 $0 $0 $0 $0
NOTES: FY ending September 30. Numbers may not add due to rounding.
1/ LS – Landside; TE – Terminal; TW – Taxiway; NP – Noise Insulation Program; SI – Security Improvements; PS – Planning Study; EQ – Equipment; ED – Environmental Documentation; AP – Apron; AF – Airfield; GA – General Aviation; EOC – Emergency Operations Center; SF – Support Facilities; CIP – Capital Improvement Program
2/ Costs developed using 2018 U.S. dollars and have been escalated at 3 percent annually for inflation.
SOURCE: Monroe County Department of Airports, March 2019.
KEY WEST INTERNATIONAL AIRPORT SEPTEMBER 2019
Master Plan Update Funding Plan [9-6]
Taxiway A Rehabilitation, Geometry Improvements, and Lighting (listed as project TW 1-2): This $7.1 millionproject will include the design and construction of approximately 3,000 square yards of additional pavementand the removal of approximately 5,750 square yards of asphalt along Taxiway A and its associatedconnectors. This project also includes lighting and signage relocations or improvements and a rehabilitationof Taxiway A (4,750 feet by 50 feet).
Taxiway A Extension and Overflow Aircraft Parking Apron Expansion (listed as project TW 3-4): Thisapproximately $10.8 million project will include design, permitting, and construction costs. This project willextend Taxiway A to the west at the approach end of Runway 9 with the addition of approximately 3,300square yards of asphalt, including new lighting and signage. This project also includes the construction ofapproximately 5,000 square yards of ramp to provide additional aircraft parking positions. This ramp willbe used to park aircraft that cannot be accommodated on the existing apron areas.
Environmental Documentation (listed as ED 1): The project costs include the development of anEnvironmental Assessment (EA) for the Taxiway A Extension, the Commercial Apron Expansion Project, theOverflow Aircraft Parking Ramp project, and the Vehicle Service Road Relocation project.
Bus Station Relocation (depicted as project LS3): This project involves relocating the bus pickup/drop-offcurrently leased to Greyhound and associated office at the Airport.
Consolidated Maintenance Building (depicted as project SF 1-3): This project includes the consolidation ofall Airport maintenance facilities into one building, which will be constructed as an extension to the westside of the existing employee parking garage.
Commercial Apron Expansion (listed as project AP 1-2): This approximately $10.8 million project will includedesign, permitting, and construction costs. This project includes a commercial apron expansion of 13,400square yards of asphalt to the east to accommodate additional aircraft parking demand.
Terminal Expansion and Renovation (depicted as project PS 7, TE 5 and TE 7): This $38.0 million projectincludes the construction of second-floor concourse to the north of the existing terminal facility. Thisconcourse will accommodate new holdrooms, concession spaces, restrooms, and five boarding bridges, andwill connect the existing landside terminal and proposed building via the existing departure bridge. Inaddition, the existing terminal will be improved and renovated to meet forecast demand with the additionof a new baggage claim, an expanded baggage makeup area, and the creation of a turboprop holdroom.
Intermediate Term
Public Parking Facilities – Phase 1 (listed as project LS 4-5): This approximately $3.5 million project includesthe planning, design, and construction of a new public parking lot and/or garage.
Security Screening Checkpoint Expansion (depicted as project LS 6): This $1.9 million project proposes theconstruction of an 1,800-square-foot building extension to the west of the existing security checkpoint toinclude a third security screening checkpoint lane.
Airport Master Plan Update (project PS 8): This $1.4 million project will update the Airport Master Plan.
Environmental Documentation (listed as ED 2-3): The projects costs include the preparation ofenvironmental documentation for federally funded projects within the intermediate term period includingthe overflow aircraft parking ramp expansion (Phase 2).
KEY WEST INTERNATIONAL AIRPORT SEPTEMBER 2019
Master Plan Update Funding Plan [9-7]
Long Term
Overflow Aircraft Parking Ramp Expansion (Phase 2) (depicted as project AP 3-4): This $12.1 million projectconsists of the design and construction of an additional 24,000 square yards of parking apron to park, fuel,and tie-down transient and based aircraft.
Taxiway D Relocation (depicted as project AP 6): This $5 million project provides for the relocation ofTaxiway D 150 feet west to mitigate the direct access from the apron to the runway (in compliance with FAAAC 150/5300-13A).
9.2.1.2 Non–Master Plan Projects As shown in Table 9-1, Non–Master Plan Projects are estimated to total approximately $51.7 million. These projects are scheduled for the short term; however, various phases of a project may extend into the intermediate term. These costs are associated with terminal, noise insulation program, planning study, security improvements, airfield, equipment, and landside projects. Key Non–Master Plan projects include the following:
Terminal Improvements – Chillers (listed as project TE 1): The project includes the replacement of theexisting chiller system that provides air conditioning to the ticketing, passenger screening, and bag makeupspaces of the terminal building.
Restroom Renovation and Service Animal Relief Area (listed as project TE 2 and TE 5): This $1.9 millionproject includes the renovation of the existing departure hall including men’s restroom renovation, newfamily restroom, new janitor’s closet, new women’s restroom, and the addition of a new Service AnimalRelief Area (SARA). The project also includes the renovation of the adjacent departure hall associated withthe restroom renovations and a new security delivery / exit vestibule expansion.
Noise Insulation Program (Phases 1 through 8; listed as project NP 1-8): This $37.9 million project willconsist of eight phases that will be completed throughout the short term and intermediate term.
Customs Expansion (listed as project TE 3): This approximately $4.8 million project will be completed in theshort term; it includes approximately 1,900 square feet of expansion to the facility and will include additionalqueuing, restroom facilities, a gym area, and a facility generator.
Airport Buildings and Security Improvements (listed as project SI 1-6): This $2.2 million project will becompleted in the short term and will include various future Airport building and security improvements.
Essential Airport Equipment (listed as project EQ 1-6): This $2.6 million project includes the acquisition ofessential equipment for the Airport including an ARFF vehicle and a new Airport beacon.
Terminal Annex Modifications II and III / Customs Upgrades (listed as project TE 4): This approximately $2.2million project will be completed in the short term.
9.2.2 CAPITAL IMPROVEMENT PROGRAM FUNDING PLAN
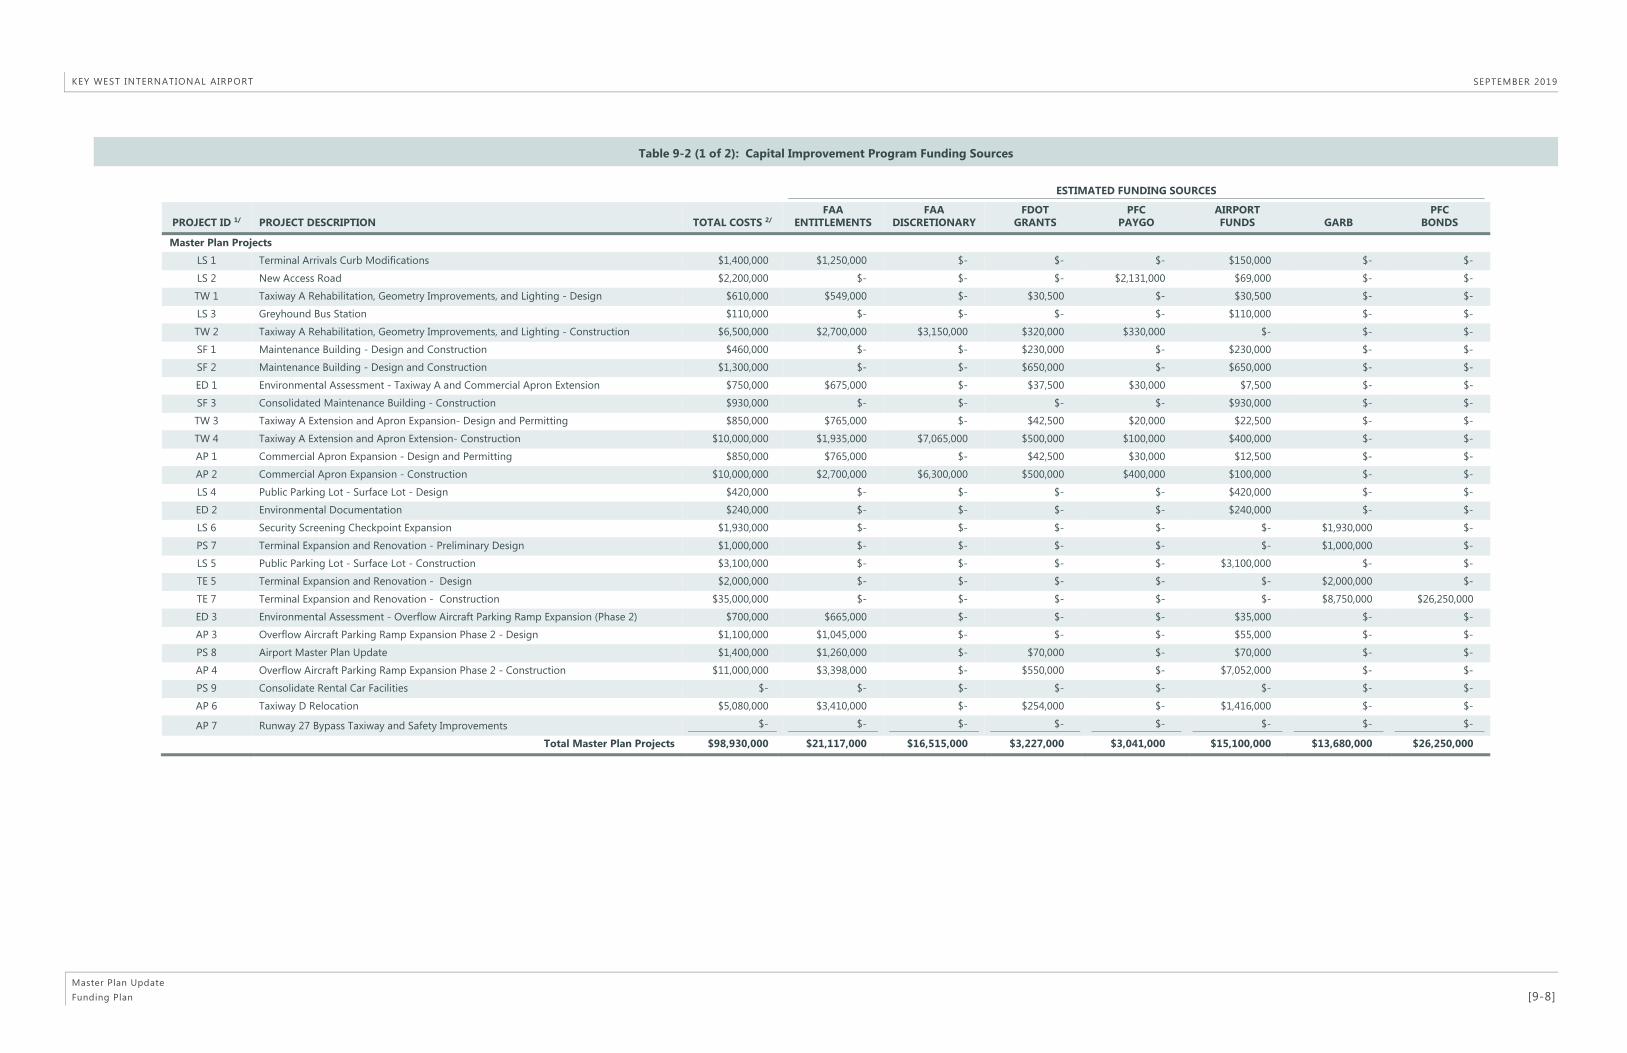
Airport development is often funded by a combination of public and private sources. Most airports similar in size to the Airport have a variety of available funding sources and mechanisms to fund capital projects. The funding plan presented herein does not represent a final plan of finance for the CIP projects. Additional actions are required prior to the use of some of these funding sources for specific projects. It was assumed that the costs of these projects will ultimately be funded by a combination of sources, such as federal AIP grants, state grants, PFC revenues, Airport funds, and proceeds from the issuance of Airport revenue bonds. Table 9-2 presents the estimated funding sources for the CIP projects. Each potential funding source is described in the following subsections.
KEY WEST INTERNATIONAL AIRPORT SEPTEMBER 2019
Master Plan Update Funding Plan [9-8]
Table 9-2 (1 of 2): Capital Improvement Program Funding Sources
ESTIMATED FUNDING SOURCES
PROJECT ID 1/ PROJECT DESCRIPTION TOTAL COSTS 2/ FAA
ENTITLEMENTS FAA
DISCRETIONARY FDOT
GRANTS PFC
PAYGO AIRPORT FUNDS GARB
PFC BONDS
Master Plan Projects
LS 1 Terminal Arrivals Curb Modifications $1,400,000 $1,250,000 $- $- $- $150,000 $- $-
LS 2 New Access Road $2,200,000 $- $- $- $2,131,000 $69,000 $- $-
TW 1 Taxiway A Rehabilitation, Geometry Improvements, and Lighting - Design $610,000 $549,000 $- $30,500 $- $30,500 $- $-
LS 3 Greyhound Bus Station $110,000 $- $- $- $- $110,000 $- $-
TW 2 Taxiway A Rehabilitation, Geometry Improvements, and Lighting - Construction $6,500,000 $2,700,000 $3,150,000 $320,000 $330,000 $- $- $-
SF 1 Maintenance Building - Design and Construction $460,000 $- $- $230,000 $- $230,000 $- $-
SF 2 Maintenance Building - Design and Construction $1,300,000 $- $- $650,000 $- $650,000 $- $-
ED 1 Environmental Assessment - Taxiway A and Commercial Apron Extension $750,000 $675,000 $- $37,500 $30,000 $7,500 $- $-
SF 3 Consolidated Maintenance Building - Construction $930,000 $- $- $- $- $930,000 $- $-
TW 3 Taxiway A Extension and Apron Expansion- Design and Permitting $850,000 $765,000 $- $42,500 $20,000 $22,500 $- $-
TW 4 Taxiway A Extension and Apron Extension- Construction $10,000,000 $1,935,000 $7,065,000 $500,000 $100,000 $400,000 $- $-
AP 1 Commercial Apron Expansion - Design and Permitting $850,000 $765,000 $- $42,500 $30,000 $12,500 $- $-
AP 2 Commercial Apron Expansion - Construction $10,000,000 $2,700,000 $6,300,000 $500,000 $400,000 $100,000 $- $-
LS 4 Public Parking Lot - Surface Lot - Design $420,000 $- $- $- $- $420,000 $- $-
ED 2 Environmental Documentation $240,000 $- $- $- $- $240,000 $- $-
LS 6 Security Screening Checkpoint Expansion $1,930,000 $- $- $- $- $- $1,930,000 $-
PS 7 Terminal Expansion and Renovation - Preliminary Design $1,000,000 $- $- $- $- $- $1,000,000 $-
LS 5 Public Parking Lot - Surface Lot - Construction $3,100,000 $- $- $- $- $3,100,000 $- $-
TE 5 Terminal Expansion and Renovation - Design $2,000,000 $- $- $- $- $- $2,000,000 $-
TE 7 Terminal Expansion and Renovation - Construction $35,000,000 $- $- $- $- $- $8,750,000 $26,250,000
ED 3 Environmental Assessment - Overflow Aircraft Parking Ramp Expansion (Phase 2) $700,000 $665,000 $- $- $- $35,000 $- $-
AP 3 Overflow Aircraft Parking Ramp Expansion Phase 2 - Design $1,100,000 $1,045,000 $- $- $- $55,000 $- $-
PS 8 Airport Master Plan Update $1,400,000 $1,260,000 $- $70,000 $- $70,000 $- $-
AP 4 Overflow Aircraft Parking Ramp Expansion Phase 2 - Construction $11,000,000 $3,398,000 $- $550,000 $- $7,052,000 $- $-
PS 9 Consolidate Rental Car Facilities $- $- $- $- $- $- $- $-
AP 6 Taxiway D Relocation $5,080,000 $3,410,000 $- $254,000 $- $1,416,000 $- $-
AP 7 Runway 27 Bypass Taxiway and Safety Improvements $- $- $- $- $- $- $- $-
Total Master Plan Projects $98,930,000 $21,117,000 $16,515,000 $3,227,000 $3,041,000 $15,100,000 $13,680,000 $26,250,000
KEY WEST INTERNATIONAL AIRPORT SEPTEMBER 2019
Master Plan Update Funding Plan [9-9]
Table 9-2 (2 of 2): Capital Improvement Program Funding Sources
ESTIMATED FUNDING SOURCES
PROJECT ID 1/ PROJECT DESCRIPTION TOTAL COSTS 2/ FAA
ENTITLEMENTS FAA
DISCRETIONARY FDOT
GRANTS PFC
PAYGO AIRPORT FUNDS GARB
PFC BONDS
Non-Master Plan Projects
TE 1 Terminal Improvements - Chillers $200,000 $- $- $- $200,000 $- $- $-
TE 2 Terminal Restrooms and Pet Relief Design $230,000 $- $- $- $225,000 $5,000 $- $-
NP 1 Noise Insulation Program - Phase 1 $6,100,000 $- $4,531,048 $- $610,000 $- $958,952 $-
TE 3 Customs Expansion (Phase 3) $4,780,000 $- $- $1,140,000 $- $- $3,640,000 $-
SI 1 Airport Buildings and Security Improvements $460,000 $- $- $230,000 $- $230,000 $- $-
SI 2 Airport Buildings and Security Improvements $500,000 $- $- $250,000 $- $- $250,000 $-
SI 3 Airport Buildings and Security Improvements $300,000 $- $- $150,000 $- $150,000 $- $-
SI 4 Airport Buildings and Security Improvements $300,000 $- $- $150,000 $- $150,000 $- $-
SI 5 Airport Buildings and Security Improvements $300,000 $- $- $150,000 $- $150,000 $- $-
SI 6 Airport Buildings and Security Improvements $300,000 $- $- $150,000 $- $150,000 $- $-
NP 2 Noise Insulation Program - Phase 2 $9,200,000 $- $8,280,000 $- $920,000 $- $- $-
EQ 1 Replace Existing Airport Beacon $410,000 $- $- $- $- $410,000 $- $-
EQ 2 Essential Airport Equipment $200,000 $- $- $100,000 $- $100,000 $- $-
EQ 3 Essential Airport Equipment $300,000 $- $- $150,000 $- $150,000 $- $-
EQ 4 Essential Airport Equipment $350,000 $- $- $175,000 $- $175,000 $- $-
EQ 5 ARFF/Fire Support Equipment $1,000,000 $- $900,000 $50,000 $- $50,000 $- $-
EQ 6 Essential Airport Equipment $300,000 $- $- $150,000 $- $150,000 $- $-
TE 4 Terminal Annex Modifications II & III/ Customs Upgrades (including EOC) $2,170,000 $- $- $1,085,000 $- $- $1,085,000 $-
TE 5 Restroom Renovation and SARA $1,700,000 $- $- $- $- $1,700,000 $- $-
NP 3 Noise Insulation Program - Phase 3 $4,500,000 $1,575,000 $2,115,000 $- $810,000 $- $- $-
NP 4 Noise Insulation Program - Phase 4 $4,500,000 $- $4,050,000 $- $410,000 $- $40,000 $-
NP 5 Noise Insulation Program - Phase 5 $4,100,000 $- $3,690,000 $- $- $- $410,000 $-
NP 6 Noise Insulation Program - Phase 6 $3,900,000 $- $3,510,000 $- $- $- $390,000 $-
NP 7 Noise Insulation Program - Phase 7 $2,600,000 $- $2,340,000 $- $- $- $260,000 $-
NP 8 Noise Insulation Program - Phase 8 $3,000,000 $- $2,700,000 $- $- $- $300,000 $-
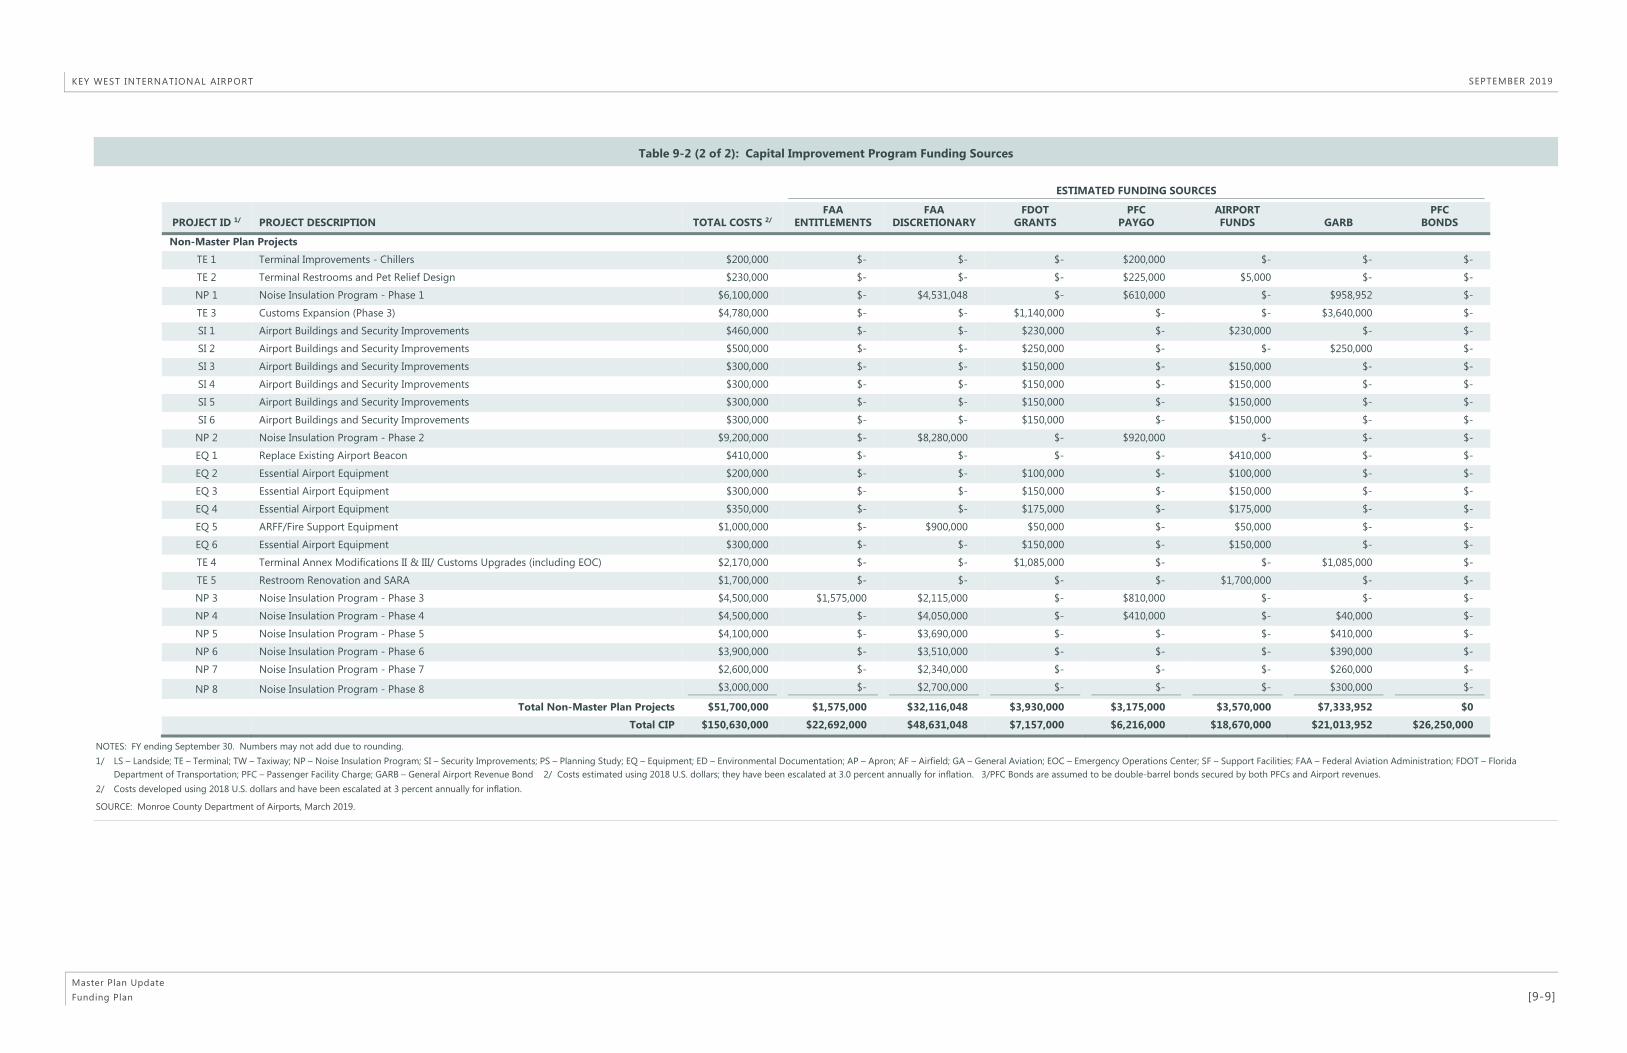
Total Non-Master Plan Projects $51,700,000 $1,575,000 $32,116,048 $3,930,000 $3,175,000 $3,570,000 $7,333,952 $0
Total CIP $150,630,000 $22,692,000 $48,631,048 $7,157,000 $6,216,000 $18,670,000 $21,013,952 $26,250,000
NOTES: FY ending September 30. Numbers may not add due to rounding. 1/ LS – Landside; TE – Terminal; TW – Taxiway; NP – Noise Insulation Program; SI – Security Improvements; PS – Planning Study; EQ – Equipment; ED – Environmental Documentation; AP – Apron; AF – Airfield; GA – General Aviation; EOC – Emergency Operations Center; SF – Support Facilities; FAA – Federal Aviation Administration; FDOT – Florida
Department of Transportation; PFC – Passenger Facility Charge; GARB – General Airport Revenue Bond 2/ Costs estimated using 2018 U.S. dollars; they have been escalated at 3.0 percent annually for inflation. 3/PFC Bonds are assumed to be double-barrel bonds secured by both PFCs and Airport revenues. 2/ Costs developed using 2018 U.S. dollars and have been escalated at 3 percent annually for inflation.
SOURCE: Monroe County Department of Airports, March 2019.

KEY WEST INTERNATIONAL AIRPORT SEPTEMBER 2019
Master Plan Update Funding Plan [9-10]
9.2.2.1 Federal Grants
The Airport and Airway Improvement Act of 1982 authorizes funding of the federal AIP from the Airport and Airway Trust Fund for nationwide airport development, airport planning, and noise compatibility planning and programs. The Airport and Airway Trust Fund is funded through user taxes on airfares, air freight, and aviation fuel.
On February 15, 2012, President Obama signed into law the FAA Modernization and Reform Act of 2012, which reauthorized FAA AIP funding for airport projects. Under this reauthorization, the AIP was extended for 4 federal fiscal years (FFY), through September 30, 2015. The authorized funding levels for AIP investment were established at approximately $3.35 billion each year. The FAA Extension, Safety, and Security Act of 2016, enacted on July 15, 2016, extended the authority and provided funding at current levels through the end of FFY 2017. The Disaster Tax Relief and Airport and Airway Extension Act of 2017, a subsequent 6-month extension, expired at the end of March 2018. Reauthorization of FAA AIP funding through FFY 2018, is included in The Consolidated Appropriations Act, 2018 (the Act), the omnibus spending bill enacted on March 23, 2018. The Act authorizes funding from the Airport and Airways Trust Fund for AIP grants-in-aid in the total amount of $3.35 billion for FFY 2018. The five-year FAA reauthorization has been passed by Congress and the legislation was sent to President Trump on October 3, 2018 for his signature. For purposes of this analysis, it was assumed that the AIP would continue to be funded throughout the Planning Period at a level of at least $3.35 billion per year.
The FAA distributes grants under the AIP to airport operators in two ways: entitlement grants and discretionary grants. Entitlement grants are distributed based on the number of enplaned passengers served at airports on an annual basis. Discretionary grants are distributed for individual projects based on funding availability and the priority of projects at airports nationwide. AIP grants may be used to fund eligible land acquisition, noise mitigation, airfield improvements, airport roadways, and safety and security systems and equipment. Generally, only those projects that do not generate revenues are eligible for AIP grant funding.
AIP grant eligibility is assumed to be 90 to 95 percent for eligible projects at non-hub airports, such as the Airport. Entitlement grants available to the Airport in any given year are established by a formula set forth in the FAA AIP Handbook.1 Entitlement grants for the Airport were projected based on the following AIP formula using the enplaned passenger forecasts developed for the financial analysis of this MPU:
$15.60 for each of the first 50,000 enplaned passengers
$10.40 for each of the next 50,000 enplaned passengers
$5.20 for each of the next 400,000 enplaned passengers
$1.30 for each of the next 500,000 enplaned passengers
$1.00 for each enplaned passenger beyond 1.0 million enplaned passengers
1 Federal Aviation Administration, Order 5100.38D, Airport Improvement Program Handbook, September 30, 2014.

KEY WEST INTERNATIONAL AIRPORT SEPTEMBER 2019
Master Plan Update Funding Plan [9-11]
For a given year, the entitlement formula is based on the numbers of enplaned passengers from two years prior. For example, when calculating entitlement grants for CY 2018, the formula applies to numbers of enplaned passengers in CY 2016. Table 9-3 presents the annual AIP entitlement grants available to fund CIP projects at the Airport through CY 2035.
Table 9-3: Projected Airport Improvement Program Entitlement Grants
FORECAST ENPLANED PASSENGERS
FISCAL YEAR FISCAL YEAR ENPLANED
PASSENGERS TOTAL AIP
ENTITLEMENT GRANTS
2018 2016 378,889 $2,750,000
2019 2017 413,608 $2,931,000
2020 2018 409,741 $2,911,000
2021 2019 420,311 $2,966,000
2022 2020 430,941 $3,021,000
2023 2021 441,535 $3,076,000
2024 2022 452,120 $3,318,000
2025 2023 462,628 $3,331,000
2026 2024 473,026 $3,345,000
2027 2025 483,393 $3,358,000
2028 2026 493,627 $3,372,000
2029 2027 503,682 $3,385,000
2030 2028 513,594 $3,398,000
2031 2029 523,389 $3,410,000
2032 2030 533,026 $3,423,000
2033 2031 542,373 $3,435,000
2034 2032 551,562 $3,447,000
2035 2033 560,643 $3,459,000
Total AIP Entitlement Grants (CY 2018 – CY 2035) $58,336,000
NOTES: Numbers may not add due to rounding.
AIP – Airport Improvement Program
SOURCE: Monroe County Department of Airports, March 2019.
As shown in Table 9-3, approximately $58.3 million of AIP entitlement grants are projected to be available for funding eligible CIP projects through CY 2035. Based on project eligibility, Table 9-2 shows the estimated uses of these projected available funds for the CIP projects, which is approximately $22.7 million through FY 2035.
Discretionary grants (annual and multiyear commitments through an FAA Letter of Intent [LOI]) are distributed by each FAA region based on availability and project priorities. Discretionary grants are generally made immediately available to fund project costs, while LOI grants are distributed to an airport sponsor over several years at defined annual funding levels. The County has received an average of $4.0 million in discretionary funding over the past five years for projects at the Airport. As shown in Table 9-2, approximately $48.6 million of AIP discretionary funds were assumed to be available to fund eligible CIP projects.
KEY WEST INTERNATIONAL AIRPORT SEPTEMBER 2019
Master Plan Update Funding Plan [9-12]
9.2.2.2 State Grants
Many states have programs to assist in airport capital development. FDOT Grants are funded from the State Transportation Trust Fund, which consists, in part, of funds collected through the state’s aviation fuel tax. FDOT Grants supplement the AIP, providing a portion of the sponsor’s matching share when federal funding is available and up to 80 percent of the overall project cost when it is not. The State of Florida frequently distributes funding awarded via FDOT Grants in a multiyear period for grant-approved projects. However, the availability of such funds in any given year is not guaranteed.
The Airport has historically received funds from FDOT. The County has received an average of approximately $1.5 million annually in FDOT Grants over the past five years to fund eligible projects at the Airport. As shown in Table 9-2, approximately $7.2 million of FDOT Grants were assumed to be available to fund eligible CIP projects.
9.2.2.3 Passenger Facility Charge Revenues
Since 1991, the collection of a PFC at the nation’s airports has been authorized under Title 14 of the Code of Federal Regulations, Part 158, and the PFC Program has been administered by the FAA. PFCs are collected from qualified passengers to fund eligible airport projects. Since April 1, 2001, a PFC of up to $4.50 per qualified enplaned passenger can be imposed by a U.S. airport operator. In 1994, the County received approval from the FAA to impose a PFC at the Airport. Currently, the County collects a $4.50 PFC (less $0.11 airline collection fee) from qualified enplaned passengers at the Airport.
PFC revenues may be used on a pay-as-you-go (PAYGO) basis or leveraged to pay debt service on bonds or other debt used to pay for PFC-eligible projects. Because airport sponsors may use PFC revenues for the local matching share of AIP grants, PFCs can help sponsors implement AIP-financed projects sooner than they would be able to do otherwise. Although the FAA is required to approve the collection of a PFC and the use of PFC revenues, the PFC Program permits local collection of PFC revenues through the airlines operating at airports, and it provides more flexibility to airport sponsors than the AIP funding. PFCs may be used for any AIP-eligible project; although, PFC eligibility is generally broader than AIP eligibility.
The FAA has approved PFC applications (and subsequent amendments) for the Airport, with a combined authority for the County to impose and use approximately $30.0 million of PFC revenues to fund completed and future improvements at the Airport. As of December 31, 2018, the County has yet to collect approximately $10.7 million of this PFC authority. For purposes of this financial analysis, it was assumed that the County will continue to apply for, collect, and use PFCs at a level of $4.50 per qualified enplaned passenger throughout the Planning Period.
Table 9-4 shows the projected PFC revenues based on the enplaned passenger forecasts. As shown, outstanding PFC authority is approximately $10.7 million for projects included in existing PFC applications. All remaining PFC revenues are available for use on CIP projects. A total of approximately $6.2 million of future CIP projects were assumed to be funded on a PAYGO basis. In addition, PFC revenues were assumed to be used to pay debt service on bonds for certain PFC-eligible projects. (See Section 9.2.2.5 for more information on this funding source.) As shown in Table 9-4, the PFC balance is adequate to fund existing and future projects through both PAYGO and PFC bond proceeds through FY 2035.

KEY WEST INTERNATIONAL AIRPORT SEPTEMBER 2019
Master Plan Update Funding Plan [9-13]
Table 9-4: Projected Passenger Facility Charge Revenues
PROJECTED
ESTIMATED 2018 2019 2020 2021 2022 2023 2024 2025 2026 2027 2028 2029 2030 2031 2032 2033 2034 2035
PFC Revenues
Enplaned Passengers 409,741 420,311 430,941 441,535 452,120 462,628 473,026 483,393 493,627 503,682 513,594 523,389 533,026 542,373 551,562 560,643 569,620 578,497
Percent PFC Eligible Enplanements 75.00% 75.00% 75.00% 75.00% 75.00% 75.00% 75.00% 75.00% 75.00% 75.00% 75.00% 75.00% 75.00% 75.00% 75.00% 75.00% 75.00% 75.00%
PFC Eligible Enplanements 307,306 315,233 323,206 331,152 339,090 346,971 354,769 362,544 370,220 377,761 385,195 392,542 399,769 406,780 413,672 420,482 427,215 433,873
PFC Administrative Fee $0.11 $0.11 $0.11 $0.11 $0.11 $0.11 $0.11 $0.11 $0.11 $0.11 $0.11 $0.11 $0.11 $0.11 $0.11 $0.11 $0.11 $0.11
PFC Amount Remitted Per Enplaned Passenger $4.39 $4.39 $4.39 $4.39 $4.39 $4.39 $4.39 $4.39 $4.39 $4.39 $4.39 $4.39 $4.39 $4.39 $4.39 $4.39 $4.39 $4.39
Total PFC Fee Per Enplaned Passenger $4.50 $4.50 $4.50 $4.50 $4.50 $4.50 $4.50 $4.50 $4.50 $4.50 $4.50 $4.50 $4.50 $4.50 $4.50 $4.50 $4.50 $4.50
Total PFC Collections $1,349,073 $1,383,873 $1,418,874 $1,453,755 $1,488,606 $1,523,204 $1,557,437 $1,591,570 $1,625,268 $1,658,372 $1,691,007 $1,723,258 $1,754,987 $1,785,764 $1,816,018 $1,845,916 $1,875,473 $1,904,700
PFC Cash Flow
Beginning Balance $6,924,885 $6,553,397 $6,213,737 $5,906,360 $5,631,407 $5,389,104 $1,980,262 $1,674,343 $1,400,110 $1,157,381 $945,814 $765,189 $615,372 $496,083 $406,618 $346,691 $316,183 $314,988
Deposit: PFC Revenue Collected $1,349,073 $1,383,873 $1,418,874 $1,453,755 $1,488,606 $1,523,204 $1,557,437 $1,591,570 $1,625,268 $1,658,372 $1,691,007 $1,723,258 $1,754,987 $1,785,764 $1,816,018 $1,845,916 $1,875,473 $1,904,700
Deposit: PFC Interest Income (0.8%) $55,399 $52,427 $49,710 $47,251 $45,051 $43,113 $15,842 $13,395 $11,201 $9,259 $7,567 $6,122 $4,923 $3,969 $3,253 $2,774 $2,529 $2,520
Transfer: Locally Paid Projects to be Reimbursed with PFCs 1/ $- $360,000 $20,000 $540,000 $400,000 $(1,320,000) $- $- $- $- $- $- $- $- $- $- $- $-
Less: Existing PAYGO 2/ $(1,775,960) $(1,775,960) $(1,775,960) $(1,775,960) $(1,775,960) $(1,775,960) $- $- $- $- $- $- $- $- $- $- $- $-
Less: Future PAYGO (Master Plan Projects) $- $(360,000) $(20,000) $(130,000) $(400,000) $- $- $- $- $- $- $- $- $- $- $- $- $-
Less: Future PAYGO (Non-Master Plan Projects) $- $- $- $(410,000) $- $- $- $- $- $- $- $- $- $- $- $- $- $-
Less: PFC Applied to Debt Service (Master Plan Projects) $- $- $- $- $- $(1,879,198) $(1,879,198) $(1,879,198) $(1,879,198) $(1,879,198) $(1,879,198) $(1,879,198) $(1,879,198) $(1,879,198) $(1,879,198) $(1,879,198) $(1,879,198) $(1,879,198)
Ending Balance $6,553,397 $6,213,737 $5,906,360 $5,631,407 $5,389,104 $1,980,262 $1,674,343 $1,400,110 $1,157,381 $945,814 $765,189 $615,372 $496,083 $406,618 $346,691 $316,183 $314,988 $343,010
NOTES: FY ending September 30. Numbers may not add due to rounding.
PFC – Passenger Facility Charge
1/ Master Plan and Non-Master Plan projects initially funded with local funds that will be reimbursed with PFCs.
2/ Remaining authority of $10,655,761 on existing PFC applications per the SOAR quarterly report as of December 31, 2018. Charge expiration date is estimated to be July 1, 2023 based on FAA approval of PFC No. 18-17-C-00-EYW.
SOURCE: Monroe County Department of Airports, March 2019.
KEY WEST INTERNATIONAL AIRPORT SEPTEMBER 2019
Master Plan Update Funding Plan [9-14]
9.2.2.4 Airport Funds Revenues remaining after the payment of O&M expenses, outstanding debt service, and transfers to other accounts, as applicable, are deposited into the County’s Airport Reserve Fund. Revenues in this fund may be used to fund capital improvement projects at the Airport. For purposes of this analysis, revenues available in the Airport Reserve Fund are identified as Airport funds and are essentially treated as cash.
As shown in Table 9-2, CIP project costs totaling approximately $18.7 million were assumed to be funded with Airport funds through the Planning Period. These funds are primarily to be used to pay remaining costs of projects after maximizing the use of AIP grants, state grants, and PFC revenues.
Airport funds expended on capital improvement projects are amortized and included in the airline rate base, as applicable.2 Table 9-5 presents projected amortization for CIP projects (Master Plan and Non–Master Plan Projects) by cost center based on the assumed use of Airport funds through FY 2035. Existing and future capital program amortization associated with the Airport’s cash expenditures were included in addition to the amortization associated with the CIP.
Amortization is a function of the cost of the project, the expected useful life of the project, and an amortization rate. Regarding useful life, CIP projects were assumed to have a useful life of either 10, 15, or 20 years, depending upon the type of project (e.g., facility, equipment, vehicle). An amortization rate of 3.0 percent was used for the duration of this funding plan. Specific Future Non-Master Plan Projects have not been identified from FY 2024 through FY 2035, however, it is reasonable to assume the County will undertake projects in those years. Therefore, amortization for Future Non-Master Plan Projects in those years has been calculated and allocated to cost centers based on a 5-year average of Non-Master Plan Projects included in the CIP projects.
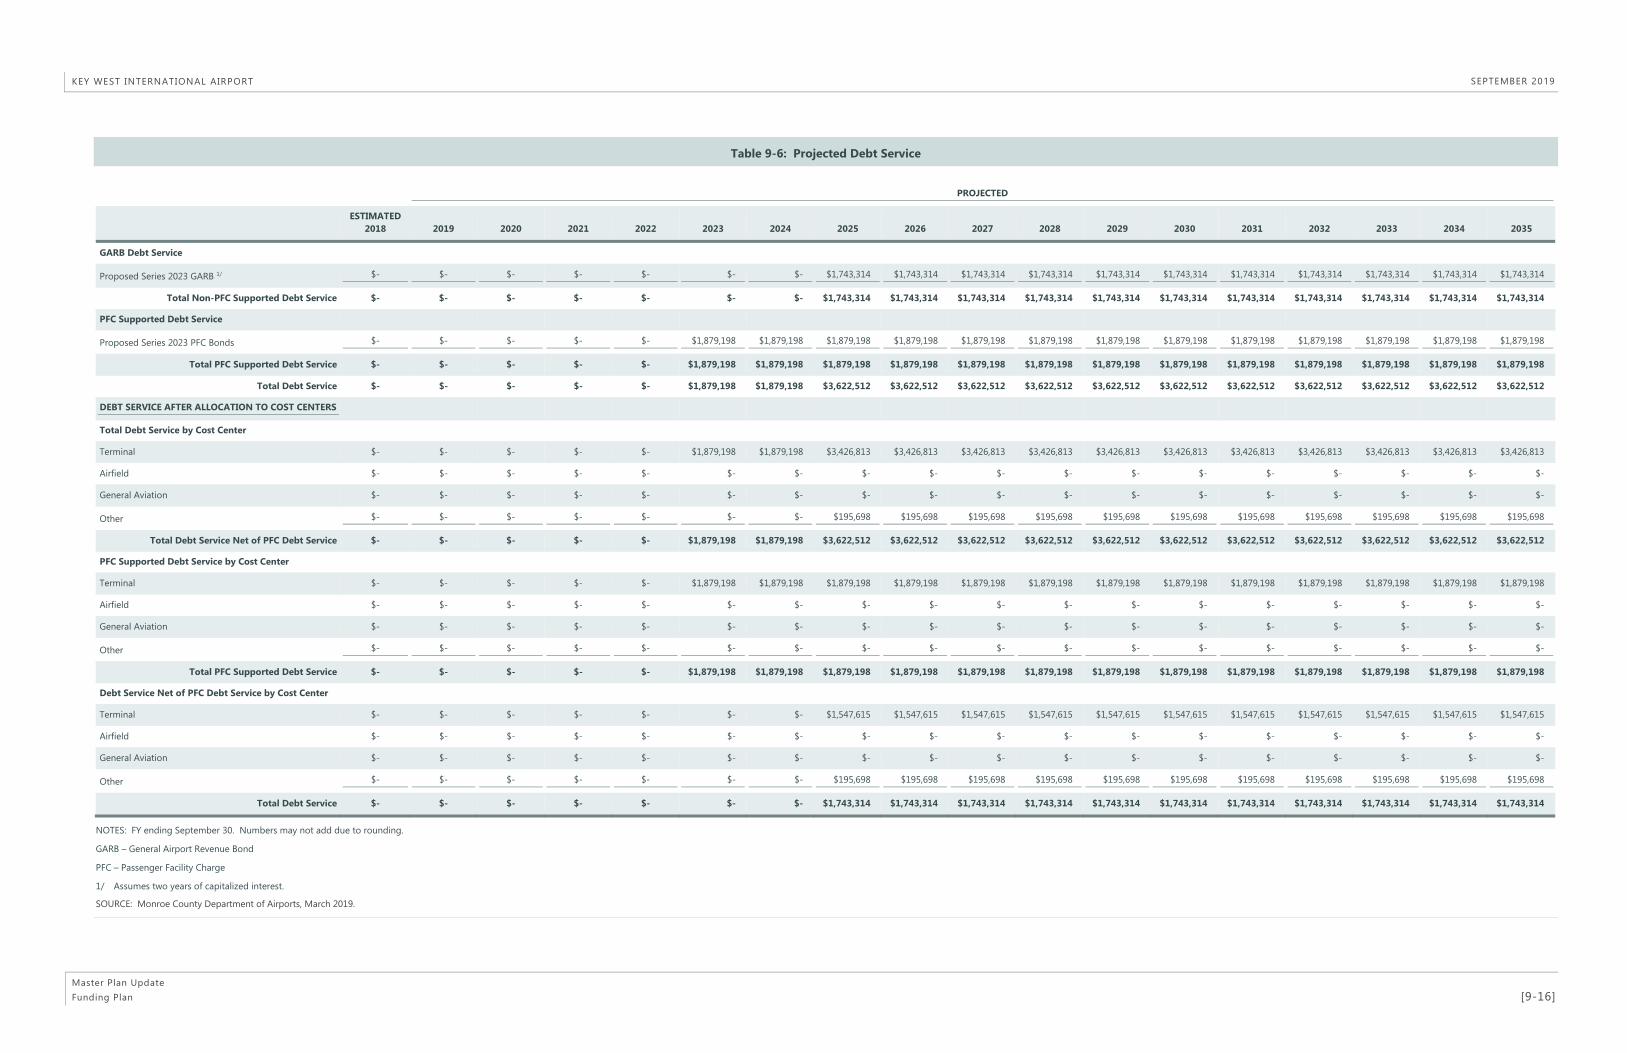
9.2.2.5 Revenue Bond Proceeds For purposes of this financial analysis and funding plan, proceeds from the issuance of General Airport Revenue Bonds (GARBs) and PFC Bonds were assumed to fund certain projects included in the CIP. As shown in Table 9-2, approximately $21.0 million of CIP project costs are assumed to be funded with GARBs, and approximately$26.3 million of CIP project costs are assumed to be funded with PFC Bonds. Table 9-6 presents projectedfuture debt service for GARBS and PFC Bonds by cost center through FY 2035. As shown, the Airport has noexisting outstanding debt service.
Future GARB debt service associated with the CIP projects was assumed for one series of GARBs; it was calculated based on an assumed interest rate of 5.0 percent, capitalized interest of 2 years, and a bond term of 30 years. The resulting annual debt service is approximately $1.7 million beginning in FY 2025 for the proposed Series 2023 Bonds.
Future PFC debt service associated with the CIP projects was assumed for one series of PFC Bonds and was calculated based on an assumed interest rate of 5.0 percent and a bond term of 30 years. The resulting annual debt service to be paid with PFC revenues is approximately $1.9 million beginning in FY 2023 for the proposed Series 2023 Bonds. 3
2 Amortization charges are the annual amount to recover capital expenditures that are paid for with Airport funds exceeding $1,000. Amortization charges are calculated based on the expected useful life of the capital expenditure, and they will include a reasonable rate of return.
3 PFC Bonds are assumed to be double-barrel bonds secured by both PFCs and Airport revenues.

KEY WEST INTERNATIONAL AIRPORT SEPTEMBER 2019
Master Plan Update Funding Plan [9-15]
Table 9-5: Projected Amortization by Cost Center
PROJECTED
ESTIMATED 2018 2019 2020 2021 2022 2023 2024 2025 2026 2027 2028 2029 2030 2031 2032 2033 2034 2035
Existing Amortization Charges by Cost Center 1/
Terminal $27,167 $20,890 $17,366 $14,494 $10,568 $5,236 $5,236 $5,236 $5,236 $5,236 $- $- $- $- $- $- $- $-
Airfield $14,039 $12,953 $9,428 $7,992 $7,253 $- $- $- $- $- $- $- $- $- $- $- $- $-
General Aviation $- $- $- $- $- $- $- $- $- $- $- $- $- $- $- $- $- $-
Other $- $- $- $- $- $- $- $- $- $- $- $- $- $- $- $- $- $-
Total Existing Amortization Charges $41,206 $33,843 $26,794 $22,486 $17,821 $5,236 $5,236 $5,236 $5,236 $5,236 $- $- $- $- $- $- $- $-
Master Plan Projects Amortization Charges by Cost Center 1/
Terminal $- $14,451 $14,451 $14,451 $14,451 $14,451 $14,451 $14,451 $14,451 $14,451 $14,451 $14,451 $14,451 $14,451 $14,451 $14,451 $- $-
Airfield $- $9,095 $10,066 $11,872 $44,972 $52,996 $52,996 $52,996 $52,996 $52,996 $52,996 $57,529 $60,971 $626,842 $740,465 $740,465 $733,817 $733,817
General Aviation $- $- $- $- $- $- $- $- $- $- $- $- $- $- $- $- $- $-
Other $- $- $26,261 $78,418 $153,044 $153,044 $153,044 $213,925 $462,677 $462,677 $462,677 $462,677 $469,421 $469,421 $469,421 $469,421 $469,421 $438,340
Total Master Plan Amortization Charges $- $23,546 $50,778 $104,741 $212,467 $220,491 $220,491 $281,372 $530,124 $530,124 $530,124 $534,657 $544,843 $1,110,714 $1,224,337 $1,224,337 $1,203,238 $1,172,157
Non-Master Plan Projects Amortization Charges by Cost Center 1/
Terminal $- $18,857 $182,639 $194,675 $206,712 $218,748 $230,784 $230,784 $230,784 $230,784 $230,784 $230,784 $230,784 $230,784 $230,784 $230,784 $230,784 $67,003
Airfield $- $- $- $- $- $22,663 $22,663 $22,663 $22,663 $22,663 $22,663 $22,663 $22,663 $22,663 $22,663 $- $- $-
General Aviation $- $- $- $- $- $- $- $- $- $- $- $- $- $- $- $- $- $-
Other $- $- $39,500 $52,451 $71,876 $78,352 $97,777 $97,777 $97,777 $97,777 $97,777 $97,777 $97,777 $84,827 $65,401 $58,926 $39,500 $-
Total Non-Master Plan Amortization Charges $- $18,857 $222,139 $247,126 $278,588 $319,763 $351,225 $351,225 $351,225 $351,225 $351,225 $351,225 $351,225 $338,275 $318,849 $289,710 $270,285 $67,003
Future Capital Program Amortization Charges by Cost Center 1/ 2/
Terminal $- $- $- $- $- $- $- $146,904 $298,215 $454,066 $614,592 $779,934 $950,236 $1,125,647 $1,306,321 $1,492,415 $1,684,091 $1,734,614
Airfield $- $- $- $- $- $- $- $4,052 $8,226 $12,525 $16,952 $21,513 $26,211 $31,049 $36,033 $41,166 $46,453 $47,846
General Aviation $- $- $- $- $- $- $- $- $- $- $- $- $- $- $- $- $- $-
Other $- $- $- $- $- $- $- $43,301 $87,900 $133,838 $181,154 $229,889 $280,086 $331,789 $385,044 $439,896 $496,393 $511,285
Total Future Amortization Charges $- $- $- $- $- $- $- $194,257 $394,341 $600,429 $812,698 $1,031,336 $1,256,533 $1,488,486 $1,727,397 $1,973,476 $2,226,937 $2,293,745
Total Amortization Charges $- $42,403 $272,917 $351,867 $491,055 $540,254 $571,716 $826,854 $1,275,691 $1,481,778 $1,694,048 $1,917,218 $2,152,601 $2,937,474 $3,270,584 $3,487,524 $3,700,460 $3,532,905
NOTES: FY ending September 30. Numbers may not add due to rounding.
1/ Projects shown to be amortized are $5,000 or more funded with local funds.
2/ Project costs and allocation to cost centers based on 5-year average of Non-Master Plan projects amortization charges.
SOURCE: Monroe County Department of Airports, March 2019.
KEY WEST INTERNATIONAL AIRPORT SEPTEMBER 2019
Master Plan Update Funding Plan [9-16]
Table 9-6: Projected Debt Service
PROJECTED
ESTIMATED 2018 2019 2020 2021 2022 2023 2024 2025 2026 2027 2028 2029 2030 2031 2032 2033 2034 2035
GARB Debt Service
Proposed Series 2023 GARB 1/ $- $- $- $- $- $- $- $1,743,314 $1,743,314 $1,743,314 $1,743,314 $1,743,314 $1,743,314 $1,743,314 $1,743,314 $1,743,314 $1,743,314 $1,743,314
Total Non-PFC Supported Debt Service $- $- $- $- $- $- $- $1,743,314 $1,743,314 $1,743,314 $1,743,314 $1,743,314 $1,743,314 $1,743,314 $1,743,314 $1,743,314 $1,743,314 $1,743,314
PFC Supported Debt Service
Proposed Series 2023 PFC Bonds $- $- $- $- $- $1,879,198 $1,879,198 $1,879,198 $1,879,198 $1,879,198 $1,879,198 $1,879,198 $1,879,198 $1,879,198 $1,879,198 $1,879,198 $1,879,198 $1,879,198
Total PFC Supported Debt Service $- $- $- $- $- $1,879,198 $1,879,198 $1,879,198 $1,879,198 $1,879,198 $1,879,198 $1,879,198 $1,879,198 $1,879,198 $1,879,198 $1,879,198 $1,879,198 $1,879,198
Total Debt Service $- $- $- $- $- $1,879,198 $1,879,198 $3,622,512 $3,622,512 $3,622,512 $3,622,512 $3,622,512 $3,622,512 $3,622,512 $3,622,512 $3,622,512 $3,622,512 $3,622,512
DEBT SERVICE AFTER ALLOCATION TO COST CENTERS
Total Debt Service by Cost Center
Terminal $- $- $- $- $- $1,879,198 $1,879,198 $3,426,813 $3,426,813 $3,426,813 $3,426,813 $3,426,813 $3,426,813 $3,426,813 $3,426,813 $3,426,813 $3,426,813 $3,426,813
Airfield $- $- $- $- $- $- $- $- $- $- $- $- $- $- $- $- $- $-
General Aviation $- $- $- $- $- $- $- $- $- $- $- $- $- $- $- $- $- $-
Other $- $- $- $- $- $- $- $195,698 $195,698 $195,698 $195,698 $195,698 $195,698 $195,698 $195,698 $195,698 $195,698 $195,698
Total Debt Service Net of PFC Debt Service $- $- $- $- $- $1,879,198 $1,879,198 $3,622,512 $3,622,512 $3,622,512 $3,622,512 $3,622,512 $3,622,512 $3,622,512 $3,622,512 $3,622,512 $3,622,512 $3,622,512
PFC Supported Debt Service by Cost Center
Terminal $- $- $- $- $- $1,879,198 $1,879,198 $1,879,198 $1,879,198 $1,879,198 $1,879,198 $1,879,198 $1,879,198 $1,879,198 $1,879,198 $1,879,198 $1,879,198 $1,879,198
Airfield $- $- $- $- $- $- $- $- $- $- $- $- $- $- $- $- $- $-
General Aviation $- $- $- $- $- $- $- $- $- $- $- $- $- $- $- $- $- $-
Other $- $- $- $- $- $- $- $- $- $- $- $- $- $- $- $- $- $-
Total PFC Supported Debt Service $- $- $- $- $- $1,879,198 $1,879,198 $1,879,198 $1,879,198 $1,879,198 $1,879,198 $1,879,198 $1,879,198 $1,879,198 $1,879,198 $1,879,198 $1,879,198 $1,879,198
Debt Service Net of PFC Debt Service by Cost Center
Terminal $- $- $- $- $- $- $- $1,547,615 $1,547,615 $1,547,615 $1,547,615 $1,547,615 $1,547,615 $1,547,615 $1,547,615 $1,547,615 $1,547,615 $1,547,615
Airfield $- $- $- $- $- $- $- $- $- $- $- $- $- $- $- $- $- $-
General Aviation $- $- $- $- $- $- $- $- $- $- $- $- $- $- $- $- $- $-
Other $- $- $- $- $- $- $- $195,698 $195,698 $195,698 $195,698 $195,698 $195,698 $195,698 $195,698 $195,698 $195,698 $195,698
Total Debt Service $- $- $- $- $- $- $- $1,743,314 $1,743,314 $1,743,314 $1,743,314 $1,743,314 $1,743,314 $1,743,314 $1,743,314 $1,743,314 $1,743,314 $1,743,314
NOTES: FY ending September 30. Numbers may not add due to rounding.
GARB – General Airport Revenue Bond
PFC – Passenger Facility Charge
1/ Assumes two years of capitalized interest.
SOURCE: Monroe County Department of Airports, March 2019.

KEY WEST INTERNATIONAL AIRPORT SEPTEMBER 2019
Master Plan Update Funding Plan [9-17]
9.3 Operating and Maintenance Expenses
O&M expenses for the Airport include the County’s costs for the operation, maintenance, and repair of the Airport, which include salaries and employee benefits, utility costs, ordinary maintenance, administrative and general expenses, and security expenses for contractual services. For purposes of calculating airline rates and charges, O&M expenses are categorized into cost centers.
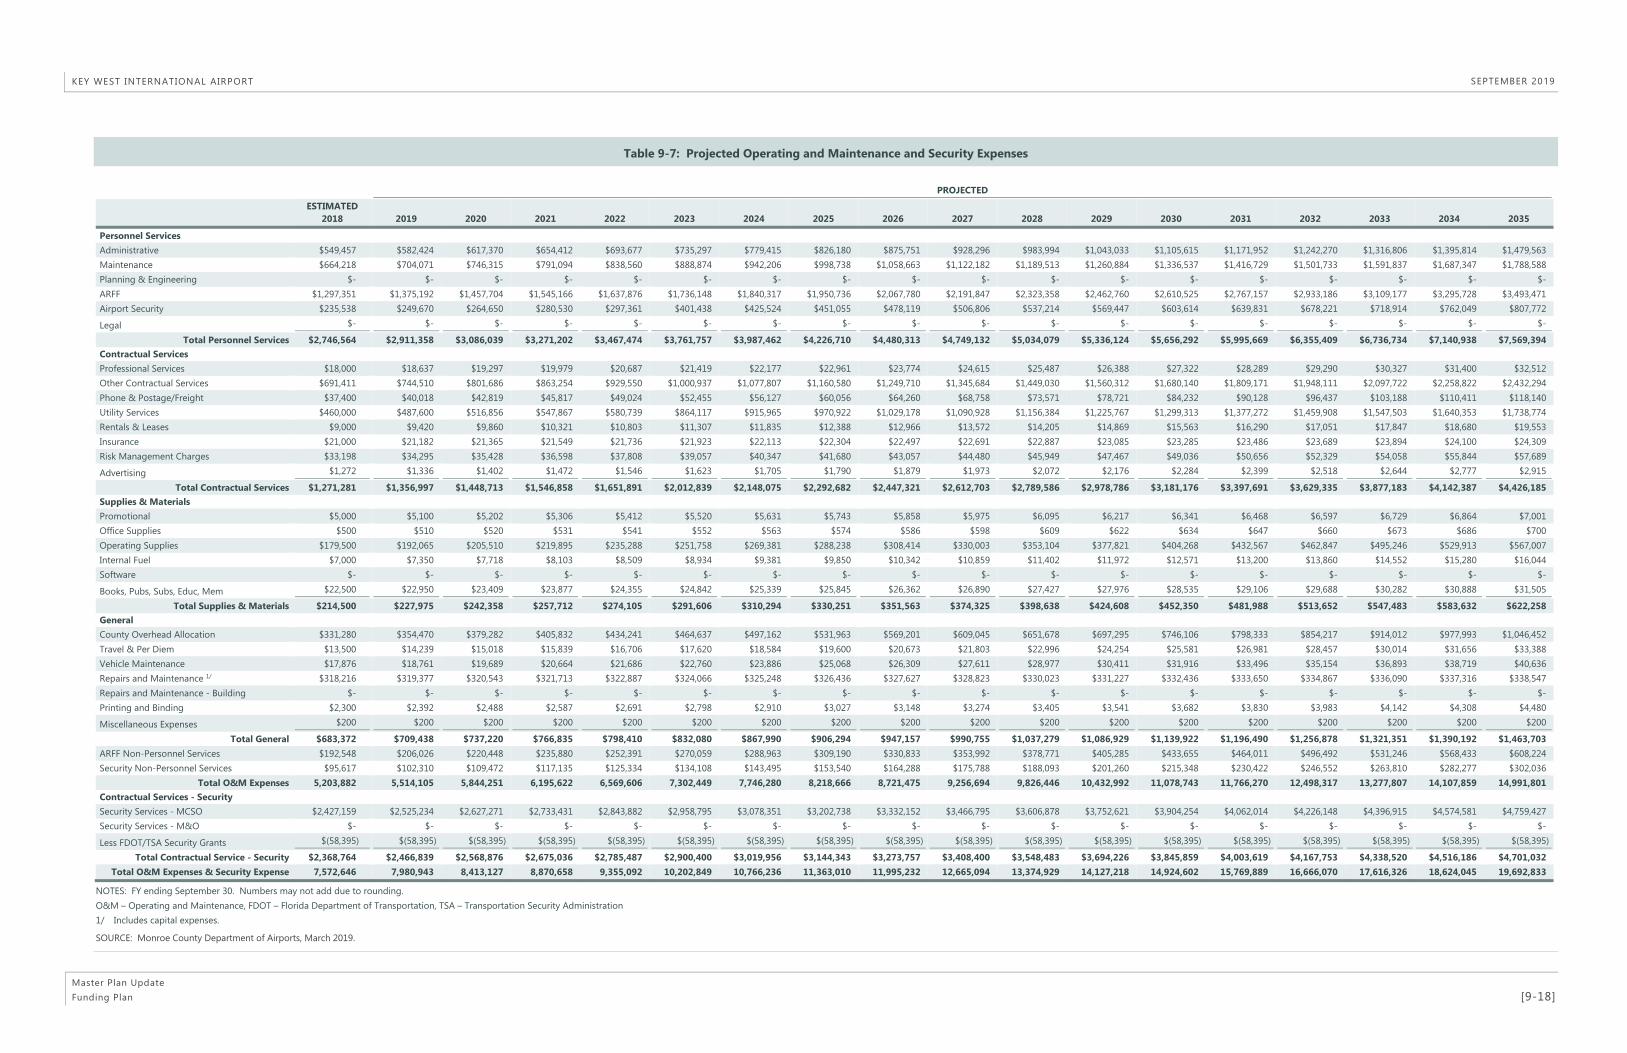
Projections of future O&M and security expenses were developed based on a review of historical/budget data, the effects of inflation, and the forecast growth in numbers of aircraft operations and enplaned passengers at the Airport. In addition, it is expected that, as certain CIP projects are completed, associated O&M and security expenses could change accordingly. For example, construction of new facilities may increase future O&M expenses, while reconstructed pavement may require less maintenance, thereby reducing future O&M expenses. Therefore, the anticipated implementation of certain terminal CIP projects were assumed to have an impact on future O&M and security expenses. Because of these CIP projects, total O&M expenses are projected to increase by an additional $6.3 million in total during the Planning Period.
Table 9-7 presents projections of O&M and security expenses for the Airport by functional area. O&M and security expenses for estimated FY 2018 are also included. As shown, total O&M and security expenses for the Airport are projected to increase from approximately $7.6 million in FY 2018 to approximately $19.7 million in FY 2035, reflecting a CAGR of 5.8 percent.
9.4 Airport Revenues – Non-Airline and Airline
9.4.1 NON-AIRLINE REVENUES
Non-airline revenues include those revenues obtained from sources other than airline rentals, fees, and charges for operating at the Airport. Projections of future non-airline revenues were developed based on a review of historical/budget data, the effects of inflation, the forecast growth in numbers of aircraft operations and enplaned passengers at the Airport, and the anticipated increases in revenue from implementation of certain CIP projects. The anticipated implementation of certain terminal, parking, and airfield CIP projects were assumed to have an impact on future non-airline revenues. Because of these CIP projects, total non-airline revenues are projected to increase by an additional $13.0 million during the Planning Period.
KEY WEST INTERNATIONAL AIRPORT SEPTEMBER 2019
Master Plan Update Funding Plan [9-18]
Table 9-7: Projected Operating and Maintenance and Security Expenses
PROJECTED
ESTIMATED 2018 2019 2020 2021 2022 2023 2024 2025 2026 2027 2028 2029 2030 2031 2032 2033 2034 2035
Personnel Services Administrative $549,457 $582,424 $617,370 $654,412 $693,677 $735,297 $779,415 $826,180 $875,751 $928,296 $983,994 $1,043,033 $1,105,615 $1,171,952 $1,242,270 $1,316,806 $1,395,814 $1,479,563 Maintenance $664,218 $704,071 $746,315 $791,094 $838,560 $888,874 $942,206 $998,738 $1,058,663 $1,122,182 $1,189,513 $1,260,884 $1,336,537 $1,416,729 $1,501,733 $1,591,837 $1,687,347 $1,788,588 Planning & Engineering $- $- $- $- $- $- $- $- $- $- $- $- $- $- $- $- $- $- ARFF $1,297,351 $1,375,192 $1,457,704 $1,545,166 $1,637,876 $1,736,148 $1,840,317 $1,950,736 $2,067,780 $2,191,847 $2,323,358 $2,462,760 $2,610,525 $2,767,157 $2,933,186 $3,109,177 $3,295,728 $3,493,471 Airport Security $235,538 $249,670 $264,650 $280,530 $297,361 $401,438 $425,524 $451,055 $478,119 $506,806 $537,214 $569,447 $603,614 $639,831 $678,221 $718,914 $762,049 $807,772
Legal $- $- $- $- $- $- $- $- $- $- $- $- $- $- $- $- $- $-
Total Personnel Services $2,746,564 $2,911,358 $3,086,039 $3,271,202 $3,467,474 $3,761,757 $3,987,462 $4,226,710 $4,480,313 $4,749,132 $5,034,079 $5,336,124 $5,656,292 $5,995,669 $6,355,409 $6,736,734 $7,140,938 $7,569,394 Contractual Services Professional Services $18,000 $18,637 $19,297 $19,979 $20,687 $21,419 $22,177 $22,961 $23,774 $24,615 $25,487 $26,388 $27,322 $28,289 $29,290 $30,327 $31,400 $32,512 Other Contractual Services $691,411 $744,510 $801,686 $863,254 $929,550 $1,000,937 $1,077,807 $1,160,580 $1,249,710 $1,345,684 $1,449,030 $1,560,312 $1,680,140 $1,809,171 $1,948,111 $2,097,722 $2,258,822 $2,432,294 Phone & Postage/Freight $37,400 $40,018 $42,819 $45,817 $49,024 $52,455 $56,127 $60,056 $64,260 $68,758 $73,571 $78,721 $84,232 $90,128 $96,437 $103,188 $110,411 $118,140 Utility Services $460,000 $487,600 $516,856 $547,867 $580,739 $864,117 $915,965 $970,922 $1,029,178 $1,090,928 $1,156,384 $1,225,767 $1,299,313 $1,377,272 $1,459,908 $1,547,503 $1,640,353 $1,738,774 Rentals & Leases $9,000 $9,420 $9,860 $10,321 $10,803 $11,307 $11,835 $12,388 $12,966 $13,572 $14,205 $14,869 $15,563 $16,290 $17,051 $17,847 $18,680 $19,553 Insurance $21,000 $21,182 $21,365 $21,549 $21,736 $21,923 $22,113 $22,304 $22,497 $22,691 $22,887 $23,085 $23,285 $23,486 $23,689 $23,894 $24,100 $24,309Risk Management Charges $33,198 $34,295 $35,428 $36,598 $37,808 $39,057 $40,347 $41,680 $43,057 $44,480 $45,949 $47,467 $49,036 $50,656 $52,329 $54,058 $55,844 $57,689
Advertising $1,272 $1,336 $1,402 $1,472 $1,546 $1,623 $1,705 $1,790 $1,879 $1,973 $2,072 $2,176 $2,284 $2,399 $2,518 $2,644 $2,777 $2,915
Total Contractual Services $1,271,281 $1,356,997 $1,448,713 $1,546,858 $1,651,891 $2,012,839 $2,148,075 $2,292,682 $2,447,321 $2,612,703 $2,789,586 $2,978,786 $3,181,176 $3,397,691 $3,629,335 $3,877,183 $4,142,387 $4,426,185 Supplies & Materials Promotional $5,000 $5,100 $5,202 $5,306 $5,412 $5,520 $5,631 $5,743 $5,858 $5,975 $6,095 $6,217 $6,341 $6,468 $6,597 $6,729 $6,864 $7,001 Office Supplies $500 $510 $520 $531 $541 $552 $563 $574 $586 $598 $609 $622 $634 $647 $660 $673 $686 $700Operating Supplies $179,500 $192,065 $205,510 $219,895 $235,288 $251,758 $269,381 $288,238 $308,414 $330,003 $353,104 $377,821 $404,268 $432,567 $462,847 $495,246 $529,913 $567,007 Internal Fuel $7,000 $7,350 $7,718 $8,103 $8,509 $8,934 $9,381 $9,850 $10,342 $10,859 $11,402 $11,972 $12,571 $13,200 $13,860 $14,552 $15,280 $16,044Software $- $- $- $- $- $- $- $- $- $- $- $- $- $- $- $- $- $-
Books, Pubs, Subs, Educ, Mem $22,500 $22,950 $23,409 $23,877 $24,355 $24,842 $25,339 $25,845 $26,362 $26,890 $27,427 $27,976 $28,535 $29,106 $29,688 $30,282 $30,888 $31,505
Total Supplies & Materials $214,500 $227,975 $242,358 $257,712 $274,105 $291,606 $310,294 $330,251 $351,563 $374,325 $398,638 $424,608 $452,350 $481,988 $513,652 $547,483 $583,632 $622,258 General County Overhead Allocation $331,280 $354,470 $379,282 $405,832 $434,241 $464,637 $497,162 $531,963 $569,201 $609,045 $651,678 $697,295 $746,106 $798,333 $854,217 $914,012 $977,993 $1,046,452 Travel & Per Diem $13,500 $14,239 $15,018 $15,839 $16,706 $17,620 $18,584 $19,600 $20,673 $21,803 $22,996 $24,254 $25,581 $26,981 $28,457 $30,014 $31,656 $33,388Vehicle Maintenance $17,876 $18,761 $19,689 $20,664 $21,686 $22,760 $23,886 $25,068 $26,309 $27,611 $28,977 $30,411 $31,916 $33,496 $35,154 $36,893 $38,719 $40,636 Repairs and Maintenance 1/ $318,216 $319,377 $320,543 $321,713 $322,887 $324,066 $325,248 $326,436 $327,627 $328,823 $330,023 $331,227 $332,436 $333,650 $334,867 $336,090 $337,316 $338,547 Repairs and Maintenance - Building $- $- $- $- $- $- $- $- $- $- $- $- $- $- $- $- $- $- Printing and Binding $2,300 $2,392 $2,488 $2,587 $2,691 $2,798 $2,910 $3,027 $3,148 $3,274 $3,405 $3,541 $3,682 $3,830 $3,983 $4,142 $4,308 $4,480
Miscellaneous Expenses $200 $200 $200 $200 $200 $200 $200 $200 $200 $200 $200 $200 $200 $200 $200 $200 $200 $200
Total General $683,372 $709,438 $737,220 $766,835 $798,410 $832,080 $867,990 $906,294 $947,157 $990,755 $1,037,279 $1,086,929 $1,139,922 $1,196,490 $1,256,878 $1,321,351 $1,390,192 $1,463,703 ARFF Non-Personnel Services $192,548 $206,026 $220,448 $235,880 $252,391 $270,059 $288,963 $309,190 $330,833 $353,992 $378,771 $405,285 $433,655 $464,011 $496,492 $531,246 $568,433 $608,224 Security Non-Personnel Services $95,617 $102,310 $109,472 $117,135 $125,334 $134,108 $143,495 $153,540 $164,288 $175,788 $188,093 $201,260 $215,348 $230,422 $246,552 $263,810 $282,277 $302,036
Total O&M Expenses 5,203,882 5,514,105 5,844,251 6,195,622 6,569,606 7,302,449 7,746,280 8,218,666 8,721,475 9,256,694 9,826,446 10,432,992 11,078,743 11,766,270 12,498,317 13,277,807 14,107,859 14,991,801 Contractual Services - Security Security Services - MCSO $2,427,159 $2,525,234 $2,627,271 $2,733,431 $2,843,882 $2,958,795 $3,078,351 $3,202,738 $3,332,152 $3,466,795 $3,606,878 $3,752,621 $3,904,254 $4,062,014 $4,226,148 $4,396,915 $4,574,581 $4,759,427 Security Services - M&O $- $- $- $- $- $- $- $- $- $- $- $- $- $- $- $- $- $-
Less FDOT/TSA Security Grants $(58,395) $(58,395) $(58,395) $(58,395) $(58,395) $(58,395) $(58,395) $(58,395) $(58,395) $(58,395) $(58,395) $(58,395) $(58,395) $(58,395) $(58,395) $(58,395) $(58,395) $(58,395)
Total Contractual Service - Security $2,368,764 $2,466,839 $2,568,876 $2,675,036 $2,785,487 $2,900,400 $3,019,956 $3,144,343 $3,273,757 $3,408,400 $3,548,483 $3,694,226 $3,845,859 $4,003,619 $4,167,753 $4,338,520 $4,516,186 $4,701,032 Total O&M Expenses & Security Expense 7,572,646 7,980,943 8,413,127 8,870,658 9,355,092 10,202,849 10,766,236 11,363,010 11,995,232 12,665,094 13,374,929 14,127,218 14,924,602 15,769,889 16,666,070 17,616,326 18,624,045 19,692,833
NOTES: FY ending September 30. Numbers may not add due to rounding. O&M – Operating and Maintenance, FDOT – Florida Department of Transportation, TSA – Transportation Security Administration 1/ Includes capital expenses.
SOURCE: Monroe County Department of Airports, March 2019.
KEY WEST INTERNATIONAL AIRPORT SEPTEMBER 2019
Master Plan Update Funding Plan [9-19]
Projections for all non-airline revenue categories were based on estimated FY 2018 financial data. Table 9-8 presents projected non-airline revenues for the Airport. Total non-airline revenues are projected to increase from approximately $3.6 million in FY 2018 to approximately $10.0 million in FY 2035, reflecting a CAGR of 6.2 percent.
9.4.2 AIRLINE REVENUES
The remaining revenues generated at the Airport include terminal rentals and landing fees, which are payable by the airlines operating at the Airport. This section summarizes the calculation of airline rates and charges for terminal rentals and landing fees, as calculated by the County in consultation with the airlines serving the Airport and established by County ordinance annually.
9.4.2.1 Terminal Rental Rates
The terminal rental rate calculation combines terminal cost center–specific O&M expenses, net contractual services for security, debt service, amortization charges, and non-amortized capital expenditures; less: credits for the departure lounge restroom. This net terminal requirement is broken out by the terminal basic O&M and capital requirement and the security component of the terminal requirement and then divided by the terminal building rentable square feet for each respective area to calculate the two terminal rental rates. The terminal rental rate for basic O&M and capital and the terminal rental rate for security are summed together to determine the average terminal rental rate.
Table 9-9 presents projected terminal rental rates and revenue at the Airport through FY 2035. As shown, the average terminal rental rate is projected to increase from $58.17 per square foot in FY 2018 to $168.36 per square foot in FY 2035. Total terminal rental revenues, as shown as Airline Requirement Occupied, are projected to increase from approximately $2.1 million in FY 2018 to approximately $7.5 million in FY 2035, reflecting a CAGR of 7.8 percent.
9.4.2.2 Landing Fee Rate
The landing fee calculation combines airfield cost center–specific O&M expenses, net contractual services for security, debt service, amortization charges, and non-amortized capital expenditures; less: GA revenues. This net airfield requirement is divided by total landed weight to determine the landing fee rate.
Table 9-10 presents projected landing fee rates and revenues at the Airport through FY 2035. As shown, the landing fee rate is projected to increase from $3.78 per 1,000-pound units of landed weight in FY 2018 to $8.83 per 1,000-pound units of landed weight in FY 2035. Total landing fee revenues are projected to increase from approximately $1.9 million in FY 2018 to approximately $6.1 million in FY 2035, reflecting a CAGR of 7.1 percent.

KEY WEST INTERNATIONAL AIRPORT SEPTEMBER 2019
Master Plan Update Funding Plan [9-20]
Table 9-8: Projected Non-Airline Revenues
PROJECTED
ESTIMATED 2018 2019 2020 2021 2022 2023 2024 2025 2026 2027 2028 2029 2030 2031 2032 2033 2034 2035
Charges for Services
Airport Parking Revenues $84,000 $86,520 $89,116 $91,789 $94,543 $97,379 $100,300 $203,610 $209,718 $216,010 $222,490 $229,165 $236,040 $243,121 $250,414 $257,927 $265,665 $273,635
Airport Security Revenues $1,350,000 $1,426,232 $1,506,768 $1,591,852 $1,681,741 $1,776,705 $1,877,032 $1,983,024 $2,095,002 $2,213,302 $2,338,283 $2,470,321 $2,609,814 $2,757,185 $2,912,878 $3,077,362 $3,251,134 $3,434,719
Other Fees 1/ $1,770,000 $1,841,279 $1,915,428 $1,992,564 $2,072,805 $2,297,370 $2,389,886 $2,486,128 $2,586,246 $2,690,395 $2,798,739 $2,911,446 $3,028,691 $3,150,658 $3,277,537 $3,409,525 $3,546,829 $3,689,662
Svc-Arprt -Pkg-Cre $355,000 $383,400 $414,072 $447,198 $482,974 $521,611 $563,340 $1,171,748 $1,265,488 $1,366,727 $1,476,065 $1,594,150 $1,721,682 $1,859,417 $2,008,170 $2,168,824 $2,342,330 $2,529,716
Total Charges for Services $3,559,000 $3,737,431 $3,925,384 $4,123,403 $4,332,062 $4,693,065 $4,930,559 $5,844,510 $6,156,453 $6,486,434 $6,835,576 $7,205,081 $7,596,228 $8,010,381 $8,448,999 $8,913,638 $9,405,957 $9,927,731
Other Revenues
Parking Violations $600 $600 $600 $600 $600 $600 $600 $600 $600 $600 $600 $600 $600 $600 $600 $600 $600 $600
Interest Earnings $20,000 $21,600 $23,328 $25,194 $27,210 $29,387 $31,737 $34,276 $37,019 $39,980 $43,178 $46,633 $50,363 $54,392 $58,744 $63,443 $68,519 $74,000
Miscellaneous Commissions $- $- $- $- $- $- $- $- $- $- $- $- $- $- $- $- $- $-
Total Other Revenues $20,600 $22,200 $23,928 $25,794 $27,810 $29,987 $32,337 $34,876 $37,619 $40,580 $43,778 $47,233 $50,963 $54,992 $59,344 $64,043 $69,119 $74,600
Total Non-Airline Revenues 3,579,600 3,759,631 3,949,312 4,149,197 4,359,872 4,723,052 4,962,896 5,879,387 6,194,072 6,527,014 6,879,355 7,252,314 7,647,191 8,065,374 8,508,343 8,977,681 9,475,076 10,002,332
NOTES: FY ending September 30. Numbers may not add due to rounding.
1/ Other Fees include concession revenues, ground transportation fees, rental car commission, fuel flowage fees, and utility reimbursement.
SOURCE: Monroe County Department of Airports, March 2019.

KEY WEST INTERNATIONAL AIRPORT SEPTEMBER 2019
Master Plan Update Funding Plan [9-21]
Table 9-9: Projected Terminal Rental Rates and Revenues
PROJECTED
ESTIMATED 2018 2019 2020 2021 2022 2023 2024 2025 2026 2027 2028 2029 2030 2031 2032 2033 2034 2035
Terminal O&M Expense
Personal Services $764,366 $810,228 $858,842 $910,372 $964,994 $1,057,388 $1,120,831 $1,188,081 $1,259,366 $1,334,928 $1,415,024 $1,499,925 $1,589,921 $1,685,316 $1,786,435 $1,893,621 $2,007,238 $2,127,672
Contractual Services-Non Security $817,718 $871,774 $929,541 $991,278 $1,057,264 $1,323,491 $1,410,633 $1,503,691 $1,603,072 $1,709,216 $1,822,592 $1,943,701 $2,073,082 $2,211,311 $2,359,003 $2,516,818 $2,685,464 $2,865,697
Supplies & Materials $128,700 $136,785 $145,415 $154,627 $164,463 $174,964 $186,177 $198,150 $210,938 $224,595 $239,183 $254,765 $271,410 $289,193 $308,191 $328,490 $350,179 $373,355
General $253,663 $265,977 $279,126 $293,167 $308,163 $324,179 $341,288 $359,564 $379,089 $399,950 $422,239 $446,056 $471,507 $498,706 $527,774 $558,841 $592,046 $627,539
ARFF Non-Personnel Services O&M Expense $19,255 $20,603 $22,045 $23,588 $25,239 $27,006 $28,896 $30,919 $33,083 $35,399 $37,877 $40,529 $43,365 $46,401 $49,649 $53,125 $56,843 $60,822
Security Services Non-Personnel Services O&M Expense $71,713 $76,733 $82,104 $87,851 $94,001 $100,581 $107,622 $115,155 $123,216 $131,841 $141,070 $150,945 $161,511 $172,817 $184,914 $197,858 $211,708 $226,527
Subtotal Terminal - Basic O&M Expense $2,058,360 $2,182,099 $2,317,072 $2,460,883 $2,614,123 $3,007,609 $3,195,447 $3,395,560 $3,608,764 $3,835,929 $4,077,984 $4,335,920 $4,610,796 $4,903,743 $5,215,965 $5,548,752 $5,903,478 $6,281,613
Less: 10% Departure Lounge Restroom Credit $(2,839) $(3,010) $(3,196) $(3,394) $(3,606) $(4,148) $(4,407) $(4,683) $(4,977) $(5,291) $(5,625) $(5,980) $(6,359) $(6,764) $(7,194) $(7,653) $(8,142) $(8,664)
Net Terminal Basic O&M Expense $2,055,521 $2,179,090 $2,313,876 $2,457,489 $2,610,518 $3,003,460 $3,191,040 $3,390,877 $3,603,787 $3,830,639 $4,072,360 $4,329,940 $4,604,437 $4,896,979 $5,208,771 $5,541,099 $5,895,336 $6,272,949
Net Contractual Services - Security $1,422,741 $1,471,083 $1,536,678 $1,605,037 $1,676,275 $1,750,513 $1,827,874 $1,908,490 $1,992,495 $2,080,030 $2,171,243 $2,266,285 $2,365,316 $2,468,501 $2,576,013 $2,688,032 $2,804,744 $2,926,345
Net Terminal O&M Expense $3,478,262 $3,650,173 $3,850,554 $4,062,526 $4,286,793 $4,753,973 $5,018,914 $5,299,367 $5,596,282 $5,910,669 $6,243,602 $6,596,225 $6,969,753 $7,365,480 $7,784,784 $8,229,131 $8,700,080 $9,199,294
Terminal Capital Expense
Future Debt Service (Master Plan Projects) $- $- $- $- $- $- $- $1,547,615 $1,547,615 $1,547,615 $1,547,615 $1,547,615 $1,547,615 $1,547,615 $1,547,615 $1,547,615 $1,547,615 $1,547,615
Future Debt Service (Non-Master Plan Projects) $- $- $- $- $- $- $- $- $- $- $- $- $- $- $- $- $- $-
Existing Amortization $27,167 $20,890 $17,366 $14,494 $10,568 $5,236 $5,236 $5,236 $5,236 $5,236 $- $- $- $- $- $- $- $-
Future Amortization $- $- $- $- $- $- $- $146,904 $298,215 $454,066 $614,592 $779,934 $950,236 $1,125,647 $1,306,321 $1,492,415 $1,684,091 $1,734,614
Amortization for Master Plan Projects $- $14,451 $14,451 $14,451 $14,451 $14,451 $14,451 $14,451 $14,451 $14,451 $14,451 $14,451 $14,451 $14,451 $14,451 $14,451 $- $-
Amortization for Non-Master Plan Projects $- $18,857 $182,639 $194,675 $206,712 $218,748 $230,784 $230,784 $230,784 $230,784 $230,784 $230,784 $230,784 $230,784 $230,784 $230,784 $230,784 $67,003
Capital Expense $387 $500 $500 $500 $500 $500 $500 $500 $500 $500 $500 $500 $500 $500 $500 $500 $500 $500
Total Terminal Capital Expense $27,554 $54,699 $214,956 $224,120 $232,231 $238,936 $250,972 $1,945,492 $2,096,803 $2,252,654 $2,407,943 $2,573,285 $2,743,587 $2,918,999 $3,099,672 $3,285,766 $3,462,991 $3,349,732
Terminal Requirement $3,505,816 $3,704,871 $4,065,510 $4,286,646 $4,519,024 $4,992,909 $5,269,886 $7,244,859 $7,693,085 $8,163,323 $8,651,546 $9,169,510 $9,713,340 $10,284,479 $10,884,456 $11,514,897 $12,163,072 $12,549,026
Terminal Rent Calculation
Terminal Basic O&M and Capital Requirement $2,083,075 $2,233,788 $2,528,832 $2,681,610 $2,842,749 $3,242,396 $3,442,012 $5,336,369 $5,700,590 $6,083,292 $6,480,303 $6,903,225 $7,348,024 $7,815,978 $8,308,443 $8,826,865 $9,358,327 $9,622,681
Total Terminal Productive Space (square feet) 1/ 60,271 60,271 60,271 60,271 60,271 74,538 74,538 74,538 74,538 74,538 74,538 74,538 74,538 74,538 74,538 74,538 74,538 74,538
Terminal Rental Rate - Basic O&M $34.56 $37.06 $41.96 $44.49 $47.17 $43.50 $46.18 $71.59 $76.48 $81.61 $86.94 $92.61 $98.58 $104.86 $111.47 $118.42 $125.55 $129.10
Security Component - Terminal Requirement $1,422,741 $1,471,083 $1,536,678 $1,605,037 $1,676,275 $1,750,513 $1,827,874 $1,908,490 $1,992,495 $2,080,030 $2,171,243 $2,266,285 $2,365,316 $2,468,501 $2,576,013 $2,688,032 $2,804,744 $2,926,345
Total Terminal Productive Space (square feet) 1/ 60,271 60,271 60,271 60,271 60,271 74,538 74,538 74,538 74,538 74,538 74,538 74,538 74,538 74,538 74,538 74,538 74,538 74,538
Terminal Rental Rate - Security $23.61 $24.41 $25.50 $26.63 $27.81 $23.48 $24.52 $25.60 $26.73 $27.91 $29.13 $30.40 $31.73 $33.12 $34.56 $36.06 $37.63 $39.26
Average Terminal Rental Rate (square feet) $58.17 $61.47 $67.45 $71.12 $74.98 $66.98 $70.70 $97.20 $103.21 $109.52 $116.07 $123.02 $130.31 $137.98 $146.03 $154.48 $163.18 $168.36
Airline Space Rental
Airline Space Occupied (square feet) 36,185 36,185 36,185 36,185 36,185 44,751 44,751 44,751 44,751 44,751 44,751 44,751 44,751 44,751 44,751 44,751 44,751 44,751
Airline Space Vacant (square feet) 2,768 2,768 2,768 2,768 2,768 2,768 2,768 2,768 2,768 2,768 2,768 2,768 2,768 2,768 2,768 2,768 2,768 2,768
Airline Space Total (square feet) 38,953 38,953 38,953 38,953 38,953 47,519 47,519 47,519 47,519 47,519 47,519 47,519 47,519 47,519 47,519 47,519 47,519 47,519
Airline Requirement Occupied (square feet) $2,104,793 $2,224,300 $2,440,817 $2,573,581 $2,713,094 $2,997,601 $3,163,890 $4,349,608 $4,618,710 $4,901,027 $5,194,143 $5,505,114 $5,831,614 $6,174,509 $6,534,719 $6,913,218 $7,302,363 $7,534,079
Airline Requirement Vacant (square feet) $161,008 $170,150 $186,712 $196,868 $207,540 $185,413 $195,699 $269,040 $285,685 $303,148 $321,278 $340,513 $360,708 $381,917 $404,198 $427,609 $451,679 $466,012
Airline Requirement $2,265,800 $2,394,449 $2,627,529 $2,770,449 $2,920,634 $3,183,014 $3,359,589 $4,618,648 $4,904,395 $5,204,175 $5,515,421 $5,845,626 $6,192,322 $6,556,427 $6,938,917 $7,340,827 $7,754,043 $8,000,091
NOTES: FY ending September 30. Numbers may not add due to rounding.
O&M – Operating and Maintenance, ARFF – Aircraft Rescue and Firefighting
1/ Total Terminal Productive Space reflects terminal building rentable space.
SOURCE: Monroe County Department of Airports, March 2019.

KEY WEST INTERNATIONAL AIRPORT SEPTEMBER 2019
Master Plan Update Funding Plan [9-22]
Table 9-10: Projected Landing Fee Rates and Revenues
PROJECTED
ESTIMATED 2018 2019 2020 2021 2022 2023 2024 2025 2026 2027 2028 2029 2030 2031 2032 2033 2034 2035
Airfield O&M Expense
Personal Services $1,378,750 $1,461,475 $1,549,164 $1,642,113 $1,740,640 $1,870,949 $1,983,206 $2,102,198 $2,228,330 $2,362,030 $2,503,752 $2,653,977 $2,813,216 $2,982,008 $3,160,929 $3,350,585 $3,551,620 $3,764,717
Contractual Services $117,372 $125,448 $134,097 $143,361 $153,283 $185,288 $197,957 $211,516 $226,027 $241,559 $258,185 $275,982 $295,035 $315,434 $337,275 $360,661 $385,704 $412,522
Supplies & Materials $21,450 $22,798 $24,236 $25,771 $27,410 $29,161 $31,029 $33,025 $35,156 $37,433 $39,864 $42,461 $45,235 $48,199 $51,365 $54,748 $58,363 $62,226
General $170,843 $177,360 $184,305 $191,709 $199,603 $208,020 $216,998 $226,573 $236,789 $247,689 $259,320 $271,732 $284,981 $299,122 $314,219 $330,338 $347,548 $365,926
ARFF Non-Personal Services O&M Expense $154,038 $164,821 $176,359 $188,704 $201,913 $216,047 $231,170 $247,352 $264,667 $283,193 $303,017 $324,228 $346,924 $371,209 $397,193 $424,997 $454,747 $486,579
Security Services Non-Personal Services O&M Expense $9,562 $10,231 $10,947 $11,713 $12,533 $13,411 $14,350 $15,354 $16,429 $17,579 $18,809 $20,126 $21,535 $23,042 $24,655 $26,381 $28,228 $30,204
Subtotal Airfield - Basic O&M Expense $1,853,574 $1,962,132 $2,079,107 $2,203,371 $2,335,383 $2,522,876 $2,674,710 $2,836,019 $3,007,398 $3,189,482 $3,382,946 $3,588,506 $3,806,925 $4,039,014 $4,285,637 $4,547,710 $4,826,209 $5,122,173
Net Contractual Services - Security $236,876 $252,523 $262,727 $273,343 $284,388 $295,879 $307,835 $320,274 $333,215 $346,679 $360,688 $375,262 $390,425 $406,201 $422,615 $439,691 $457,458 $475,943
Net Airfield O&M Expense $2,090,450 $2,214,656 $2,341,834 $2,476,714 $2,619,771 $2,818,755 $2,982,545 $3,156,293 $3,340,613 $3,536,162 $3,743,634 $3,963,768 $4,197,351 $4,445,216 $4,708,252 $4,987,401 $5,283,667 $5,598,116
Airfield Capital Expense
Future Debt Service (Master Plan Projects) $- $- $- $- $- $- $- $- $- $- $- $- $- $- $- $- $- $-
Future Debt Service (Non-Master Plan Projects) $- $- $- $- $- $- $- $- $- $- $- $- $- $- $- $- $- $-
Existing Amortization $14,039 $12,953 $9,428 $7,992 $7,253 $- $- $- $- $- $- $- $- $- $- $- $- $-
Future Amortization $- $- $- $- $- $- $- $4,052 $8,226 $12,525 $16,952 $21,513 $26,211 $31,049 $36,033 $41,166 $46,453 $47,846
Amortization on Master Plan Projects $- $9,095 $10,066 $11,872 $44,972 $52,996 $52,996 $52,996 $52,996 $52,996 $52,996 $57,529 $60,971 $626,842 $740,465 $740,465 $733,817 $733,817
Amortization on Non-Master Plan Projects $- $- $- $- $- $22,663 $22,663 $22,663 $22,663 $22,663 $22,663 $22,663 $22,663 $22,663 $22,663 $- $- $-
Capital Expense $3,098 $500 $500 $500 $500 $500 $500 $500 $500 $500 $500 $500 $500 $500 $500 $500 $500 $500
Total Airfield Capital Expense $17,137 $22,548 $19,994 $20,364 $52,725 $76,159 $76,159 $80,211 $84,385 $88,684 $93,112 $102,205 $110,345 $681,054 $799,661 $782,131 $780,770 $782,164
Total Airfield Requirement $2,107,587 $2,237,203 $2,361,829 $2,497,078 $2,672,496 $2,894,915 $3,058,704 $3,236,504 $3,424,999 $3,624,846 $3,836,746 $4,065,973 $4,307,695 $5,126,270 $5,507,913 $5,769,532 $6,064,438 $6,380,280
Less: Estimated General Aviation Revenue $(221,824) $(228,479) $(235,333) $(242,393) $(249,665) $(257,155) $(264,869) $(272,816) $(281,000) $(289,430) $(228,479) $(235,333) $(242,393) $(249,665) $(257,155) $(264,869) $(272,816) $(281,000)
Airfield Requirement $1,885,763 $2,008,725 $2,126,496 $2,254,685 $2,422,831 $2,637,760 $2,793,835 $2,963,688 $3,143,998 $3,335,416 $3,608,267 $3,830,640 $4,065,302 $4,876,605 $5,250,758 $5,504,663 $5,791,622 $6,099,280
Landing Fee Calculation
Passenger Airline Landed Weight (thousand pounds) 493,261 500,198 513,341 520,646 533,929 545,176 552,689 565,992 579,194 592,252 602,913 613,765 624,813 636,059 647,508 659,164 671,029 683,107
Cargo Airline Landed Weight (thousand pounds) 5,781 5,862 6,016 6,102 6,258 6,389 6,478 6,633 6,788 6,941 7,066 7,193 7,323 7,455 7,589 7,725 7,864 8,006
Total Airline Landed Weight (thousand pounds) 499,042 506,061 519,357 526,748 540,187 551,566 559,167 572,625 585,982 599,193 609,979 620,958 632,136 643,514 655,097 666,889 678,893 691,113
Airline Landing Fee Rate $3.78 $3.97 $4.09 $4.28 $4.49 $4.78 $5.00 $5.18 $5.37 $5.57 $5.92 $6.17 $6.43 $7.58 $8.02 $8.25 $8.53 $8.83
Passenger Landing Fees $1,863,918 $1,985,455 $2,101,862 $2,228,566 $2,394,764 $2,607,203 $2,761,471 $2,929,356 $3,107,578 $3,296,778 $3,566,468 $3,786,265 $4,018,209 $4,820,113 $5,189,932 $5,440,895 $5,724,530 $6,028,624
Cargo Landing Fees $21,845 $23,270 $24,634 $26,119 $28,067 $30,556 $32,364 $34,332 $36,421 $38,638 $41,799 $44,375 $47,093 $56,492 $60,826 $63,767 $67,092 $70,656
Total Landing Fees $1,885,763 $2,008,725 $2,126,496 $2,254,685 $2,422,831 $2,637,760 $2,793,835 $2,963,688 $3,143,998 $3,335,416 $3,608,267 $3,830,640 $4,065,302 $4,876,605 $5,250,758 $5,504,663 $5,791,622 $6,099,280
NOTES: FY ending September 30. Numbers may not add due to rounding.
O&M – Operating and Maintenance, ARFF – Aircraft Rescue and Firefighting
SOURCE: Monroe County Department of Airports, March 2019.
KEY WEST INTERNATIONAL AIRPORT SEPTEMBER 2019
Master Plan Update Funding Plan [9-23]
9.5 Application of Revenues and Key Financial Metrics
Airport revenues will be deposited into the Revenue Fund and applied to the following funds and accounts in the following order of priority:
Operating, Maintenance, and Administrative Fund: To pay operation and maintenance expenses forcost-center-specific items.
Debt Service Fund: To pay debt service on any bonds, notes, or debt instruments that may be issued bythe County to fund Airport capital improvements.
Debt Service Reserve Fund: To fund or restore the debt service fund established in support of any bonds,notes, or debt instruments.
Airport Reserve Fund: All remaining revenues are to be deposited into the Airport Reserve Fund to paythe net costs of Airport capital improvements.
Table 9-11 presents the application of revenues. The table shows the deposits to the Airport Reserve Fund, as well as withdrawals from the fund to pay capital project costs. Each year, the County intends to maintain a minimum balance equivalent to three months of annual O&M expenses in the Airport Reserve Fund.
Table 9-12 summarizes the airline rentals, fees, and charges, as well as the projected CPE and debt service coverage. Airline CPE is projected to increase from $10.55 in FY 2018 to $24.66 in FY 2035, reflecting a CAGR of 5.1 percent. Net revenues are projected to be sufficient to pay the assumed debt service associated with future bonds issued to fund portions of the CIP projects. Debt service coverage ratios range from a high of 4.96 times in FY 2035 to a low of 2.85 times in FY 2025. Since the County does not have any existing outstanding debt service, a minimum coverage ratio of 1.25 times debt service is assumed in accordance with industry standards.
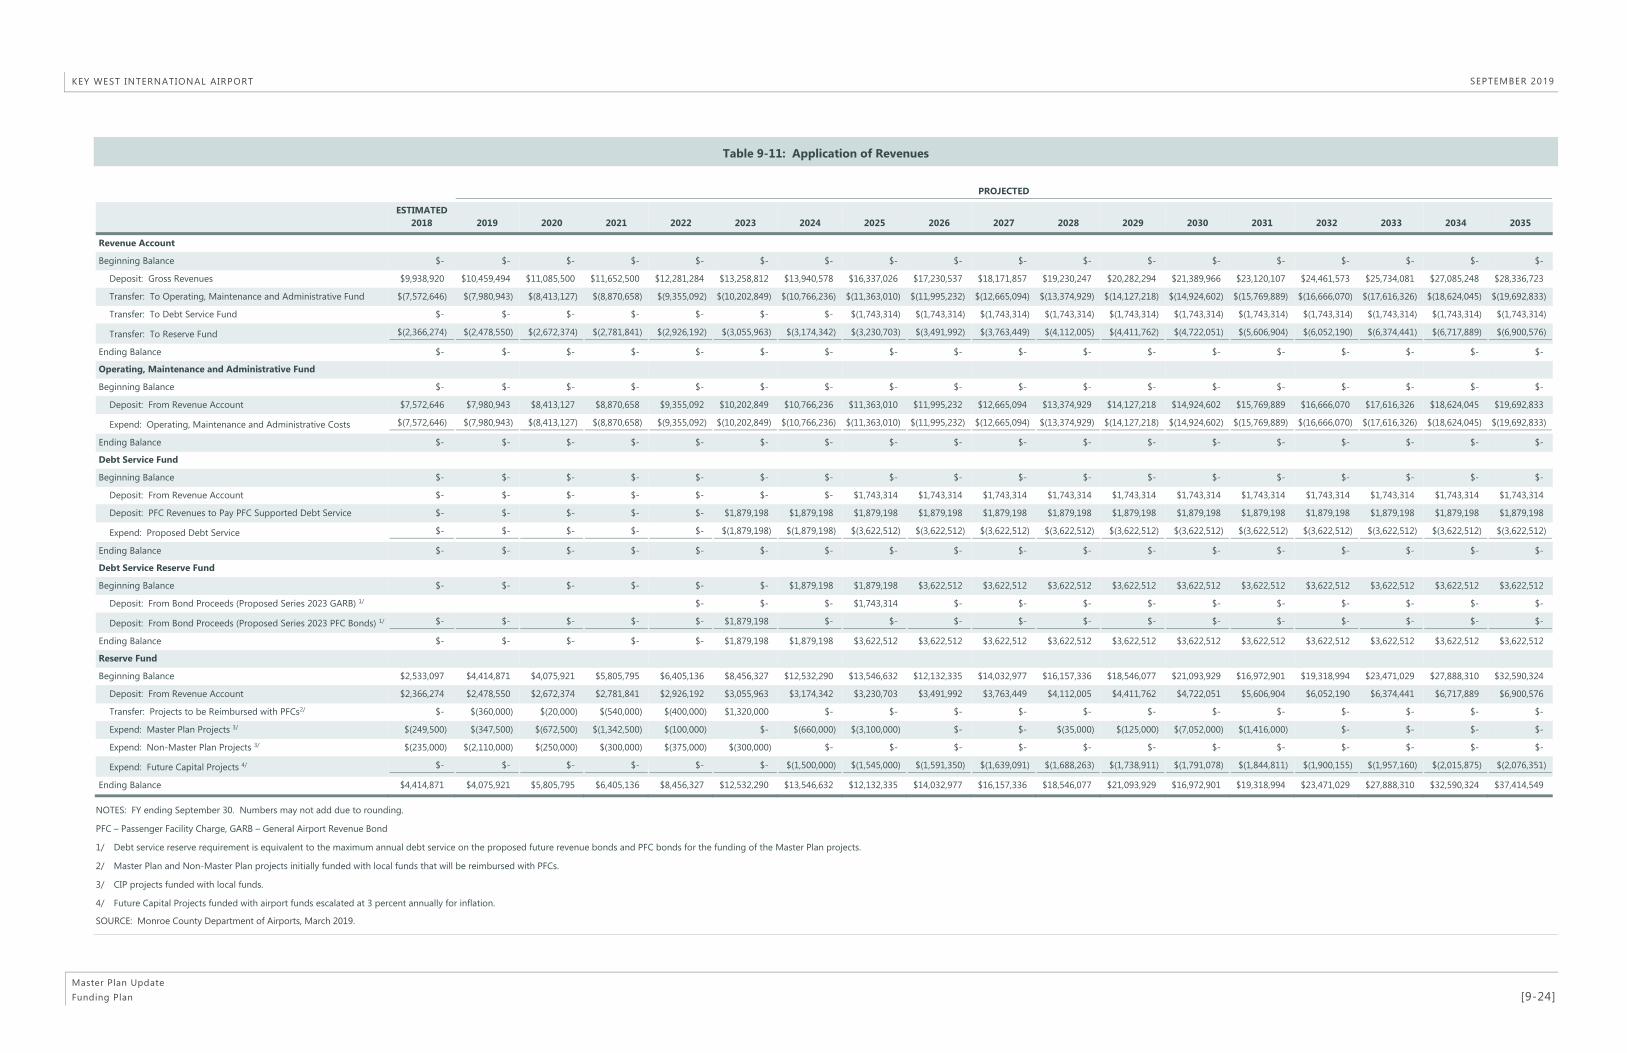
KEY WEST INTERNATIONAL AIRPORT SEPTEMBER 2019
Master Plan Update Funding Plan [9-24]
Table 9-11: Application of Revenues
PROJECTED
ESTIMATED 2018 2019 2020 2021 2022 2023 2024 2025 2026 2027 2028 2029 2030 2031 2032 2033 2034 2035
Revenue Account
Beginning Balance $- $- $- $- $- $- $- $- $- $- $- $- $- $- $- $- $- $-
Deposit: Gross Revenues $9,938,920 $10,459,494 $11,085,500 $11,652,500 $12,281,284 $13,258,812 $13,940,578 $16,337,026 $17,230,537 $18,171,857 $19,230,247 $20,282,294 $21,389,966 $23,120,107 $24,461,573 $25,734,081 $27,085,248 $28,336,723
Transfer: To Operating, Maintenance and Administrative Fund $(7,572,646) $(7,980,943) $(8,413,127) $(8,870,658) $(9,355,092) $(10,202,849) $(10,766,236) $(11,363,010) $(11,995,232) $(12,665,094) $(13,374,929) $(14,127,218) $(14,924,602) $(15,769,889) $(16,666,070) $(17,616,326) $(18,624,045) $(19,692,833)
Transfer: To Debt Service Fund $- $- $- $- $- $- $- $(1,743,314) $(1,743,314) $(1,743,314) $(1,743,314) $(1,743,314) $(1,743,314) $(1,743,314) $(1,743,314) $(1,743,314) $(1,743,314) $(1,743,314)
Transfer: To Reserve Fund $(2,366,274) $(2,478,550) $(2,672,374) $(2,781,841) $(2,926,192) $(3,055,963) $(3,174,342) $(3,230,703) $(3,491,992) $(3,763,449) $(4,112,005) $(4,411,762) $(4,722,051) $(5,606,904) $(6,052,190) $(6,374,441) $(6,717,889) $(6,900,576)
Ending Balance $- $- $- $- $- $- $- $- $- $- $- $- $- $- $- $- $- $-
Operating, Maintenance and Administrative Fund
Beginning Balance $- $- $- $- $- $- $- $- $- $- $- $- $- $- $- $- $- $-
Deposit: From Revenue Account $7,572,646 $7,980,943 $8,413,127 $8,870,658 $9,355,092 $10,202,849 $10,766,236 $11,363,010 $11,995,232 $12,665,094 $13,374,929 $14,127,218 $14,924,602 $15,769,889 $16,666,070 $17,616,326 $18,624,045 $19,692,833
Expend: Operating, Maintenance and Administrative Costs $(7,572,646) $(7,980,943) $(8,413,127) $(8,870,658) $(9,355,092) $(10,202,849) $(10,766,236) $(11,363,010) $(11,995,232) $(12,665,094) $(13,374,929) $(14,127,218) $(14,924,602) $(15,769,889) $(16,666,070) $(17,616,326) $(18,624,045) $(19,692,833)
Ending Balance $- $- $- $- $- $- $- $- $- $- $- $- $- $- $- $- $- $-
Debt Service Fund
Beginning Balance $- $- $- $- $- $- $- $- $- $- $- $- $- $- $- $- $- $-
Deposit: From Revenue Account $- $- $- $- $- $- $- $1,743,314 $1,743,314 $1,743,314 $1,743,314 $1,743,314 $1,743,314 $1,743,314 $1,743,314 $1,743,314 $1,743,314 $1,743,314
Deposit: PFC Revenues to Pay PFC Supported Debt Service $- $- $- $- $- $1,879,198 $1,879,198 $1,879,198 $1,879,198 $1,879,198 $1,879,198 $1,879,198 $1,879,198 $1,879,198 $1,879,198 $1,879,198 $1,879,198 $1,879,198
Expend: Proposed Debt Service $- $- $- $- $- $(1,879,198) $(1,879,198) $(3,622,512) $(3,622,512) $(3,622,512) $(3,622,512) $(3,622,512) $(3,622,512) $(3,622,512) $(3,622,512) $(3,622,512) $(3,622,512) $(3,622,512)
Ending Balance $- $- $- $- $- $- $- $- $- $- $- $- $- $- $- $- $- $-
Debt Service Reserve Fund
Beginning Balance $- $- $- $- $- $- $1,879,198 $1,879,198 $3,622,512 $3,622,512 $3,622,512 $3,622,512 $3,622,512 $3,622,512 $3,622,512 $3,622,512 $3,622,512 $3,622,512
Deposit: From Bond Proceeds (Proposed Series 2023 GARB) 1/ $- $- $- $1,743,314 $- $- $- $- $- $- $- $- $- $-
Deposit: From Bond Proceeds (Proposed Series 2023 PFC Bonds) 1/ $- $- $- $- $- $1,879,198 $- $- $- $- $- $- $- $- $- $- $- $-
Ending Balance $- $- $- $- $- $1,879,198 $1,879,198 $3,622,512 $3,622,512 $3,622,512 $3,622,512 $3,622,512 $3,622,512 $3,622,512 $3,622,512 $3,622,512 $3,622,512 $3,622,512
Reserve Fund
Beginning Balance $2,533,097 $4,414,871 $4,075,921 $5,805,795 $6,405,136 $8,456,327 $12,532,290 $13,546,632 $12,132,335 $14,032,977 $16,157,336 $18,546,077 $21,093,929 $16,972,901 $19,318,994 $23,471,029 $27,888,310 $32,590,324
Deposit: From Revenue Account $2,366,274 $2,478,550 $2,672,374 $2,781,841 $2,926,192 $3,055,963 $3,174,342 $3,230,703 $3,491,992 $3,763,449 $4,112,005 $4,411,762 $4,722,051 $5,606,904 $6,052,190 $6,374,441 $6,717,889 $6,900,576
Transfer: Projects to be Reimbursed with PFCs2/ $- $(360,000) $(20,000) $(540,000) $(400,000) $1,320,000 $- $- $- $- $- $- $- $- $- $- $- $-
Expend: Master Plan Projects 3/ $(249,500) $(347,500) $(672,500) $(1,342,500) $(100,000) $- $(660,000) $(3,100,000) $- $- $(35,000) $(125,000) $(7,052,000) $(1,416,000) $- $- $- $-
Expend: Non-Master Plan Projects 3/ $(235,000) $(2,110,000) $(250,000) $(300,000) $(375,000) $(300,000) $- $- $- $- $- $- $- $- $- $- $- $-
Expend: Future Capital Projects 4/ $- $- $- $- $- $- $(1,500,000) $(1,545,000) $(1,591,350) $(1,639,091) $(1,688,263) $(1,738,911) $(1,791,078) $(1,844,811) $(1,900,155) $(1,957,160) $(2,015,875) $(2,076,351)
Ending Balance $4,414,871 $4,075,921 $5,805,795 $6,405,136 $8,456,327 $12,532,290 $13,546,632 $12,132,335 $14,032,977 $16,157,336 $18,546,077 $21,093,929 $16,972,901 $19,318,994 $23,471,029 $27,888,310 $32,590,324 $37,414,549
NOTES: FY ending September 30. Numbers may not add due to rounding.
PFC – Passenger Facility Charge, GARB – General Airport Revenue Bond
1/ Debt service reserve requirement is equivalent to the maximum annual debt service on the proposed future revenue bonds and PFC bonds for the funding of the Master Plan projects.
2/ Master Plan and Non-Master Plan projects initially funded with local funds that will be reimbursed with PFCs.
3/ CIP projects funded with local funds.
4/ Future Capital Projects funded with airport funds escalated at 3 percent annually for inflation.
SOURCE: Monroe County Department of Airports, March 2019.

KEY WEST INTERNATIONAL AIRPORT SEPTEMBER 2019
Master Plan Update Funding Plan [9-25]
Table 9-12: Summary of Key Financial Metrics
PROJECTED
ESTIMATED 2018 2019 2020 2021 2022 2023 2024 2025 2026 2027 2028 2029 2030 2031 2032 2033 2034 2035
Terminal Rental Rate $58.17 $61.47 $67.45 $71.12 $74.98 $66.98 $70.70 $97.20 $103.21 $109.52 $116.07 $123.02 $130.31 $137.98 $146.03 $154.48 $163.18 $168.36
Landing Fee $3.78 $3.97 $4.09 $4.28 $4.49 $4.78 $5.00 $5.18 $5.37 $5.57 $5.92 $6.17 $6.43 $7.58 $8.02 $8.25 $8.53 $8.83
Cost Per Enplaned Passenger $10.55 $10.90 $11.44 $11.78 $12.22 $13.06 $13.48 $16.03 $16.65 $17.29 $18.09 $18.81 $19.56 $21.38 $22.39 $23.20 $24.06 $24.66
Debt Service Coverage Ratio (1.25 Minimum) N/A N/A N/A N/A N/A N/A N/A 2.85 3.00 3.16 3.36 3.53 3.71 4.22 4.47 4.66 4.85 4.96
Reserve Fund - Ending Balance $4,414,871 $4,075,921 $5,805,795 $6,405,136 $8,456,327 $12,532,290 $13,546,632 $12,132,335 $14,032,977 $16,157,336 $18,546,077 $21,093,929 $16,972,901 $19,318,994 $23,471,029 $27,888,310 $32,590,324 $37,414,549
NOTE: FY ending September 30. Numbers may not add due to rounding.
SOURCE: Monroe County Department of Airports, March 2019.
KEY WEST INTERNATIONAL AIRPORT SEPTEMBER 2019
Master Plan Update Funding Plan [9-26]
9.6 Conclusion
The financial analysis presented in this section shows a feasible funding plan for implementing the CIP. Based on analyses of forecast activity at the Airport, in addition to projected revenues and expenses, along with the CIP for FY 2018 through FY 2035, it appears the County has adequate resources to meet the funding requirements for implementing the CIP. The County has access to various funding sources, which include a mix of FAA funding, state funding, PFC revenues, Airport funds, and revenue bond proceeds. The airline rates and overall airline CPE remain reasonable over the Planning Period. Revenues available to pay projected debt service are projected to meet or exceed the assumed minimum requirement of 1.25 times debt service in each year of the Planning Period after the issuance of the debt. 4
As implementation of the CIP progresses, Airport/County staff should continually assess the financial feasibility of each project. Future considerations regarding funding of the CIP include the following:
Enplaned passenger/traffic growth: The funding plan was developed and analyzed based on the aviationactivity forecasts developed for the Airport (see Section 3). Actual year-to-year numbers of enplanedpassengers and aircraft operations will likely vary from the forecasts. Significant changes in the numbers ofenplaned passengers and aircraft operations may affect revenues and expenses, as well as PFC revenuesand AIP grants.
Availability of AIP funds: In developing the estimated funding plan for implementing the CIP, it wasassumed that the FAA will continue to authorize and appropriate AIP grants for eligible projects. Since thelevel of authorized and appropriated AIP grant funds may vary from year to year, alternative funding sourcesmay be required if grants cannot be obtained for certain eligible projects. Conversely, the County shouldtake full advantage of all available AIP grants, including potential discretionary grants. Obtaining such grantfunding may reduce the need for PFC revenues and/or Airport cash funding for certain projects, therebyallowing those funds to be used for other projects.
Potential increase in maximum PFC level: Airport industry groups have requested that federal PFCregulations be amended to increase the maximum PFC level from the current $4.50 per eligible enplanedpassenger. Although the FAA reauthorization bill enacted in February 2012 nor the FAA reauthorizationpassed in Congress in 2018 did not address this issue, it is possible that future reauthorization legislationwill address it. In developing the financial projections and the funding plan, it was assumed that the current$4.50 PFC in effect at the Airport will remain in effect for the entire Planning Period. If federal PFCregulations are amended and the maximum PFC level is increased, then the County may choose to apply tothe FAA for authorization to impose a higher PFC at the Airport.
4 Since the County does not have any existing outstanding debt service, a minimum coverage ratio of 1.25 times debt service is assumed in accordance with industry standards.