chapter 8: prescription drug coverage in patients with ckd · 2018-11-29 · 2018 usrds annual data...
TRANSCRIPT

2018 USRDS ANNUAL DATA REPORT | VOLUME 1: CKD IN THE UNITED STATES 159
Chapter 8: Prescription Drug Coverage in Patients with CKD
In this 2018 Annual Data Report (ADR), we introduce new chapter features:
o Because of the continuing prescription opioid epidemic, this year we retain the section of analgesic use and update the map with non-steroidal anti-inflammatory agents (NSAIDs) and opioid use in the United States using 2016 data.
o Because of increasing use of high-cost antivirals nationally, this year we specifically investigate the spending and utilization rates of antivirals, including prescription antiretrovirals, nucleosides and nucleotides, and protease inhibitors.
Approximately 73.7% of chronic kidney disease (CKD) patients enrolled in Medicare Part D in 2016, including both the fee-for-service stand-alone and Medicare Advantage plans. The Part D enrollment rate for the CKD group was slightly higher than in the general Medicare population (69.5%; Figure 8.1).
The percentage of Medicare beneficiaries who received the Low-income Subsidy (LIS) was higher for CKD patients across all age and race categories than in the general Medicare population (Figures 8.2 and 8.3).
As compared to White beneficiaries (29.3%), much higher proportions of Asian (73.8%) and Black/ African American (62.8%) CKD Part D beneficiaries qualified for the LIS (Figure 8.3).
Among patients with stand-alone Part D plans, per person per year (PPPY) insurance spending on prescriptions was 1.6 times higher for Medicare patients with CKD than for general beneficiaries ($4,941 vs. $3,027) in 2016. Spending for CKD patients with Medicare Advantage plans was 1.6 times higher ($2,926, vs. $1,834), and 4.1 times higher for those with managed care coverage ($4,164 vs. $1,013; Figure 8.5.a).
Total spending for Part D-covered medications in 2016 was more than twice as high for patients with the LIS than for those without, regardless of the presence of CKD. Patient out-of-pocket costs for LIS patients represented only a 1.2-1.3% share of these total expenditures, as compared to 25.3-27.0% in each of the non-LIS populations (Figure 8.5.b).
Prescriptions for lipid-lowering agents, antibacterials, renin-angiotensin-aldosterone system inhibitors, and β-adrenergic blocking agents (beta blockers) were each filled by more than 50% of Medicare CKD patients during 2016 (Table 8.6). CKD patients with Medicare Advantage and managed care coverage showed similar patterns of use for these drug classes.
By drug class, the highest medication expenditures for patients with CKD were for antidiabetic agents, followed by antineoplastic agents, antivirals, and lipid-lowering agents (Table 8.7).
In the United States (U.S.), the overall proportion of CKD patients using prescription NSAIDs and opioids were 16.4% and 43.8%, respectively (Figure 8.6-8.7).
In 2016, approximately 5.0% of Medicare CKD patients had at least one filled prescription antiviral, and PPPY Medicare Part D spending among these users is $5,421 (Figure 8.9-8.10).

2018 USRDS ANNUAL DATA REPORT | VOLUME 1: CKD IN THE UNITED STATES
160
Introduction
Pharmaceutical therapy serves as a critical part of
CKD treatment to control and reduce complications
and delay disease progression. This chapter assesses
prescription drug coverage, prescription drug-related
costs, and patterns of prescription drug use for CKD
patients in three health systems. The Medicare 5%
sample is used to describe Part D enrollment patterns
in Medicare beneficiaries and Medicare Part D
spending under stand-alone prescription drug plans
(PDPs). Beginning from the 2017 ADR (USRDS, 2017)
we have added information on prescription drug use
and associated costs from the Optum Clinformatics™
DataMart (obtained from OptumInsight) for persons
with Medicare Advantage and managed care coverage.
In 2016, 45% of general Medicare beneficiaries
enrolled in a stand-alone PDP, while 25% received
coverage through a Medicare Advantage plan (Kaiser,
2018); adding information for Medicare Advantage
beneficiaries thus makes our assessment of
prescription drug use in CKD more complete.
Additionally, Optum Clinformatics™ data for
beneficiaries with managed care complements our
report by providing insight into a younger and
employed population.
Starting in 2017, we annually select a different drug
class for a more detailed investigation of medication
use patterns. In the 2017 ADR, we reported analgesics
used by CKD patients. Because of the continuing
opioid epidemic, we continue that analysis this year,
but we have also added a section on prescription
antivirals, a category with high and growing costs.
A parallel examination of prescription drug use and
associated costs in patients with end-stage (ESRD) can
be found in Volume 2, Chapter 10: Prescription Drug
Coverage in Patients with ESRD.
Methods
In this chapter, we examine the Medicare 5%
sample data to describe Part D enrollment and
prescription utilization for Medicare beneficiaries.
Enrollment data are available for both traditional
Medicare (fee-for-service) enrollees and Medicare
Advantage enrollees; however, actual claim data and
spending data are only available for beneficiaries with
traditional Medicare. Thus, our past estimations for
Part D enrollment applied to all Medicare
beneficiaries, but the reporting of prescription
utilization and associated costs applied only to the
sub-group of Medicare fee-for-services Part D
enrollees. We have now introduced Optum
Clinformatics™ data to augment our assessment of
prescription utilization and associated costs for both
the Medicare Advantage population and a
commercially insured, managed care population.
Details of these data are described in the Data
Sources section of the CKD Analytical Methods
chapter. See the section on Chapter 8 in the CKD
Analytical Methods chapter for an explanation of the
analytical methods used to generate the study cohorts,
figures, and tables in this chapter. Downloadable
Microsoft Excel and PowerPoint files containing the
data and graphics for these figures and tables are
available on the USRDS website.
To be included in analyses specific to the Medicare
5% population, eligible beneficiaries must have been
enrolled in traditional Medicare for all of the one-year
entry period (year one, the calendar year before the
year reported in the figures and tables), and be alive,
without ESRD, and enrolled in Medicare on January 1
of the reported year (year two). These criteria were
necessary to enable CKD identification, as diagnosis
codes were not available for patients before they
became eligible for fee-for-service Medicare. CKD
patients were identified by having a minimum of one
inpatient and/or two outpatient CKD diagnoses claims
in year one. We assessed Part D enrollment and
prescription utilization for year two. The Medicare
Part D drug event file provided data to evaluate
prescription utilization; it contains records of all
prescriptions filled by the beneficiaries under
Medicare Part D.
For beneficiaries selected from the Optum
Clinformatics™ data, to create comparable results we
applied the same eligibility algorithm as for the
Medicare population. Beneficiaries were required to
be in the Optum Clinformatics™ dataset throughout
year one, be alive, without ESRD, and covered by
either a Medicare Advantage plan or a managed care
plan on January 1 of year two. Those with Medicare

CHAPTER 8: PRESCRIPTION DRUG COVERAGE IN PATIENTS WITH CKD
161
Advantage at the beginning of year two were classified
as the Medicare Advantage population; otherwise,
they were classified as the managed care population.
All beneficiaries in the Optum Clinformatics™ dataset
had prescription drug coverage.
In this chapter, we define spending as insurance
plan payments. For example, Medicare Part D
spending is the sum of Medicare net payment and the
Low-income Supplement (LIS) amount. Patients’
obligations (out-of-pocket costs) are the sum of the
deductible and copayment.
Medicare Part D Coverage Plans
The optional Medicare Part D prescription drug
benefit has been available to all beneficiaries since
2006. Part D benefits can be managed through a
stand-alone PDP or through a Medicare Advantage
plan. Most Medicare Advantage plans offer
prescription drug coverage (Medicare Advantage
prescription drug plan, MA-PD). CKD patients have
the option to enroll in a Medicare Advantage plan;
end-stage renal disease (ESRD) patients, in contrast,
are precluded from entering a Medicare Advantage
plan if they are not already enrolled in one when they
reach ESRD.
Before 2006, Medicare beneficiaries obtained drug
coverage through various avenues—insurance plans,
state Medicaid programs, pharmaceutical assistance
programs, or samples received from physicians. Those
with none of these options paid for their medications
out-of-pocket. Beneficiaries with low income who
were dually enrolled in Medicare and Medicaid
received prescription benefits under state Medicaid
programs.
After 2006, the majority of Medicare enrollees
obtained Part D coverage. The Part D program offers a
substantial Low-income Subsidy (LIS) benefit to
enrollees with limited assets and income, including
those dually enrolled. The LIS provides full or partial
waivers for many out-of-pocket cost-sharing
requirements, including premiums, deductibles, and
copayments, and provides full or partial coverage
during the Part D coverage gap (commonly referred to
as the “donut hole”).
Besides Medicare Part D plans (PDP and MA-PD),
Medicare beneficiaries can choose instead to obtain
outpatient medication benefits through retiree drug
subsidy plans or other creditable coverage such as
employer group health plans, other private coverage,
or Veterans Health Administration (VHA) benefits.
Some enrollees remain uninsured and pay out-of-
pocket for their outpatient prescription medications.
The premiums for Part D coverage are partially
subsidized. Beneficiaries who delay voluntary
enrollment, yet lack other creditable coverage at least
equivalent to Part D, pay higher premiums once they
do enroll.
In 2016, approximately 73.7% of CKD patients
enrolled in Medicare Part D (including both stand-
alone and Medicare Advantage plans). This rate was
slightly higher than Part D enrollment by those in the
general Medicare population (69.5%, Figure 8.1).
Compared to Part D enrollees in the general
population, a higher percentage of CKD patients
qualified for the LIS (26.6% vs. 22.8%).

2018 USRDS ANNUAL DATA REPORT | VOLUME 1: CKD IN THE UNITED STATES
162
vol 1 Figure 8.1 Sources of prescription drug coverage in Medicare enrollees, by population, 2016
Data source: Medicare 5% sample. Point prevalent Medicare enrollees alive on January 1, 2016. Abbreviations: CKD, chronic kidney disease; LIS, Medicare Low-income Subsidy; Part D, Medicare prescription drug coverage benefit.
The proportion of beneficiaries that enrolled in
Medicare Part D rose between 2011 and 2016, among
both general Medicare beneficiaries and patients with
CKD (Table 8.1). In each year, enrollment was slightly
higher for those with CKD than in the general
Medicare population.
vol 1 Table 8.1 General Medicare and CKD patients enrolled in Part D
General Medicare (%) All CKD (%)
2011 55.7 59.3
2012 57.6 60.5
2013 65.7 69.3
2014 66.3 71.1
2015 67.1 71.9
2016 69.5 73.7
Data source: Medicare 5% sample. Point prevalent Medicare enrollees alive on January 1. Abbreviations: CKD, chronic kidney disease; Part D, Medicare prescription drug coverage benefit.

CHAPTER 8: PRESCRIPTION DRUG COVERAGE IN PATIENTS WITH CKD
163
The Centers for Medicare & Medicaid Services
(CMS) provides prescription drug plans (PDPs) with
guidance on structuring a “standard’’ Part D PDP. The
upper portion of Table 8.2 shows the standard benefit
design for PDPs in 2011 and 2016. In 2016, for example,
beneficiaries shared costs with the PDP as co-
insurance or copayments, until the combined total
during the initial coverage period reached $3,310. After
reaching this level, beneficiaries entered the coverage
gap (“donut hole”) where they paid 100% of
prescription costs. Under the original Affordable Care
Act, the coverage gap in the Part D benefit will be
phased out by 2020.
As part of the phase-out, the government began
providing non-LIS recipients reaching the coverage
gap with increasing assistance each year. In 2016,
beneficiaries received a 50% discount on brand name
drugs from manufacturers plus 5% coverage from their
Part D plans; plans also paid 42% of generic drug costs
in the gap. Beneficiaries who had paid yearly out-of-
pocket drug costs of $4,850 reached the catastrophic
coverage phase, in which they then had only a small
copayment for their drugs until the end of the year.
PDPs have the latitude to structure their plans
differently than the model presented here; companies
offering non-standard plans must show that their
coverage is at least actuarially equivalent to the
standard plan. Many have developed plans with no
deductibles or with drug copayments instead of the
25% co-insurance, and some plans provide generic
and/or brand name drug coverage during the coverage
gap.
Part D does not cover all medications prescribed
for Medicare enrollees. Several drug categories—such
as over-the-counter medications, anorexia and weight
loss or gain medications, prescription vitamins (except
for prenatal vitamins), and cough and cold
medications are excluded from the Part D program
formulary. This creates a lack of support for some
drugs commonly prescribed to treat CKD, including
oral iron, ergocalciferol, and cholecalciferol. In
January 2013, Medicare expanded Part D coverage to
include benzodiazepines without restriction, and
barbiturates when prescribed for specific indications.

2018 USRDS ANNUAL DATA REPORT | VOLUME 1: CKD IN THE UNITED STATES
164
vol 1 Table 8.2 Medicare Part D parameters for defined standard benefit, 2011 & 2016
2011 2016
Deductible $310 $360
After the deductible is met, the beneficiary pays 25% of total
prescription costs up to the initial coverage limit.
Initial coverage limit $2,840 $3,310
The coverage gap (“donut hole”) begins at this point.
The beneficiary pays 100% of their prescription costs up to the
out-of-pocket threshold
Out-of-pocket threshold $4,550 $4,850
The total out-of-pocket costs including the “donut hole”
Total covered Part D prescription out-of-pocket spending $6,448 $7,063
Catastrophic coverage begins after this point
(including the coverage gap)a
Catastrophic coverage benefit $2.50 $2.95
Generic/preferred multi-source drug $6.30 $7.40
2016 Example:
$360 (deductible) $310 $360
+(($3,310-$360)*25%)(initial coverage) $633 $738
+(($7,063-$3,310)*100%)(coverage gap) $3,608 $3,753
Total $4,550 $4,850
(maximum out-of-pocket costs prior to catastrophic coverage,
excluding plan premium)
Data source: Table adapted from http://www.q1medicare.com/PartD-The-2016-Medicare-Part-D-Outlook.php. Medicare Part D Enrollment Patterns. aThe catastrophic coverage amount is the greater of 5% of medication cost or the values shown in the chart above. In 2016, beneficiaries were charged $2.95 for those generic or preferred multisource drugs with a retail price less than $59 and 5% for those with a retail price over $59. For brand name drugs, beneficiaries paid $7.4 for those drugs with a retail price less than $148 and 5% for those with a retail price over $148. In 2016, beneficiaries received a 50% discount on brand name drugs from manufacturers plus 5% coverage from their Part D plans; plans also paid 42% of generic drug costs in the gap. Abbreviation: Part D, Medicare prescription drug coverage benefit.
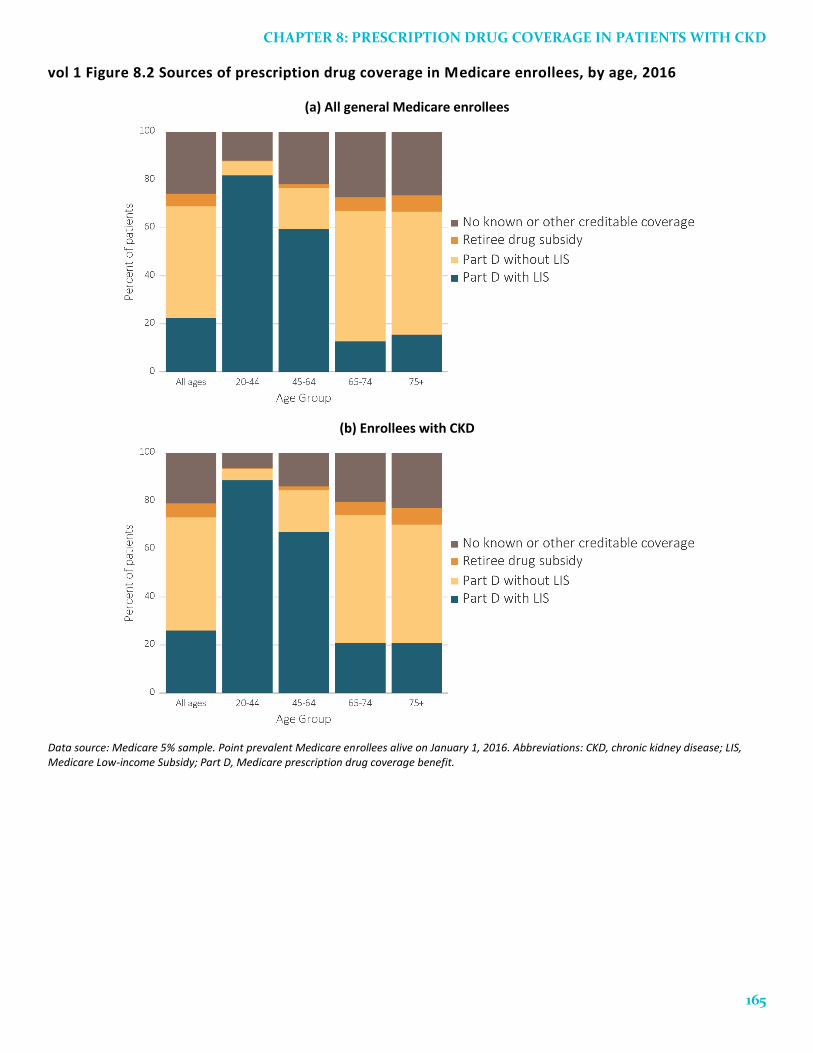
Among both general Medicare beneficiaries and
those with CKD, the percentage of beneficiaries
enrolled in Part D generally declined with age (Figure
8.2). The proportion of beneficiaries with LIS declined
with age in both populations, with the exception of
general Medicare population aged 75 and older. CKD
patients in all age categories were more likely to
receive this subsidy.
CHAPTER 8: PRESCRIPTION DRUG COVERAGE IN PATIENTS WITH CKD
165
vol 1 Figure 8.2 Sources of prescription drug coverage in Medicare enrollees, by age, 2016
(a) All general Medicare enrollees
(b) Enrollees with CKD
Data source: Medicare 5% sample. Point prevalent Medicare enrollees alive on January 1, 2016. Abbreviations: CKD, chronic kidney disease; LIS, Medicare Low-income Subsidy; Part D, Medicare prescription drug coverage benefit.
2018 USRDS ANNUAL DATA REPORT | VOLUME 1: CKD IN THE UNITED STATES
166
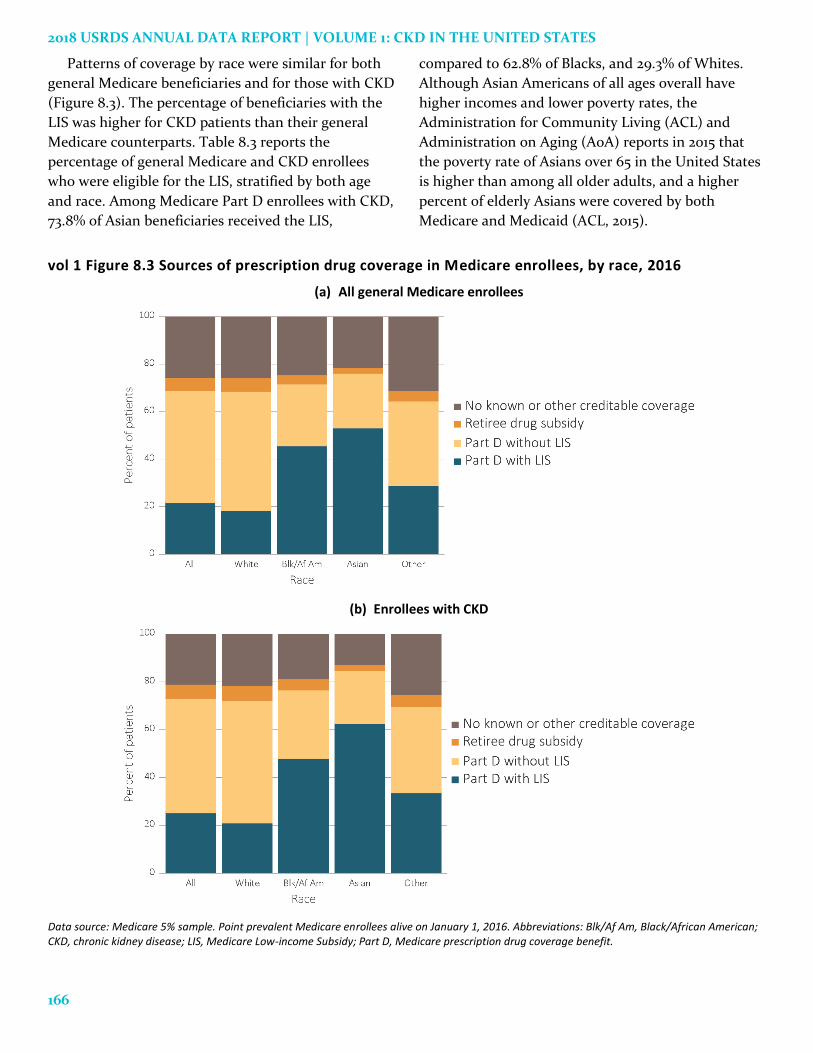
Patterns of coverage by race were similar for both
general Medicare beneficiaries and for those with CKD
(Figure 8.3). The percentage of beneficiaries with the
LIS was higher for CKD patients than their general
Medicare counterparts. Table 8.3 reports the
percentage of general Medicare and CKD enrollees
who were eligible for the LIS, stratified by both age
and race. Among Medicare Part D enrollees with CKD,
73.8% of Asian beneficiaries received the LIS,
compared to 62.8% of Blacks, and 29.3% of Whites.
Although Asian Americans of all ages overall have
higher incomes and lower poverty rates, the
Administration for Community Living (ACL) and
Administration on Aging (AoA) reports in 2015 that
the poverty rate of Asians over 65 in the United States
is higher than among all older adults, and a higher
percent of elderly Asians were covered by both
Medicare and Medicaid (ACL, 2015).
vol 1 Figure 8.3 Sources of prescription drug coverage in Medicare enrollees, by race, 2016
(a) All general Medicare enrollees
(b) Enrollees with CKD
Data source: Medicare 5% sample. Point prevalent Medicare enrollees alive on January 1, 2016. Abbreviations: Blk/Af Am, Black/African American; CKD, chronic kidney disease; LIS, Medicare Low-income Subsidy; Part D, Medicare prescription drug coverage benefit.

CHAPTER 8: PRESCRIPTION DRUG COVERAGE IN PATIENTS WITH CKD
167
vol 1 Table 8.3 Medicare Part D enrollees with the Low-income Subsidy, by age & race, 2016
General Medicare (%) All CKD (%)
Part D with Low-income Subsidy
Part D with Low-income Subsidy
All 32.9 36.1
White
All ages 27.0 29.3
20-44 92.4 94.2
45-64 75.4 76.8
65-74 15.1 23.2
75+ 18.8 23.7
Black/African American
All ages 63.8 62.8
20-44 95.2 96.6
45-64 85.4 85.5
65-74 44.8 50.5
75+ 52.7 58.2
Asian
All ages 70.0 73.8
20-44 93.1 93.1
45-64 85.3 84.1
65-74 60.0 63.8
75+ 73.9 77.2
Other races
All ages 45.2 48.5
20-44 94.9 96.5
45-64 80.6 81.9
65-74 30.4 35.3
75+ 39.8 47.7
Data source: Medicare 5% sample. Point prevalent Medicare enrollees alive on January 1, 2016. Abbreviations: CKD, chronic kidney disease; Part D, Medicare prescription drug coverage benefit.
Several categories of Medicare beneficiaries automatically qualify for LIS and Part D benefits, and are
considered to be ‘deemed’. These individuals include full-benefit Medicare/Medicaid dual eligible individuals,
partial dual eligible individuals, Qualified Medicare Beneficiaries (QMB-only), Specified Low-income Medicare
Beneficiaries (SLMB-only), Qualifying Individuals (QI), and people who receive Supplemental Security Income
(SSI) benefits but not Medicaid. Other Medicare beneficiaries with limited incomes and resources who do not
automatically qualify for LIS (non-deemed) can apply for LIS and have their eligibility determined by their State
Medicaid agency or the Social Security Administration.
Figure 8.4 illustrates the distribution of Part D enrollees receiving the LIS across the benefit categories of
premium subsidy and copayment. The largest group of LIS recipients who had CKD was eligible for a full
premium subsidy—21.1% had a high copay, 31.6% had a low copay, and 37.6% had no copay.

2018 USRDS ANNUAL DATA REPORT | VOLUME 1: CKD IN THE UNITED STATES
168
vol 1 Figure 8.4 Distribution of Low-income Subsidy categories in Part D general Medicare and CKD patients, 2016
Data source: Medicare 5% sample. Point prevalent Medicare enrollees alive on January 1, 2016. Abbreviations: CKD, chronic kidney disease; Part D, Medicare prescription drug coverage benefit.

CHAPTER 8: PRESCRIPTION DRUG COVERAGE IN PATIENTS WITH CKD
169
Spending for Prescriptions
In 2016, Medicare Part D spending for fee-for-
service beneficiaries reached $56.9 billion. Table 8.4
represents the sum of the Medicare covered amount
and the LIS amount. Medicare Part D spending for
beneficiaries with CKD was $11.8 billion—about 20.8%
of overall Medicare Part D spending. Data over a six-
year period shows a consistent trend of increasing
costs; between 2011 and 2016 spending rose by 42.0%
for general Medicare patients ($16.8 billion) and
129.6% for Medicare CKD patients ($6.7 billion). This
increase mirrors the increase of CKD ascertainment
and the increase in Medicare part D spending per
capita in the same period. Per capita spending for
general Medicare increased by 12.6% during this five
year interval compared to a 24.2% increase among
CKD patients. ESRD patients also had higher than
average increases during these years (see Volume 2,
Chapter 10: Prescription Drug Coverage in Patients
with ESRD).
vol 1 Table 8.4 Total estimated Medicare Part D spending for fee-for-service beneficiaries, 2011-2016 General Medicare All CKD
Year Medicare spending
(in billions) Medicare spending /
PPPY Medicare spending
(in billions) Medicare spending /
PPPY
2011 $40.1 $2,689 $5.2 $3,978
2012 $35.7 $2,610 $4.8 $3,918
2013 $45.7 $2,584 $6.8 $3,947
2014 $50.5 $2,806 $7.7 $4,229
2015 $54.2 $2,970 $8.7 $4,545
2016 $56.9 $3,027 $11.8 $4,941
Data source: Medicare Part D claims. Medicare totals include Part D claims for Part D enrollees with traditional Medicare (Parts A & B). CKD totals include Medicare CKD patients, as determined from claims. Abbreviations: CKD, chronic kidney disease; Part D, Medicare prescription drug coverage benefit; PPPY, per person per year.
Figure 8.5.a illustrates PPPY spending and patient
out-of-pocket costs by type of coverage. In 2016, PPPY
insurance spending for CKD beneficiaries was 1.6, 1.6,
and 4.1 times higher than for general beneficiaries of
the Medicare Part D, Medicare Advantage, and
managed care cohorts. Similar to patterns of spending,
out-of-pocket costs for CKD patients were 1.5, 1.4, and
2.8 times higher than for general populations with
Medicare Part D, Medicare Advantage, and managed
care coverage. Out-of-pocket costs represented a
larger share of total prescription spending in the
general Medicare Advantage cohort (18.6%), the
general managed care cohort (17.8%) and the CKD
Medicare Advantage cohort (16.8%) than in the
general Medicare Part D cohort (13.0%), the CKD
managed care cohort (12.7%) and the CKD Medicare
Part D cohort (11.9%).
Per person per year spending for general and CKD
Medicare Part D enrollees was further stratified by
their LIS status (Figure 8.5.b). Total 2016 spending for
Part D-covered medications was more than twice as
high for beneficiaries with the LIS than for those
without, regardless of the presence of CKD. In the LIS
populations, however, out-of-pocket costs represented
only 1.2-1.3% of these total expenditures, compared to
25.3-27.0% in each of the non-LIS populations.

2018 USRDS ANNUAL DATA REPORT | VOLUME 1: CKD IN THE UNITED STATES
170
vol 1 Figure 8.5 Per person per year insurance & out-of-pocket costs (in $1,000s) for enrollees, 2016
(a) All enrollees by type of insurance and modality
(b) Medicare Part D enrollees by Low-income Subsidy status
Data source: Medicare Part D claims and Optum Clinformatics™ claims. Medicare totals include Part D claims for Part D enrollees with traditional Medicare (Parts A & B). CKD totals include Medicare CKD patients as determined from claims. Costs are per person per year for calendar year 2016. Medicare total is the sum of Medicare net payment plus Low-income Supplement amount. Abbreviations: Gen., general enrollees; CKD, chronic kidney disease; LIS, Medicare Low-income Subsidy; Medicare adv., Medicare Advantage plans; Part D, Medicare prescription drug coverage benefit.

CHAPTER 8: PRESCRIPTION DRUG COVERAGE IN PATIENTS WITH CKD
171
PPPY Medicare Part D spending for prescriptions
(excluding patient obligations) varied widely by
coverage (Table 8.5). Overall, expenditures for
beneficiaries with CKD were higher than in the
general populations. PPPY insurance spending for
prescriptions was highest in Medicare Part D
beneficiaries with LIS for both the general and CKD
populations ($5,916 and $8,870). For the general
population cohorts, spending was lowest in managed
care ($1,013), and for the CKD cohorts was lowest in
Medicare Part D without LIS ($2,861). For both general
Medicare, and CKD Medicare, LIS per capita spending
was over 3 times as great as for non-LIS patients.
Reasons for this difference have yet to be determined.
As there are differences between the Medicare and
Optum Clinformatics™ beneficiary populations and in
their methods of reporting costs, these results may not
be directly comparable and should be interpreted with
caution and with understanding of those differences.

2018 USRDS ANNUAL DATA REPORT | VOLUME 1: CKD IN THE UNITED STATES
172
vol 1 Table 8.5 Per person per year insurance spending ($) for enrollees, 2016
(a) Medicare Part D
Medicare Part D with LIS, General
Medicare Part D with LIS, CKD
Medicare Part D without LIS, General
Medicare Part D without LIS, CKD
Age
All $5,916 $8,870 $1,684 $2,861
20-44 $5,757 $12,015 $3,000 $2,921
45-64 $7,883 $12,742 $3,806 $5,828
65-74 $5,171 $9,010 $1,614 $3,374
75+ $4,317 $6,254 $1,550 $2,356
Sex
Male $5,900 $9,407 $1,830 $3,087
Female $5,926 $8,536 $1,576 $2,633
Race
White $6,119 $9,063 $1,670 $2,827
Black/African American $5,779 $8,579 $1,968 $2,952
Asian $4,973 $7,541 $1,346 $2,716
Other race $5,016 $7,931 $1,768 $3,611
(b) Medicare Advantage and Managed Care
Medicare Advantage, General
Medicare Advantage, CKD
Managed Care, General
Managed Care, CKD
Age
All $1,834 $2,926 $1,013 $4,164
20-44 $5,149 $9,767 $579 $2,566
45-64 $5,045 $7,862 $1,323 $4,480
65-74 $1,610 $3,401 $2,087 $5,134
75+ $1,438 $2,211 $2,623 $3,772
Sex
Male $1,812 $2,892 $986 $4,401
Female $1,850 $2,954 $1,040 $3,850
Race
White $1,851 $2,880 $1,045 $4,260
Black/African American $2,761 $4,159 $982 $3,993
Asian $1,765 $3,213 $597 $3,234
Other race NA NA NA NA
Data source: Medicare Part D claims and Optum Clinformatics™ claims. CKD determined from claims. Costs are per person per year for calendar year 2016. Medicare PPPY is the sum of Medicare net payment and the Low-income Supplement amount. LIS status is determined from the Part D enrollment. A person is classified as LIS if they are eligible for the LIS for at least one month during 2016. Abbreviations: CKD, chronic kidney disease; LIS, Medicare Low-income Subsidy; NA, not applicable; Part D, Medicare prescription drug coverage benefit.

CHAPTER 8: PRESCRIPTION DRUG COVERAGE IN PATIENTS WITH CKD
173
Prescription Drug Classes
Ranking of the top 15 prescription drug classes used
by CKD patients is based on the percentage of
beneficiaries with at least one claim for a medication
in that class during 2016. The proportion of patients
using each drug class was somewhat lower for
Medicare Advantage and managed care enrollees in
the Optum Clinformatics™ database than for those
having Medicare Part D. These differences could arise
from plan effects such as coverage or care
management activities, or from patient selection in
the younger and healthier Optum Clinformatics™
cohort. The most commonly used drug classes were
similar between the different cohorts. The list was led
by lipid-lowering agents, antibacterials, renin-
angiotensin-aldosterone system inhibitors, β-
adrenergic blocking agents (Beta Blockers), and
analgesics and antipyretics (Table 8.6).

2018 USRDS ANNUAL DATA REPORT | VOLUME 1: CKD IN THE UNITED STATES
174
vol 1 Table 8.6 Top 15 drug classes received by CKD cohorts in different health plans, by percent of patients, 2016
(a) Medicare Part D
Rank Drug class Percent of patients
1 Lipid-lowering agents 65.2%
2 Antibacterials 60.2%
3 Renin-angiotensin-aldosterone system Inhibitors 59.2%
4 β-adrenergic blocking agents 54.6%
5 Analgesics and antipyretics 49.5%
6 Diuretics 46.0%
7 Antiulcer agents and acid suppressants 42.3%
8 Antidiabetic agents 42.1%
9 Calcium-channel blocking agents 38.0%
10 Psychotherapeutic agents 37.6%
11 Antithrombotic agents 31.1%
12 Anticonvulsants 27.7%
13 Thyroid and antithyroid agents 25.5%
14 Anxiolytics, sedatives, and hypnotics 23.3%
15 Adrenals 22.1%
(b) Medicare Advantage
Rank Drug class Percent of patients
1 Lipid-lowering agents 53.0%
2 Renin-angiotensin-aldosterone system Inhibitors
50.4%
3 Antibacterials 44.3%
4 β-adrenergic blocking agents 40.6%
5 Analgesics and antipyretics 36.7%
6 Diuretics 33.4%
7 Calcium-channel blocking agents 31.2%
8 Antiulcer agents and acid suppressants 30.3%
9 Antidiabetic agents 29.8%
10 Psychotherapeutic agents 26.3%
11 Antithrombotic agents 21.1%
12 Vaccines 20.4%
13 Diabetic consumables 19.5%
14 Thyroid and antithyroid agents 18.8%
15 Anticonvulsants 18.3%
Table 8.6 continued on next page.

CHAPTER 8: PRESCRIPTION DRUG COVERAGE IN PATIENTS WITH CKD
175
vol 1 Table 8.6 Top 15 drug classes received by CKD cohorts in different health plans, by percent of patients, 2016 (continued)
(c) Managed Care
Rank Drug class Percent of patients
1 Antibacterials 48.5%
2 Renin-angiotensin-aldosterone system Inhibitors
48.2%
3 Lipid-lowering agents 45.0%
4 Analgesics and antipyretics 41.8%
5 β-adrenergic blocking agents 31.2%
6 Antidiabetic agents 30.6%
7 Calcium-channel blocking agents 24.6%
8 Diuretics 23.8%
9 Psychotherapeutic agents 23.7%
10 Antiulcer agents and acid suppressants 20.6%
11 Adrenals 18.9%
12 Anxiolytics, sedatives, and hypnotics 18.7%
13 Diabetic consumables 18.0%
14 Anticonvulsants 15.4%
15 Thyroid and antithyroid agents 14.2%
Data source: Medicare Part D claims and Optum Clinformatics™ claims. CKD patients with Medicare Part D stand-alone prescription drug plans in the Medicare 5% sample. Diabetic Consumables refers to blood glucose test strips, blood glucose meters/sensors, lancets, needles, pen needles etc. Abbreviations: CKD, chronic kidney disease; Part D, Medicare prescription drug coverage benefit.
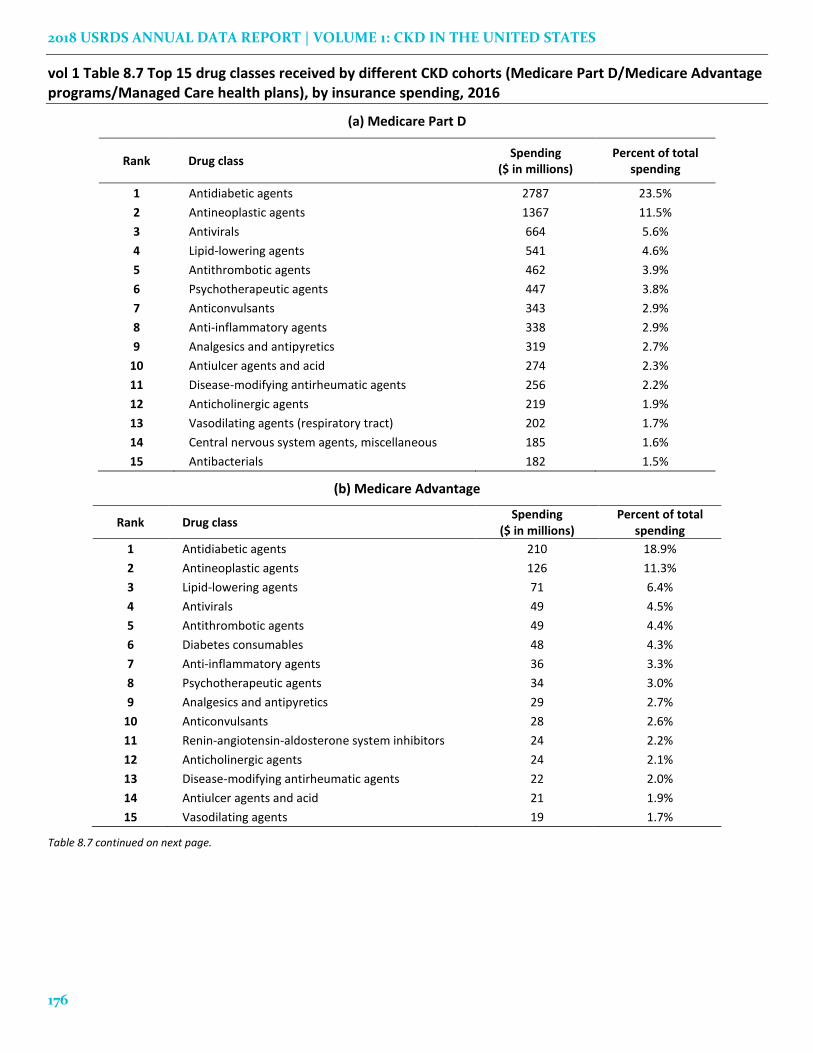
For the CKD Medicare Part D cohort, antidiabetic
agents required the greatest spending, at 23.5% of the
total for this group. For the Medicare Advantage and
managed care cohorts, antidiabetic agents accounted
for 18.9% and 23.2% of total spending. Other costly
medications include antineoplastic agents, antivirals,
and lipid-lowering agents (Table 8.7).
For an examination of the prevalence of
cardiovascular agent use among Medicare
beneficiaries, see Volume 1, Chapter 4: Cardiovascular
Disease in Patients with CKD. This chapter includes
comparisons by cardiovascular comorbidities,
procedures, and CKD status.
2018 USRDS ANNUAL DATA REPORT | VOLUME 1: CKD IN THE UNITED STATES
176
vol 1 Table 8.7 Top 15 drug classes received by different CKD cohorts (Medicare Part D/Medicare Advantage programs/Managed Care health plans), by insurance spending, 2016
(a) Medicare Part D
Rank Drug class Spending
($ in millions) Percent of total
spending
1 Antidiabetic agents 2787 23.5%
2 Antineoplastic agents 1367 11.5%
3 Antivirals 664 5.6%
4 Lipid-lowering agents 541 4.6%
5 Antithrombotic agents 462 3.9%
6 Psychotherapeutic agents 447 3.8%
7 Anticonvulsants 343 2.9%
8 Anti-inflammatory agents 338 2.9%
9 Analgesics and antipyretics 319 2.7%
10 Antiulcer agents and acid 274 2.3%
11 Disease-modifying antirheumatic agents 256 2.2%
12 Anticholinergic agents 219 1.9%
13 Vasodilating agents (respiratory tract) 202 1.7%
14 Central nervous system agents, miscellaneous 185 1.6%
15 Antibacterials 182 1.5%
(b) Medicare Advantage
Rank Drug class Spending
($ in millions) Percent of total
spending
1 Antidiabetic agents 210 18.9%
2 Antineoplastic agents 126 11.3%
3 Lipid-lowering agents 71 6.4%
4 Antivirals 49 4.5%
5 Antithrombotic agents 49 4.4%
6 Diabetes consumables 48 4.3%
7 Anti-inflammatory agents 36 3.3%
8 Psychotherapeutic agents 34 3.0%
9 Analgesics and antipyretics 29 2.7%
10 Anticonvulsants 28 2.6%
11 Renin-angiotensin-aldosterone system inhibitors 24 2.2%
12 Anticholinergic agents 24 2.1%
13 Disease-modifying antirheumatic agents 22 2.0%
14 Antiulcer agents and acid 21 1.9%
15 Vasodilating agents 19 1.7%
Table 8.7 continued on next page.

CHAPTER 8: PRESCRIPTION DRUG COVERAGE IN PATIENTS WITH CKD
177
vol 1 Table 8.7 Top 15 drug classes received by different CKD cohorts (Medicare Part D/Medicare Advantage programs/Managed Care health plans), by insurance spending, 2016 (continued)
(c) Managed Care
Rank Drug class Spending
($ in millions) Percent of total
spending
1 Antidiabetic agents 72 23.2%
2 Antineoplastic agents 43 14.0%
3 Antivirals 23 7.3%
4 Disease-modifying antirheumatic agents 16 5.1%
5 Lipid-lowering agents 15 5.0%
6 Antithrombotic agents 11 3.4%
7 Analgesics and antipyretics 9 2.7%
8 Psychotherapeutic agents 8 2.4%
9 Diabetic consumables 7 2.3%
10 Anticonvulsants 6 1.8%
11 Anti-inflammatory agents 6 1.8%
12 Immunomodulatory agents 5 1.7%
13 Renin-angiotensin-aldosterone system inhibitors 5 1.6%
14 Antibacterials 5 1.5%
15 Skin and mucous membrane agents, miscellaneous 4 1.4%
Data source: Medicare Part D claims and Optum Clinformatics™ claims. CKD patients with Medicare Part D stand-alone prescription drug plans in the Medicare 5% sample. Medicare Part D spending represents the sum of the Medicare covered amount and the Low-income Subsidy amount. Diabetic Consumables refers to blood glucose test strips, blood glucose meters/sensors, lancets, needles, pen needles etc. Abbreviations: CKD, chronic kidney disease; Part D, Medicare prescription drug coverage benefit.
Medications for Pain Management
CKD patients often experience pain, yet the various
medications for pain have different drawbacks. Non-
steroidal anti-inflammatory drugs (NSAIDs) may
induce renal function abnormalities and opioid abuse
has been a growing national problem.
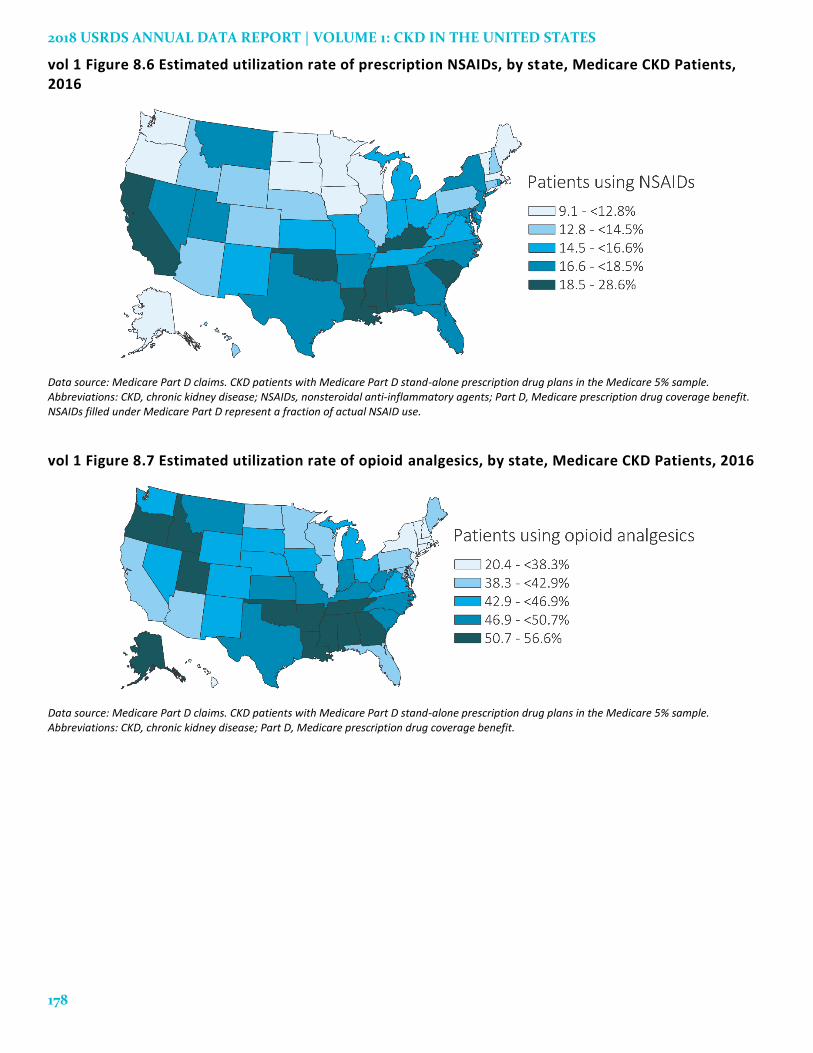
NSAIDs and opioid analgesics are two of the
primary drug classes used for pain management.
Figures 8.6 and 8.7 display the state-specific
proportion of CKD Medicare Part D beneficiaries who
were prescribed NSAIDs or opioid analgesics in 2016.
Nationally, 16.4% of these patients used
prescription NSAIDs at some time during the year.
The Southern region of the United States
demonstrated the highest proportion of use, including
Oklahoma, Alabama, Mississippi, and Louisiana. As
NSAIDs are widely available over-the-counter,
however, these findings likely underestimate the
proportions of actual NSAID use.
The national proportion of patients using opioid
analgesics was higher, at 43.8%. Greatest by-state use
occurred in the South Central region (Mississippi,
Alabama, Arkansas, Oklahoma, Louisiana and
Tennessee,) and the Mountain region (Idaho and
Utah). More than half of patients with CKD in these
states had received opioid analgesics at some point in
2016. Medication use varies by CKD stage, so results
may reflect differences in pain management strategies
by state.
2018 USRDS ANNUAL DATA REPORT | VOLUME 1: CKD IN THE UNITED STATES
178
vol 1 Figure 8.6 Estimated utilization rate of prescription NSAIDs, by state, Medicare CKD Patients, 2016
Data source: Medicare Part D claims. CKD patients with Medicare Part D stand-alone prescription drug plans in the Medicare 5% sample. Abbreviations: CKD, chronic kidney disease; NSAIDs, nonsteroidal anti-inflammatory agents; Part D, Medicare prescription drug coverage benefit. NSAIDs filled under Medicare Part D represent a fraction of actual NSAID use.
vol 1 Figure 8.7 Estimated utilization rate of opioid analgesics, by state, Medicare CKD Patients, 2016
Data source: Medicare Part D claims. CKD patients with Medicare Part D stand-alone prescription drug plans in the Medicare 5% sample. Abbreviations: CKD, chronic kidney disease; Part D, Medicare prescription drug coverage benefit.

CHAPTER 8: PRESCRIPTION DRUG COVERAGE IN PATIENTS WITH CKD
179
Antiviral Medications
In this section, we examine use of prescribed
antiviral medications in Medicare Part D enrollees and
particularly assess three main drug classes used for
antiviral management—prescription antiretrovirals,
nucleosides and nucleotides, and protease inhibitors.
These classes of agents are prescribed solely or in
combination with others to treat human
immunodeficiency virus (HIV), herpes virus
infections, hepatitis C (HCV), and hepatitis B. The
prevalence of HIV fluctuated in both CKD patients
and general Medicare beneficiaries from 2011 to 2016,
and the prevalence is slightly higher in CKD than in
the general population after 2014 (Figure 8.8.a). The
prevalence of HCV stands at 0.4%-0.5% in the general
population, while it has gone up from 0.3% in 2011 to
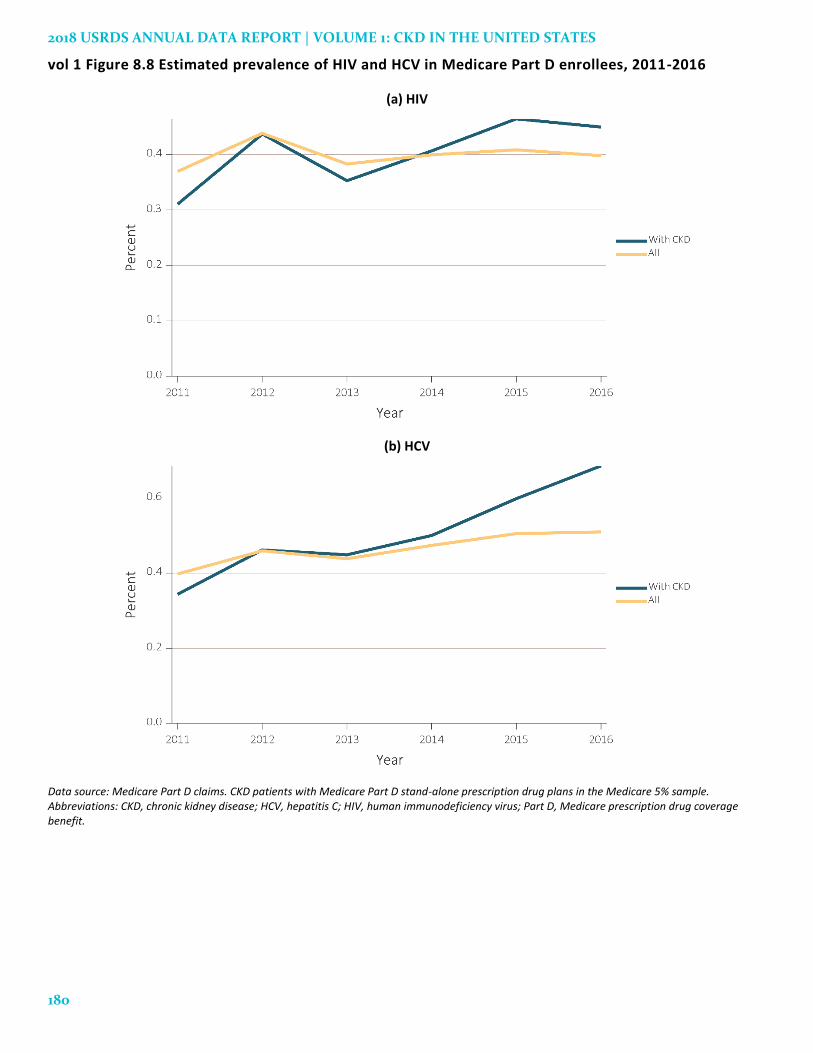
0.7% in 2016 among CKD patients (Figure 8.8.b).
Figure 8.9 displays the proportions of Medicare
Part D enrollees prescribed antivirals in 2011-2016.
There is a notable increase in use of prescription
antivirals among aged CKD patients in the past six
years, from 4.2% in 2011 to a peak of 6.5% in 2015, with
a decline to 5.0% in 2016. Antiviral use was slightly
higher among CKD patients than general Medicare
beneficiaries.
Figure 8.10 displays the PPPY Medicare Part D
spending on antivirals by CKD from 2011 to 2016. PPPY
Medicare Part D spending was $2,936 in 2011, peaking
at $5,628 in 2014, before gradually declining to $5,421
in 2016. PPPY Medicare Part D spending on antivirals
was higher among general Medicare beneficiaries than
among CKD patients over this period, except during
2016.
2018 USRDS ANNUAL DATA REPORT | VOLUME 1: CKD IN THE UNITED STATES
180
vol 1 Figure 8.8 Estimated prevalence of HIV and HCV in Medicare Part D enrollees, 2011-2016
(a) HIV
(b) HCV
Data source: Medicare Part D claims. CKD patients with Medicare Part D stand-alone prescription drug plans in the Medicare 5% sample. Abbreviations: CKD, chronic kidney disease; HCV, hepatitis C; HIV, human immunodeficiency virus; Part D, Medicare prescription drug coverage benefit.

CHAPTER 8: PRESCRIPTION DRUG COVERAGE IN PATIENTS WITH CKD
181
vol 1 Figure 8.9 Estimated utilization rate of prescription antivirals in Medicare Part D enrollees, 2011 -2016
a. All antivirals b. Antiretrovirals
c. Nucleosides and nucleotides d. Protease inhibitors
Data source: Medicare Part D claims. CKD patients with Medicare Part D stand-alone prescription drug plans in the Medicare 5% sample. Abbreviations: CKD, chronic kidney disease; Part D, Medicare prescription drug coverage benefit.

2018 USRDS ANNUAL DATA REPORT | VOLUME 1: CKD IN THE UNITED STATES
182
vol 1 Figure 8.10 Estimated PPPY Medicare Part D spending on antivirals in Medicare Part D enrollees, 2011-2016
a. All antivirals b. Antiretrovirals
c. Nucleosides and nucleotides d. Protease inhibitors
Data source: Medicare Part D claims. CKD patients with Medicare Part D stand-alone prescription drug plans in the Medicare 5% sample. Abbreviations: CKD, chronic kidney disease; Part D, Medicare prescription drug coverage benefit; PPPY, per person per year.

CHAPTER 8: PRESCRIPTION DRUG COVERAGE IN PATIENTS WITH CKD
183
References
Administration on Aging (AoA) and Administration
for Community Living (ACL). A Statistical Profile of
Older Asian Americans.
https://www.acl.gov/sites/default/files/Aging%20and%20
Disability%20in%20America/Statistical-Profile-Older-
Asian-Americans.pdf. September 2015. Accessed
September 26, 2018.
Henry J. Kaiser Family Foundation (Kaiser). Medicare
indicators: Prescription drug plans: enrollment.
http://kff.org/state-
category/medicare/prescription-drug-
plans/enrollment-prescription-drug-plans-
medicare/. Accessed May 21, 2018.
Q1 Medicare. The 2016 Medicare Part D Prescription
Drug Program. https://q1medicare.com/PartD-The-
2016-Medicare-Part-D-Outlook.php Accessed May
11, 2018.
United States Renal Data System. 2016 USRDS annual
data report: Epidemiology of kidney disease in the
United States. National Institutes of Health,
National Institute of Diabetes and Digestive and
Kidney Diseases, Bethesda, MD, 2016.

2018 USRDS ANNUAL DATA REPORT | VOLUME 1: CKD IN THE UNITED STATES
184
Notes