chapter 8 plumes jmd 031008
TRANSCRIPT

393
Chapter 8
Ion and Hall Thruster Plumes
8.1 Introduction
Electric propulsion offers advantages for many missions and applications, but like many spacecraft systems, integration of electric thrusters on spacecraft can present significant systems engineering challenges. Assessing thruster plume interactions with the spacecraft is key in determining thruster location and other spacecraft configuration issues, often requiring trades between thrust efficiency and the life of other subsystems, such as the solar arrays. Electric thruster plumes consist of energetic ions, un-ionized propellant neutral gas, low energy ions and electrons, and sputtered thruster material. Spacecraft systems engineers must account for the interaction between each of the plume components and other spacecraft systems. For north–south station keeping on geosynchronous communications satellites, by far the largest application of electric propulsion, the potential for plume impingement on solar arrays is a significant issue. As shown in Fig. 8-1, geosynchronous satellites are in a circular orbit coplanar with the Earth’s equator, with an orbital period of exactly one day. The satellite appears stationary to an observer on the Earth; however, the Earth’s equator is tilted by 28 deg with respect to the Earth’s orbit around the Sun. The plane of the Earth’s orbit is called the ecliptic plane. The Sun’s gravity pulls on a geosynchronous satellite to change the satellite’s plane toward the ecliptic. If the orbital plane were allowed to change, the satellite would appear from the ground to move north and south in the sky. Optimal communication would then require the ground-based antennas to constantly scan north and south in order to track the satellite, defeating the big advantage of geosynchronous satellites. Electric thrusters are used on satellites to counter the Sun’s pull and prevent the orbital plane from changing. This application is referred to as “north–south

394 Chapter 8
"A" Burns Dump
Momentum and
Control Inclination
"B" Burns Control Drift,
Eccentricity, and Inclination
Fig. 8-1. Illustration of the burn arcs of the ion thrusters used for electric propulsion
station keeping on Boeing satellites [1,2].
station keeping,” and Fig. 8-1 shows the Hughes/Boeing patented [1] strategy for this function. Most modern satellites are three-axis stabilized with solar arrays that rotate to keep the cells pointed toward the Sun. From a thrust perspective, north–south station keeping is accomplished most efficiently if the thrusters point in the north and south directions. In geosynchronous orbit, the solar array axis of rotation points north and south, directly in the path of plumes from north–south station-keeping thrusters. The thruster energetic ion beam would impinge on the solar arrays and quickly damage them, dramatically shortening satellite life. The usual solution is to mount thrusters such that the resultant force is in the north–south direction, but each plume is at an angle with respect to the solar array axis. The larger the angle, the greater the thrust loss for station keeping, which leads to requirements for larger thrusters and more propellant mass; the smaller the angle, the greater the array damage, which reduces satellite life. This trade between north–south thrust efficiency and solar array life requires detailed knowledge of thruster plumes and their interactions. Electric thrusters used for primary propulsion, such as those on the National Aeronautics and Space Administration (NASA) Dawn mission to the asteroid belt, can also create issues associated with plume impact on the spacecraft solar

Ion and Hall Thruster Plumes 395
arrays, exposed components, and scientific instruments. Thruster plumes and their interactions with the spacecraft must be understood and accommodated in order for the spacecraft to perform to specification for the required mission life.
8.2 Plume Physics
The thruster plume is composed of ions and electrons of various energies and some neutral gas. The energetic beam ions accelerated by the thruster fields are the dominant ion species and the major source of thrust. The velocity and angular distributions of these ions can be measured in the laboratory and calculated by the thruster computer models discussed in previous chapters. For ion thrusters, where the accelerating voltages are a thousand volts or more, the weak plume electric fields have little influence on energetic ion trajectories. In this case, the challenge is usually determining the ion trajectories from the shaped-grid accelerator structure. However, for Hall thrusters, where the accelerating voltages are a few hundred volts, the plume electric fields can significantly broaden the energetic ion plume. The second source of ions is due to charge-exchange reactions between beam ions and neutral xenon gas. The neutral gas is due to un-ionized particles leaving both the thruster and the neutralizer (hollow cathode), and, in the case of laboratory measurements, background neutrals present in the vacuum chamber. Charge-exchange reactions have usually been associated with inelastic collisions processes yielding low-energy ions at large angles with respect to the main-beam direction. However, as thruster voltages increase to provide higher specific impulse (Isp), the energy of these scattered ions can become significant. The total plume plasma density, including all three ion components, is shown schematically in Fig. 8-2 for a 4-kW Hall thruster.
8.2.1 Plume Measurements
Thruster plume characteristics have been measured extensively in the laboratory and in space on a few spacecraft. In the laboratory, most measurements have been of the ion velocities and densities, and some thruster erosion products, but not of the un-ionized neutral gas, which is in most cases dominated by background gas in the test chambers. The balance of the thruster gas flow and the speed of the test facility’s vacuum pumps determine the background gas pressure. The maximum facility pressure during high power testing is usually limited to less than 10–4 torr. Therefore, the density of un-ionized propellant from Hall and ion thrusters is greater than the background only within a few centimeters of the thruster.

396 Chapter 8
Hall Effect Thruster Fig. 8-2. Total ion density in the plume of a 4-kW Hall thruster.
The dominance of test-facility background neutral gases makes it difficult to directly measure in a laboratory the secondary plasma environment, which consists of the ions generated by charge exchange and/or elastic scattering with neutrals, that would be seen on a spacecraft. Spacecraft system engineers, therefore, use detailed models of the plume and secondary ion-generation to predict the in-flight plasma environment. These models [3–6] have been validated with flight data from a few electric propulsion spacecraft.
8.2.2 Flight Data
The first in-flight measurements of the plasma environment generated by an ion thruster were made on NASA’s Deep Space 1 (DS1) spacecraft [7]. The NASA Solar Electric Propulsion Technology Applications Readiness (NSTAR) diagnostics package that flew on DS1 included contamination monitors, plasma sensors, magnetometers, and a plasma-wave antenna. The plasma sensors and contamination monitors were mounted on the remote sensor unit (RSU) [7] as shown in Fig. 8-3. The measured plasma density was an order of magnitude lower than that measured during ground tests, but it was in good agreement with model predictions. Figure 8-4 shows a comparison of the ion fluxes

Ion and Hall Thruster Plumes 397
TGA and Ion
ThrusterRSU
DCIU
Gimbal Rings
DSEU
Fig. 8-3. Location of the remote sensor unit on DS1 with
respect to the ion thruster.
0.35
Flu
x to R
PA
(µA
)
0.30
0.25
0.20
0.15
0.10
0.05
0.0041 34 27
Mission Level
1320 6
Measured
Calculated
Fig. 8-4. Calculated and measured charge-exchange ion fluxes in
the plume of NSTAR at various operating points (from [8]).
measured during the DS1 mission by the remote sensing unit and the computed values [8]. The ion fluxes at the sensor location are primarily the result of charge exchange between beam ions and un-ionized propellant in the beam.

398 Chapter 8
m−37.7 × 10¹⁵
1.2 × 10¹⁵
1.8 × 10¹⁴
2.7 × 10¹³
4.1 × 10¹²
6.2 × 10¹¹
Fig. 8-5. EPIC model of the Express-A spacecraft showing the plume ion density profile during operation of the RT4 SPT-100 thruster (from [5]).
Measurements of the plume and secondary ions from Hall thrusters were carried out on a Russian communications satellite, Express-A3 [5]. The satellite
had instruments to measure ion fluxes both on the spacecraft body, 90 deg from the thrust direction, and on the solar arrays. These diagnostics monitored effects from the central beam over a cone with a half-angle of about 40 deg. The
Stationary Plasma Thruster (SPT)-100 Hall thruster plume calculated using the Electric Propulsion Interactions Code (EPIC) [6,8] is shown in Fig. 8-5. As was the case for ion thrusters, the measured secondary ion fluxes were an order of
magnitude less than fluxes measured in ground-based chambers, but, again, in good agreement with plume models. The accuracy of the models is illustrated in Fig. 8-6, where the current density measurements on the Express-A
spacecraft are compared with the computed values.
8.2.3 Laboratory Plume Measurements
While the flight measurements show the ability of the models to predict thruster-generated plasma environments, tests in ground-based chambers provide much more detailed measurements than those made in space. Experiments conducted by The Aerospace Corporation for the Lockheed Martin Space Systems Company on the Busek–Primex Hall Thruster (BPT-4000) provided plume data [9] for comparison with computer models. Measurements were taken using fully exposed flux probes (“uncollimated”) for

Ion and Hall Thruster Plumes 399
10,000
Curr
ent D
ensity (
µA/c
m2)
100
1,000
1
10
0.1
0 20 40
Plume Angle (deg)
60 80
Express Data
Computed (Te = 11 eV)
Computed (Te = 8 eV)
Computed (Te = 2 eV)
Fig. 8-6. Comparison of current density measurements onboard the Express-A
spacecraft and computed values (from [5]).
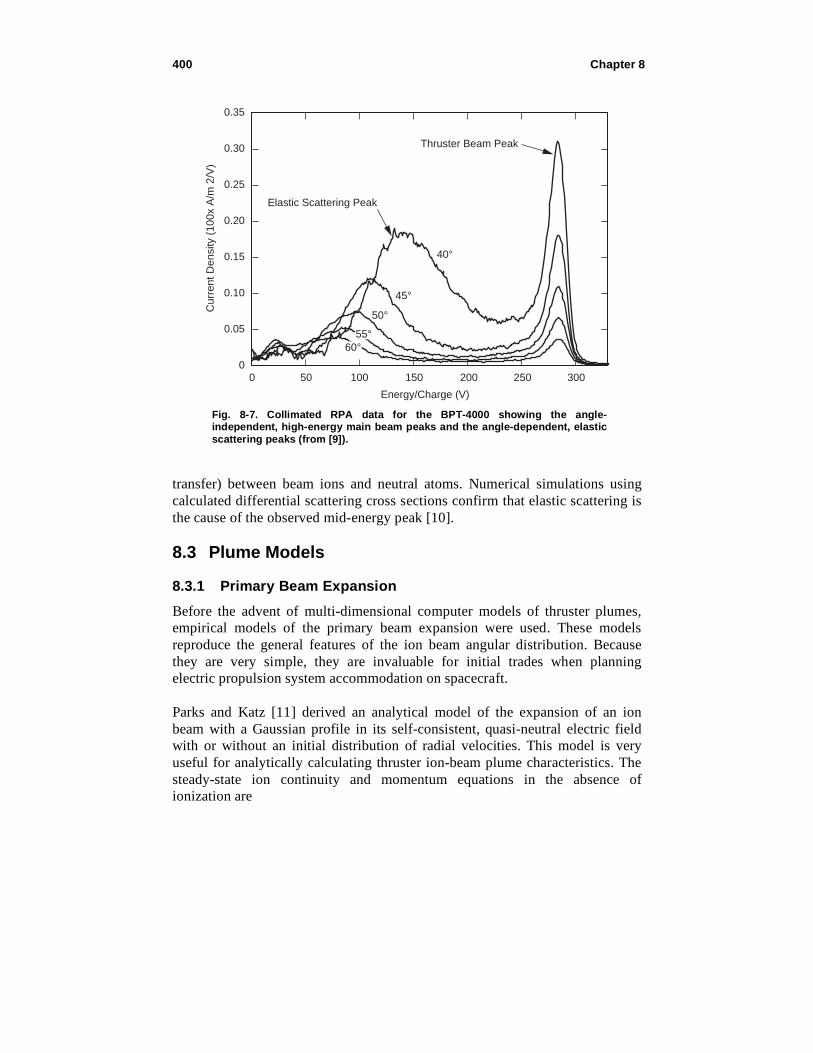
assessing the non-directional ion flux and probes inside graphite collimators (“collimated”). Figure 8-7 shows experimental data [9] from the BPT-4000 Hall thruster at a discharge power of 3 kW and voltage of 300 V using a collimator for energy spectra at different angles with respect to the thruster axis. The angle-independent, high-energy peak at E/q ~ 280 V associated with the main beam is clearly evident. Also apparent is a small-amplitude peak at the lowest energy values of the collimated spectra from the background chamber plasma. This peak was dominant in the uncollimated spectra. Figure 8-7 reveals the existence of secondary current density peaks with relatively high energies compared to the primary resonant charge exchange peak. For example, at an angle of 40 deg, the energy associated with the second maximum is approximately 150 eV. These observed ion-flux crests show a marked energy dependence on angle. In an ideal elastic collision between a moving sphere and an identical stationary sphere, the magnitude of the final velocity for each sphere is proportional to the cosine of the angle between its final velocity and the initial velocity of the moving sphere, and the sphere’s kinetic energy varies with the square of the cosine. Because the retarding potential analyzer (RPA) data in Fig. 8-7 show a peak with energy dependence given roughly by Eb cos2 lab , where Eb is the
main ion beam energy and lab is the angle with respect to the thruster axis,
these peaks have been attributed to simple elastic scattering (momentum
400 Chapter 8
55°60°
0.35
Curr
ent D
ensity (
100x A
/m 2
/V)
0.30
0.25
0.20
0.10
0.15
0
0.05
0 50 100 150
Energy/Charge (V)
200
Elastic Scattering Peak
Thruster Beam Peak
250 300
40°
45°
50°
Fig. 8-7. Collimated RPA data for the BPT-4000 showing the angle-independent, high-energy main beam peaks and the angle-dependent, elastic
scattering peaks (from [9]).
transfer) between beam ions and neutral atoms. Numerical simulations using calculated differential scattering cross sections confirm that elastic scattering is the cause of the observed mid-energy peak [10].
8.3 Plume Models
8.3.1 Primary Beam Expansion
Before the advent of multi-dimensional computer models of thruster plumes, empirical models of the primary beam expansion were used. These models reproduce the general features of the ion beam angular distribution. Because they are very simple, they are invaluable for initial trades when planning electric propulsion system accommodation on spacecraft. Parks and Katz [11] derived an analytical model of the expansion of an ion beam with a Gaussian profile in its self-consistent, quasi-neutral electric field with or without an initial distribution of radial velocities. This model is very useful for analytically calculating thruster ion-beam plume characteristics. The steady-state ion continuity and momentum equations in the absence of ionization are

Ion and Hall Thruster Plumes 401
( m v) = 0 (8.3-1)
( m vv) = p, (8.3-2)
where the mass density, m , is the product of the ion number density and the
ion mass. Assuming the beam has cylindrical symmetry, the axial beam velocity remains constant everywhere and the axial derivative of the pressure can be neglected compared with its radial derivative. The ion continuity and momentum equations can then be rewritten as
1
r r(r m vr ) +
( m vz )
z+ = 0 (8.3-3)
vrvr
r+ vz
vr
z=
1
m
p
r. (8.3-4)
The second equation was obtained from the momentum equation by using the continuity equation to eliminate derivatives of the density. The pressure term is assumed to be the constant temperature electron pressure
p = n k Te . (8.3-5)
Using the assumption of constant axial velocity, the axial distance, z, can be replaced by the product of the beam velocity, vz , and t, the time since the beam
left the thruster:
z = vz t . (8.3-6)
The axial derivative can be replaced with a time derivative:
z
=1
vz t. (8.3-7)
Equations (8.3-3) and (8.3-4) can then be rewritten as
1
r r(r m vr ) +
m
t= 0 (8.3-8)
vrvr
r+
vr
t=
1
m
p
r. (8.3-9)

402 Chapter 8
These approximations are quite good if the axial velocity is much greater than both the initial radial velocities and the ion sound speed. With the assumption that the ion beam profile starts out and remains a Gaussian profile, the set of equations can be solved analytically. The beam profile is written as
m (r)=o
h(t)2exp
r2
2 R2h(t)2, (8.3-10)
where the initial ion beam mass density, o , is
o =M Ib
2 vb R2, (8.3-11)
and the function h(t) describes how the beam expands radially. The
parameter R is chosen to best represent initial beam width, and the initial value of the expansion parameter h(0) is unity. The density spreads out as the beam moves axially, but the beam profile remains Gaussian, as shown in Fig. 8-8. An ion that starts out at a radial position ro will move radially outward
proportionally to h(t) :
r(ro , t) = ro h(t). (8.3-12)
This implies that the radial velocity, vr , is proportional to the time derivative
of h(t) :
vr (r, t) = ro h(t). (8.3-13)
Equations (8.3-12) and (8.3-13) can be combined to obtain an expression for the local velocity that doesn’t use the initial radial position:
vr (r,t) = r˙ h (t)
h(t). (8.3-14)
The solution obtained below is valid for a beam with no initial radial velocity, or for an initial radial velocity distribution that is proportional to the radius:
vr (r,0) = vr0 r . (8.3-15)

Ion and Hall Thruster Plumes 403
h = 1.0
h = 1.5
h = 2.0
Vz
Fig. 8-8. The Gaussian beam density profile broadens as ions move
downstream from the thruster exit plane.
The density, defined by Eq. (8.3-10), and the radial velocity, defined in Eq. (8.3-15), both satisfy the ion continuity equation, Eq. (8.3-8), for any function h(t) . The first term in Eq. (8.3-8) then becomes
1
r
(r m vr )
r=
1
r rr2 h
h m = 2h
h
r2 h
R2 h2 m , (8.3-16)
and the second term in Eq. (8.3-8) becomes
m
t= 2
˙ h
h+
r2 ˙ h
R2h2
m . (8.3-17)
Making the same substitutions into the momentum equation, Eq. (8.3-9), an equation for h(t) is obtained that is independent of the radius:
vrvr
r+
vr
t=
1
m
p
r
rh
h rr
h
h+
tr
h
h=
eTe
M m
m
r
rh2
h2+ r
h2
h2+ r
h
h=
eTe
M m
r
R2 hm
hh =kTe
M R2=
vB2
R2, (8.3-18)

404 Chapter 8
where vB is the Bohm velocity. In Eq. (8.3-18), the right-hand side is a
constant. This equation can be integrated by the usual substitution of a new function w = dh / dt for the time derivative of h:
˙ ̇ h =d
dt˙ h =
dw
dt=
dw
dh
dh
dt= w
dw
dh. (8.3-19)
Using this, Eq. (8.3-18) can be rewritten as
wd w
d h=
vB2
R2 h. (8.3-20)
Integrating once yields
w dwh(0)
h(t )=
vB2
R2 h1
h(t )dh . (8.3-21)
Writing this expression in terms of h and its time derivative gives
12
h2=
vB2
R2lnh +
12
h2 (0) . (8.3-22)
Taking the square root and integrating again, an equation relating h to time is obtained. For the case of no initial radial velocity, ˙ h (0) = 0 , the time derivative of h is
˙ h =vB
R2ln h . (8.3-23)
Equation (8.3-23) can be rewritten and integrated to give
dh
ln h=
vB
R2l dt (8.3-24)
dx
ln x1
h= 2
vB
Rdt =
0
t2
vB
Rt . (8.3-25)
An approximate numerical solution of Eq. (8.3-25) for the expansion parameter, h, is given by
h 1.0 + 0.6524 + 0.0552 2 – 0.0008 3, (8.3-26)

Ion and Hall Thruster Plumes 405
where is given by
2vB
Rt. (8.3-27)
These expressions describe the beam expansion for the case of no initial radial velocity or for an initial radial velocity distribution that is proportional to the radius. Examples of schematic beam profiles as a function of distance from the thruster were given in Fig. 8-8. For the case of an initial radial velocity profile, the integral in Eq. (8.3-25) is
h0 t = 1+ 2vB
2
R2 h02
ln x
1/2
dx1
h, (8.3-28)
where the integral has to be calculated numerically. Park’s model has been extended by Ashkenazy and Fruchtman [12] to include thermal gradient and two-dimensional effects. The Park’s formula is very similar to an empirical formula developed earlier by Randolph for Hall thrusters [13]. Randolph’s formula has two Gaussians but does not have the curved trajectories of the Park’s formula. The four parameters, k0 through k3 , in Randolph’s formula are chosen to fit plume
measurements:
j =R2
r2k0 exp
(sin )2
k12
+ k2 exp2
k32
. (8.3-29)
While the analytical expressions above are invaluable for estimating plume interactions, multi-dimensional computer models are normally used for detailed calculations. There is general agreement on the physics that control the expansion of the main ion beam from ion and Hall thrusters, but there are differences in the numerical algorithms used to calculate the expansion. Several researchers [3,4] employ particle-in-cell (PIC) algorithms, where the beam is modeled as a collection of macro-particles with each particle representing a large number of ions. The velocity and acceleration of each particle are followed in the self-consistently calculated electric field. Another approach, which is much less computationally intensive, is to model the thruster beam as a drifting fluid of cold ions and warm electrons. In this method, the expansion of the fluid-like ion beam is calculated using a Lagrangian algorithm [5,6]. The ion beam profile for the Nuclear Electric

406 Chapter 8
5
z (
m)
4
3
2
1
0
−4−5 −2
20-kW Ion
Thruster
−1
m−3
−3r (m)
1
4.2 × 10¹⁵
2.5 × 10¹⁵
1.4 × 10¹⁵
8.4 × 10¹⁴
4.9 × 10¹⁴
2.9 × 10¹⁴
1.7 × 10¹⁴
9.9 × 10¹³
6.8 × 10¹³
3.4 × 10¹³
2.0 × 10¹³
2 3 4 5
Fig. 8-9. Calculated primary ion beam density profile for the 20-kW NEXIS ion
thruster [14].
Xenon Ion System (NEXIS) ion thruster [14] calculated using this algorithm is shown in Fig. 8-9. The primary beam is assumed to be composed of a collisionless, singly ionized, quasi-neutral plasma expanding in a density-gradient electric field. The electron drift velocity is small compared to the electron thermal speeds, so momentum balance for the electrons can be written as
med ve
d t=e pe = 0, (8.3-30)
where ve , , and pe are the electron velocity, electric potential, and electron
pressure, respectively. Assuming an ideal gas electron pressure, the potential follows the barometric law,
=kTe
eln
ne
n, (8.3-31)
where Te is the electron temperature, ne is the plasma density ( ne = ni ), and
n is a reference plasma density. The plume is also assumed to be isothermal.
This is a better approximation for space conditions than for the laboratory, where inelastic collisions with background neutrals will tend to cool the electrons. In this model, ions are assumed to be very cold compared with the electrons ( pi 0 ), and their acceleration to be dominated by the electric field:

Ion and Hall Thruster Plumes 407
MD vi
D t= e . (8.3-32)
Since the drift velocity of the ions is much greater than their thermal velocity, the high-velocity ions are modeled as a fluid, with a velocity of vi . The
governing equations, solved in two-dimensional (2-D) (R–Z) geometry, are conservation of mass and momentum:
nvi = 0
Mvi nvi = en . (8.3-33)
The accuracy of the algorithm has been confirmed by comparisons of analytical solutions with model problems in one and two dimensions [8]. The Lagrangian modeling approach leads to reduced numerical noise as compared with PIC algorithms. However, unlike PIC algorithms, the fluid technique ignores spreading of the beam due to ion temperature and, in the case of ion thrusters, the angular distribution coming out of each grid aperture.
8.3.2 Neutral Gas Plumes
The neutral gas density in a laboratory vacuum chamber has three components: gas from the thruster, gas from the neutralizer hollow cathode, and the background chamber density. To model the neutral gas density, the gas from ion thrusters can be approximated by isotropic emission from a disk with the diameter of the grid:
na ~cos
r2. (8.3-34)
For Hall thrusters, the neutral gas density can be approximated using an annular anode gas flow model with isotropic emission from the channel. This is done by calculating emissions from two disks, one large and one smaller, and subtracting the smaller from the larger. The neutral density drop-off with r and z from a disk emitting a Maxwellian distribution is calculated using an approximate view factor. Energetic charge-exchange (CEX) neutrals are negligible compared to the total neutral density and therefore are not included when modeling the neutral gas density. For plume models, the neutral gas from the neutralizer hollow cathode is usually assumed to be from isotropic emission at a constant temperature equal to the neutralizer cathode orifice temperature. While the neutralizer is offset from the thruster axis of symmetry, in cylindrical 2-D codes there are an equal number of points from the thruster axis closer to and farther from the
408 Chapter 8
Ne
utr
al P
art
icle
De
nsity (
m−3
)
0.00 0.10 0.20
Distance Downstream of Thruster Exit (m)
0.30 0.40
Total
Chamber
Hall Thruster
Hallow Cathode
4 × 10¹⁸
2 × 10¹⁸
0
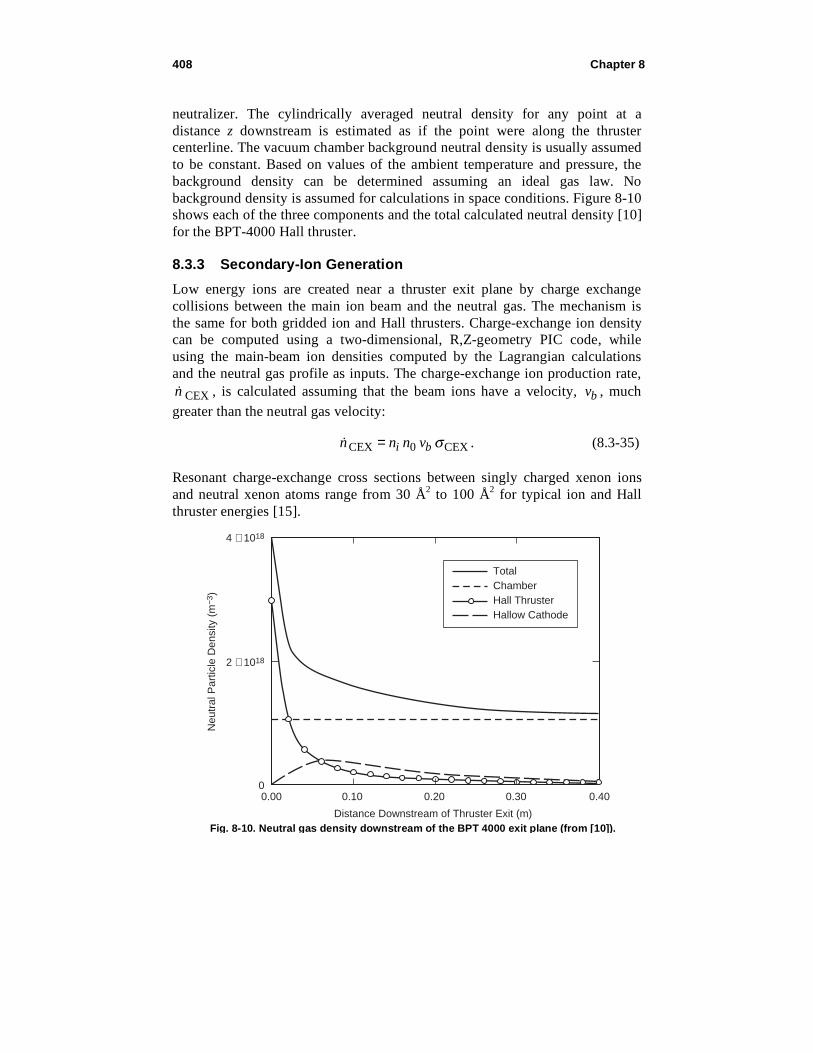
Fig. 8-10. Neutral gas density downstream of the BPT 4000 exit plane (from [10]).
neutralizer. The cylindrically averaged neutral density for any point at a distance z downstream is estimated as if the point were along the thruster centerline. The vacuum chamber background neutral density is usually assumed to be constant. Based on values of the ambient temperature and pressure, the background density can be determined assuming an ideal gas law. No background density is assumed for calculations in space conditions. Figure 8-10 shows each of the three components and the total calculated neutral density [10] for the BPT-4000 Hall thruster.
8.3.3 Secondary-Ion Generation
Low energy ions are created near a thruster exit plane by charge exchange collisions between the main ion beam and the neutral gas. The mechanism is the same for both gridded ion and Hall thrusters. Charge-exchange ion density can be computed using a two-dimensional, R,Z-geometry PIC code, while using the main-beam ion densities computed by the Lagrangian calculations and the neutral gas profile as inputs. The charge-exchange ion production rate,
n CEX , is calculated assuming that the beam ions have a velocity, vb , much
greater than the neutral gas velocity:
nCEX = ni n0 vb CEX . (8.3-35)
Resonant charge-exchange cross sections between singly charged xenon ions and neutral xenon atoms range from 30 Å2 to 100 Å2 for typical ion and Hall thruster energies [15].

Ion and Hall Thruster Plumes 409
(m)
1.0
LC LC
0.8
0.6
0.4
0.2
1.0
Total Ion Density
0.8
0.6
0.4
0.2
0.0 0.2 0.4 0.6
(m)
(a) Space
CEX Ion Current = 0.74 A
0.8 1.0 0.0 0.2 0.4 0.6
(m)
(b) Laboratory
CEX Ion Current = 5.26 A
0.8 1.0
2 × 10¹⁸
1 × 10¹⁸
5 × 10¹⁷
2 × 10¹⁷
1 × 10¹⁷
5 × 10¹⁶
2 × 10¹⁶
1 × 10¹⁶
5 × 10¹⁵
2 × 10¹⁵
5 × 10141 × 1015
5 × 10¹³
1 × 10¹³
5 × 10¹²
2 × 10¹⁴
1 × 10¹⁴
2 × 10¹³
Fig. 8-11. Hall thruster plume maps for (a) space and (b) laboratory and conditions showing dominance of background density in the charge-exchange plume production (from [10]).
The charge-exchange ion density is calculated by tracking particle trajectories in density-gradient electric fields using a finite-current barometric law for the electron density (electron current equals ion current). Poisson’s equation is solved on a finite element grid and iterated until steady-state CEX densities and density-gradient potentials are self-consistent. Comparisons of the CEX plume model with flight data from the NSTAR’s ion engine exhibited good agreement [8]. Figure 8-11 shows plume maps at one meter, calculated using this method for the BPT-4000 under both laboratory and space conditions. The CEX density in the laboratory is found to be more than one order of magnitude greater than it is in space due to the dominance of the background neutral gas in the chamber. With the exception of the neutral gas density, all the terms in the expression for charge-exchange ion generation [Eq. (8.3-6) above] are identical for the laboratory and space. Figure 8-10 showed that at distances greater than about a tenth of a meter downstream of the thruster exit plane, the chamber gas density is much greater than the gas coming directly from the thruster, resulting in greater charge-exchange ion generation. The computed total ion current in the laboratory case (5.3 A) is in approximate agreement with measurements of the integrated ion current (5–6 A for collector potential of 20 V) [9]. The calculations assumed a charge-exchange cross section for 300-V ions of 55 Å2 based on the calculations and measurements by Miller [15].

410 Chapter 8
The distinctive second peak in the energy spectra captured by the collimated retarding potential analyzer (RPA) data shown in Fig. 8-7 is from elastic scattering of xenon ions by neutral xenon atoms. Mikellides et al. [10] have
calculated differential cross-section data for elastic Xe+ Xe scattering in a center-of-mass frame of reference. The calculations involve averaging over the
pertinent Xe2+ potentials, without inclusion of charge exchange. The results are
then subsequently corrected for charge exchange. The derived, center-of-mass differential cross sections were converted to values in a fixed frame of reference relative to the laboratory and implemented in the plume model. For comparisons with RPA measurements, the flux of scattered ions is ,
is =
Ibno
d2d
d0
xd
Ibno xc
d2d
d,
(8.3-36)
was computed at a radius of 1 m (the RPA location). In Eq. (8.3-36), Ib and
no are the main-beam ion current and neutral density, respectively. The
dimension xc is the characteristic length of the beam column and d is the radial
distance between the thruster and the RPA. The differential contribution due to the column element along the beam is denoted by d , and d / d is the
differential cross section. The results from the complete calculation, compared with data, are shown in Fig. 8-12. Plotted in the figure are the results of the calculations of the expanding beam ions, and the beam and scattered ions combined. Also plotted are the ion current probe data for four bias levels of 50 V and 100 V. The probe bias potential prevents lower energy ions from being collected. As expected, the beam-only values compare best with the ion probe biased to 100 V, since, at this value, most of the scattered and charge-exchanged ions are excluded. The calculation combining beam and elastic scattering compares well with 50 V-biased probe data since these data include most of the elastically scattered ions.
8.4 Spacecraft Interactions
In order to design a spacecraft to accommodate electric thrusters, it is necessary to understand how the thruster plumes interact with the spacecraft and its

Ion and Hall Thruster Plumes 411
Ion
Cu
rre
nt
(A/m
2)
100
0.001
0.1
0.01
1
10
0.0001
0 20 40
Angle (deg)
Lab E > 100
Lab E > 50
60 80 9010 30 50 70
Beam
Beam+Scatter
Ion Flux > 100 V
Ion Flux > 50
Fig. 8-12. Comparison of high-energy ion current between the calculations and
measurements for the BPT-4000 (from [10]).
payloads. Thruster plumes affect the spacecraft immediately during their operation, for example, by momentum transfer from plume impingement or optical emissions and by slow, cumulative processes, such as ion erosion of spacecraft surfaces or contamination of surfaces by materials generated by thruster wear. The immediate interactions may affect spacecraft operations; the longer-term interactions may affect spacecraft life. Unique to electric propulsion is the interaction between the thruster plumes and the spacecraft electrical system, in particular the solar arrays. Electric thruster plumes are composed of charged particles and can carry currents between the thruster electrical power system and exposed electrical conductors such as solar array cell edges and interconnects. While the currents that flow through the thruster plumes are in general quite small, they may cause changes in subsystem potentials. These potential changes, if not anticipated, may be mistaken for system anomalies by spacecraft operators. As described in previous sections, while most of the plume is in the thrust direction, a small fraction of the thruster exhaust is emitted at large angles. The large-angle component is mostly composed of low-velocity particles. Some high-energy ions in Hall thruster plumes can be found at angles greater than 45 deg, but at such a low flux density that they will have little impact on spacecraft life. Techniques for quantitatively calculating the effects of thruster plumes on spacecraft are presented in the following sections.

412 Chapter 8
8.4.1 Momentum of the Plume Particles
Just as with chemical thrusters, when electric thruster plumes impact spacecraft surfaces, they exert a force, which causes a torque on the spacecraft. The force is easily calculated as the difference in momentum between the plume particles that impact the surface and the momentum of particles that leave the surface. The momentum of the plume particles is the sum of the ion and neutral atom fluxes. Since the plume consists primarily of ions, and the velocity of the ionized particles is much greater than the neutral atoms, the neutral component can usually be neglected. The ion momentum is
pi = ni M Xe vi , (8.4-1)
and the neutral momentum is
po = no M Xe vo , (8.4-2)
so that the total plume momentum is
pplume = pi + po pi . (8.4-3)
In one extreme, an ion that impacts a surface may scatter elastically and leave the surface with its kinetic energy unchained, but its velocity component normal to the surface is reversed:
psurfaceelastic n = 2 pplume n . (8.4-4)
In the other extreme, the incident xenon ion resides on the surface long enough to transfer its momentum and energy to the surface, and the particle leaves the surface with a velocity distribution corresponding to the surface temperature. This process is called accommodation, and the fraction of particles that undergo this process is called the accommodation coefficient. Since spacecraft surfaces are typically less than a few hundred degrees kelvin, the velocities of accommodated atoms are orders of magnitude less than energetic thruster ions. For example, the speed of a xenon atom leaving a 300-K surface is
vi (300 K) =kT
M= 137 m / s[ ], (8.4-5)
while the speed of a beam ion from a 300-V Hall thruster is

Ion and Hall Thruster Plumes 413
vb (300 eV) =2 eV
M= 22,000 m / s[ ]. (8.4-6)
Because the thermal speeds are so small compared with the beam speeds, the momentum of re-emitted surface-accommodated ions can be ignored when calculating surface torques. The momentum transfer per unit area is approximated by
F = (2 Ac )pplume, (8.4-7)
where Ac is the surface accommodation coefficient, which has a range of
values from 0 to 1. Flight data from the Express-A satellite show that accommodation coefficients for Hall thruster ions on the solar arrays were close to unity [5].
8.4.2 Sputtering and Contamination
A major concern for implementing ion thrusters on Earth-orbiting satellites is that energetic ions from the thruster beam will erode spacecraft surfaces. As discussed above, north–south station keeping with body-mounted thrusters invariably leads to high-energy ions bombarding some part of the solar arrays. When these high-energy ions impact the solar arrays or other spacecraft surfaces, they can cause erosion by sputtering atoms. However, with proper placement and orientation of the thrusters, and the use of stay-out “zones” during which the thrusters are not operated because the plume would impinge on the array, the ion flux can be small enough to keep electric thrusters from limiting satellite life. Whether a given surface erodes or accumulates material depends on the relative rates of sputtering and the deposition of sputter deposits. The deposits result from erosion products from the thruster itself, as well as material sputtered from other spacecraft surfaces. Sputtering affects spacecraft in two ways. First, spacecraft surfaces can erode by sputtering or be contaminated by the buildup of sputtering products. Primary thruster beam ions are the principal source of sputtering, and spacecraft surfaces within a narrow cone angle of the thrust direction will erode significantly due to ion sputtering. The cone angle where sputtering is important depends on the specific thruster and is usually narrower for ion thrusters than for Hall-effect thrusters. For example, the NEXIS ion thruster primary-beam plume, shown in Fig. 8-9, has a half-angle for all particles of only about 20 deg and 95% of the particles are within a 10-deg half angle. Second, while ion and Hall thrusters typically use an inert gas propellant, both types of thrusters can contaminate spacecraft surfaces. The sources of

414 Chapter 8
contamination are thruster material sputtered by energetic ions, as well as spacecraft material sputtered by the main thruster beam. In ion thrusters, sputter erosion of grid material not only limits thruster life, but the sputtered grid material may be a significant source of contamination to spacecraft surfaces. This was recognized early in the development of commercial ion thrusters [16], and as a result, a third grid was added to reduce the amount of sputtered grid material coming from the thruster and to shield the spacecraft from grid sputter products. The third grid has the added benefit of dramatically reducing the grid sputter rate by preventing charge-exchange ions made downstream of the third grid from hitting the accelerator grid [17]. For ion thrusters with metal grids, the problem of contamination in the absence of a third grid can be quite important. Only a few monolayers of a metallic contaminant can make large changes to the optical, thermal, and electrical properties of spacecraft surfaces. For Hall thrusters, the situation can be quite different. The plume from Hall thrusters normally has about twice the angular divergence of an ion thruster, and so sputtered thruster material comes out at large angles. However, early in life most of the contamination comes from sputter erosion of the ceramic channel wall. Although this can produce a substantial flux of sputter products, the products are mainly insulating molecules. Deposition of sputtered insulators, such as Hall-thruster channel ceramic or solar-cell cover glass materials, has little effect on the spacecraft surface optical and thermal properties. More problematic is the sputtered metallic material from the late life erosion of Hall-thruster magnetic pole pieces. In the same manner as with ion thrusters, very thin layers of the deposited metal can radically change the properties of spacecraft surfaces. One effect discovered with Hall thrusters, but common to both ion and Hall thrusters, is that surfaces can experience net deposition of sputter products or can be eroded away by energetic beam ions, depending on their location with respect to the thruster ion beam [13]. As shown in Fig. 8-13, the plume of sputtered products coming from the thruster is normally much narrower than the main ion beam. For surfaces at small angles with respect to the thrust vector, sputtering from the beam ions is greater than the deposition of thruster erosion molecules. These surfaces will erode over time. However, surfaces located at large angles to the thruster vector are contaminated by thruster erosion products faster than they can be sputter away by energetic beam ions. Over time, sputtered thruster material will accumulate on these surfaces. For the SPT-100 Hall thruster, the dividing line between erosion and deposition is about 65 deg [13].

Ion and Hall Thruster Plumes 415
Net Sputtering
Thruster
Ion Beam Plume
Contamination Plume
VectorT
hru
ste
r
Net
Deposition
Fig. 8-13. Sputtering by main beam ions dominates at angles close to the thrust
vector direction; deposition of thruster erosion products occurs at angles far from the thrust direction.
Besides thruster erosion products, the other source of contamination is spacecraft surface material sputtered by thruster beam ions. Computer codes, such as the Electric Propulsion Interactions Code (EPIC) [6], are used to calculate the erosion and redeposition over the entire spacecraft. EPIC is an integrated package that models the interactions between a spacecraft and its electric propulsion system. The user provides EPIC with spacecraft geometry, surface materials, thruster locations, and plume parameters, along case study parameters such as orbit and hours of thruster operation. EPIC outputs thruster plume maps, surface interactions on the three-dimensional (3-D) spacecraft, one-dimensional (1-D) plots along surfaces (e.g., erosion depth on a solar array as a function of distance from the thruster), and integrated results over the duration of the mission (e.g., total induced torque in a given direction, total deposition of eroded material at a specific location on the spacecraft). Figure 8-14 shows results of a sample EPIC calculation for the Express-A spacecraft during firing of one its four stationary plasma thrusters. The calculation shows both sputter erosion and deposition depths. The thruster erodes the solar array surface that is along the thruster direction. Some of the eroded material deposits on other spacecraft surfaces.
8.4.3 Plasma Interactions with Solar Arrays
Ion and Hall thruster plasma plumes connect thrusters electrically to the exposed spacecraft conducting surfaces. It is important to account for current paths through the plasma to prevent current loops or unintended propulsion system floating potentials. In order to understand the plasma currents and floating potentials between the electric propulsion system and the rest of the spacecraft, first consider the thruster external cathode as the source of the plasma. As discussed in

416 Chapter 8
1.0
−1.0
−3.0
−5.0
−7.0
−9.0
µm
Fig. 8-14. Contours of the erosion (negative numbers) and deposition depths
(positive numbers) due to sputtering during operation of the SPT-100 Hall thruster onboard the Express-A spacecraft. The calculation was performed with EPIC [6].
Chapter 6, the sheath drop internal to a hollow cathode and orifice resistive heating produce energetic electrons that ionize the propellant gas and generate plasma. The combined insert and orifice potential drops are typically between 10 and 15 V, causing the external plasma to be about the same value above cathode common, as illustrated in Fig. 8-15. The hollow cathode–generated plasma has an electron temperature of about 2 eV, typical of many laboratory plasmas. The spacecraft acts as a Langmuir probe in the thruster plume plasma and will float to a potential where the ion and electron currents from the plasma cancel. As discussed in Chapter 3, plasma electron velocities are much higher than ion velocities, so current balance is achieved by repelling most of the plasma electrons. This balance occurs when the surface is a few times the electron temperature negative of the local plasma potential. If the electric propulsion system were isolated from spacecraft ground by a very high impedance, cathode common would float around 10 V negative with respect to spacecraft ground, as illustrated in Fig. 8-16. When the spacecraft has exposed surfaces at different voltages, predicting the cathode common floating potential is more difficult. An extreme case would be if the spacecraft solar arrays had a large area at high positive voltage immersed in the thruster plume. Then, to achieve current balance, the high-voltage area would be close in potential to the thruster plume plasma. For example, assume that the spacecraft had 100-V solar arrays. Since the cathode common is only

Ion and Hall Thruster Plumes 417
Cathode Common
0 V
Hollow
Cathode
Thruster Plume Plasma
+15 V
Fig. 8-15. The thruster neutralizer hollow cathode generates a plasma typically 10 to 20 V above the cathode common.
Cathode Common
0 V
Hollow
Cathode
Thruster Plume Plasma
+15 V
−10 V
Spacecraft
Fig. 8-16. The cathode common would float on the order of 10 V
negative on a spacecraft with a conducting surface.
about 10 V negative with respect to the thruster plume plasma, cathode common would be 90-V positive compared to spacecraft ground, as illustrated in Fig. 8-17. On operational spacecraft, cathode common will float somewhere between the two extremes, –15 V to 90 V, depending on the array construction, and may vary with orientation and season. Cathode common potential can be held at a fixed potential with respect to spacecraft chassis ground by tying the electric propulsion system circuit ground to spacecraft ground with a resistor. Plasma currents collected by exposed spacecraft surfaces will flow through the resistor. These currents can be limited by reducing the exposed conducting area in the thruster plumes. The plasma currents are usually quite small. For example, if the charge-exchange plasma plume density 1 meter from the thruster axis is

418 Chapter 8
Spacecraft
Cathode Common
0 V
Hollow
Cathode
Thruster Plume Plasma
+15 V
+100 V
0 V
+90 V
Solar
Array
Fig. 8-17. A large area of high voltage solar array exposed to the
thruster plume causes the cathode common to float the order of the array voltage positive of spacecraft chassis ground.
~1014 m–3, a square meter of exposed conducting area would collect only a few milliamperes of electron current. A kilo-ohm resistor could clamp cathode common within a few volts of spacecraft ground.
8.5 Interactions with Payloads
8.5.1 Microwave Phase Shift
Electromagnetic waves interact with plasmas, particularly if the wave frequency is on the order of or lower than the plasma frequency along its path of propagation. In most spacecraft applications, the communications and payload frequencies are so high (>1 GHz) that there is little effect. For a typical thruster, the plume density drops below 1015 m–3 less than a meter from the thruster, and then it drops even more rapidly at greater distances. The plasma frequency at this density about 1 meter from the thruster, from Eq. (3.5-24), is 285 MHz. As a result, microwave signals with frequencies below a few hundred megahertz could be affected by the thruster plasma plume. However, even at higher frequencies, highly directional antenna patterns should be analyzed for possible distortion by small phase shifts caused by the plasma. A plane wave

Ion and Hall Thruster Plumes 419
with frequency f passing through a plasma with density ne will undergo a
phase shift according to the following formula:
f
c
ne
ncd
0
L, (8.5-1)
where c is the speed of light and nc is the critical density at which the plasma
density has a plasma frequency equal to the microwave frequency. Since the plasma density drops rapidly with distance from the thruster, the scale length over which the plasma frequency is comparable to the wave frequency is usually small.
8.5.2 Plume Plasma Optical Emission
The optical emissions from ion and Hall thrusters are very weak but can be measured by sensitive instruments. The only in-space measurement of the optical emissions from a xenon plasma plume generated by an electric propulsion device is from a shuttle flight that had a “plasma contactor” as part of the Space Experiments with Particle Accelerators (SEPAC) [18] flown on the NASA Space Shuttle Mission STS-45. The “plasma contactor” was actually a Xenon Ion Propulsion System (XIPS) 25-cm thruster without accelerator grids or a neutralizer hollow cathode. Plasma and electron current from the discharge chamber were allowed to escape into space, unimpeded by an ion accelerator grid set. The absolute-intensity optical emission spectrum measured in space of the xenon plasma plume from the operating plasma source is shown in Fig. 8-18. The spectrum was measured by the Atmospheric Emissions Photometric Imaging (AEPI) spectrographic cameras. The source was the SEPAC plasma contactor [18,19] that generated about 2 A of singly-charged xenon ions in a ring-cusp discharge chamber. The plasma density was about 1017 m–3, and its temperature was about 5 eV. Upon leaving the discharge chamber, the quasi-neutral plasma expanded into the much less dense surrounding ionosphere. The spectrum was taken about 15 meters from the contactor plume, focusing on the plume about 1.5 m downstream of the contactor exit plane. The apparent broadness of the lines is due to the spectrograph’s relatively wide slit [20]. Optical emissions from the SEPAC plasma contactor are higher than the emissions expected from a similarly sized ion thruster for two reasons. First, the plasma contactor ion density is higher since the contactor ions are traveling about a quarter as fast as thruster beam ions. Second, the electrons in the SEPAC plasma contactor plume originate in the discharge chamber and are much hotter than the neutralizer cathode electrons in an ion thruster plume,

420 Chapter 8
Rayle
igh/A
ngstr
om
Wavelength (nm)
30
20
10
0
600580560540520500480460
Fig. 8-18. Visible xenon spectra from the SEPAC plasma contactor observed by the AEPI hand-held camera during Shuttle Mission STS-45 (from [20]).
5 eV versus 2 eV. As a result, the absolute magnitude of the spectrum in Fig. 8-18 is about 2 orders of magnitude more intense than one would expect from an operating ion thruster. The source of the strong visible lines in the xenon spectrum is interesting. Visible emissions from states with allowed transitions to ground contribute very little to the total observed visible spectra. Most of the visible emissions originate from states that do not have allowed transitions to ground. The reason for this is that an optically allowed transition to ground is typically a thousand times more probable than a transition to another excited state. Thus, if allowed, almost every excitation will lead to an ultraviolet (UV) photon. Indeed, most of the radiation from xenon plasmas is in the UV, with only a small part in the visible. Line emissions in the visible are dominated by radiative decay from states where the radiative transitions to ground are forbidden. When an electron collision excites one of these states, it decays though a multi-step process to ground, since the direct radiative decay to ground is forbidden and the collisional decay rate is orders of magnitude slower than the allowed radiative transitions. Although the excitation cross sections from ground to these states are smaller than those to states with optically allowed transitions, the absence of a competing single-step decay path to ground allows these states to dominate the visible emissions. The total power radiated by a thruster plume, in both the visible and the UV, can be estimated by assuming that both the ion beam and the neutral gas expand

Ion and Hall Thruster Plumes 421
with the same effective cone angle . The radius of the beam and neutral plumes as a function of the distance z from the thruster is then
R = Ro + z tan , (8.5-2)
where Ro is the initial radius. Assuming a quasi-neutral beam, the ion and
electron densities are
ne = ni =Ib
e vi R2. (8.5-3)
The neutral density is given by
no =Ib
evn R2
1 m
m. (8.5-4)
Emission from the neutral gas is proportional to the product of the electron density, the neutral gas density, the electron velocity, and the Maxwellian-averaged excitation cross section:
Pemission = ne no ve excite eEemission dV
= ne no ve0 excite eEemission 2 R2 dz
= ne no ve excite eEemission2 R2
tandR
Ro,
(8.5-5)
where the temperature-averaged excitation cross section, excite , is from
[20]:
excite TeV( ) =
19.3exp 11.6 /TeV( )
TeV10 20 m2 . (8.5-6)
For example, at 2 eV, the value of excite is about 0.8 10–20 m2. Integrating
over the plume volume, assuming that Eemission is 10 eV (approximately the
energy of the lowest-lying excited state of xenon), and that the neutral temperature is 500 deg C, the total radiated power in the NSTAR thruster plume at the full power point ( Ibeam 1.76 A, Vbeam = 1100 V) is

422 Chapter 8
Pemission =
2Ib2
evivn R tan
1 m
mve excite Eemission
0.04 W[ ],
(8.5-7)
which is much less than a tenth of a watt. Emissions in the visible range are usually only about one percent of the total radiated power.
References
[1] B. M. Anzel, U.S. Patent no. 5,443,231, August 22, 1995.
[2] D. M. Goebel, M. Martinez-Lavin, T. A. Bond, and A. M. King, “Performance of XIPS Electric Propulsion in Station Keeping of the Boeing 702 Spacecraft,” AIAA-2002-4348, 38th Joint Propulsion Conference, Indianapolis, Indiana, July 7–10, 2002.
[3] I. D. Boyd and A. Ketsdever, “Interactions Between Spacecraft and Thruster Plumes,” Journal of Spacecraft and Rockets, vol. 38, no. 3, pp. 380–380, 2001.
[4] J. Wang, D. Brinza, and M. Young, “Three-Dimensional Particle Simulations of Ion Propulsion Plasma Environment for Deep Space 1,” Journal of Spacecraft and Rockets, vol. 38, no. 3, pp. 433–440, 2001.
[5] I. G. Mikellides, G. A. Jongeward, I. Katz, and D. H. Manzella, “Plume Modeling of Stationary Plasma Thrusters and Interactions with the Express-A Spacecraft,” Journal of Spacecraft and Rockets, vol. 39 no. 6, pp. 894–903, 2002.
[6] I. G. Mikellides, M. J. Mandell, R. A. Kuharski, D. A. Davis, B. M. Gardner, and J. Minor, “The Electric Propulsion Interactions Code (EPIC),” AIAA 2003-4871, 39th Joint Propulsion Conference, Huntsville, Alabama, July 20–23, 2003.
[7] D. E. Brinza, M. D. Henry, A. T. Mactutis, K. P. McCarty, J. D. Rademacher, T. R. van Zandt, P. Narvaez, J. J. Wang, B. T. Tsurutani, I. Katz, V. A. Davis, S. Moses, G. Musmann, F. Kuhnke, I. Richter, C. Othmer, and K.H. Glassmeier, “An Overview of Results from the Ion Diagnostics Sensors Flown on DS1,” AIAA-2001-0966, presented at the 39th AIAA Aerospace Sciences Meeting & Exhibit, Reno, Nevada, January 8–11, 2001.

Ion and Hall Thruster Plumes 423
[8] V. A. Davis, I. Katz, M. J. Mandell, D. E. Brinza, M. D. Henry, J. J. Wang, and D. T. Young, “Ion Engine Generated Charge Exchange Environment—Comparison Between NSTAR Flight Data and Numerical Simulations,” AIAA-2000-3529, 36th Joint Propulsion Conference, Huntsville, Alabama, July 16–19, 2000.
[9] J. Pollard, K. D. Diamant, V. Khayms, L. Werthman, D. Q. King, and K. H. DeGrys, “Ion Flux, Energy, Charge-State Measurements for the BPT-4000 Hall Thruster,” AIAA-2001-3351, 37th Joint Propulsion Conference, Salt Lake City, Utah, July 8–11, 2001.
[10] I. G. Mikellides, I. Katz, R. A. Kuharski, and M. J. Mandell, “Elastic Scattering of Ions in Electrostatic Thruster Plumes,” Journal of
Propulsion and Power, vol. 21, no. 1, pp. 111–118, 2005.
[11] D. E. Parks and I. Katz, “A Preliminary Model of Ion Beam Neutralization,” Electric Propulsion and Its Applications to Space Missions,” edited by R. C. Finke, Progress in Astronautics and
Aeronautics, vol. 79, 1981.
[12] J. Ashkenazy and A. Fruchtman, “A Far-field Analysis of Hall Thruster Plume,” Division of Plasma Physics (DPP) and International Congress on Plasma Physics Meeting (ICPP), Paper BMI-004, Quebec City, Canada, October 2000.
[13] E. J. Pencil, T. Randolph, and D. H. Manzella, “End-of-life Stationary Plasma Thruster Far-field Plume Characterization,” AIAA-1996-2709, 32nd Joint Propulsion Conference, Lake Buena Vista, Florida, July 1–3, 1996.
[14] J. E. Polk, D. M. Goebel, J. S. Snyder, and A. C. Schneider, “Performance and Wear Test Results for a 20-kW Class Ion Engine with Carbon-Carbon Grids,” AIAA-2005-4393, 41st Joint Propulsion Conference, Tucson, Arizona, July 11–14, 2005.
[15] J. S. Miller, S. H. Pullins, D. J. Levandier, Y. Chiu, and R. A. Dressler, “Xenon Charge Exchange Cross Sections for Electrostatic Thruster Models,” Journal of Applied Physics, vol. 91, no. 3, pp. 984–991, 2002.
[16] J. R. Beattie and S. Kami, “Advanced Technology 30-cm Diameter Mercury Ion Thruster,” AIAA-82-1910, 16th International Electric Propulsion Conference, New Orleans, Louisiana, November 17–19, 1982.
[17] R. Wirz and I. Katz, “XIPS Ion Thruster Grid Erosion Predictions for Deep Space Missions,” 30th International Electric Propulsion Conference, Florence, Italy, September 17–20, 2007.

424 Chapter 8
[18] J. R. Beattie, J. A. Marshall, J. L. Burch, and W. C. Gibson, “Design, Qualification, and On-Orbit Performance of the ATLAS Plasma Contactor,” IEPC-93-010, International Electric Propulsion Conference, Seattle, Washington, September 1993.
[19] J. R. Beattie, W. S. Williamson, J. N. Matossian, E. J. Vourgourakis, and J. L. Burch, AIAA-1989-1603, “High-Current Plasma Contactor Neutralizer System,” 3rd International Conference on Tethers in Space—Toward Flight, San Francisco, California, May 17–19, 1989.
[20] I. Katz, D. E. Parks, B. M. Gardner, S. B. Mende, H. I. Collin, D. H. Manzella, and R. M. Myers, “Spectral Line Emission by the SEPAC Plasma Contactor: Comparison Between Measurement & Theory,” AIAA-95-0369, 33rd Aerospace Sciences Meeting and Exhibit, Reno, Nevada, January 9–12, 1995.
Homework Problems
1. An ion thruster 20 cm in diameter produces a Xe+ ion beam at 2000 V.
a. If there is no electron neutralization of the beam, what is the maximum current in the beam if the beam diameter doubles in a distance of 1 m?
b. What is the effective angular divergence of this beam?
c. At what current density is electron neutralization required to keep the angular divergence less than 10 deg? (Hint: find the radial acceleration using Gauss’s law for the radial electric field in the beam.)
2. You have just been hired as a propulsion engineer by a spacecraft manufacturer who plans to launch a commercial satellite that uses a 30-cm xenon ion engine operated for station keeping. The manufacturer plans to perform a costly test to assess whether a 1-mil-thick Kapton coating over a critical spacecraft surface located near the engine will survive 1500 hours of thruster operation. You immediately recall that your course work may allow you to determine the sputtering erosion of the Kapton layer by analysis, and thus possibly save your employer the high cost of performing the test. The spacecraft surface in question is a flat panel located perpendicularly to the thruster’s r–z plane, as shown in Fig. 8-19. The panel length exceeds 6 m. Assuming that the ion beam consists of singly charged ions only,

Ion and Hall Thruster Plumes 425
a. Use the equations in your textbook to express the ion beam density, n, as a function of spatial coordinates (r,z). Produce contour plots of the beam density within a radius of r = 0.5 m from the center of the thruster exit (r = 0, z = 0). Assume that the ion density n0 at (r = 0, z = 0) is 4 1015 m–3 and that the ion beam velocity V0 is 40 km/s. Also,
assume that uBohm /V0 = 0.03 .
b. Derive an expression for the radial component of the ion beam flux,
r = r , as a function of spatial coordinates (r,z). Plot the radial ion
beam flux as a function of z for r = 0.3, 0.4, and 0.5 m.
c. Perform a literature search to find the sputtering yield Y of Kapton as a function of ion energy/ion charge, E, and incidence angle, , and then plot Y for 300-V and 1000-V ions between 0 and 90 deg of incidence angle. (Hint: The sputtering yield for many materials is usually expressed as Y(E, ) = (a + bE)f( ), where f( ) is a polynomial function and a,b are constants.)
d. Compute the erosion rate in (Å/s) caused by the main ion beam along the Kapton plate (in the r-z plane), as a function of z, for r = 0.3, 0.4, and 0.5 m. Assume that the molecular weight of Kapton is 382 g/mol and that its mass density is 1.42 g/cm3 (1Å = 10–10 m).
e. If the panel was placed at r = 0.5 m from the thruster, how long would it take for the main ion beam to erode completely the Kapton layer?
f. For partial credit, choose one answer to the following question: how would you advise your boss based on your results?
i. The Kapton coating will be just fine. There’s no need to perform a test. Build the spacecraft as is (panel radial location = 0.5 m).
ii. The Kapton coating will not survive. We must consider changing the location of the panel relative to the thruster.
Kapton-Coated Spacecraft Surface
Ion Thruster
Ion Beam
z
r
Fig. 8-19. Flat panel positioned over an ion thruster plume.
426 Chapter 8
iii. The Kapton coating will not survive. Why don’t we just use chemical propulsion?
iv. I must perform more calculations.
v. ii and iv
vi. The Kapton coating will not survive. The mission cannot be launched.
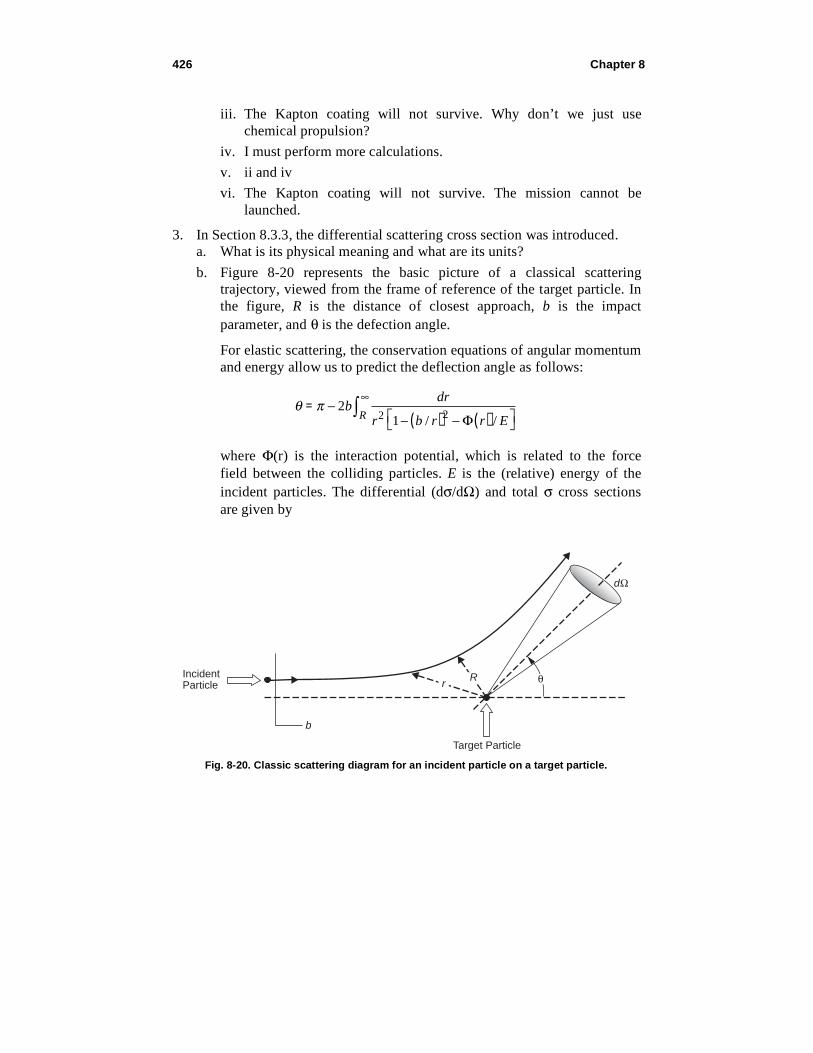
3. In Section 8.3.3, the differential scattering cross section was introduced. a. What is its physical meaning and what are its units?
b. Figure 8-20 represents the basic picture of a classical scattering trajectory, viewed from the frame of reference of the target particle. In the figure, R is the distance of closest approach, b is the impact parameter, and is the defection angle.
For elastic scattering, the conservation equations of angular momentum and energy allow us to predict the deflection angle as follows:
= 2bdr
r2 1 b / r( )2 r( ) / ER
where (r) is the interaction potential, which is related to the force field between the colliding particles. E is the (relative) energy of the incident particles. The differential (d /d ) and total cross sections are given by
IncidentParticle
b
dΩ
Target Particle
rR θ
Fig. 8-20. Classic scattering diagram for an incident particle on a target particle.
Ion and Hall Thruster Plumes 427
d
d=
b
sin
db
d
=d
dd .
Compute the differential and total cross sections for (i) collisions between hard spheres of diameter d and (ii) a repulsive force field
between particles that varies as k/ r2 (k is a constant).
4. The most general elastic collision process between two particles of unequal masses, m1 and m2, velocity vectors before the collision, u1 and u2, and after the collision, u1' and u2', can be represented by the geometrical construction in Fig. 8-21 using the following definitions:
Relative velocities: U = u1–u2, U' = u1'–u2'
Center-of-mass (CM) velocity: uc = (m1u1 + m2u2)/(m1 + m2)
Reduced mass: M = m1m2/(m1 + m2) a. In the case of equal masses, m1 = m2 = m, and one stationary particle,
u2 = 0, draw the new geometrical construction. What is the relationship between the scattering angle in the CM frame, , and the scattering
angle in the laboratory frame, ?
b. Convert the CM differential cross section, d /d CM, into the laboratory
frame of reference, d /d L.
m2u’2
MU’
θ
MU
m1u1m1u’1
m2u2
β
m1u1 + m2u2 = (m1 + m2) uc
Fig. 8-21. Center of mass depiction of an elastic scattering event.

428 Chapter 8
5. Derive Eq. (8.5-1) for the phase shift of electromagnetic radiation passing through a plasma (hint: assume the phase shift is small).
6. A spacecraft has a 32-GHz communications system that passes into the diverging plume of an ion propulsion system 1 m from the thruster. If the NSTAR thruster beam has an initial radius of 15 cm and produces 1.76 A of xenon ions at 1100 V with a 10-deg half-angle divergence from the initial area, what is the total phase shift in degrees produced when the thruster is turned on or off?