chapter 8 optimization of power system...
TRANSCRIPT

97
CHAPTER 8
OPTIMIZATION OF POWER SYSTEM USING
L-INDEX APPROACH
8.1 INTRODUCTION
The optimal rating and location of FACTS devices are obtained to
achieve minimizing the real power loss, voltage profile improvement, voltage
stability enhancement and minimizing the total cost. The voltage stability
assessment is analyzed using L-index (Thukaram et al 2000, Durairaj et al
2005 and Vaisakh et al 2008) approach based on Bacterial Foraging
Algorithm. L-index gives scalar number (0 to 1) to each load bus of the
system. Highest value of L-Index of the load bus will be considered as critical
load bus. Among the different indices for voltage stability and voltage
collapse prediction, the L-index gives fairly consistent results (Durairaj et al
2005). This work uses minimization of L-index of the system as one of the
objective of the optimization problem. The Bacterial Foraging based L-index
is calculated in each step after performing Newton-Raphson (N-R) load flow
study. The proposed algorithm has been tested on 6-bus, IEEE 14-bus and
IEEE 30-bus reliability test systems. A load flow program written in
MATLAB using Bacterial Foraging technique was used to compute power
flow. For practical and economic considerations, the number of SVC units is
limited not exceeding three (Ishak et al 2004) TCSC and UPFC units are
limited to one at a time. (Garng Huang et al 2002 and Venkataramu et al
2006).
98
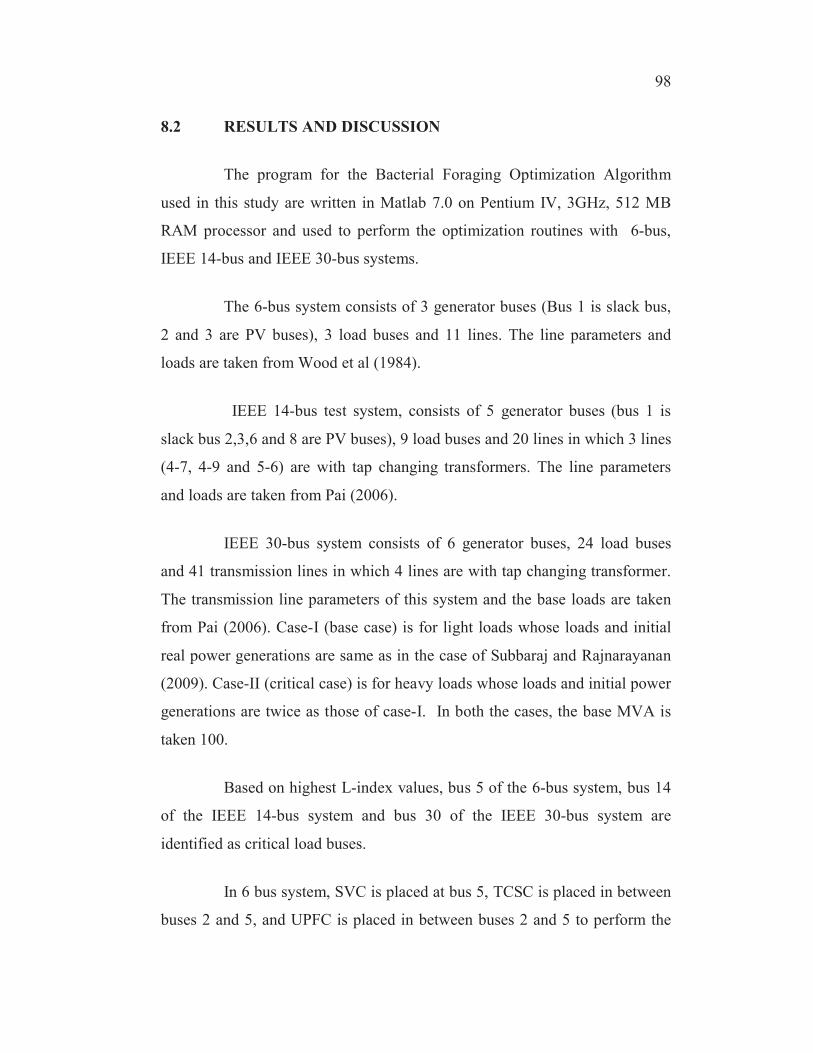
8.2 RESULTS AND DISCUSSION
The program for the Bacterial Foraging Optimization Algorithm
used in this study are written in Matlab 7.0 on Pentium IV, 3GHz, 512 MB
RAM processor and used to perform the optimization routines with 6-bus,
IEEE 14-bus and IEEE 30-bus systems.
The 6-bus system consists of 3 generator buses (Bus 1 is slack bus,
2 and 3 are PV buses), 3 load buses and 11 lines. The line parameters and
loads are taken from Wood et al (1984).
IEEE 14-bus test system, consists of 5 generator buses (bus 1 is
slack bus 2,3,6 and 8 are PV buses), 9 load buses and 20 lines in which 3 lines
(4-7, 4-9 and 5-6) are with tap changing transformers. The line parameters
and loads are taken from Pai (2006).
IEEE 30-bus system consists of 6 generator buses, 24 load buses
and 41 transmission lines in which 4 lines are with tap changing transformer.
The transmission line parameters of this system and the base loads are taken
from Pai (2006). Case-I (base case) is for light loads whose loads and initial
real power generations are same as in the case of Subbaraj and Rajnarayanan
(2009). Case-II (critical case) is for heavy loads whose loads and initial power
generations are twice as those of case-I. In both the cases, the base MVA is
taken 100.
Based on highest L-index values, bus 5 of the 6-bus system, bus 14
of the IEEE 14-bus system and bus 30 of the IEEE 30-bus system are
identified as critical load buses.
In 6 bus system, SVC is placed at bus 5, TCSC is placed in between
buses 2 and 5, and UPFC is placed in between buses 2 and 5 to perform the

99
test for the base and critical cases. L-index and voltage magnitudes of 6-bus
system without and with FACTS devices for base and critical cases are
summarized in Tables 8.1 to 8.4.
Table 8.1 shows the L-index values of the 6-bus system without and
with placement of FACTS devices for base case. When SVC is placed at bus
5, the L-index value is reduced from 0.0665 to 0.0463. When TCSC is placed
in between buses 2 and 5, the L-index value is reduced from 0.0665 to 0.0447
at load bus 5. When UPFC is placed in between buses 2 and 5, the L-index
value is reduced from 0.0665 to 0.0374 at load bus 5. Table 8.2 shows the
voltage magnitudes of the 6-bus system without and with placement of
FACTS devices for base case. The voltage of the load bus 5 without FACTS
devices for base case is 0.9972. When SVC is placed at bus 5, the voltage of
load bus 5 gets improved to 1.0193. When TCSC is placed in between buses 2
and 5, the voltage of load bus 5 gets improved to 1.0208. When UPFC is
placed in between buses 2 and 5, the voltage of load bus 5 gets improved to
1.0240.
Table 8.1 L-Index Values of 6-bus system (Base case)
Load
Bus
No.
Without
FACTS
With
SVC
(at bus 5)
With
TCSC(between
buses 2-5)
With UPFC
(shunt at bus 5
series between
buses 2-5)
4 0.0632 0.0628 0.0628 0.0628
5 0.0665 0.0463 0.0447 0.0374
6 0.0553 0.0546 0.0546 0.0546
100
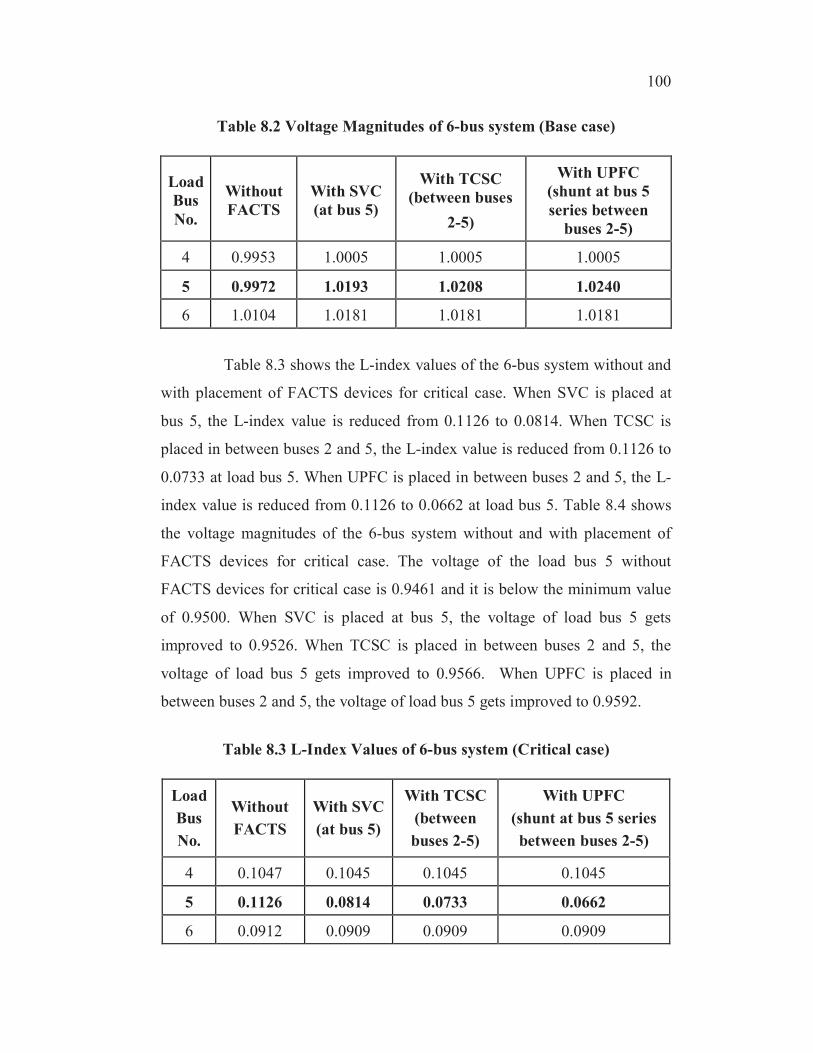
Table 8.2 Voltage Magnitudes of 6-bus system (Base case)
Load
Bus
No.
Without
FACTS
With SVC
(at bus 5)
With TCSC
(between buses
2-5)
With UPFC
(shunt at bus 5
series between
buses 2-5)
4 0.9953 1.0005 1.0005 1.0005
5 0.9972 1.0193 1.0208 1.0240
6 1.0104 1.0181 1.0181 1.0181
Table 8.3 shows the L-index values of the 6-bus system without and
with placement of FACTS devices for critical case. When SVC is placed at
bus 5, the L-index value is reduced from 0.1126 to 0.0814. When TCSC is
placed in between buses 2 and 5, the L-index value is reduced from 0.1126 to
0.0733 at load bus 5. When UPFC is placed in between buses 2 and 5, the L-
index value is reduced from 0.1126 to 0.0662 at load bus 5. Table 8.4 shows
the voltage magnitudes of the 6-bus system without and with placement of
FACTS devices for critical case. The voltage of the load bus 5 without
FACTS devices for critical case is 0.9461 and it is below the minimum value
of 0.9500. When SVC is placed at bus 5, the voltage of load bus 5 gets
improved to 0.9526. When TCSC is placed in between buses 2 and 5, the
voltage of load bus 5 gets improved to 0.9566. When UPFC is placed in
between buses 2 and 5, the voltage of load bus 5 gets improved to 0.9592.
Table 8.3 L-Index Values of 6-bus system (Critical case)
Load
Bus
No.
Without
FACTS
With SVC
(at bus 5)
With TCSC
(between
buses 2-5)
With UPFC
(shunt at bus 5 series
between buses 2-5)
4 0.1047 0.1045 0.1045 0.1045
5 0.1126 0.0814 0.0733 0.0662
6 0.0912 0.0909 0.0909 0.0909
101
Table 8.4 Voltage Magnitudes of 6-bus system (Critical case)
Load
Bus
No.
Without
FACTS
With SVC
(at bus 5)
With TCSC
(between
bus 2-5)
With UPFC
(shunt at bus 5 series
between buses 2-5)
4 0.9546 0.9550 0.9550 0.9550
5 0.9461 0.9526 0.9566 0.9592
6 0.9610 0.9614 0.9614 0.9614
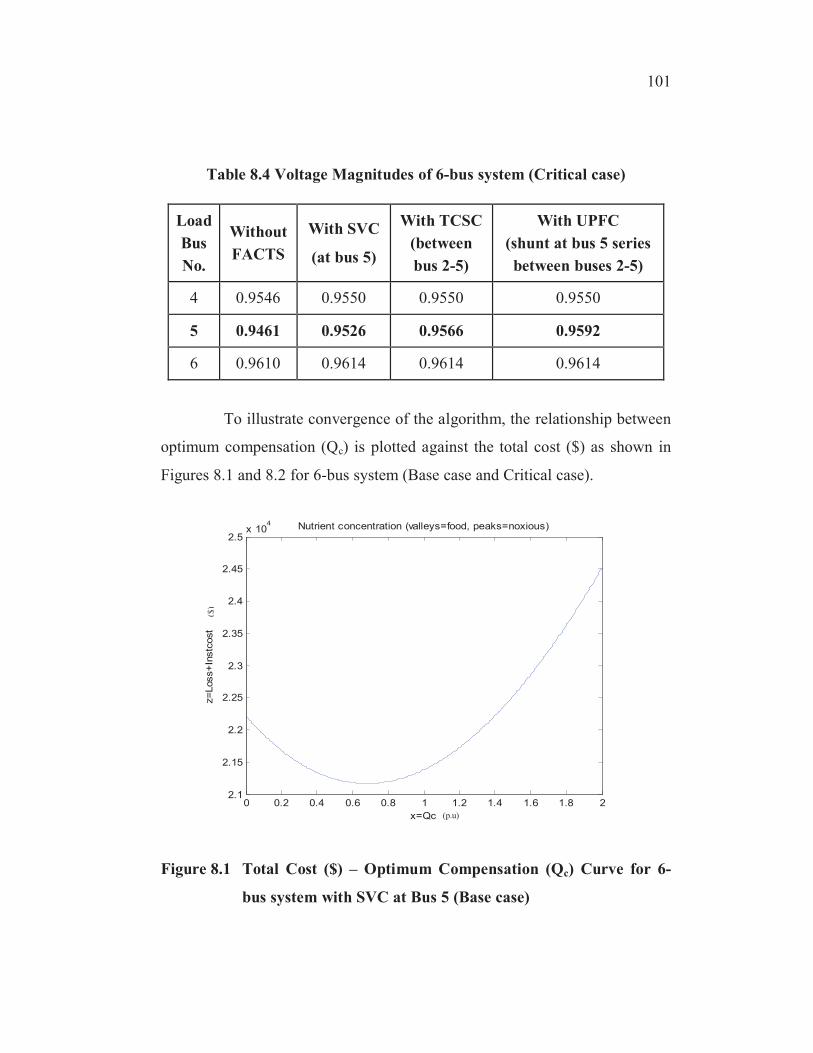
To illustrate convergence of the algorithm, the relationship between
optimum compensation (Qc) is plotted against the total cost ($) as shown in
Figures 8.1 and 8.2 for 6-bus system (Base case and Critical case).
0 0.2 0.4 0.6 0.8 1 1.2 1.4 1.6 1.8 22.1
2.15
2.2
2.25
2.3
2.35
2.4
2.45
2.5x 10
4
x=Qc
z=
Loss+
Instc
ost
Nutrient concentration (valleys=food, peaks=noxious)
Figure 8.1 Total Cost ($) – Optimum Compensation (Qc) Curve for 6-
bus system with SVC at Bus 5 (Base case)
(p.u)
($)

102
0 0.2 0.4 0.6 0.8 1 1.2 1.4 1.6 1.8 22.48
2.5
2.52
2.54
2.56
2.58
2.6x 10
4
x=Qc
z=
Loss+
Instc
ost
Nutrient concentration (valleys=food, peaks=noxious)
Figure 8.2 Total Cost ($) - Optimum Compensation (Qc) Curve for 6-bus
system with SVC at Bus 5 (Critical case)
In IEEE 14- bus system, SVC is placed at bus 14, TCSC is placed in
between buses 9 and 14, and UPFC is placed in between buses 9 and 14 to
perform the test for the base and critical cases. L-index and voltage
magnitudes of IEEE 14-bus system without and with FACTS devices for base
and critical cases are summarized in Tables 8.5 to 8.8.
Table 8.5 shows the L-index values of the IEEE 14-bus system
without and with placement of FACTS devices for base case. When SVC is
placed at bus 14, the L-index value reduced from 0.0256 to 0.0193. When
TCSC is placed in between buses 9 and 14, the L-index value is reduced from
0.0256 to 0.0099 at load bus 14 and the L-index value is reduced from 0.0129
to 0.0077 at load bus 9. When UPFC is placed in between buses 9 and 14, the
L-index value is reduced from 0.0256 to 0.0083 at load bus 14 and the
L-index value is reduced from 0.0129 to 0.0065 at load bus 9.
x=Qc (p.u)
z=L
oss
+In
stco
st (
$)
103
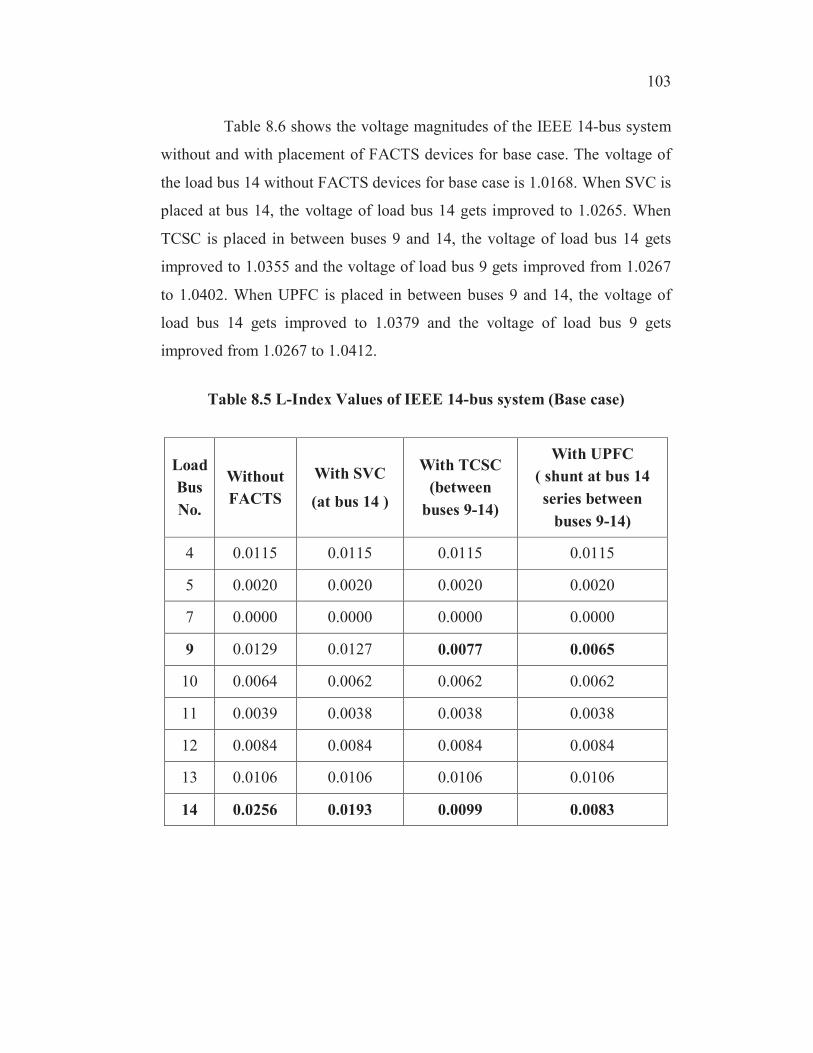
Table 8.6 shows the voltage magnitudes of the IEEE 14-bus system
without and with placement of FACTS devices for base case. The voltage of
the load bus 14 without FACTS devices for base case is 1.0168. When SVC is
placed at bus 14, the voltage of load bus 14 gets improved to 1.0265. When
TCSC is placed in between buses 9 and 14, the voltage of load bus 14 gets
improved to 1.0355 and the voltage of load bus 9 gets improved from 1.0267
to 1.0402. When UPFC is placed in between buses 9 and 14, the voltage of
load bus 14 gets improved to 1.0379 and the voltage of load bus 9 gets
improved from 1.0267 to 1.0412.
Table 8.5 L-Index Values of IEEE 14-bus system (Base case)
Load
Bus
No.
Without
FACTS
With SVC
(at bus 14 )
With TCSC
(between
buses 9-14)
With UPFC
( shunt at bus 14
series between
buses 9-14)
4 0.0115 0.0115 0.0115 0.0115
5 0.0020 0.0020 0.0020 0.0020
7 0.0000 0.0000 0.0000 0.0000
9 0.0129 0.0127 0.0077 0.0065
10 0.0064 0.0062 0.0062 0.0062
11 0.0039 0.0038 0.0038 0.0038
12 0.0084 0.0084 0.0084 0.0084
13 0.0106 0.0106 0.0106 0.0106
14 0.0256 0.0193 0.0099 0.0083

104
Table 8.6 Voltage Magnitudes of IEEE 14-bus system (Base case)
Load
Bus
No.
Without
FACTS
With SVC
(at bus 14 )
With TCSC
(between buses
9-14)
With UPFC
( shunt at bus 14
series between
buses 9-14)
4 1.0239 1.0239 1.0239 1.0239
5 1.0329 1.0329 1.0329 1.0329
7 1.0438 1.0438 1.0438 1.0438
9 1.0267 1.0270 1.0402 1.0412
10 1.0268 1.0271 1.0271 1.0271
11 1.0446 1.0450 1.0450 1.0450
12 1.0529 1.0529 1.0529 1.0529
13 1.0461 1.0461 1.0461 1.0461
14 1.0168 1.0265 1.0355 1.0379
Table 8.7 shows the L-index values of the IEEE 14-bus system
without and with placement of FACTS devices for critical case. When SVC is
placed at bus 14, the L-index value is reduced from 0.1098 to 0.0848. When
TCSC is placed in between buses 9 and 14, the L-index value is reduced from
0.1098 to 0.0762 at load bus 14 and the L-index value is reduced from 0.0245
to 0.0160 at load bus 9. When UPFC is placed in between buses 9 and 14, the
L-index value is reduced from 0.1098 to 0.0724 at load bus 14 and the L-
index value is reduced from 0.0245 to 0.0156 at load bus 9.
Table 8.8 shows the voltage magnitudes of the IEEE 14-bus system
without and with placement of FACTS devices for critical case. The voltage
of the load bus 14 without FACTS devices for critical case is 0.9470 and it is

105
below the minimum value of 0.9500. When SVC is placed at bus 14, the
voltage of load bus 14 gets improved to 0.9502. When TCSC is placed in
between buses 9 and 14, the voltage of load bus 14 gets improved to 0.9521
and the voltage of load bus 9 gets improved from 1.0034 to 1.0220. When
UPFC is placed in between buses 9 and 14, the voltage of load bus 14 gets
improved to 0.9528 and the voltage of load bus 9 get improved from 1.0034
to 1.0228.
To illustrate convergence of the algorithm, the relationship between
optimum compensation (Qc) is plotted against the total cost ($) as shown in
Figures 8.3 and 8.4 for IEEE 14-bus system (Base case and Critical case).
Table 8.7 L-Index Values of IEEE 14-bus system (Critical case)
Load
Bus
No.
Without
FACTS
With SVC
(at bus 14)
With TCSC
(between
buses 9-14)
With UPFC
( shunt at bus 14
series between
buses 9-14)
4 0.0246 0.0244 0.0244 0.0243
5 0.0042 0.0042 0.0042 0.0042
7 0.0000 0.0000 0.0000 0.0000
9 0.0245 0.0242 0.0160 0.0156
10 0.0168 0.0168 0.0168 0.0168
11 0.0073 0.0070 0.0070 0.0070
12 0.0118 0.0118 0.0118 0.0118
13 0.0206 0.0206 0.0206 0.0206
14 0.1098 0.0848 0.0762 0.0724

106
Table 8.8 Voltage Magnitudes of IEEE 14-bus system (Critical case)
Load
Bus
No.
Without
FACTS
With SVC
(at bus 14)
With TCSC
(between buses
9-14)
With UPFC (shunt
at bus 14 series
between buses 9-14)
4 0.9898 0.9902 0.9902 0.9902
5 0.9976 0.9976 0.9976 0.9976
7 1.0228 1.0228 1.0228 1.0228
9 1.0034 1.0040 1.0220 1.0228
10 1.0043 1.0048 1.0048 1.0048
11 1.0312 1.0316 1.0316 1.0316
12 1.0394 1.0394 1.0394 1.0394
13 1.0314 1.0314 1.0314 1.0314
14 0.9470 0.9502 0.9521 0.9528
0 0.2 0.4 0.6 0.8 1 1.2 1.4 1.6 1.8 22.051
2.052
2.053
2.054
2.055
2.056
2.057
2.058x 10
5
x=Qc
z=Loss+In
stc
ost
Nutrient concentration (valleys=food, peaks=noxious)
Figure 8.3 Total Cost ($) - Optimum Compensation (Qc) Curve for IEEE
14-bus system with SVC at Bus 14 (Base case)
($)
x=Qc (p.u)
z=L
oss
+In
stco
st (
$)

107
0 0.2 0.4 0.6 0.8 1 1.2 1.4 1.6 1.8 24.349
4.3495
4.35
4.3505
4.351
4.3515
4.352
4.3525
4.353
4.3535x 10
5
x=Qc
z=Loss+In
stc
ost
Nutrient concentration (valleys=food, peaks=noxious)
Figure 8.4 Total Cost ($) - Optimum Compensation (Qc) Curve for IEEE
14-bus system with SVC at Bus 14 (Critical case)
In IEEE 30- bus system, SVC placed at bus 30, TCSC placed in
between buses 29 and 30, and UPFC placed in between buses 29 and 30 to
perform the test for the base and critical cases. L-index and voltage
magnitudes of IEEE 30-bus system without and with FACTS devices for base
and critical cases are summarized in Tables 8.9 to 8.12.
Table 8.9 shows the L-index values of the IEEE 30-bus system
without and with placement of FACTS devices for base case. When SVC is
placed at bus 30, the L-index value is reduced from 0.0340 to 0.0329. When
TCSC is placed in between buses 29 and 30, the L-index value is reduced
from 0.0340 to 0.0152 at load bus 30 and the L-index value is reduced from
0.0066 to 0.0038 at load bus 29. When UPFC is placed in between buses 29
and 30, the L-index value is reduced from 0.0340 to 0.0147 at load bus 30 and
the L-index value is reduced from 0.0066 to 0.0033 at load bus 29.
Table 8.10 shows the voltage magnitudes of the IEEE 30-bus
system without and with placement of FACTS devices for base case. The
x=Qc (p.u)
z=L
oss
+In
stco
st (
$)
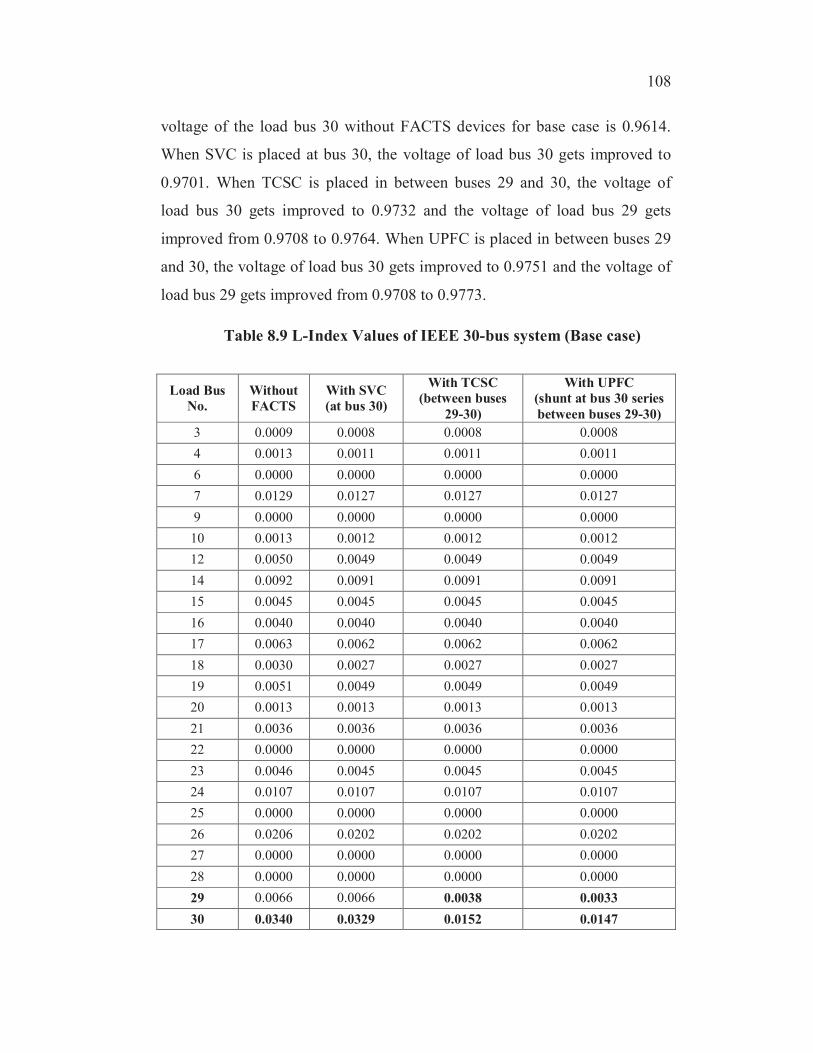
108
voltage of the load bus 30 without FACTS devices for base case is 0.9614.
When SVC is placed at bus 30, the voltage of load bus 30 gets improved to
0.9701. When TCSC is placed in between buses 29 and 30, the voltage of
load bus 30 gets improved to 0.9732 and the voltage of load bus 29 gets
improved from 0.9708 to 0.9764. When UPFC is placed in between buses 29
and 30, the voltage of load bus 30 gets improved to 0.9751 and the voltage of
load bus 29 gets improved from 0.9708 to 0.9773.
Table 8.9 L-Index Values of IEEE 30-bus system (Base case)
Load Bus
No.
Without
FACTS
With SVC
(at bus 30)
With TCSC
(between buses
29-30)
With UPFC
(shunt at bus 30 series
between buses 29-30)
3 0.0009 0.0008 0.0008 0.0008
4 0.0013 0.0011 0.0011 0.0011
6 0.0000 0.0000 0.0000 0.0000
7 0.0129 0.0127 0.0127 0.0127
9 0.0000 0.0000 0.0000 0.0000
10 0.0013 0.0012 0.0012 0.0012
12 0.0050 0.0049 0.0049 0.0049
14 0.0092 0.0091 0.0091 0.0091
15 0.0045 0.0045 0.0045 0.0045
16 0.0040 0.0040 0.0040 0.0040
17 0.0063 0.0062 0.0062 0.0062
18 0.0030 0.0027 0.0027 0.0027
19 0.0051 0.0049 0.0049 0.0049
20 0.0013 0.0013 0.0013 0.0013
21 0.0036 0.0036 0.0036 0.0036
22 0.0000 0.0000 0.0000 0.0000
23 0.0046 0.0045 0.0045 0.0045
24 0.0107 0.0107 0.0107 0.0107
25 0.0000 0.0000 0.0000 0.0000
26 0.0206 0.0202 0.0202 0.0202
27 0.0000 0.0000 0.0000 0.0000
28 0.0000 0.0000 0.0000 0.0000
29 0.0066 0.0066 0.0038 0.0033
30 0.0340 0.0329 0.0152 0.0147

109
Table 8.10 Voltage Magnitudes of IEEE 30-bus system (Base case)
Load
Bus
No.
Without
FACTS
With SVC
(at bus 30)
With TCSC
(between buses
29-30)
With UPFC (shunt
at bus 30 series
between buses
29-30)
3 1.0230 1.0232 1.0232 1.0232
4 1.0190 1.0196 1.0196 1.0196
6 1.0182 1.0190 1.0190 1.0190
7 1.0049 1.0052 1.0052 1.0052
9 1.0334 1.0334 1.0334 1.0334
10 1.0128 1.0131 1.0131 1.0131
12 1.0346 1.0348 1.0348 1.0348
14 1.0170 1.0173 1.0173 1.0173
15 1.0117 1.0117 1.0117 1.0117
16 1.0185 1.0185 1.0185 1.0185
17 1.0094 1.0096 1.0096 1.0096
18 0.9998 1.0001 1.0001 1.0001
19 0.9960 0.9965 0.9965 0.9965
20 0.9993 0.9993 0.9993 0.9993
21 1.0004 1.0004 1.0004 1.0004
22 1.0006 1.0006 1.0006 1.0006
23 0.9968 0.9972 0.9972 0.9972
24 0.9852 0.9852 0.9852 0.9852
25 0.9850 0.9850 0.9850 0.9850
26 0.9669 0.9672 0.9672 0.9672
27 0.9938 0.9938 0.9938 0.9938
28 1.0151 1.0151 1.0151 1.0151
29 0.9708 0.9708 0.9764 0.9773
30 0.9614 0.9701 0.9732 0.9751

110
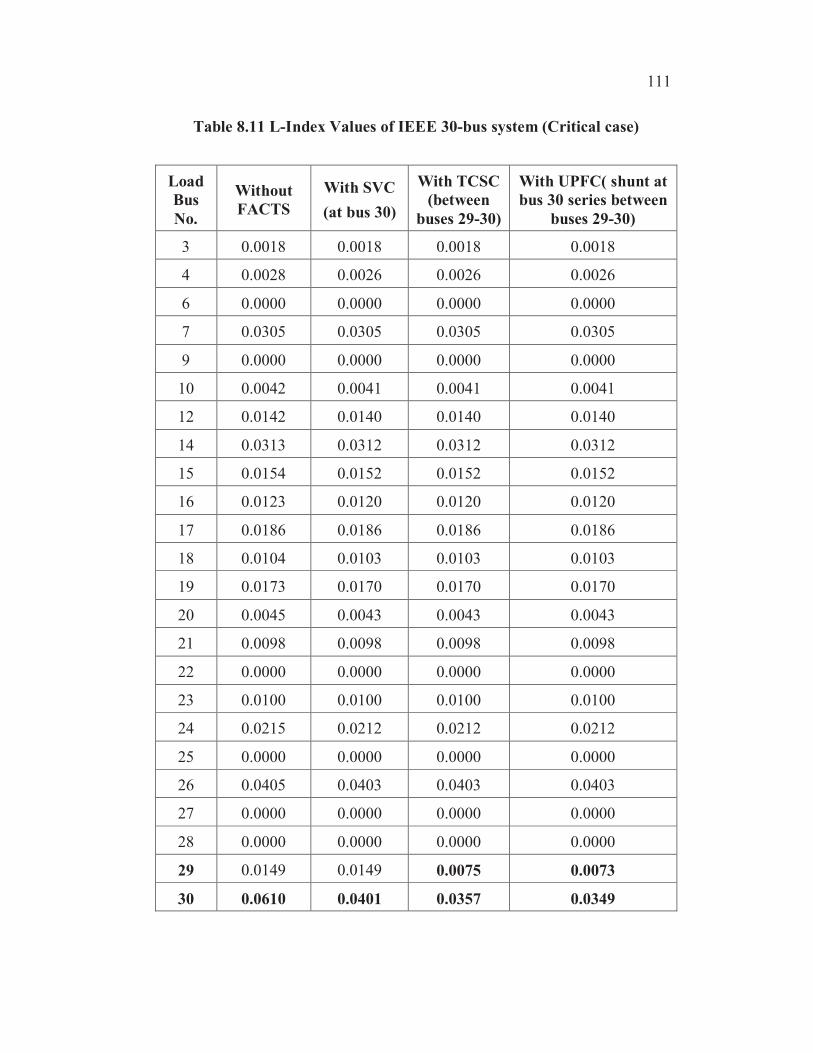
Table 8.11 shows the L-index values of the IEEE 30-bus system
without and with placement of FACTS devices for critical case. When SVC is
placed at bus 30, the L-index value is reduced from 0.0610 to 0.0401. When
TCSC is placed in between buses 29 and 30, the L-index value is reduced
from 0.0610 to 0.0357 at load bus 30 and the L-index value is reduced from
0.0149 to 0.0075 at load bus 29. When UPFC is placed in between buses 29
and 30, the L-index value is reduced from 0.0610 to 0.0349 at load bus 30 and
the L-index value is reduced from 0.0149 to 0.0073 at load bus 29.
Table 8.12 shows the voltage magnitudes of the IEEE 30-bus
system without and with placement of FACTS devices for critical case. The
voltage of the load bus 30 without FACTS devices for critical case is 0.9428
and it is below the minimum value of 0.9500. When SVC is placed at bus 30,
the voltage of load bus 30 gets improved to 0.9604. When TCSC is placed in
between buses 29 and 30, the voltage of load bus 30 gets improved to 0.9616
and the voltage of load bus 29 gets improved from 0.9608 to 0.9662. When
UPFC is placed in between buses 29 and 30, the voltage of load bus 30 gets
improved to 0.9622 and the voltage of load bus 29 gets improved from 0.9608
to 0.9668.
111
Table 8.11 L-Index Values of IEEE 30-bus system (Critical case)
Load
Bus
No.
Without
FACTS
With SVC
(at bus 30)
With TCSC
(between
buses 29-30)
With UPFC( shunt at
bus 30 series between
buses 29-30)
3 0.0018 0.0018 0.0018 0.0018
4 0.0028 0.0026 0.0026 0.0026
6 0.0000 0.0000 0.0000 0.0000
7 0.0305 0.0305 0.0305 0.0305
9 0.0000 0.0000 0.0000 0.0000
10 0.0042 0.0041 0.0041 0.0041
12 0.0142 0.0140 0.0140 0.0140
14 0.0313 0.0312 0.0312 0.0312
15 0.0154 0.0152 0.0152 0.0152
16 0.0123 0.0120 0.0120 0.0120
17 0.0186 0.0186 0.0186 0.0186
18 0.0104 0.0103 0.0103 0.0103
19 0.0173 0.0170 0.0170 0.0170
20 0.0045 0.0043 0.0043 0.0043
21 0.0098 0.0098 0.0098 0.0098
22 0.0000 0.0000 0.0000 0.0000
23 0.0100 0.0100 0.0100 0.0100
24 0.0215 0.0212 0.0212 0.0212
25 0.0000 0.0000 0.0000 0.0000
26 0.0405 0.0403 0.0403 0.0403
27 0.0000 0.0000 0.0000 0.0000
28 0.0000 0.0000 0.0000 0.0000
29 0.0149 0.0149 0.0075 0.0073
30 0.0610 0.0401 0.0357 0.0349

112
Table 8.12 Voltage Magnitudes of IEEE 30-bus system (Critical case)
Load
Bus
No.
Without
FACTS
With SVC
(at bus 30)
With TCSC
(between
buses 29-30)
With UPFC (shunt at
bus 30 series between
buses 29-30)
3 0.9714 0.9714 0.9714 0.9714
4 0.9684 0.9688 0.9688 0.9688
6 0.9863 0.9863 0.9863 0.9863
7 0.9662 0.9662 0.9662 0.9662
9 0.9898 0.9898 0.9898 0.9898
10 0.9553 0.9556 0.9556 0.9556
12 0.9810 0.9814 0.9814 0.9814
14 0.9542 0.9544 0.9544 0.9544
15 0.9770 0.9772 0.9772 0.9772
16 0.9580 0.9582 0.9582 0.9582
17 0.9581 0.9581 0.9581 0.9581
18 0.9541 0.9544 0.9544 0.9544
19 0.9583 0.9589 0.9589 0.9589
20 0.9502 0.9506 0.9506 0.9506
21 0.9501 0.9507 0.9507 0.9507
22 0.9504 0.9504 0.9504 0.9504
23 0.9508 0.9508 0.9508 0.9508
24 0.9589 0.9594 0.9594 0.9594
25 0.9581 0.9581 0.9581 0.9581
26 0.9514 0.9518 0.9518 0.9518
27 0.9504 0.9504 0.9504 0.9504
28 0.9818 0.9818 0.9818 0.9818
29 0.9608 0.9608 0.9662 0.9668
30 0.9428 0.9604 0.9616 0.9622
To illustrate convergence of the algorithm, the relationship between
optimum compensation (Qc) is plotted against the total cost ($) as shown in
Figures 8.5 and 8.6 for IEEE 30-bus system (Base case and Critical case).

113
0 0.2 0.4 0.6 0.8 1 1.2 1.4 1.6 1.8 22.736
2.737
2.738
2.739
2.74
2.741
2.742x 10
5
x=Qc
z=Loss+In
stc
ost
Nutrient concentration (valleys=food, peaks=noxious)
Figure 8.5 Total Cost ($) - Optimum Compensation (Qc) Curve for IEEE
30-bus system with SVC at Bus 30 (Base case)
0 0.2 0.4 0.6 0.8 1 1.2 1.4 1.6 1.8 24.5385
4.539
4.5395
4.54
4.5405
4.541x 10
5
x=Qc
z=Loss+In
stc
ost
Nutrient concentration (valleys=food, peaks=noxious)
Figure 8.6 Total Cost ($) - Optimum Compensation (Qc) Curve for 30-
bus system with SVC at Bus 30 (Critical case)
x=Qc (p.u)
z=L
oss
+In
stco
st (
$)
x=Qc (p.u)
z=L
oss
+In
stco
st (
$)

114
The compensation for the installation of reactive power injections
and line reactance are identified with the help of proposed algorithm and the
optimum compensation values are listed in Table 8.13. The total cost was
calculated for different durations of application of load. Hence the increase in
cost was noticed for higher durations as in Table 8.13 even though the
percentage compensation is lesser for test systems.
Table 8.13 Total Cost ($) and Optimum Compensation (p.u)
Optimum
Compensation (p.u)Total Cost ($)
Test
System
Types
of
FACTS
Devices
Bus
No/LineBase case
Critical
case
Base
case
Critical
case
SVC 5 0.6031 0.6215 21110 24860
TCSC 2-5 -0.1482 -0.1680 23066 296246-Bus
System UPFC 2-5 -0.0312
& 0.5030
-0.0405&
0.5135
23124 46659
SVC 14 0.6247 0.6527 205170 434980
TCSC 9-14 -0.1402 -0.1578 95147 155488IEEE14-BusSystem UPFC 9-14 -0.03346
& 0.5147-0.0352
& 0.5214
102600 153110
SVC 30 0.6468 0.6491 273660 453890
TCSC 29-30 -0.2405 -0.2610 558400 378150IEEE
30-BusSystem UPFC 29-30 -0.0520
& 0.5012-0.0662&0.5164
294000 513520
Table 8.14 gives the real power loss values and computational time
for the proposed three test systems. In IEEE 14-bus system, Bacterial
Foraging Algorithm obtained 3.53% loss reduction, whereas the Evolutionary
Programming obtained 1.19% loss reduction and Self Adaptive Real coded

115
Genetic Algorithm obtained 2.19% loss reduction. In IEEE 30-bus system,
Bacterial Foraging Algorithm obtained 0.59% loss reduction compared with
base value. For IEEE 14-bus and IEEE 30-bus systems, the Bacterial
Foraging Algorithm gives minimum loss with lesser computational time
compared with the value reported in Subbaraj and Rajnarayanan (2009) for
the same test systems (By Referring to Table 8.14). Similar results are
obtained when TCSC and UPFC are placed between weakest load buses.
Table 8.15 summarizes the performance comparison of FACTS devices
(referring Tables 8.13 and 8.14). The significant advantages of self-
commutated compensators make them interesting alternative to improve
compensation characteristics and also increase the performance of AC power
systems.
Table 8.14 Real Power Loss and Computational Time
6 Bus IEEE-14 Bus IEEE-30 Bus
Algorithm Particulars Base
case
Critical
case
Base
case
Critical
case
Base
case
Critical
case
Real PowerLoss(MW)
-- -- 13.35 60.44 16.39 77.925EvolutionaryProgramming(EP Subbaraj andRajnarayanan (2009)
ComputationalTime (sec)
-- -- 72 78 103 118
Real PowerLoss (MW)
-- -- 13.22 59.49 16.09 76.25Self-Adaptive RealCoded GeneticAlgorithm (SARGASubbaraj andRajnarayanan (2009)
ComputationalTime (sec)
-- -- 54 66 87 101
Real PowerLoss (MW)
4.54 21.89 13.19 58.42 10.14 74.72Bacterial ForagingOptimizationAlgorithm (BFOA)for SVC
ComputationalTime (sec)
14 22 38 52 68 85
Real PowerLoss (MW)
4.47 21.66 13.16 58.34 10.12 74.64Bacterial ForagingOptimizationAlgorithm (BFOA)for TCSC
ComputationalTime (sec)
18 26 42 58 79 92
Real PowerLoss (MW)
4.32 20.83 13.05 58.08 10.10 74.41Bacterial ForagingOptimizationAlgorithm (BFOA)for UPFC
ComputationalTime (sec)
21 30 51 66 86 98
116
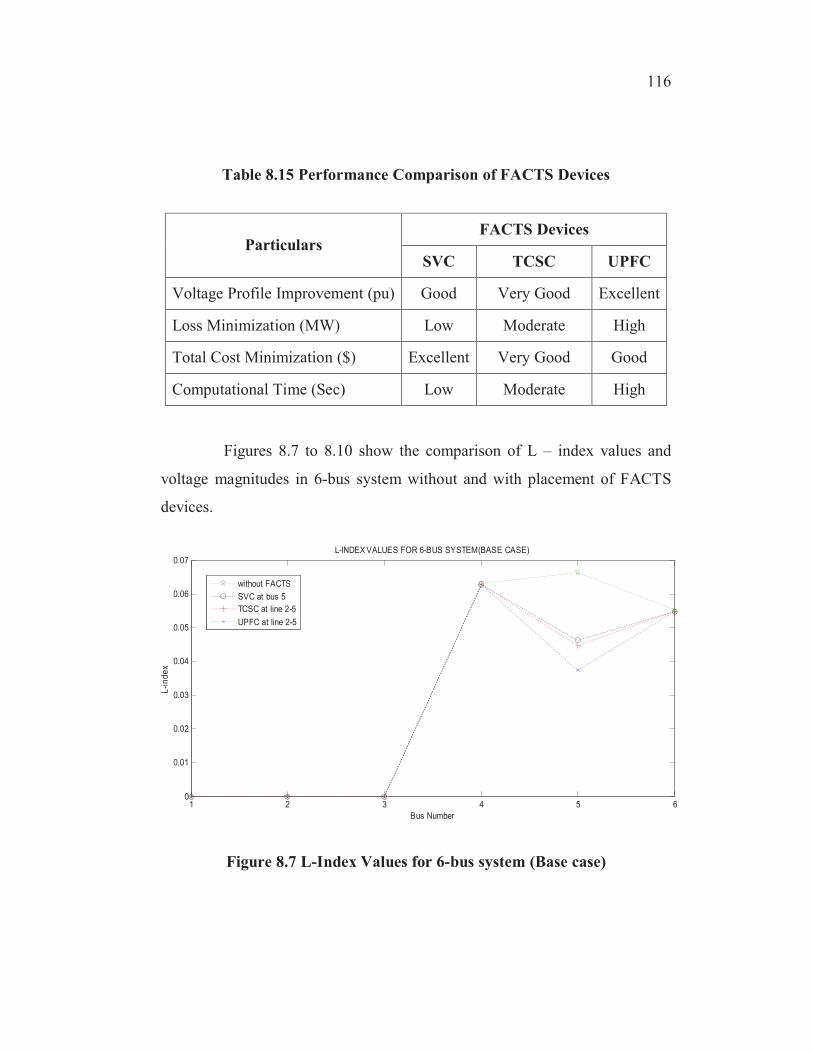
Table 8.15 Performance Comparison of FACTS Devices
FACTS DevicesParticulars
SVC TCSC UPFC
Voltage Profile Improvement (pu) Good Very Good Excellent
Loss Minimization (MW) Low Moderate High
Total Cost Minimization ($) Excellent Very Good Good
Computational Time (Sec) Low Moderate High
Figures 8.7 to 8.10 show the comparison of L – index values and
voltage magnitudes in 6-bus system without and with placement of FACTS
devices.
1 2 3 4 5 60
0.01
0.02
0.03
0.04
0.05
0.06
0.07
Bus Number
L-i
nd
ex
L-INDEX VALUES FOR 6-BUS SYSTEM(BASE CASE)
without FACTS
SVC at bus 5
TCSC at line 2-5
UPFC at line 2-5
Figure 8.7 L-Index Values for 6-bus system (Base case)

117
1 2 3 4 5 60.99
1
1.01
1.02
1.03
1.04
1.05
1.06
1.07
Bus Number
Voltage M
agnitude(p
.u.)
VOLTAGES VALUES FOR 6-BUS SYSTEM(BASE CASE)
without FACTS
SVC at bus 5
TCSC at line 2-5
UPFC at line 2-5
Figure 8.8 Voltage Magnitudes for 6-bus system (Base case)
1 2 3 4 5 60
0.02
0.04
0.06
0.08
0.1
0.12
Bus Number
L-i
nd
ex
L-INDEX VALUES FOR 6-BUS SYSTEM(CRITICAL CASE)
without FACTS
SVC at bus 5
TCSC at line 2-5
UPFC at line 2-5
Figure 8.9 L-Index Values for 6-bus system (Critical case)

118
1 2 3 4 5 60.94
0.96
0.98
1
1.02
1.04
1.06
Bus Number
Voltage M
agnitude(p
.u.)
VOLTAGES VALUES FOR 6-BUS SYSTEM(CRITICAL CASE)
without FACTS
SVC at bus 5
TCSC at line 2-5
UPFC at line 2-5
Figure 8.10 Voltage Magnitudes for 6-bus system (Critical case)
Figures 8.11 to 8.14 show the comparison of L – index values and
voltage magnitudes in IEEE 14-bus system without and with placement of
FACTS devices.
1 2 3 4 5 6 7 8 9 10 11 12 13 140
0.005
0.01
0.015
0.02
0.025
0.03
Bus Number
L-index
L-INDEX VALUES FOR IEEE 14-BUS SYSTEM(BASE CASE)
without FACTS
SVC at bus 14
TCSC at line 9-14
UPFC at line 9-14
Figure 8.11 L-Index Values for IEEE 14-bus system (Base case )

119
1 2 3 4 5 6 7 8 9 10 11 12 13 141.01
1.02
1.03
1.04
1.05
1.06
1.07
1.08
Bus Number
Vo
ltag
e M
ag
nitu
de(p
.u)
VOLTAGE MAGNITUDES FOR IEEE 14-BUS SYSTEM(BASE CASE)
without FACTS
SVC at bus 14
TCSC at line 9-14
UPFC at line 9-14
Figure 8.12 Voltage Magnitudes for IEEE 14-bus system (Base case)
1 2 3 4 5 6 7 8 9 10 11 12 13 140
0.02
0.04
0.06
0.08
0.1
0.12
Bus Number
L-index
L-INDEX VALUES FOR IEEE 14-BUS SYSTEM(CRITICAL CASE)
without FACTS
SVC at bus 14
TCSC at line 9-14
UPFC at line 9-14
Figure 8.13 L-Index Values for IEEE 14-bus system (Critical case)

120
1 2 3 4 5 6 7 8 9 10 11 12 13 140.94
0.96
0.98
1
1.02
1.04
1.06
Bus Number
Vo
lta
ge
Ma
gn
itu
de
(p.u
)
VOLTAGE MAGNITUDES FOR IEEE 14-BUS SYSTEM(CRITICAL CASE)
without FACTS
SVC at bus 14
TCSC at line 9-14
UPFC at line 9-14
Figure 8.14 Voltage Magnitudes for IEEE 14-bus system (Critical case)
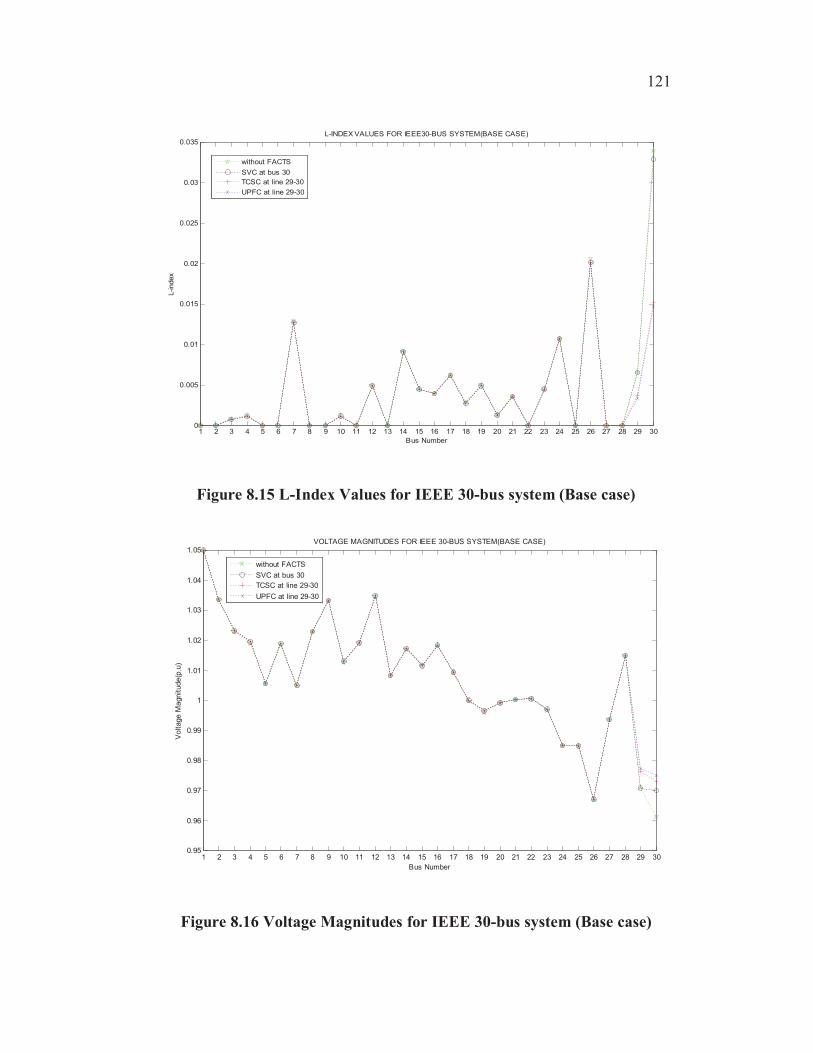
Figures 8.15 to 8.18 show the comparison of L – index values and
voltage magnitudes in IEEE 30-bus system without and with placement of
FACTS devices. From the results for all the three test systems, it is found that
TCSC produced better results in comparison with SVC. UPFC produced best
result in comparison with SVC and TCSC.
121
1 2 3 4 5 6 7 8 9 10 11 12 13 14 15 16 17 18 19 20 21 22 23 24 25 26 27 28 29 300
0.005
0.01
0.015
0.02
0.025
0.03
0.035
Bus Number
L-index
L-INDEX VALUES FOR IEEE30-BUS SYSTEM(BASE CASE)
without FACTS
SVC at bus 30
TCSC at line 29-30
UPFC at line 29-30
Figure 8.15 L-Index Values for IEEE 30-bus system (Base case)
1 2 3 4 5 6 7 8 9 10 11 12 13 14 15 16 17 18 19 20 21 22 23 24 25 26 27 28 29 300.95
0.96
0.97
0.98
0.99
1
1.01
1.02
1.03
1.04
1.05
Bus Number
Volt
age M
agnit
ude
(p.u
)
VOLTAGE MAGNITUDES FOR IEEE 30-BUS SYSTEM(BASE CASE)
without FACTS
SVC at bus 30
TCSC at line 29-30
UPFC at line 29-30
Figure 8.16 Voltage Magnitudes for IEEE 30-bus system (Base case)

122
1 2 3 4 5 6 7 8 9 10 11 12 13 14 15 16 17 18 19 20 21 22 23 24 25 26 27 28 29 300
0.01
0.02
0.03
0.04
0.05
0.06
0.07
Bus Number
L-in
de
x
L-INDEX VALUES FOR IEEE 30-BUS SYSTEM(CRITICAL CASE)
without FACTS
SVC at bus 30
TCSC at line 29-30
UPFC at line 29-30
Figure 8.17 L-Index Values for IEEE 30-bus system (Critical case)
1 2 3 4 5 6 7 8 9 10 11 12 13 14 15 16 17 18 19 20 21 22 23 24 25 26 27 28 29 300.94
0.96
0.98
1
1.02
1.04
1.06
Bus Number
Voltage M
agnitude(p
.u)
VOLTAGE MAGNITUDES FOR IEEE 30-BUS SYSTEM(CRITICAL CASE)
without FACTS
SVC at bus 30
TCSC at line 29-30
UPFC at line 29-30
Figure 8.18 Voltage Magnitudes for IEEE 30-bus system (Critical case)

123
Table 8.16 shows the results comparison between FVSI and L-
index. Based on the test results, it is found that L-index gives high loss
reduction with less computational time.
Table 8.16 Results Comparison between FVSI and L-index
IEEE-14 Bus
FVSI
IEEE-14 Bus
L-indexAlgorithm Particulars
Base
case
Critical
case
Base
Case
Critical
case
Real Power
Loss(MW)13.35 58.68 13.19 58.42
Bacterial Foraging
Optimization
Algorithm (BFOA)
for SVC
Computational
Time(sec)
42 58 38 52
Real Power
Loss(MW)13.28 58.46 13.16 58.34
Bacterial Foraging
Optimization
Algorithm (BFOA)
for TCSC
Computational
Time(sec)46 60 42 58
Real Power
Loss(MW)13.20 58.12 13.05 58.08
Bacterial Foraging
Optimization
Algorithm (BFOA)
for UPFC
Computational
Time(sec)57 68 51 66

124
8.3 CONCLUSION
L-index values, voltage profile at each bus and power loss of
the systems without FACTS devices are calculated by
developing Newton-Raphson load flow algorithm to 6-bus,
IEEE 14-bus and IEEE 30-bus test systems.
Based on L-index values, the vulnerable load bus is identified
for the placement of FACTS devices.
SVC, TCSC and UPFC are placed accordingly and achieved
the multi-objectives of minimization of real power loss, L-
index, improvement of voltage profile, minimization of total
cost and enhancement of voltage stability.
From the results, it is concluded that the systems perform
better when the FACTS devices are connected. Results show
that Bacterial Foraging Algorithm can be used to optimize the
power system for practical and large scale applications.