chapter 8: hypothesis testing - uc...
TRANSCRIPT

CH8: Hypothesis Testing Santorico - Page 269
CHAPTER 8: Hypothesis Testing
In this chapter we will learn ….
To use an inferential method called a hypothesis test To analyze evidence that data provide To make decisions based on data
Major Methods for Making Statistical Inferences about a Population
The traditional Method The p-value Method Confidence Interval
CH8: Hypothesis Testing Santorico - Page 270
Section 8-1: Steps in Hypothesis Testing – Traditional Method
The main goal in many research studies is to check whether the data collected support certain statements or predictions. Statistical Hypothesis – a conjecture about a population parameter. This conjecture may or may not be true. Example: The mean income for a resident of Denver is equal to the mean income for a resident of Seattle.
Population parameter is mean income One population consists of residents of Denver while the
other consists of residents of Seattle.
CH8: Hypothesis Testing Santorico - Page 271
There are two types of statistical hypotheses: Null Hypothesis (H0) – a statistical hypothesis that states that there is no difference between a parameter and a specific value, or that there is no difference between two parameters. Alternative Hypothesis (H1) – a statistical hypothesis that states the existence of a difference between a parameter and a specific value, or states that there is a difference between two parameters. Can you formulate a null and alternative hypothesis for the income example?

CH8: Hypothesis Testing Santorico - Page 272
We tend to want to reject the null hypothesis so we assume it is true and look for enough evidence to conclude it is incorrect. We tend to want to accept the alternative hypothesis. If the null hypothesis is rejected then we must accept that the alternative hypothesis is true. Note: H0 will ALWAYS have an equal sign (and possibly a less than or greater than symbol, depending on the alternative hypothesis). The alternative hypothesis has a range of values that are alternatives to the one in
H0. The null and alternative hypotheses are stated together. The following are typical hypothesis for means, where k is a specified number.

CH8: Hypothesis Testing Santorico - Page 273
Note: Right-tailed and left-tailed tests are distinguished by the way the greater than or less than points. It is the direction where are alterative places the true mean.
k
CH8: Hypothesis Testing Santorico - Page 274
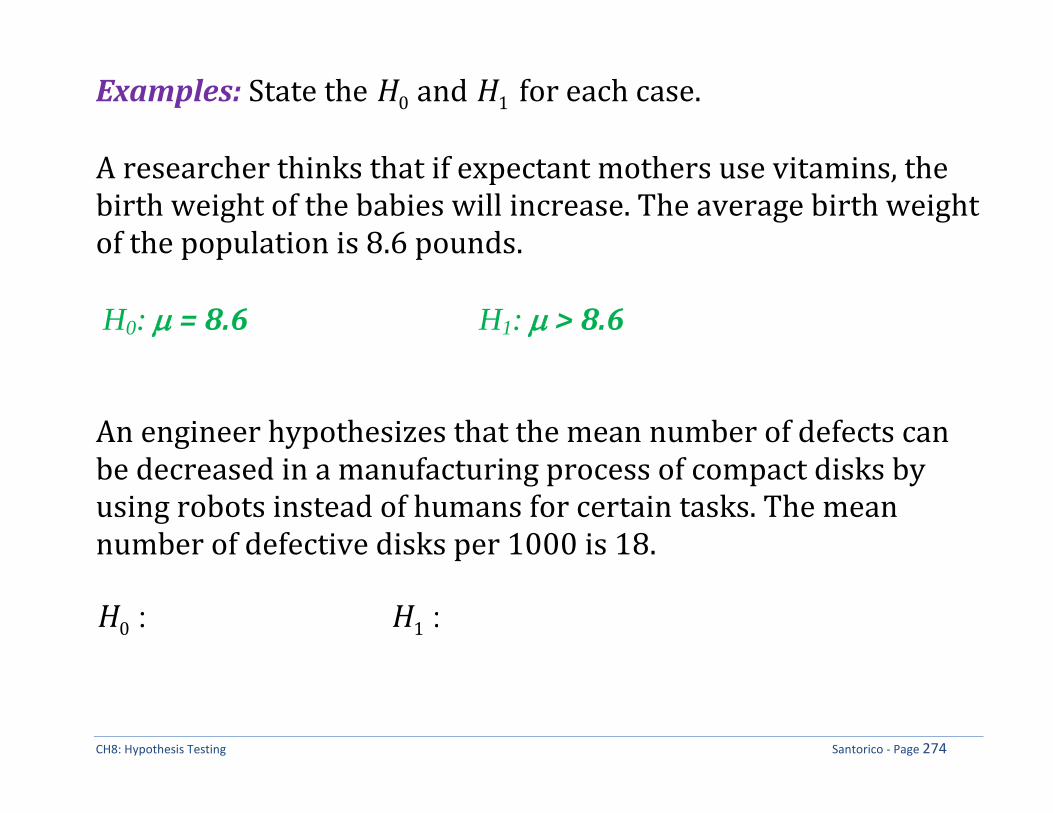
Examples: State the
H0 and
H1 for each case. A researcher thinks that if expectant mothers use vitamins, the birth weight of the babies will increase. The average birth weight of the population is 8.6 pounds. H0: = 8.6 H1: > 8.6 An engineer hypothesizes that the mean number of defects can be decreased in a manufacturing process of compact disks by using robots instead of humans for certain tasks. The mean number of defective disks per 1000 is 18.
H0 :
H1 :

CH8: Hypothesis Testing Santorico - Page 275
A psychologist feels that playing soft music during a test will change the results of the test. The psychologist is not sure whether the grades will be higher or lower. In the past, the mean of the scores was 73.
H0 :
H1 : When a researcher conducts a study, he or she is generally looking for evidence to support a claim of some type of difference. In this case, the claim should be stated as the alternative hypothesis. Because of this, the alternative hypothesis is sometimes called the research hypothesis.

CH8: Hypothesis Testing Santorico - Page 276
Keywords help to indicate what the null and/or alternative hypotheses should be.

CH8: Hypothesis Testing Santorico - Page 277
After stating the hypotheses, the researcher designs the study.
Select the correct statistical test Choose an appropriate level of significance Formulate a plan for conducting the study
Statistical Test – uses the data obtained from a sample to make a decision about whether the null hypothesis should be rejected. Test Value (test statistic) – the numerical value obtained from a statistical test. **Each statistical test that we will look at will have a different formula for calculating the test value. In reality, the null hypothesis may or may not be true, and a decision is made to reject or not reject it on the basis of the data obtained from a sample. Below are the four possible outcomes.

CH8: Hypothesis Testing Santorico - Page 278
When we make a conclusion from a statistical test there are two types of errors that we could make. They are called: Type I and Type II Errors
Type I error – reject H0 when H0 is true.
Type II error – do not reject H0 when H0 is false.
Results of a statistical test:
H0 is True
H0 is False
Reject
H0 Type I Error
Correct Decision
Do not Reject
H0 Correct Decision
Type II Error

CH8: Hypothesis Testing Santorico - Page 279
Example: Decision Errors in a Legal Trial . What are
H0 and
H1?
H0: Defendant is innocent. H1: Defendant is not innocent, i.e., guilty

CH8: Hypothesis Testing Santorico - Page 280
If you are the defendant, which is the worse error? Why?
The decision of the jury does not prove that the defendant did or did not commit the crime.
The decision is based on the evidence presented. If the evidence is strong enough the defendant will be
convicted in most cases, if it is weak the defendant will be acquitted.
So the decision to reject the null hypothesis does not prove anything.
The question is how large of a difference is enough to say we have enough evidence to reject the null hypothesis?

CH8: Hypothesis Testing Santorico - Page 281
Significance level - is the maximum probability of committing a Type I error. This probability is symbolized by
.
P(Type I error|H0 is true) Critical or Rejection Region – the range of values for the test value that indicate a significant difference and that the null hypothesis should be rejected. Non-critical or Non-rejection Region – the range of values for the test value that indicates that the difference was probably due to chance and that the null hypothesis should not be rejected.
CH8: Hypothesis Testing Santorico - Page 282
Critical Value (CV) – separates the critical region from the non-critical region, i.e., when we should reject H0 from when we should not reject H0.
The location of the critical value depends on the inequality sign of the alternative hypothesis.
Depending on the distribution of the test value, you will use different tables to find the critical value.

CH8: Hypothesis Testing Santorico - Page 283
One-tailed test – indicates that the null
hypothesis should be rejected when the
test value is in the critical region on one
side.
Right-tailed test – when the
critical region is on the right side
of the distribution of the test
value.
Left-tailed test – when the
critical region is on the left side
of the distribution of the test
value.
Two-tailed test – the null hypothesis
should be rejected when the test value is
in either of two critical regions on either
side of the distribution of the test value.
CH8: Hypothesis Testing Santorico - Page 284
To obtain the critical value, the researcher must choose the significance level,
, and know the distribution of the test value.
The distribution of the test value indicates the shape of the distribution curve for the test value. This will have a shape that we know (like the standard normal or t distribution).
Let’s assume that the test value has a standard normal distribution.
We should use Table E (the standard normal table) or Table F (using the bottom row of the t distribution, which is equivalent to a standard normal distribution) to find the critical value.

CH8: Hypothesis Testing Santorico - Page 285
Finding the Critical Values for Specific α Values, Using Table E Step 1: Draw a figure for the distribution of the test values and indicate the appropriate area for the rejection region.
If the test is left-tailed, the critical region, with area equal to α, will be on the left side of the distribution curve.
If the test is right-tailed, the critical region, with area equal to α, will be on the right side of the distribution curve.
If the test is two-tailed, α must be divided by 2; the critical regions will be in each end of the distribution curve - half the area in the left part of the distribution and half of the area in the right part of the distribution.
CH8: Hypothesis Testing Santorico - Page 286
Step 2:
For a left-tailed test, use the z value that corresponds to the area equivalent to
in Table E, i.e.,
z1 , the
percentile of the distribution.
For a right-tailed test, use the z value that corresponds to the area equivalent to
1 in Table E, i.e.,
z, the
1 percentile of the distribution.
For a two-tailed test, use the z value that corresponds to
/2 for the left lower CV. It will be negative. Change the sign to positive and you will get the critical value for the right side.

CH8: Hypothesis Testing Santorico - Page 287
-4 -2 0 2 4
0.0
0.1
0.2
0.3
0.4
Z
P(Z
)
Example: Find the critical value(s) for each situation and draw the appropriate figure, showing the critical region. Left-tailed test with α = 0.005
Looking up 0.005 in the Z table We have Z = -2.575. Right-tailed test with α = 0.01
-4 -2 0 2 4
0.0
0.1
0.2
0.3
0.4
Z
P(Z
)
0.005

CH8: Hypothesis Testing Santorico - Page 288
Two-tailed test with α = 0.1
Left-tailed test with α = 0.2
-4 -2 0 2 4
0.0
0.1
0.2
0.3
0.4
Z
P(Z
)
-4 -2 0 2 4
0.0
0.1
0.2
0.3
0.4
Z
P(Z
)
CH8: Hypothesis Testing Santorico - Page 289
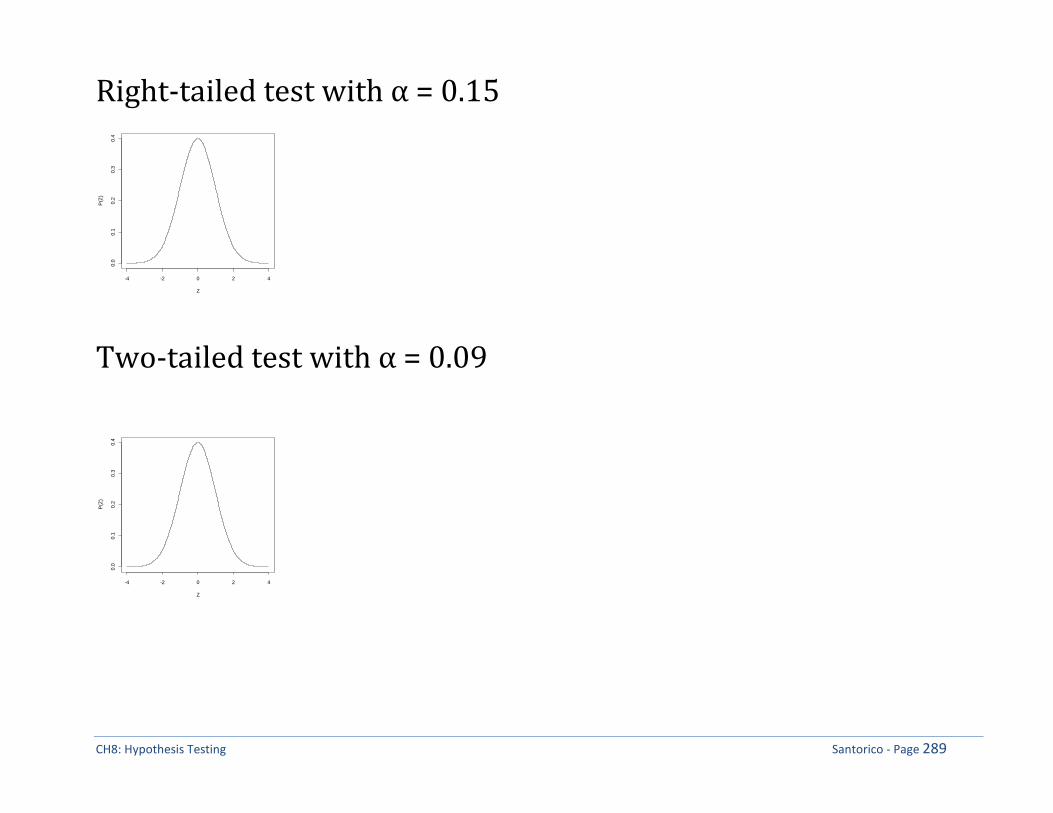
Right-tailed test with α = 0.15
Two-tailed test with α = 0.09
-4 -2 0 2 4
0.0
0.1
0.2
0.3
0.4
Z
P(Z
)
-4 -2 0 2 4
0.0
0.1
0.2
0.3
0.4
Z
P(Z
)

CH8: Hypothesis Testing Santorico - Page 290
Hypothesis Test Procedure (Traditional Method) Step 1 State the hypotheses and identify the claim. Step 2 Find the critical value(s) from the appropriate table. Step 3 Compute the test value. Step 4 Make the decision to reject or not reject the null hypothesis. Step 5 Summarize the results.