chapter 8 echo characterization in active sonar using...
TRANSCRIPT

Chapter 8
Echo Characterization in Active Sonar
using Wigner Ville Distribution
Active sonar echo characterization and classification are two
new functions added to the repertoire of sonar functions in the recent years. Prior to
classification, the received echoes have to be analyzed to extract its features. In this
chapter, the potential of Wigner ViIle Distribution (WVD) as a base algorithm for
echo characterization in active sonars is demonstrated. A novel technique combining
WVD with FrFT has been developed to overcome the problem of cross-terms in WVD,
thereby representing the active echoes with excellent clarity in the time-frequency
map. The under water scenario for active target classification is first explained. The
denoising capability of FrFT with multi-component signals is then highlighted, after
which, the new implementation scheme combining these two time-frequency methods
is explained. As a comparison, computations of Pseudo WVD are also demonstrated.
This is followed with the simulation results with single and multiple chirps embedded
in noise, along with the results of analyzing recorded underwater data. The ROC
curves highlighting the SNR improvements compared to direct WVD implementation
are also generated. The chapter is concluded by highlighting the results and
discussing the important findings of the new implementation.
130 Chapter 8
8.1 Introduction Passive classification techniques for extracting the frequencies of machinery and the
propeller shafts are widely used in sonars. But active sonar echo characterisation and target
classification from the received echoes are two areas where few developments are reported.
In active sonar, a signal transmitted from a source is reflected from the target ship. The
received signal called the echo is modified in its features like duration, bandwidth, envelope
shape etc. Characterising the echo will help in classifying the contact and understanding the
medium also. Depending on the different types of targets (surface or submerged) and
different aspects of the same target (ahead or behind or along side), the echoes will be
different. The first step in contact classification however is echo characterisation. In this
chapter, a WVD-based technique for this purpose is discussed and the results are
demonstrated. This teclmique can be used as a pre-processing algorithm for echo
characterisation.
Among all time-frequency representations, WVD is the best in terms of achievable
time and frequency resolutions [14,15]. However, it is the least used one, mainly because of
the problem of cross-terms. Excellent time and frequency resolutions are possible with WVD
if the signal has only one component, which is not the practical situation. With multi
component signals and noisy mono-component signals, the WVD representation is distorted
by cross-terms, thereby affecting the signal analysis required by the different applications.
Many techniques have been proposed to reduce these cross terms namely Pseudo WVD,
members of Cohen class etc[ 14, 15]. These techniques have high computational complexity.
Also, they achieve the cross-term reduction at the cost of time or frequency resolution or both.
Our aim has been to develop an analysis technique which guarantees good resolution
and does not suffer the disturbances of cross-terms. Consequently, one is able to represent
chirp signals with an excellent resolution in the time frequency map. One noticeable
characteristic of all the cross-term reduction methods mentioned above is that they all modify
the WVD equation, which means the reduction process occurs along with the WVD
operation. That accounts for the loss of resolutions. But, if we can do the denoising prior to
WVD operation, the loss of resolution can be reduced. This is the principal motivation for
evolving the WVD-FrFT combo algorithm. Denoising teclmiques using wavelets are available
131 Echo Characler;ztJIion in Active Sonar Using WVD
in literaturc[56.57J. However, from tbe simulation results on FrFT in chapter.; 5 and 6. the
exce llent denoising capabilities of FrFT are demonstrated. Added to that, FrFT is ideal for
chirp analysis. Active echoes being chirps mostly, FrFT will be better than WT as a denoising
too l. [n the sections (0 follow. the effecti .... e utilization o f FrFT to recover the high resolution
possible in WY D is demonstrated.
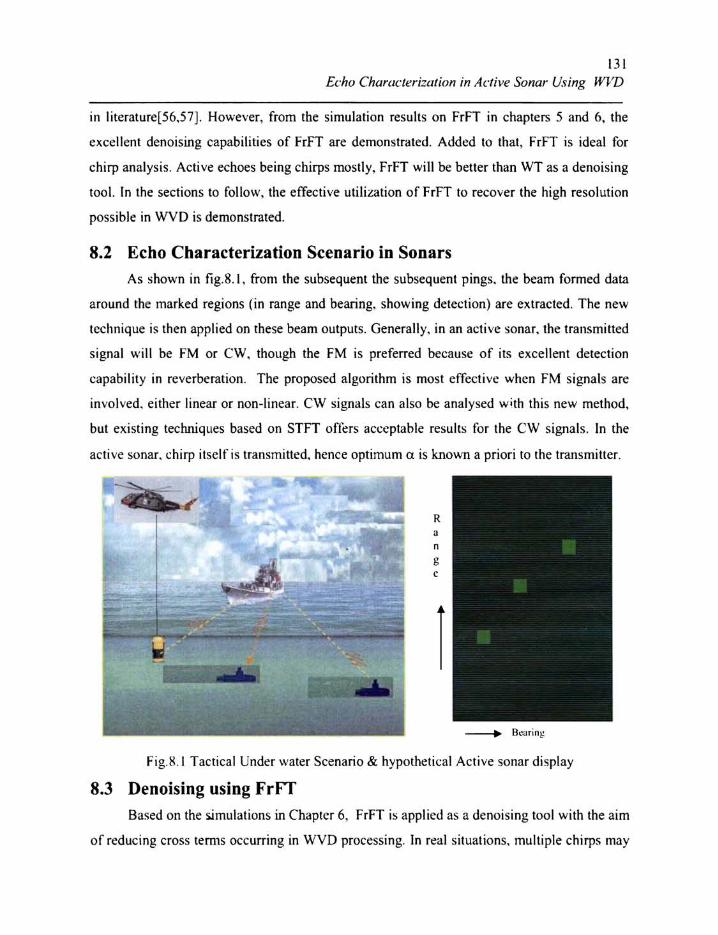
8.2 Echo Characterization Scenario in Sonars As shown in fig.8 .1. from the subsequent the subseq uent pings. the beam formed data
around the marked regions (in range and bearing. showing detecti on) are extracted. The new
techniq ue is then applied on these beam outputs. Generall y. in an active sonar. the transmitted
signal will be FM or CW. though the FM is preferred because of its exce llent detection
capabi lity in reverberation. The proposed algorithm is most effecti ve when FM signa ls are
in volved. either linear or non· linear. CW signals can also be analysed with this new method.
but existing techniques based on STFT offers acceptable results for the CW signa ls. In the
active sonar. chirp itselfi s transmi tted. hence optimum a is kno ..... n a priori to the transmitter.
Fig.H.1 Tactica l Under water Scenario & hypothetica l Active sonar di splay
8.3 Denoising using FrFT Based on the 5.imulations in Chaptcr 6. FrFT is applicd as a denoising too l with the aim
of rcducing cross temlS occurring in WYD processing. In real situations. multiple cbirps may
132 Chapter 8
be present that too embedded in noise. The signal to be analyzed may contain more than one
chirp, and these chirps may be overlapping in frequency or time or both. However, each of
them wiIl peak in the FrFT output for its corresponding optimum a only.
Extraction and reconstruction of just one of the chirps from the mixture can be
achieved by performing an equivalent inverse FrFT on one of the spike components in the
FrFT output. A filtering process, which can be performed on the FrFT output, consists of
retaining the minimum number of points either side of the chirp component to be extracted
and zeroing all values outside this range of the complex FrFT output. An inverse FrFT of
equivalent order is applied to the resultant and the real part of its output gives the
reconstructed chirp component in the time domain. So, while the chirp is being extracted,
denoising also takes place along with it. Also, this denoising method is applicable for both
linear as well as non-linear chirps. Simulations to demonstrate this extraction method is given
in section 6.2.4 of chapter 6.
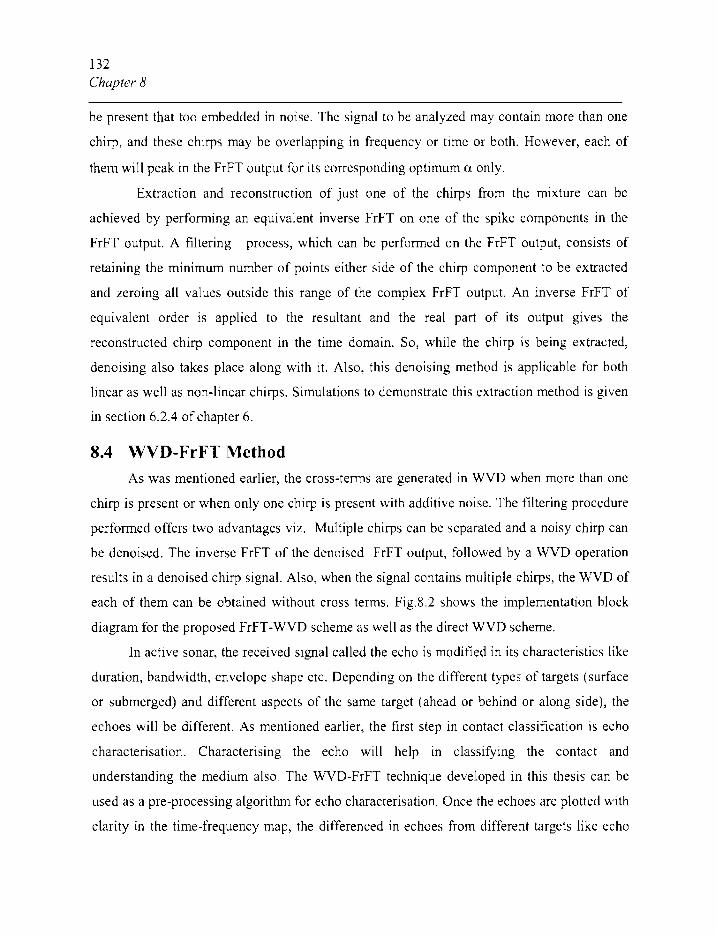
8.4 WVD-FrFT Method As was mentioned earlier, the cross-terms are generated in WVD when more than one
chirp is present or when only one chirp is present with additive noise. The filtering procedure
performed offers two advantages viz. Multiple chirps can be separated and a noisy chirp can
be denoised. The inverse FrFT of the denoised FrFT output, followed by a WVD operation
results in a denoised chirp signal. Also, when the signal contains multiple chirps, the WVD of
each of them can be obtained without cross terms. Fig.8.2 shows the implementation block
diagram for the proposed FrFT -WVD scheme as well as the direct WVD scheme.
In active sonar, the received signal called the echo is modified in its characteristics like
duration, bandwidth, envelope shape etc. Depending on the different types of targets (surface
or submerged) and different aspects of the same target (ahead or behind or along side), the
echoes will be different. As mentioned earlier, the first step in contact classification is echo
characterisation. Characterising the echo wiIl help in classifying the contact and
understanding the medium also. The W'VD-FrFT technique developed in this thesis can be
used as a pre-processing algoritlun for echo characterisation. Once the echoes are plotted with
clarity in the time-frequency map, the differenced in echoes from different targets like echo

III Echo Characterization in Active Sonar U.~·ing WVD
bandwidth, shape. slope change. start and end frequencies can be eXlracled as its
characteristics. These characteristics can be then used for target classification. The feature
extraction and classification functions have not been attempted in this thesis.
___ -..-IP'
.-------'-, FrFT WVD
Input Signlll
Hilbtrl TllIlIsform
[knolslng
Fig.8.2 -Implementation Block Diagram
8.5 Simulation Results
\\V D
The simulations are done on synthetic analytic linear and non·linear chirps,
overlapping in lime and frequency. They ill ustrate the potential of this approach in practical
applications. All simulati ons have been done on Matlab. Hilbert trdnsform has been used
extensively in the following examples to convert real signals to an analytic fonn compri sing
of the positi ve frequency components of the input signals only.
The dcveloped method is illustrated with three examples. The fi rst simulation is done
with a single noisy ch irp. In the second simulation, two overlapping noi sy chirps are
considered, a linear and a hyperbolic chirp. The last simulation has been done with three
overlapping chirps. The simulat ion details are tabulated in lablt! 8. 1. Two or more targets
being present at same ranges may not happen in general . But in these simulations. cases of
two or morc chirps overlapping in time and frequency are considered. Such situati ons are
simulated only to demonstrate the efficiency of this new techniq ue, even under such worst
134 Chapter 8
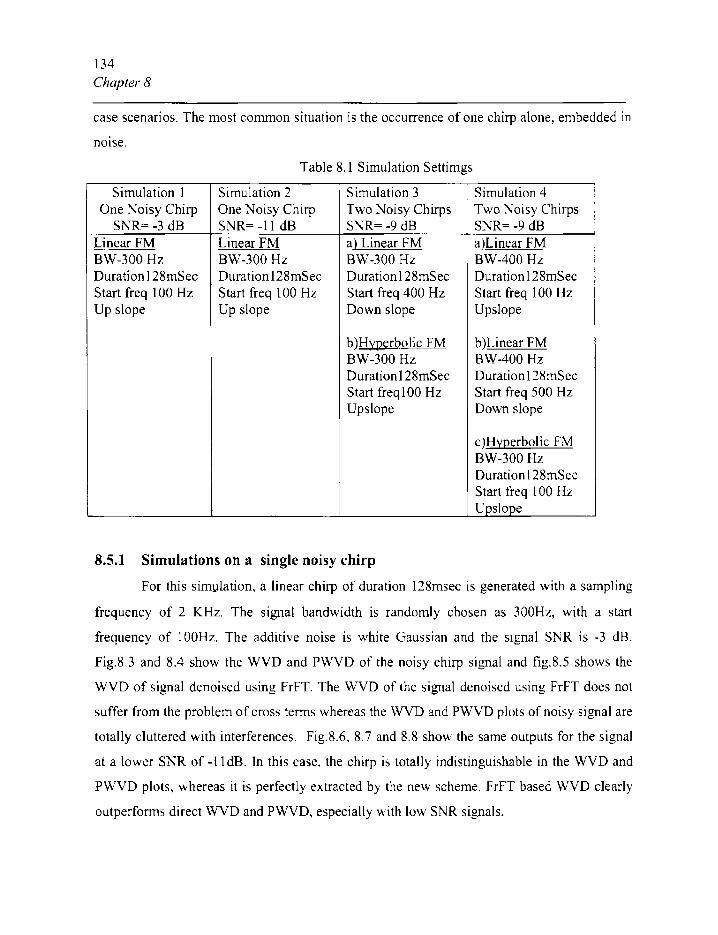
case scenarios. The most common situation is the occurrence of one chirp alone, embedded in
nOIse.
Table 8.1 Simulation Settimgs
Simulation I Simulation 2 Simulation 3 Simulation 4 One Noisy Chirp One Noisy Chirp Two Noisy Chirps Two )Joisy Chirps
Sl\'R= -3 dB SNR= -11 dB SKR= -9 dB S)JR= -9 dB Linear FM Linear FM a} Linear FM a)Linear FM BW-300 Hz BW-300 Hz BW-300 Hz BW-400 Hz Duration 128mSec Duration 128mSec Durationl28mSec Duration 128mSec Start freq 100 Hz Start freq 100 Hz Start freq 400 Hz Start freq 100 Hz Up slope Up slope Down slope Upslope
b)HJ:l2erbolic FM b)Linear FM BW-300 Hz BW-400 Hz Duration 128mSec Duration 128mSec Start freqlOO Hz Start freq 500 Hz Upslope Down slope
c )HYl2erbolic FM BW-300 Hz Duration l28mSec Start freq 100 Hz Upslope
8.5.1 Simulations on a single noisy chirp
For this sim~lation, a linear chirp of duration 128msec is generated with a sampling
frequency of 2 KHz. The signal bandwidth is randomly chosen as 300Hz, with a start
frequency of 100Hz. The additive noise is white Gaussian and the signal SNR is -3 dB.
Fig.8.3 and 8.4 show the WVD and PWYD of the noisy chirp signal and fig.8.S shows the
WYD of signal denoised using FrFT. The WVD of the signal denoised using FrFT does not
suffer from the problem of cross terms whereas the WVD and PWVD plots of noisy signal are
totally cluttered with interferences. Fig.8.6, 8.7 and 8.8 show the same outputs for the signal
at a lower SKR of -{ldB. In this case, the chirp is totally indistinguishable in the WVD and
PWVD plots, whereas it is perfectly extracted by the new scheme. FrFT based WVD clearly
outperforms direct WVD and PWVD, especially with low SNR signals.

I '
t
i
135 £clw Chllmcrcri=!lIion ill Aer;l·c Sonal" Usilli: Ivl"D
, -Fig.S.3 - WVD of Single Chirp(-3dB)
-Fig.8.6 - WYD of Single Chirp(- ll dB)
- -Fig.S.4 - PWYD of Single Chirp(-3dB) Fig.S.7 - PWYD of Single Chirp(- I I dB)
WYh_ .. -._
Fig.X.:'-\\,VD or FrFT D.:noi !;.:d Chirp
,-3dU ,
Fig.8.8 - \VVD of FrFT Dcnois.:d Chirp
,-lldB )
136
Chapl!'!' 8
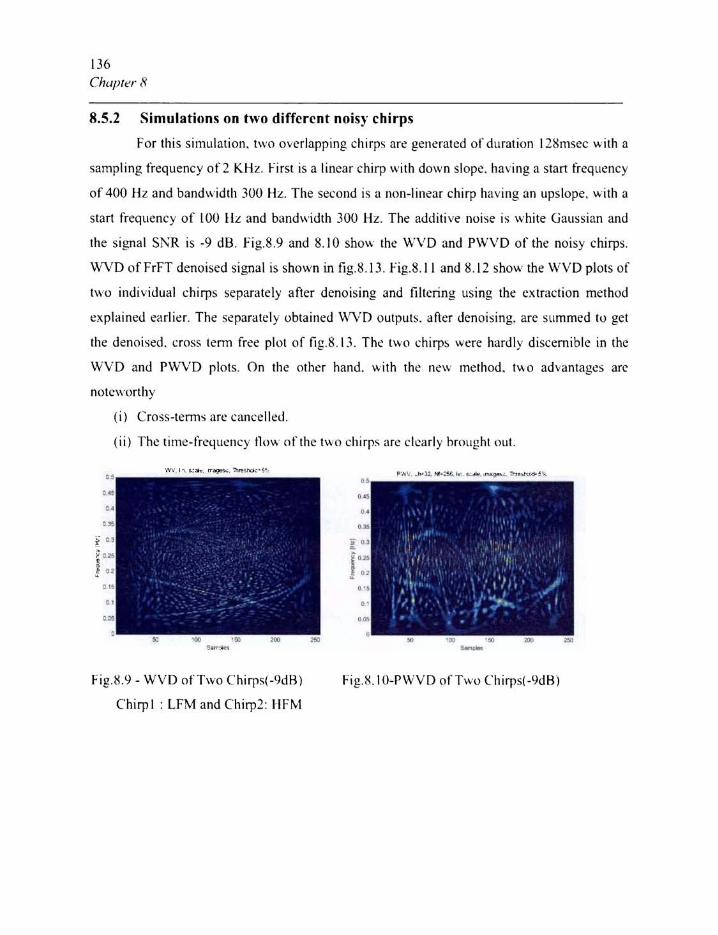
8.5.2 Simulations on h\'o different noisy chirps
For this simulation. two overlapping chirps are generated of duration 12Smsec with a
sampl ing frequency of2 KH z. First is a lincnT chirp with down slope, having a stan frequency
of 400 I-I z and bandwidth 300 I-IL. The second is U llon·linear chirp having an upslopc. with a
start frequency of lOO IIz and bandwidth 300 Hz. The additive noise is white Gaussian and
the signa l SKR is -9 dB . Fig.8.9 and 8. \0 show the \VVD and PWVD of the noisy chirps.
WVD of FrFT denoi sed signal is shown in fig .8.13. Fig.8. 1 [ and 8.12 shQl,\," the WVD plots of
two individual chirps separately after dcnoising and filtering using the extracti on method
cxplainL-d earlier. The separately obtained WV[) outputs, after dcn oising. arc summed tu get
the denoised. cross.t~nn free plot of fig ,8.1J, The two t:hirps were hardly discernible in the
WVD and PWYO plots. On the other hand. with the ncw method. tv,o advantagl!s arc
noteworthy
(i) C ross-tcnns llrc cancelled.
(ii) The timc-fn:quency !low of the two chirps are ckarl y brought out .
Fig.~.l} - WVD ofTwoChirps(-9dR)
Chirp I : LFM and Chirp2: I-IFM
Fig ,!c(. l O-PWVD of Two Chirps(-9dH)

m 't(\'lI C\\l\H\I.:\~r\:l\f\On \n ;\I.:\h~ ~\lnur ~$.\"'~ \'\\\)
FigX 11 - \VVD uf FrFT Denoiscd Chirp]
(-9dH)
Fig , ~. 12-\\"VD of FrFT Dcnoi s..:d Chjrp~
1-90B)
Fig.g. 13- \V VD of Denoi seJ Chirps( -9JB)
H.S.3 Simulations on Three Different ~oisy Chirps
In order to .demonstrate that the new method developed here works wel l with any
number of chirps. three overlapping chirps are generated of duration 12Xmsec with a sampling
frequency of 2 KHz. First one is ,I linear chirp with upslupc. ha\"ing a start frequt"ncy of 100
H/ and bandwidth 400 1[/. Thl' se("ond onc is a linear chirp having an down slope. with a s1<ln
frcqu..:ncy of 500 il L and bandwidth 400 IIz. The third one is ;1 non-linear chirp having an
upslope. with a start fn:q uclIl'Y or I UO Hz and bandwidth 300 HL. Fig.X. 14 and 8. 15 show tht:
WVD and PWVD of lhc noi sy ~hirps. WVD of FrFT dcnniscd )-l ignal is shown in fig .::': . 19.
Fig.X. 16. 8. 17 ,md 8.1 ~ shU\\ Ih..: WV() plots of Ihn~c chirps scparalely after denoising and
fillcring.

1.1R Chap!('/" ('\
-Fig.8.14 - WYD ofThree Chirps(-9dB) Fig.8. 15 - PWY D ofThree Chirps(-9dB)
Fig.8. 16 . \vVD of FrFT Denoised
Chirp l (-9dB)
flg .~. 1 8 - WVD of hfT Dcnois(:d
Chirp] (·9dHl
Fig.8.17 . WVD of FrFT Denoised
Chirp2 (-9dB)
Fig.X.19 - The WVD of O..:noised Chirps
(-9 dH )

139 Echo Characterization in Active Sonar Using WVD
8.5.4 PerformaDce Evaluation
The performance analysis of the new technique is done for different SNRs. Fig. 8.20
and 8.21 show the PO vs SNR plot for two different probabilities of false alarms. 0.001 and
0.0001 for a signal with single chirp. Similar curves were obtained for signals with two and
three chirps. Montecarlo simulations were done to obtain these performance curves. The
performance is remarkable , especially at low SNR values. At PO of 50%, the proposed
FrFT -WVD scheme shows an improvement of 5 dB over the conventional WVD scheme.
0.'
0.'
I
/ . .
I
I
. I
0.0001
0 .1
1 o~._".:c."_£.:: •. :_::_:-:_ •• _. ___ ~-;;:'----;;--_-;;--_-! -30 ~ ·211 ·15 . -.10 .s 0
'''' Fig.8.20· PD vs S:-IR ( PFA~O.OOOI )
0.' r
0.' ! .~ 0-1
10.11
H ' I f o4L ! 11.. 0.3 1
" I '" "." " . ,
" 0 ..,
'" ." ." ." • 0 , ''''
Fig.8.21 - PD vs SKR (PF A=O.OO I)
140
Chapter 8
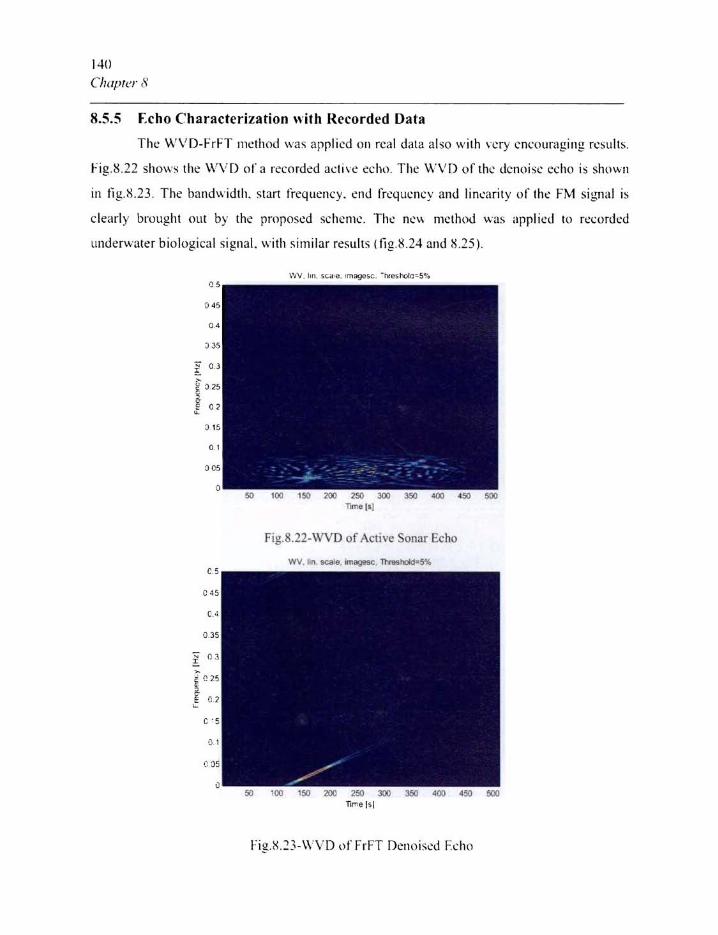
8.5.5 F.cho Characterization with Recorded Data
Thl" W"D-FrFT method was arrli ~d Oil real data also wi th n~ry cm:ouragi ng n.:sults.
F ig . ~.22 shows the \\,VD of a recorded active echo. The \\IV !) of the dcnoi s\'" echo is !Oho\N 1l
in ligX23 . The handwidth. !Otart frequency. end frcquency and li ncarity uf th \,.' FM !Oignal is
clearly bnmghl Ollt by the proposed sc hcmc. Thc nc\\ method was appl icd to n:wrdcd
underv .. ·ater biological signaL with s imi lar resul ts t fig .S.24 and S.25) .
Fig.S.22-WVD of Active Sonar Echo
~ 100 100 ~ ~ ~ ~ ~ ~ ~ Tome t$t
F i g.X . ~3-\\"" V D \) 1" FrFT Dcnoiscd Echo

141 Helm Clwracr<!ri~ariol/ in Acril"e SUllar Using IV/CO
100 200 3IXI 400 soo 600 100 800 900 1000 TIITI8 [I)
Fig.8.24. WVD of Biological Noise
Fig.H.25-\VVO ofFrFT IA!noiscd Biologkalnoisl'
142 Chapter 8
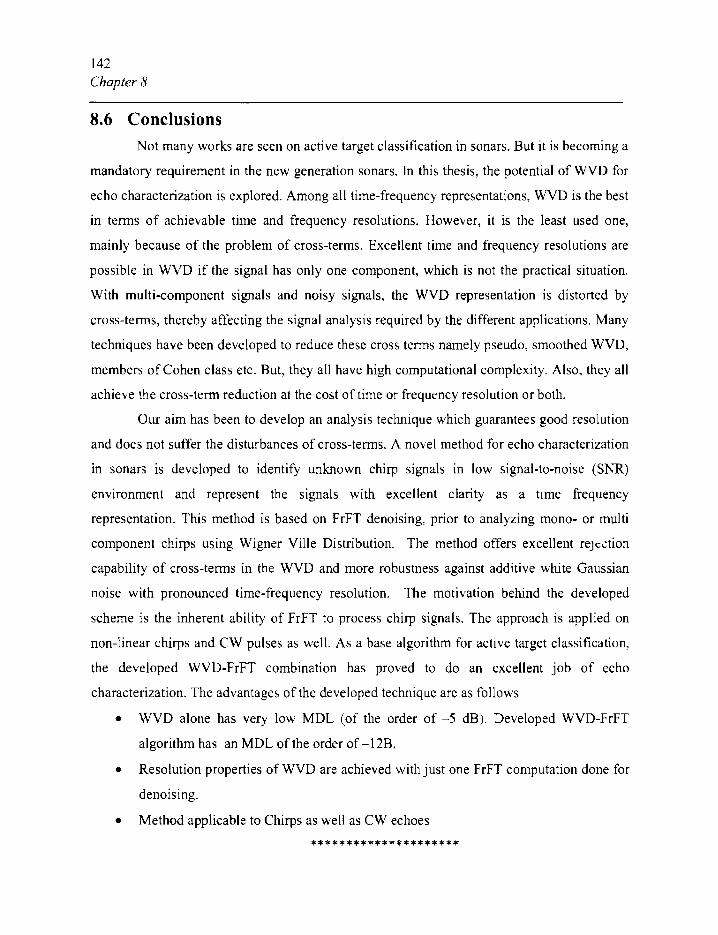
8.6 Conclusions Not many works are seen on active target classification in sonars. But it is becoming a
mandatory requirement in the new generation sonars. In this thesis, the potential of WVD for
echo characterization is explored. Among all time-frequency representations, WVD is the best
in terms of achievable time and frequency resolutions. However, it is the least used one,
mainly because of the problem of cross-terms. Excellent time and frequency resolutions are
possible in WYD if the signal has only one component, which is not the practical situation.
With multi-component signals and noisy signals, the WVD representation is distorted by
cross-terms, thereby affecting the signal analysis required by the different applications. Many
techniques have been developed to reduce these cross tenns namely pseudo, smoothed WYD,
members of Cohen class etc. But, they all have high computational complexity. Also, they all
achieve the cross-term reduction at the cost of time or frequency resolution or both.
Our aim has been to develop an analysis technique which guarantees good resolution
and does not suffer the disturbances of cross-terms. A novel method for echo characterization
in sonars is developed to identify unknown chirp signals in low signal-to-noise (S1\R)
environment and represent the signals with excellent clarity as a time frequency
representation. This method is based on FrFT denoising, prior to analyzing mono- or multi
component chirps using Wigner VilIe Distribution. The method offers excellent reJ~-:tion
capability of cross-terms in the WVD and more robustness against additive white Gaussian
noise with pronounced time-frequency resolution. The motivation behind the developed
scheme is the inherent ability of FrFT to process chirp signals. The approach is applied on
non-linear chirps and CW pulses as well. As a base algorithm for active target classification,
the developed WVD-FrFT combination has proved to do an excellent job of echo
characterization. The advantages of the developed technique are as follows
• WYD alone has very low MDL (of the order of -5 dB). Developed WVD-FrFT
algorithm has an MDL of the order of -12B.
• Resolution properties of WYD are achieved with just one FrFT computation done for
denoising.
• Method applicable to Chirps as well as CW echoes
*********************