chapter 8
DESCRIPTION
Chapter 8. Interval Estimates For Proportions, Mean Differences And Proportion Differences. Figure 8.1 The Sampling Distribution of for Our Small-Scale Illustration. f ( ). 1.00. P ( ). .667. .167. 0 .5 1.0. - PowerPoint PPT PresentationTRANSCRIPT

Chapter 8
Interval Estimates For Proportions,
Mean Differences And Proportion Differences

Figure 8.1 The Sampling Distribution of for Our Small-Scale Illustration
p
0.0 1/6 = .167
.5 4/6 = .667
1.0 1/6 = .167
p f( )p
1.00

Figure 8.2 A Bar Chart Showing the
Sampling Distribution of pP( )p
p
.167
.667
Sample Proportion of Favorable Responses
0 .5 1.0
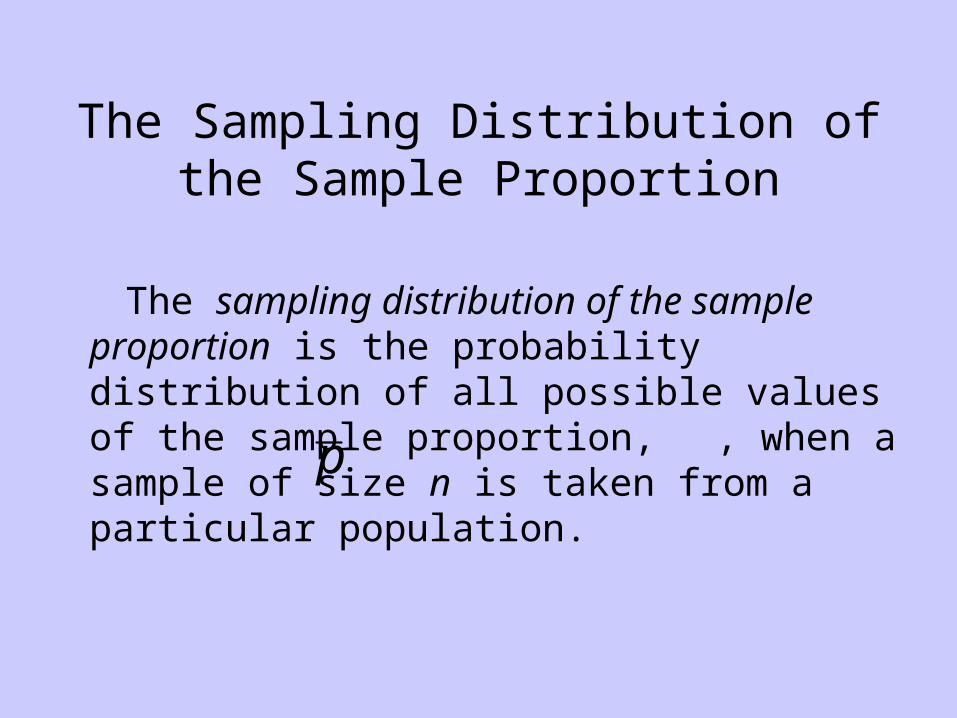
The Sampling Distribution of the Sample Proportion
The sampling distribution of the sample proportion is the probability distribution of all possible values of the sample proportion, , when a sample of size n is taken from a particular population.
p
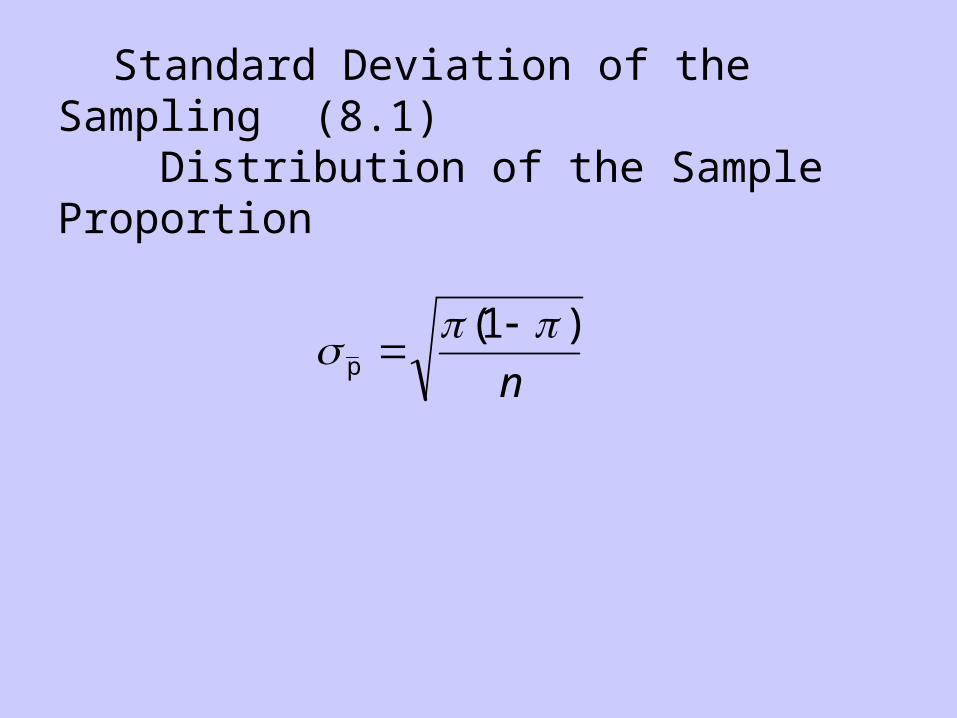
Standard Deviation of the Sampling (8.1) Distribution of the Sample Proportion
n
)1(p

Figure 8.3 The Sampling Distribution of the Sample Proportion
np
)1(
p
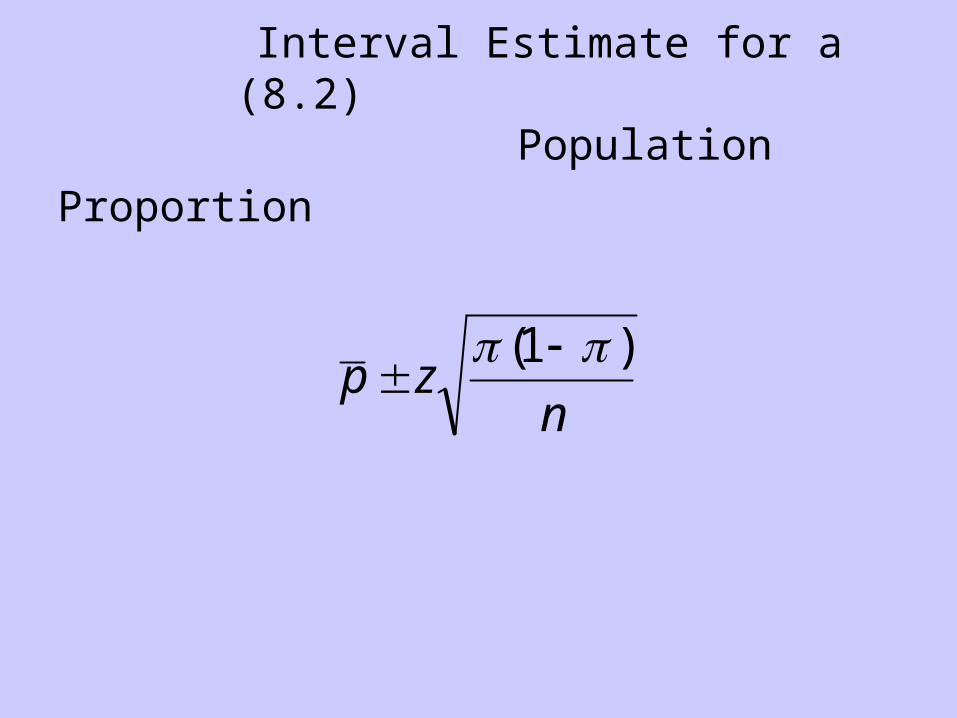
Interval Estimate for a (8.2)
Population Proportion
nzp
)1(

Interval Estimate for a (8.3) Population Proportion using the Estimated Standard Error
p zp p
n
( )1

Determining Sample Size for (8.4) Estimating a Population Proportion
2
)1)((z
E
n =

The sampling distribution of the sample mean difference is the probability distribution of all possible values of the sample mean difference,
- , when a sample of size n1 is taken from one population and a sample of size n2 is taken from another.
The Sampling Distribution of the Sample Mean Difference
1x 2x
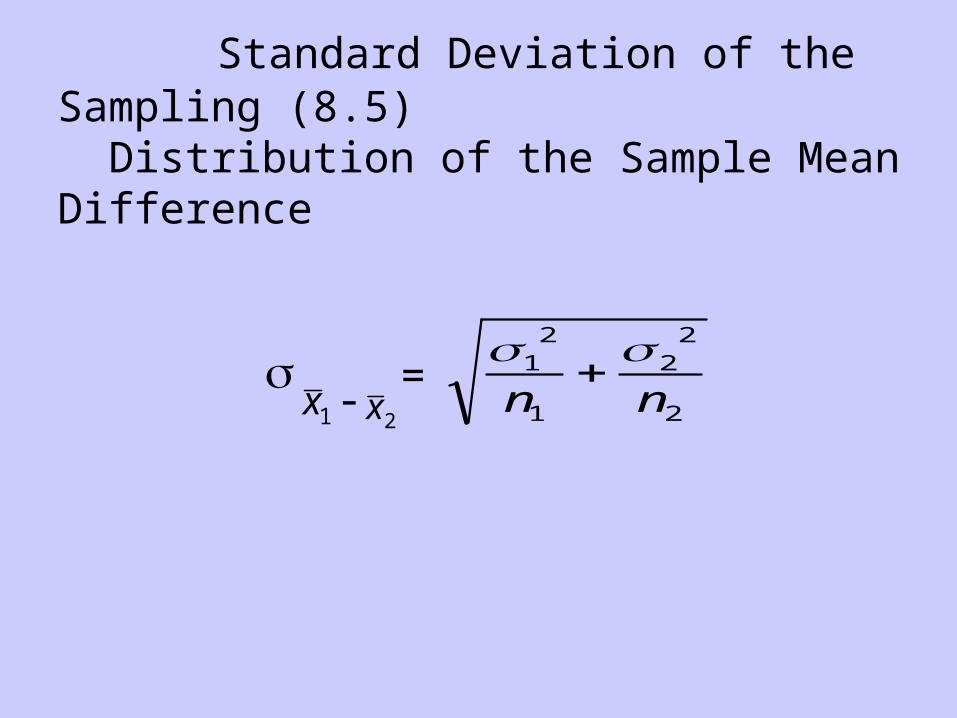
Standard Deviation of the Sampling (8.5) Distribution of the Sample Mean Difference
2
22
1
21
nn
2x1x - =

Figure 8.4 The Sampling Distribution of Sample Mean Difference
1 – 2
2
22
1
21
21 nnxx
21 xx
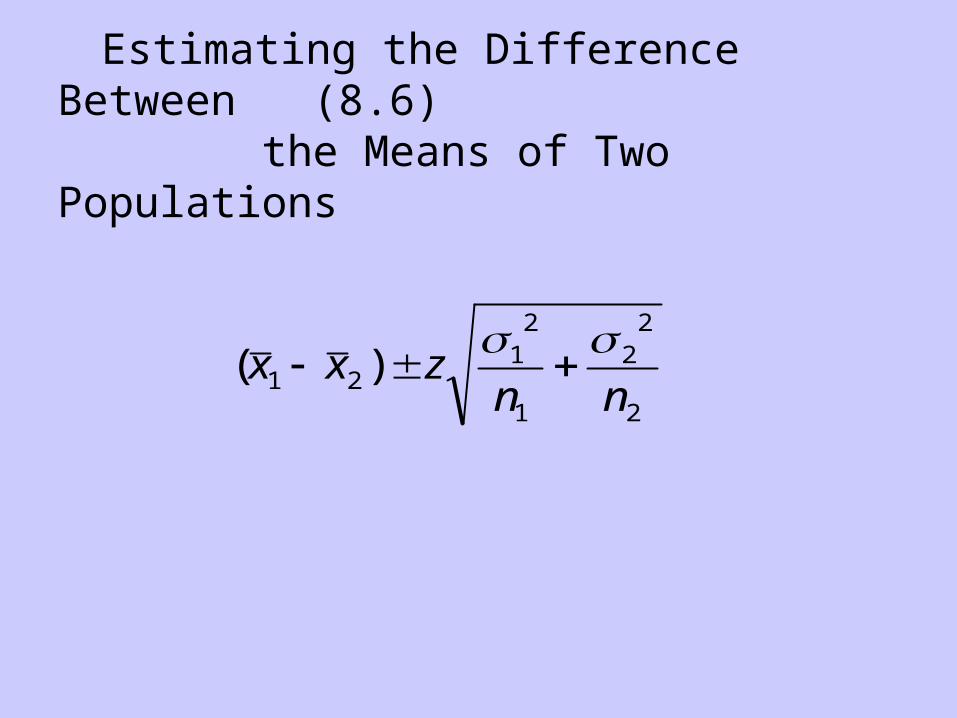
Estimating the Difference Between (8.6) the Means of Two Populations
2
22
1
21
21 )(nn
zxx

Estimating the Difference between the (8.7) Means of Two Populations: Large Sample Sizes, Population Standard Deviations are Unknown
2
22
1
21
21 n
s
n
sz)xx(

Pooled Sample Standard Deviation (8.8)
2
11s
21
222
211
-nn
)s-(n)s-(npooled
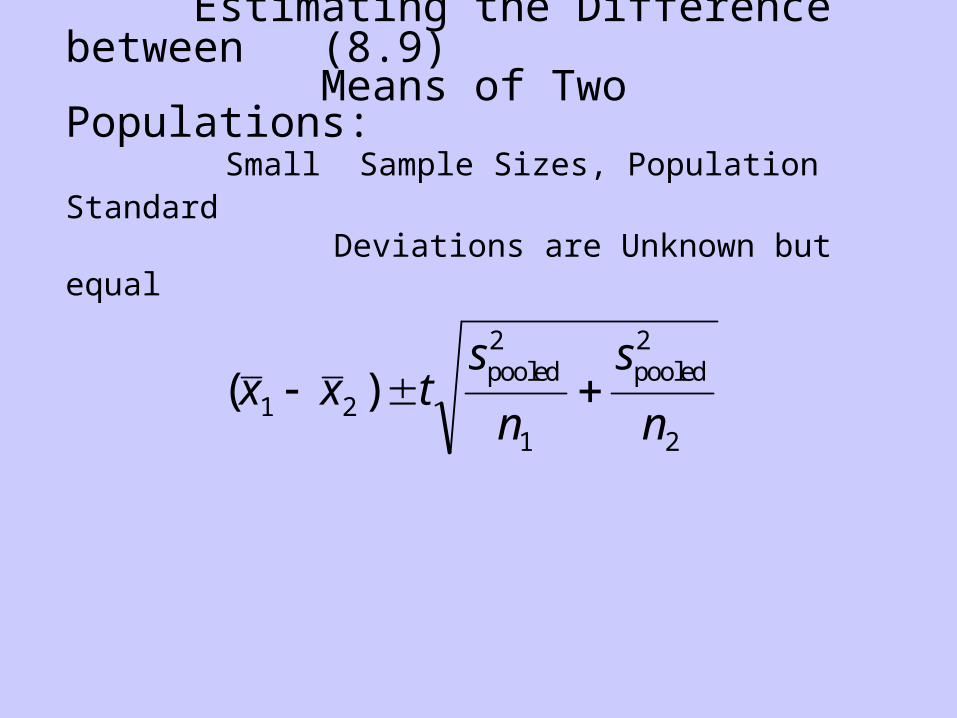
Estimating the Difference between (8.9) Means of Two Populations: Small Sample Sizes, Population Standard Deviations are Unknown but equal
( )x x ts
n
s
n1 2
2
1
2
2
pooled pooled

The sampling distribution of the sample proportion difference is the probability distribution of all possible values of the sample proportion difference, - , when a sample of size n1 is taken from one population and a sample of size n2 is taken from another.
The Sampling Distribution of the Sample Proportion Difference
p1 p2

Standard Deviation of the (8.10) Sampling Distribution of the Sample Proportion Difference
p p n n1 2
1 1
1
2 2
2
1 1

Figure 8.5 The Sampling Distribution of Sample Proportion Difference
p p n n1 2
1 1
1
2 2
2
1 1
21 pp 1 – 2

Estimating the Difference between (8.11) Two Population Proportions
( )( ) ( )
p pn n1 2
1 1 2 21 1
z
1 2
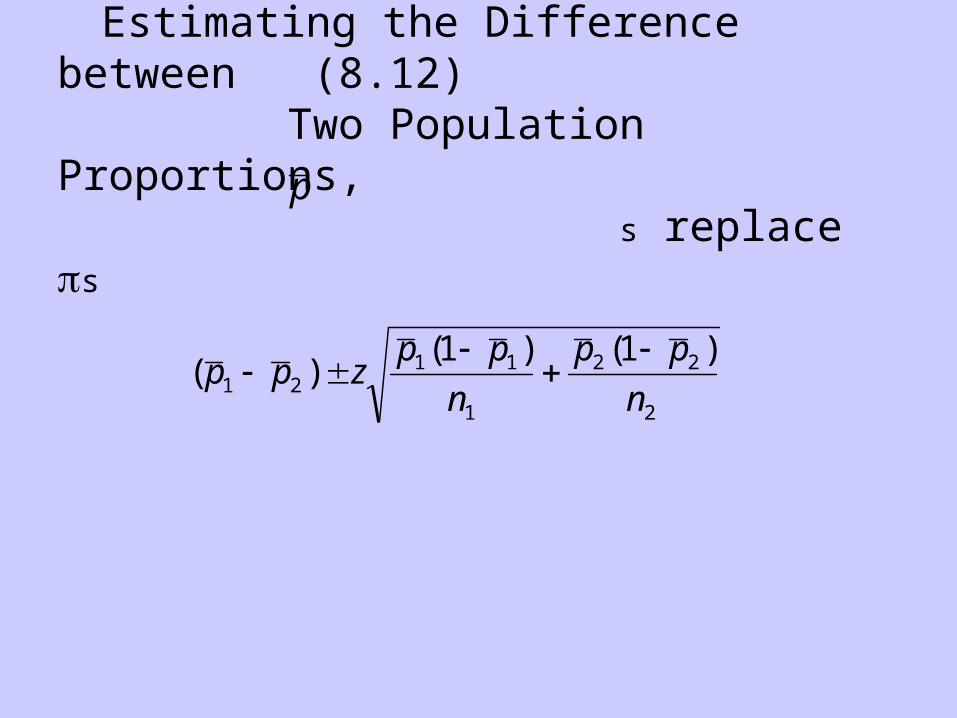
Estimating the Difference between (8.12) Two Population Proportions, s replace sp
( )( ) ( )
p p zp p
n
p p
n1 21 1
1
2 2
2
1 1

Estimating the Difference in (8.13) Two Population Means: Matched Samples
n
std d
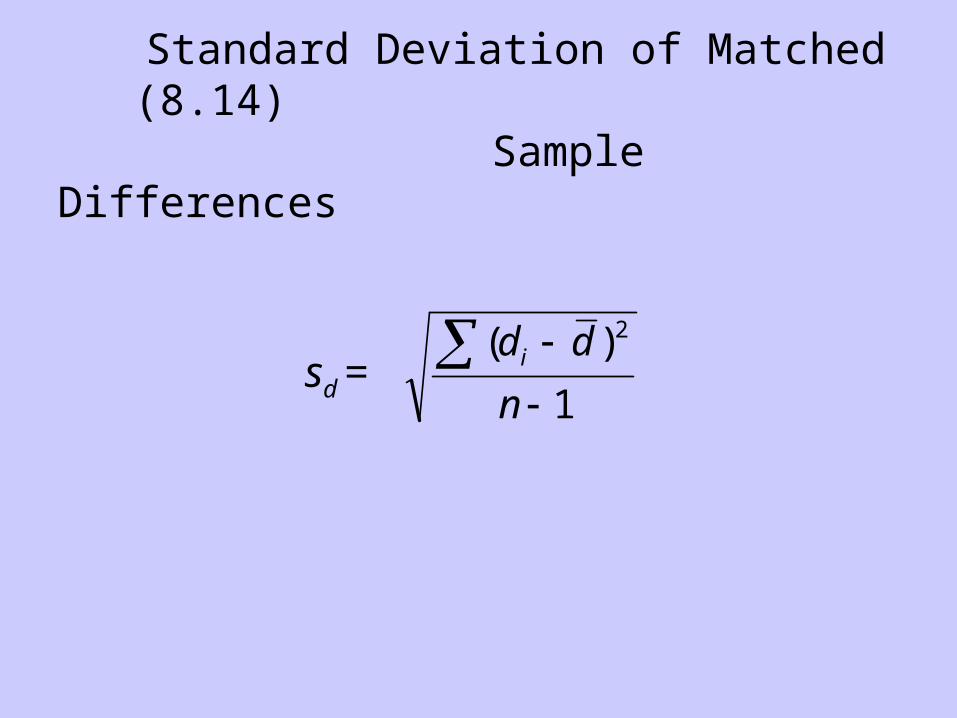
Standard Deviation of Matched (8.14) Sample Differences
1
)( 2
n
dd isd =