chapter 7 the united states in a global … · chapter 7 the united states in a global economy t...
TRANSCRIPT

291
C H A P T E R 7
THE UNITED STATES IN A GLOBAL ECONOMY
The world’s economies are more intertwined than ever before. Since the middle of the last century, declining policy barriers, transportation
costs, and communication costs have driven a swift rise in world exports and foreign investment, far outpacing the growth in world output. Even so, the potential economic gains from trade for the United States are far from exhausted, as U.S. businesses must overcome an average tariff hurdle of 6.8 percent and countless non‑tariff measures to serve the roughly three‑quar‑ters of world purchasing power and almost 95 percent of world consumers that are outside America’s borders.
Expanding trade allows production inputs such as labor and capital to be used more efficiently, which raises overall productivity. U.S. busi‑nesses that grow in response to increased market access abroad create new jobs. These firms are more productive and rely more on capital and skilled workers, on average, than similar non‑exporting firms. Partly because of this, the wages paid by exporting firms tend to be higher than wages paid by non‑exporters in the same industry. In particular, evidence for the United States suggests that, in manufacturing, average wages in exporting firms and industries are up to 18 percent higher than average wages in non‑exporting firms and industries.
In addition, international trade helps U.S. households’ budgets go fur‑ther. Because our trading partners also specialize in the goods and services for which they are relatively more productive, the prices for those goods and services in the United States are lower than if we could only consume what we produce. Trade also offers a much greater diversity of consumption opportunities, from year‑round fresh fruit to affordable clothing.
By increasing global production and consumption opportunities, international trade can promote world economic growth and development. Trade among nations offers a mechanism potentially to reduce global pov‑erty, which may decrease child labor and pull developing country workers

292 | Chapter 7
into jobs with improved working conditions. Trade can be a force toward the empowerment of traditionally marginalized groups; for example, some empirical evidence suggests that decreased discrimination against women is related to the effects of global competition brought about by trade. Research also shows that bilateral trade agreements can reduce the likelihood of bilateral conflict, as economic cooperation promotes political cooperation, though the relationship is less clear in a multilateral setting, perhaps because multilateral trade reduces the dependence of any one country on another. Trade can also facilitate the spread of new green technologies throughout the world, which decreases emissions, potentially outweighing any additional emissions associated with an increased scale of production, consumption, and transportation.
However, because the process of globalization spurs the shifting of resources within national economies, it can also create challenges in areas like income inequality. For this reason, it is critical that globalization is managed—in terms of both the types of trade agreements the United States enters into and the domestic policies that are in place—in a way that ensures that more Americans can take advantage of the opportunities afforded by trade, while being better insulated from any challenges trade creates. Therefore, President Obama’s “values‑driven” trade policy seeks to do what’s best for U.S. businesses and workers by enforcing international agree‑ments that improve labor and environmental standards around the world, combat corruption, and strengthen the rule of law abroad. Encouraging such trade agreements maximizes globalization’s benefits while minimizing glo‑balization’s unwanted side effects. For example, new U.S. trade agreements promote and enforce the rights of workers abroad, “leveling up” rather than “leveling down” and risking workers’ rights in the United States. The Administration’s domestic policies, such as skills training, infrastructure investment, and business tax reform, allow workers and firms to take better advantage of the opportunities trade offers. At the same time, policies like Trade Adjustment Assistance and the Affordable Care Act help protect workers from some of the challenges associated with broader, less‑mindful globalization.
An additional aspect of the global economy, beyond trade in goods and services, is international financial markets, which also offer mutual benefits to trading economies. International financial transactions, through which countries diversify risks globally and undertake international bor‑rowing and lending, can promote higher and more stable consumption levels throughout the world economy. But, they can also pose major risks to national and global stability, as was starkly manifested in a series of global financial crises in recent decades. To maximize benefits, increased financial

The United States in a Global Economy | 293
integration must be accompanied by sustained and coordinated monitoring and regulation of financial institutions and markets.
This chapter starts by reviewing data on the growth in world exports and the role of trade agreements in facilitating this growth. In particular, the chapter reviews the proposed Trans‑Pacific Partnership (TPP) and the Transatlantic Trade and Investment Partnership (T‑TIP), which embody the President’s “values‑driven” approach to trade policy, by seeking to level the playing field for American workers and businesses, including by promoting enforceable standards for workers and strengthening environmental protec‑tions. The chapter next looks at the considerable benefits of trade, especially for workers in export‑intensive industries, and the challenges faced by workers displaced as a result of trade. The chapter concludes by surveying the rapid growth of international financial markets. This last section of the chapter outlines the benefits and risks from international financial integra‑tion and the steps global policymakers have taken to contain those risks, while preserving the benefits.
Multilateral Trade
Multilateral efforts to promote trade liberalization for goods and services date back to the General Agreement on Tariffs and Trade (GATT), signed by the United States and 22 other countries in October 1947. As a complement to the Bretton Woods financial system established in 1944, GATT was inspired by the belief that trade liberalization would promote international prosperity, peace, and security, and thus contribute to the U.S.‑led effort to rebuild after World War II and avert another sequel. Average tariffs in advanced economies have fallen dramatically from about 40 percent when GATT began in 1947 to about 3 percent in 2012. Including developing countries, the decline is even more substantial. Non‑tariff bar‑riers (NTBs), for instance, on items related to government procurement, arbitrary product standards, local content requirements, and other regula‑tory barriers have also been eased.
As of the end of 2014, the World Trade Organization (WTO), estab‑lished in 1995, has 160 members. Currently, the United States is engaged in discussions at the WTO on a wide range of topics. Among them are formalizing the Trade Facilitation Agreement, which seeks to reduce costs associated with customs‑related and other cross‑border procedures and provide support to developing countries in this capacity. In addition, the United States is negotiating to expand the Information Technology Agreement, which will eliminate tariffs on a wider range of information and communications technology (ICT) products, as well as the Environmental

294 | Chapter 7
Goods Agreement and the Trade in Services Agreement to reduce barriers to trade in, respectively, green technologies and services such as telecom‑munications, insurance, and distribution systems. The United States is also participating in efforts to evaluate prospects for a conclusion of the Doha Development Agenda round of multilateral trade negotiations.
The Growth of U.S. and World TradeWorldwide flows of goods and services as a share of the global econ‑
omy are at an all‑time high, thanks in no small part to the solid foundations put in place by the WTO to govern countries’ policies toward trade flows. Figure 7‑1 illustrates the progress of worldwide goods and services trade integration since 1960. Over this period, real global exports of goods and services have increased by a factor of 24, almost triple the pace of real world output growth.1
The increase in trade volumes is partly a function of broader trends in globalization, including reductions in transportation costs, improved inven‑tory management, the entry of major new economies into the global trading system, and increased dispersion of production. Declining trade policy barriers around the world have also played an important role in increasing
1 A large contraction in world trade followed the Great Recession, but it has since rebounded, albeit at a slower pace of growth in the last few years than prior to the recession.
0
500
1,000
1,500
2,000
2,500
3,000
1960 1970 1980 1990 2000 2010
Index, 1960=100
Note: All values in real 2009 dollars, deflated using the U.S. GDP deflator. Source: World Bank, World Development Indicators.
Figure 7-1Global GDP and Exports of Goods and Services, 1960–2013
Exports
GDP
2013

The United States in a Global Economy | 295
the global volume of trade. The U.S. International Trade Commission has recorded U.S. duties collected as a share of total imports since 1891 (see Figure 7‑2).2 The U.S. average ad valorem equivalent tariff has been below 5 percent since the mid‑1970s, below 2 percent since 1999, and currently stands at 1.4 percent.
As advanced nations generally have low tariff barriers, the most recent global tariff reductions have come as historically protectionist emerging and developing economies entered the global trading system, recognizing the benefits of open markets. Figure 7‑3 shows the relative pace of tariff declines across three broad world income groups, as defined by the World Bank, since the early 1990s. High‑income countries, with already low tariff levels, decreased tariffs from 3.6 percent on average in 1988 to 2.6 percent on aver‑age in 2012. By contrast, middle‑income economies decreased tariff levels by a sharp 7.2 percentage points (from 14.8 percent on average in 1996 to 7.6 percent on average in 2012), and low‑income countries decreased tariffs by an even greater 21.3 percentage points over the same time (from 33 percent
2 Tariff rates were high prior to World War I, in part, because they were a primary revenue source for the Federal government. The Revenue Act of 1913, which passed following ratification of the Sixteenth Amendment, lowered tariffs sharply while replacing the lost revenue with a Federal income tax. Tariff rates in the 1920s and 1930s were relatively high as a result of the Fordney‑McCumber Tariff Act of 1922 and the Smoot‑Hawley Act of 1930. U.S. unilateral tariff reductions began even before GATT, once the Reciprocal Trade Act of 1934 authorized President Franklin Roosevelt to negotiate tariff reductions with trade partners.
0
5
10
15
20
25
30
35
1890 1900 1910 1920 1930 1940 1950 1960 1970 1980 1990 2000 2010
Percent
Note: Total imports measured as the customs value of imports for consumption. Source: U.S. International Trade Commission, Office of Analysis and Research Services.
2013
Figure 7-2Ratio of U.S. Duties Collected to Total Imports, 1891–2013

296 | Chapter 7
on average in 1996 to 16.2 percent on average in 2000, then to 11.7 percent on average in 2012).
The Rise of Services Trade. Services industries comprise 62 percent of the U.S. economy, and employ 86 percent of American workers. Despite the prevalence of services in the economy, there is a dearth of research investigating the impact of international trade in services. The cross‑border flow of physical goods is easy to measure as goods pass through customs authorities. Services trade, on the other hand, is less straightforward to docu‑ment, as many services are delivered digitally and thus have no single point of crossing.3
Apart from limited data, the lack of research on services trade also reflects that services, which require interaction between producers and cus‑tomers, were long thought to be non‑tradable—the classic example of the
3 The General Agreement on Trade in Services, a WTO agreement that came into force in 1995, defines four modes of services trade. First, services trade occurs when a service produced in one country is consumed in another country; for instance, when Hollywood movies show in theaters abroad. Second, services trade occurs when consumers from abroad purchase local services, such as when foreigners travel to the United States for vacation, for an education, or for health care services. The third mode of services trade occurs through foreign direct investment; for instance, when a U.S. bank opens a branch abroad to offer financial services in other countries. Finally, the fourth mode of services trade occurs when individual service providers from one country travel to supply services in another country. An example would be an American academic giving an educational seminar abroad for an honorarium.
0
5
10
15
20
25
30
35
1985 1990 1995 2000 2005 2010
Percent
High-Income
Middle-Income
Low-Income
Figure 7-3Global Tariff Rates by Income Group, 1988–2012
Note: Tariffs are calculated as the simple average of the applied tariff rate across all products within country groups.Source: World Bank, World Development Indicators.

The United States in a Global Economy | 297
non‑tradable service being the haircut. While haircuts are still unlikely to be traded, the growth in information technology and declining transporta‑tion costs have facilitated a strong rise in trade in services like education, health care, tourism, as well as the many business and professional services associated with trade in goods (telecommunications, finance, distribution, insurance, and more). The spread of multinational firms and the worldwide subdivision of production processes have also contributed to this rise.
In 2014, U.S. services exports measured approximately $710 billion, or 30 percent of total U.S. exports, while imports of services were about $479 billion, or 17 percent of total U.S. imports. Together, services trade accounted for almost 6.9 percent of U.S. gross domestic product (GDP) in 2014. As depicted in Figure 7‑4, these levels reflect rapid growth since 1980; real U.S. services exports grew by 613 percent over the 34‑year period to 2014, or at a 5.6‑percent average annual rate. Despite an overall trade deficit, the United States maintains a strong and growing surplus in services.
Free Trade Agreements
U.S. free trade agreements (FTAs) play a central role in continu‑ing progress toward more open markets. Table 7‑1 lists the current U.S. bilateral and regional FTAs, beginning with the first FTA to enter into force with Israel in 1985. Canada signed an FTA with the United States
0
100
200
300
400
500
600
700
1980 1990 2000 2010
Billions of 2009 Dollars
Exports
Imports
Surplus
Note: All values in real 2009 dollars, deflated using the U.S. GDP deflator. Data post-1998 are based on BEA's restructured U.S. Trade in Services series.Source: Bureau of Economic Analysis, International Economic Accounts; Haver Analytics.
Figure 7-4U.S. Trade in Services, 1980–2014
2014

298 | Chapter 7
Box 7-1: Trade in Ideas
In 2013, U.S. companies paid $39 billion in royalties and licens‑ing fees to foreign companies, and were paid $129 billion by foreign companies seeking access to intellectual property held in the United States. While this “trade in ideas” represents just 14.6 percent of all U.S. trade in services, it generates 40 percent of our $225 billion services trade surplus. Figure 7‑i shows the level of imports and exports in 2013 for each of the four major categories of trade in intellectual property. Roughly two‑thirds of this trade is intra‑firm, with a greater share of this intra‑company trade occurring in the trademark and franchise fees category (76 percent) than for industrial processes (69 percent), software (58 percent), or audio‑visual materials (42 percent).
Trade in ideas is partly influenced by differences in countries’ intellectual property laws; as such, harmonizing the international treatment of intellectual property rights has become an important, and sometimes controversial, aspect of international trade negotiations. For example, the WTO Agreement on Trade Related Aspects of Intellectual Property Rights established minimum standards for various forms of intellectual property protection. Several economic studies, such as papers by Branstetter, Fisman, and Foley (2006) and Cockburn, Lanjouw, and Schankerman (2014), suggest that stronger patent protection in destina‑
45.042.9
22.8
18.4
22.4
6.64.6 5.3
0
10
20
30
40
50
Industrial Processes ComputerSoftware
Trademarks andFranchise Fees
Audio-Visual andRelated Products
Exports Imports
Figure 7-iCharge for the Use of Intellectual Property, 2013
Billions of Dollars
Source: Bureau of Economic Analysis, International Transactions.

The United States in a Global Economy | 299
tion countries does promote outbound technology transfer, both within and between firms.
One reason that trade in intellectual property can be controversial is that ideas are non‑rival goods that can be used by many parties at the same time, with little or no incremental cost per user. This feature of intellectual property also creates challenges for measuring international technology transfer because it implies that the location of an idea, which determines the direction of trade flows, is somewhat arbitrary. To compound that problem, there is no obvious market price for many intra‑company transactions, so both the magnitude and direction of intra‑company trade in ideas may reflect corporate tax and legal strate‑gies, as much as they do business or economic realities.
All of these complications can produce some unusual outcomes in the trade statistics. For example, U.S. intellectual property exports to Bermuda were $3 billion in 2013, with 98 percent of that trade occurring between affiliated companies, a trade that largely occurs for tax reasons rather than economic reasons, as discussed in Chapter 5 of this Report. These intellectual property exports are about two‑thirds the size of Bermuda’s $4.5 billion GDP. In the same year, U.S. intellectual property exports to France, whose GDP is 600 times larger than Bermuda’s, totaled $3.4 billion, with only 42 percent transpiring between related companies. Lipsey (2010) shows that foreign affiliates of U.S. multinationals located in a variety of low‑tax countries report unusually high levels of intangible assets relative to both employees and physical capital.
While it is difficult to estimate the size of any measurement bias created by geographic reallocation of intellectual property within mul‑tinational firms, it is possible to say something about the likely impact on trade statistics. In particular, transfers of intellectual capital abroad at below‑market rates and intra‑company pricing that shifts income outside the United States will lead the official statistics to underestimate the true size of the U.S. services trade surplus—that is, what would be observed under competitive market prices or in a tax neutral environ‑ment. For example, the true value of intellectual property exports in Figure 7‑i may be higher, and the value of imports lower, particularly for trade in ideas related to trademark and franchise fees, where the share of intra‑company transactions is highest. This type of bias would also make U.S. companies that trade in intellectual property appear less productive, by artificially lowering their revenues and inflating their costs. The con‑tinued growth of intra‑company cross‑border trade within large multi‑nationals suggests that these measurement challenges will only grow in importance for both tax authorities and government statisticians.

300 | Chapter 7
in 1989, and together, these parties joined with Mexico in 1994 to form the North American Free Trade Agreement (NAFTA). Since then, the United States has also signed agreements with countries in the Middle East (Jordan, Morocco, Bahrain, and Oman), in Asia (Singapore and Korea), in Oceania (Australia), in South America (Chile, Peru, and Colombia), and in Central America (the Dominican Republic‑Central American Free Trade Agreement—or CAFTA‑DR4—and Panama). In total, current U.S. FTAs cover 40 percent of total U.S. goods trade.
With a few minor exceptions, all of this trade is duty‑free. Therefore, it is little surprise that the United States has experienced a large increase in trade activity with these partners in the years following entry into force of the agreements. Notably, however, higher trade with FTA partners is not
4 CAFTA‑DR includes five Central American countries (Costa Rica, El Salvador, Guatemala, Honduras, and Nicaragua) and the Dominican Republic.
Agreement Date of Entry Into Force
Bilateral Goods Trade (in Billions, 2014)
As Percent of Total U.S. Goods Trade
(2014)Israel Aug-85 38 1
Canada Jan-89 658 16.6
NAFTA Jan-94 1,193 30
Jordan Dec-01 3 0.1
Chile Jan-04 26 0.7
Singapore Jan-04 47 1.2
Australia Jan-05 37 0.9
Bahrain Jan-06 2 0.1
Morocco Jan-06 3 0.1
CAFTA-DR Mar-06 60 1.5
Oman Jan-09 3 0.1
Peru Feb-09 16 0.4
Korea Mar-12 114 2.9
Colombia May-12 39 1
Panama Oct-12 11 0.3
Total in Force 1,592 40.1
TPP TBD 1,609 40.5
T-TIP TBD 695 18
Total 2,623 66.1
452.9382
Table 7-1U.S. Free Trade Agreements
Note: Individual rows do not sum to the total, since individual countries may be represented in multiple agreements (e.g., Canada in NAFTA).Source: U.S. Census Bureau, Foreign Trade Statistics; World Trade Organization, Regional Trade Agreements Information System.

The United States in a Global Economy | 301
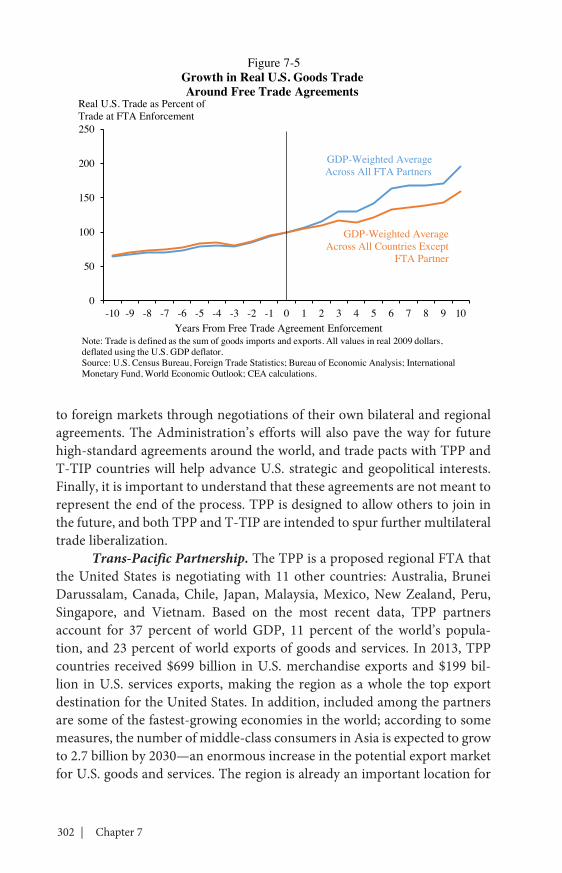
accompanied by reduced trade with non‑FTA countries. Figure 7‑5 sum‑marizes the growth in U.S. goods trade with our free trade partners before and after the enactment of all 14 FTAs. For comparison, the analysis also presents the growth in U.S. trade with non‑FTA partners before and after the FTAs entered into force. By construction, time zero is the date of entry into force. Looking at GDP‑weighted averages of trade across all FTA part‑ners and non‑partners suggests that, on average, trade with both country groups was growing around 3 percent a year before the enactment of the agreements. After entry into force of the agreements, trade grew at about 10 percent a year with FTA partners, and also grew at about 6 percent a year with non‑partners. Research by Baier and Bergstrand (2007) on free trade agreements for 96 different countries supports these findings. The authors report that, on average, an FTA approximately doubles two members’ bilat‑eral trade flows after 10 years. Our estimates based on the GDP‑weighted average of trade with FTA partners suggests a 95 percent increase in trade flows after 10 years (see Figure 7‑5).5
Current Trade NegotiationsIn recent years, the United States has been focusing on negotiations
toward two major multi‑continental FTAs: TPP would encompass 12 Pacific nations across the Asia‑Pacific, and T‑TIP is a proposed free trade agree‑ment between the United States and the 28 member states of the European Union. A key goal of U.S. free trade agreements is to secure tariff reductions abroad. As discussed earlier, the average tariff in the United States is a low 1.4 percent, while many of our trading partners maintain relatively high tariffs. At the same time, tariffs are just one of many policy instruments available to governments. Trade agreements bring about reductions in non‑tariff measures, while also liberalizing investment regimes and services trade (where NTBs are especially severe). Bringing down our trading partners’ tariff and non‑tariff barriers is essential for American firms to be able to compete on a level playing field in the global economy.
The Administration’s policy is to encourage trade agreements to pro‑mote a “values‑driven” trade regime that maximizes globalization’s benefits while addressing globalization’s problematic side‑effects. Environmental and labor commitments, included as a core part of our agreements, can help to level the playing field for U.S. businesses and workers, while also contributing to safer and greener policies worldwide. In addition, our trade agreements ensure that American businesses remain competitive in a global market in which our trading partners are also gaining preferential access
5 The estimates rely on incomplete data, as a full 10 years has not yet passed for some U.S. FTAs.
302 | Chapter 7
to foreign markets through negotiations of their own bilateral and regional agreements. The Administration’s efforts will also pave the way for future high‑standard agreements around the world, and trade pacts with TPP and T‑TIP countries will help advance U.S. strategic and geopolitical interests. Finally, it is important to understand that these agreements are not meant to represent the end of the process. TPP is designed to allow others to join in the future, and both TPP and T‑TIP are intended to spur further multilateral trade liberalization.
Trans-Pacific Partnership. The TPP is a proposed regional FTA that the United States is negotiating with 11 other countries: Australia, Brunei Darussalam, Canada, Chile, Japan, Malaysia, Mexico, New Zealand, Peru, Singapore, and Vietnam. Based on the most recent data, TPP partners account for 37 percent of world GDP, 11 percent of the world’s popula‑tion, and 23 percent of world exports of goods and services. In 2013, TPP countries received $699 billion in U.S. merchandise exports and $199 bil‑lion in U.S. services exports, making the region as a whole the top export destination for the United States. In addition, included among the partners are some of the fastest‑growing economies in the world; according to some measures, the number of middle‑class consumers in Asia is expected to grow to 2.7 billion by 2030—an enormous increase in the potential export market for U.S. goods and services. The region is already an important location for
0
50
100
150
200
250
-10 -9 -8 -7 -6 -5 -4 -3 -2 -1 0 1 2 3 4 5 6 7 8 9 10Years From Free Trade Agreement Enforcement
Real U.S. Trade as Percent ofTrade at FTA Enforcement
GDP-Weighted Average Across All Countries Except
FTA Partner
GDP-Weighted AverageAcross All FTA Partners
Figure 7-5Growth in Real U.S. Goods Trade Around Free Trade Agreements
Note: Trade is defined as the sum of goods imports and exports. All values in real 2009 dollars, deflated using the U.S. GDP deflator.Source: U.S. Census Bureau, Foreign Trade Statistics; Bureau of Economic Analysis; International Monetary Fund, World Economic Outlook; CEA calculations.

The United States in a Global Economy | 303
U.S. investment; in 2013, U.S. companies invested $695 billion in the Asia‑Pacific area.
TPP Leaders have expressed their intent to achieve a “comprehensive and high‑standard” FTA that will broadly liberalize regional trade and investment, strengthening economic ties between the parties. In addition to addressing tariff barriers, the TPP countries are seeking to address a range of outstanding non‑tariff barriers, such as import licensing restrictions, as well as to open services and government procurement markets in the region. The United States and its partners are seeking to negotiate rules that will provide transparent protections for investors and citizens, support the digi‑tal economy, promote innovation through strong supervision of intellectual property rights, and offer guidance on competitive practices associated with state‑owned enterprises.
In addition, when concluded, TPP will place strong labor commit‑ments at the core of the agreement, making them enforceable and subject to dispute settlement, as with other commercial provisions. TPP will constitute the largest expansion of enforceable labor rights in history, more than qua‑drupling the number of people around the world covered by enforceable labor standards. TPP will also contain strong commitments on the environ‑ment, including commitments to protect our oceans, combat wildlife traf‑ficking, and eliminate illegal logging. As with the labor provisions of TPP, these commitments will be enforceable through dispute settlement, allowing for trade sanctions against countries that fail to abide by the commitments.
Failing to secure a TPP agreement would place U.S. workers and businesses at a distinct disadvantage, by allowing other countries to set the rules of the global trading system—rules that would likely be adverse to U.S. interests. Comprehensive trade agreements like TPP offer the United States a way to shape globalization’s rules in the best interest of American workers and firms and to ensure that global standards include important issues like worker and environmental protections.
Transatlantic Trade and Investment Partnership. The United States and the European Union already maintain the world’s largest bilateral trade relationship. In 2013, together both regions account for nearly one‑half of world GDP and about 42 percent of global exports of goods and services. Based on the most recent data, U.S. companies have approximately $2.4 trillion invested in the European Union, while European companies have $1.7 trillion invested in the United States. These already strong economic relationships would be strengthened through the formalization of T‑TIP.
Despite their large size and close ties, the European Union and the United States have not achieved the full potential of their economic rela‑tionship. Negotiations toward the ambitious T‑TIP began in earnest in June

304 | Chapter 7
2013. Since tariff barriers between the two partners are already very low, the agreement strives to increase market access by also addressing NTBs. Importantly, both sides seek agreement on cross‑cutting disciplines on regu‑latory coherence and transparency—including early consultation on major regulations and use of regulatory impact assessment—for the development and implementation of efficient, cost‑effective, and more‑compatible regu‑lations for goods and services. Adoption and use of good regulatory prac‑tices will ultimately raise the standards and promote trade beyond just the United States and the European Union. In addition, the governments intend to commit to liberalize services trade, promote foreign direct investment, and cooperate on the development of rules and policies on global issues of common concern.
The Implications of Trade
The process of globalization offers many new economic opportuni‑ties, but it also has created challenges. Globalization is a result of both worldwide economic developments and specific policy changes. Analyzing globalization’s general impact is different from analyzing any particular trade agreement. Understanding the impact of any particular agreement requires both historical research, as well as an analysis of the relative tariffs of trading partners, NTBs, and the relevant standards (for instance, labor, environment, and intellectual property).
Nevertheless, historical experience does underscore the potentially large gains from trade. In the past half‑century, as trade barriers around the world have diminished, these gains have multiplied and are increasingly shared across different countries and different industries. Among these clas‑sic gains from trade are lower prices for consumers and producers, greater variety of goods and services available for purchase, enhanced productivity, and increased innovative activity.
Classic Gains from TradeEnhanced Productivity. Long‑established theories of international
trade suggest that trade liberalization will improve a nation’s economic productivity through several different channels.6 First, trade can improve economy‑wide productivity by allowing each country to focus on its com‑parative advantage. This follows from the classic trade theory expounded by economist David Ricardo in the early 1800s. Productivity gains can also
6 Productivity is defined as the amount of output that can be generated with a given level of inputs, so a more productive firm can produce more than a less productive firm with the same resources.

The United States in a Global Economy | 305
occur within an industry if there is some heterogeneity between firms in that industry (Melitz 2003), as labor and resources shift, in response to lower trade costs, to the most efficient firms—those best able to take advantage of the opportunity to export—thereby improving productivity in that sector. Several studies find evidence of this phenomenon in U.S. manufacturing. One study, which compares high‑ and low‑productivity plants during a time of falling tariffs and transportation costs finds that industry productiv‑ity rises when trade costs fall (Bernard et al. 2006). Ebenstein et al. (2011) find that industries where employment growth is highest in China tend to be the industries in the United States that have declining unit labor costs and increased productivity growth in the United States. This suggests that Chinese import competition in the United States could be driving improve‑ments in productivity.
A separate line of research considers that increases in export activity offer firms opportunities to learn about foreign markets—perhaps even gain‑ing technical expertise from foreign buyers—leading to increased productiv‑ity. Productivity gains through exporting may also occur through increased competition from foreign producers. This “learning‑by‑exporting” theory has support in a literature spanning many countries and time periods. By contrast, Clerides, Lach, and Tybout (1998) argue that the well‑established relationship between exporting and productivity is explained by the selec‑tion of more productive firms into global markets.
Lower Prices. Perhaps the most broadly shared benefit of increased trade is lower prices for consumers and producers in the domestic market. By allowing our trading partners to produce the goods in which they are relatively more efficient, the United States can import at lower prices than would prevail if we were to produce the goods ourselves. This “specialize in what you do best, trade for the rest” philosophy makes everyday goods and services more affordable and enhances the real earning power of American workers. In addition, recent estimates suggest that over one‑half of all U.S. imports are intermediate inputs into the production process; that interna‑tional trade lowers prices on such inputs allows U.S. businesses to expand by reducing input costs.
Greater Variety. Another underappreciated benefit of trade liberaliza‑tion is increased variety for domestic consumers and producers. With new importers come new products. This expanded selection increases the welfare of consumers who appreciate having more choice. Broda and Weinstein (2006) examine historical trade statistics and determine that the variety of imported goods increased approximately three‑fold between 1972 and 2001. Conventional import price indices have trouble incorporating the value of increased choice, so this finding suggests that import prices have effectively

306 | Chapter 7
fallen even further than the conventional import price index would suggest. The researchers estimate that this increased variety has provided U.S. con‑sumers with value equivalent to 2.6 percent of GDP, or approximately $450 billion in 2014. Mostashari (2010) updates the calculations in Broda and Weinstein (2006) and reports that the number of varieties of goods imported into the United States increased 33 percent between 1989 and 2007.
More Innovation. A related strand of literature shows that when trade barriers fall, domestic industries often respond through innovation and self‑improvement. Blundell et al. (1999) find that British firms in industries with higher import penetration spent more on innovation. Bloom et al. (2011) study how industries in 12 European countries fared after the elimination of import quotas as part of the WTO Agreement on Textiles and Clothing. They find that the increased trade catalyzed growth for high‑tech, high‑innovation firms. For these firms, spending on research and development increased, use of ICT intensified, and total factor productivity improved.
The Labor Market Implications of TradeTrade also has notable impacts on labor markets, many of them a
direct result of the classic gains from trade in terms of increased productiv‑ity and innovation. U.S. businesses that expand in response to the increased foreign market access due to U.S. trade agreements support—and may even create—new jobs. The importance of such export‑led job growth for the Nation’s income is reinforced by the fact that wages in export‑intensive manufacturing industries tend to be higher than wages in non‑export‑intensive industries. Of course, while the aggregate benefits of trade may be large, trade can also have adverse effects for some workers. Domestic policies the Administration supports, such as investment in infrastructure, worker training, and education, can help our labor force take advantage of the considerable opportunities that trade opens up. For displaced workers and their families, effective policies can help smooth the adjustment into new, potentially higher‑paying jobs.
Wages. Expanding U.S. market access abroad has important implica‑tions for the workforce at home. A very long literature spanning decades and many different countries highlights that exporting firms are systematically different from non‑exporting firms even within the same industrial category. Bernard and Jensen (1995) were the first to document this fact for the United States. They note that exporting plants are larger in terms of employment, more productive in terms of value added per worker, more capital‑intensive, and pay higher wages. These differences persist even within detailed indus‑trial categories, and controlling for firms’ regional locations.

The United States in a Global Economy | 307
Figure 7‑6 offers descriptive evidence relying on data from the U.S. Census Bureau’s Foreign Trade Statistics matched to the National Bureau of Economic Research’s (NBER) Manufacturing Industry Database (Becker, Gray, and Marvakov 2013). Export‑intensive industries are defined as those industries with above‑average values of exports as a fraction of total ship‑ments (the export share) in 1989, and non‑export‑intensive industries are those industries with below‑average values of the export share in 1989.7 For ease of illustration, in order to report the various characteristics in comparable units, the Figure shows deviations from the industry average, calculated as described in the Figure note. On average over the 1989 to 2009 period of data availability, relative to non‑export‑intensive industries, export‑intensive industries report 51 percent higher total factor productiv‑ity growth, 17 percent higher average wages (total wage bill per worker), 10 percent higher levels of labor productivity (total shipments per worker), 17 percent higher value added per worker, and 31 percent higher capital inten‑sity (total real capital stock per worker), consistent with the findings in the academic research.
7 The average export share across the 377 6‑digit NAICS (North American Industrial Classification System) industries was 12.7 percent in 1989.
0
0.2
0.4
0.6
0.8
1
1.2
1.4
Total FactorProductivity
Growth
AverageWages
LaborProductivity
Value Addedper Worker
Capital Intensity
Export-Intensive Non-Export-Intensive
Figure 7-6Characteristics of Export-Intensive and
Non-Export-Intensive Industries, 1989–2009
Note: The deviation from the industry average is calculated as follows. Each industry’s characteristic is measured relative to the industry average within the year and then averaged over the 1989-2009 period and across export-intensive and non-export-intensive industry groups. Source: National Bureau of Economic Research-Center for Economic Studies, Manufacturing Industry Database; U.S. Cenusu Bureau, Foreign Trade Statistics.
Deviation from the Industry Average

308 | Chapter 7
That exporters pay higher wages than similar non‑exporters is a well‑established feature of the data across many countries and over decades. For the United States, estimates for the exporter wage premium (the amount by which exporting industries and firms pay higher wages than non‑exporting industries and firms) range between 6 percent and 18 percent. Riker (2010) estimates that workers employed in exporting manufacturing industries earned approximately 18 percent more than similar workers employed in
Box 7-2: Employment Impacts of Trade with China
The seismic event of the last three decades in the global economy has been the emergence of China. Until 1979, the People’s Republic of China was, as a matter of policy, essentially closed off from the global economy. Over the subsequent two decades, over 730 million Chinese workers integrated into the global labor force. Estimates of the direct impact of these dynamics vary widely. Using variation in regional expo‑sure to Chinese imports across U.S. labor markets to control for broad, economy‑wide changes in employment, Autor, Dorn, and Hanson (2013) estimate that Chinese import competition can explain 44 percent of the aggregate decline in U.S. domestic manufacturing employment over this period. In a more recent expansion of this work, Acemoglu et al. (forthcoming) find that increased Chinese exports to the United States were directly responsible for roughly 10 percent of the manufacturing jobs lost between 1999 and 2011.
These studies, however, do not capture the full story because they do not incorporate how expanded U.S. exports boost employment and the economy. To provide a rough sense of the relative magnitudes of these effects, but without the same degree of causal certainty, CEA performed an analysis of 377 six‑digit NAICS manufacturing industries from 1989 to 2009, using a specification similar to that of Autor, Dorn, and Hanson (2013). The analysis confirms the view that increased import penetration over the 1990s and 2000s is associated with decreas‑ing U.S. manufacturing employment. The analysis also finds, however, that a 10 percentage‑point rise in an industry’s export share is associated with about a 1.8 percent increase in industry employment. As the average industry experienced about a 30 percentage‑point increase in the export share over this time period, exports are associated with more than a 5 percent increase in manufacturing employment for the average industry.
Taken together, the results suggest that, though increases in import penetration were related to declines in manufacturing employment in recent decades, increases in exports can, in many cases, offer some offsetting effects. Future research into the relationship between exports and employment can help to refine the estimates.

The United States in a Global Economy | 309
domestically‑oriented manufacturing industries between 2006 and 2008.8 Controlling for industry differences, Bernard, Jensen, Redding, and Schott (2007) document a 6‑percent exporter wage premium in 2002: the average annual wage at exporting manufacturing firms is 6 percent higher than the average annual wage at domestically‑oriented manufacturing firms. In a simple analysis using data on individual‑level annual earnings from the Current Population Survey for the years 1989 to 2009, the Council of Economic Advisers (CEA) confirms an exporter wage premium. Controlling for time‑invariant industry, state, and year factors, CEA’s analysis suggests that the strong increase in exports over the 1990s and 2000s translates into an additional $1,300 in annual earnings for workers in today’s dollars.
Inequality. Inequality has increased substantially since the 1970s. Many countries, including China, began integrating into the global econ‑omy beginning in the 1980s. The resulting increase of about 3.5 billion in the globally integrated population led many to question the relationship between increased globalization and inequality. Classic economic theory—specifically, the Stolper‑Samuelson effect (Stolper and Samuelson 1941)—predicts that globalization will lead to an increase in wages for low‑skilled labor relative to high‑skilled labor in countries where low‑skilled labor is abundant. The reverse is predicted to occur in high‑skilled labor abundant countries. Driving this effect, according to the theory, is that changes in production patterns across countries change the relative demand for work‑ers of different skill levels. But this effect was not seen in the data over the 1980s and 1990s. Instead, the education skill premium increased in a wide range of countries during this time, including many relatively poor countries (Goldberg and Pavcnik 2007).
Researchers, therefore, began to explore alternative explanations. If classic trade theory is correct, the data should show reallocations of work‑ers toward skill‑intensive industries in the United States. Instead, Berman, Bound, and Griliches (1994) documented that between‑industry shifts in employment were smaller than within‑industry shifts in employment in the United States and the United Kingdom over this time period. Based on this evidence, they hypothesized that technological change played a more important role than other factors in rising wage inequality in both the devel‑oped and developing world, as those workers trained to use more advanced information technology were increasingly in demand.
Alternative explanations subsequently surfaced, including differences in factor intensity across firms, even within narrowly defined industrial categories. As described earlier, exporting firms tend to be larger, more
8 In follow‑up work, Riker and Thurner (2011) demonstrate that the relationship holds in services industries as well.

310 | Chapter 7
productive, more capital intensive, and they generally pay higher wages than domestically oriented firms in the same industry. Bernard and Jensen (1995, 1997) document shifts of employment and wages within an industry, suggesting gains in the more productive, higher‑wage exporting firms. There may also be factor intensity differences across different stages of the produc‑tion process. As illustrated in Feenstra and Hanson (1997, 1999), cross‑border movements of capital can increase the skill intensity of production, increasing the demand for skilled labor in both rich and poor countries—a Stolper‑Samuelson effect for trade in intermediate inputs. Finally, the nature of international trade has changed dramatically in recent decades, including reductions in ICT costs and the increased importance of emerging econo‑mies in the global market.
Another question relates to the impact of trade agreements. In mak‑ing an assessment of any particular trade agreement, it is important to dif‑ferentiate between the overall effects of globalization and the specific effects of that agreement. A review of the evidence suggests that the largest factors behind the rise in inequality are likely technological change, the slowing trend in educational attainment, and changes in labor market institutions (such as the erosion of the real minimum wage and reduced unionization). For most of our work force, the dominant influences on wages originate in the domestic labor market (for example, see Blinder and Krueger 2013). But the process of globalization, while creating generally higher‑paying jobs, can also be a contributor to wage inequality. This globalization, which has been driven by massive demographic and technological changes that brought billions more people into an increasingly connected global economy, would occur regardless of whether any particular trade agreement enters into force or not. Any particular agreement must be assessed based on an analysis of its tariff provisions, its reduction of NTBs to exports, and its provisions that promote higher standards. This can lead to a quite different outcome than globalization more broadly. Labor and environmental protections in trade agreements, in particular, would likely push in the opposite direction of globalization‑driven increases in inequality.
Development Benefits of Trade
The United States engages in international trade and free trade agree‑ments to increase market‑access opportunities for U.S. businesses and work‑ers and to lower prices and increase options for U.S. consumers. In addition to these benefits, it is important to recognize the impact trade has on global growth and security. U.S. trade policy also has implications for labor rights in our trading partners, gender equality, and environmental sustainability.

The United States in a Global Economy | 311
Global GrowthWhen countries specialize in the goods and services for which they
are relatively efficient and trade for the rest, world production and con‑sumption increase as existing resources are more efficiently utilized. Simple international trade theory, therefore, suggests that increased international trade can boost incomes. However straightforward this may seem, it is actu‑ally quite difficult to discern empirically a causal relationship between trade and income.9 Frankel and Romer (1999) were among the first to report a positive causal effect of trade on income. More recently, Feyrer (2009) relies on a unique event in world history to identify changes in distance between country‑pairs—the closure and re‑opening of the Suez Canal between 1967 and 1975. The closure of the canal increased the effective distance between several country‑pairs, and in some cases trade between affected country‑pairs decreased substantially. Since some country‑pairs were not affected by the closing, this event offers a unique experiment to test how trade impacts income. The author concludes that every dollar of increased trade raises income by about 25 cents.
Poverty. As developing countries entered the world trading system, concerns mounted about the impacts of trade on the well‑being of the poor. The literature on the impact of trade on GDP suggests a potential for poverty to fall with increased international commerce. Unfortunately, if most of the benefits accrue to the wealthy when a country’s income rises, the least well‑off citizens may not benefit enough to escape poverty. A large amount of evidence suggests otherwise, however. Though within‑country inequality generally increased in the aftermath of globalization (see the earlier discus‑sion), across‑country global income inequality witnessed the first decline since the Industrial Revolution, according to Milanovic (2013).
Hanson (2007) investigates the case of Mexico in the decade sur‑rounding the implementation of NAFTA. Using state‑level variation, the author documents that individuals born in states with high‑exposure to glo‑balization have relatively higher wages than individuals born in states with low‑exposure to globalization. McCaig (2011) uses the 2001 U.S.‑Vietnam Bilateral Trade Agreement (BTA) to study the effects of increased market access to rich countries on poverty in developing countries and finds that a one standard deviation decrease in provincial tariffs is associated with a two‑year rate of poverty reduction of between 33 and 40 percent. By contrast, work by Topalova (2007, 2010) on India’s 1991 trade liberalization provides
9 For instance, perhaps countries trade more because they are richer. Richer countries have better trading infrastructure, such as ports, and better access to information about opportunities abroad. The fundamental challenge for statistical inference, then, is that trade may affect income, but income also affects trade.

312 | Chapter 7
a different view. Although the incidence of poverty in rural India fell 13 percentage points around the liberalization—from 37 percent in 1987 to 24 percent in 1999—areas of that country more exposed to trade experienced progress toward poverty reduction that was not as rapid as other areas.
Working Conditions. A common argument against trade integration with countries in the developing world is the poor labor standards of those countries. However, research finds that expanding access to U.S. markets promotes higher‑quality employment in less‑developed countries as work‑ers shift from informal to formal employment, with little empirical evidence that local tariff reductions have an offsetting effect—meaning that the forces unleashed by trade itself complement the effort to include enforceable labor standards in free trade agreements.10 A recent paper by McCaig and Pavcnik (2014) finds that employment shifts from the household business (informal) sector to the formal enterprise sector in Vietnam in the aftermath of large U.S. tariff reductions as part of the U.S.‑Vietnam BTA. Similarly, Paz (2014) reports that decreases in foreign market tariffs decrease domestic informal employment in Brazil, while early work by Goldberg and Pavcnik (2003), supported in Menezes‑Filho and Muendler (2011), finds no evidence of a link between declining import tariffs in Brazil and informal employment. More importantly, work by Edmonds and Pavcnik (2005) documents a decrease in child labor associated with increased international trade in Vietnam.
Therefore, trade agreements that expand U.S. market access for coun‑tries at a lower level of development can provide a market‑based approach to improving labor conditions in the developing world. High standard U.S. trade agreements also contain commitments to promote and enforce work‑ers’ rights. A recent study by the U.S. Department of Labor (DOL) docu‑ments the improvement in labor conditions in countries engaged in trade agreements with the United States (DOL 2014).11
Gender EqualityPromoting gender equality is a key development goal in both the
developing world and in the United States. Importantly, since trade pro‑motes international competition, it may also reduce firms’ leeway to dis‑criminate against women. The classic Becker (1957) model of discrimination predicts that costly discrimination cannot persist with increased market
10 Jobs in the informal sector are associated with lower wages, lower employee benefits, worse working conditions, and lower job “quality” (Chapter 3 of this Report considers measures of job quality in the United States).11 For example, seven Latin American countries “significantly advanced” in terms of DOL’s assessment of labor policies and practice related to child labor in 2013 from 2012. Five of the seven countries have free trade agreements with the United States.

The United States in a Global Economy | 313
competition. Therefore, as trade liberalization results in increased competi‑tion in the domestic market, the gender wage gap should narrow. In line with the theory, by investigating trade‑affected manufacturing industries in the United States between 1976 and 1993, Black and Brainerd (2004) find that the residual gender wage gap narrowed more rapidly in initially more concentrated industries that experienced larger increases in competition with trade reform than in initially more competitive industries.
Political CooperationStrong economic ties between countries tend to coincide with strong
political cooperation. This notion was one of the foundational beliefs behind the GATT texts in the aftermath of World War II, as well as a motivation for the European Coal and Steel Community (known today as the European Union) and the Southern Cone Common Market (Mercosur) between Argentina, Brazil, Paraguay, and Uruguay. Basic intuition about the benefits of trade match these assertions; that is, two countries with a robust trading partnership would be loath to make war on one another and would be eager to cooperate on a variety of fronts, lest the substantial benefits of trade are in any way adversely affected. In addition, international trade in goods and services brings countries into contact with one another, reducing initial prejudices.
Relying on data across 177 countries and 30 years, Blomberg and Hess (2006) estimate that the presence of conflict acts as a tariff barrier—as much as a 30‑percent tariff on trade—larger than traditional policy barriers. Martin, Mayer, and Thoenig (2008) find that countries with high barriers to trade are more likely to make war because the opportunity cost of the forgone trading relationship is low, but only for pairs of countries. The rela‑tionship disappears in the multilateral setting, perhaps reflecting how mul‑tilateral trade reduces the dependence of any one country on another, thus lessening the trade‑based costs of war for any given pair. Martin, Mayer, and Thoenig (2012), therefore, suggest that international trade has changed the nature of conflict. However, as with trade and income, identifying a causal relationship between trade and conflict is complex, and as such, remains one of the important open questions in international economics.
Environmental ProtectionTrade agreements can raise environmental standards in countries
that otherwise would not be motivated to raise standards on their own. In fact, the United States has a long history of pursuing mutually supportive trade and environmental policies, and has found that strong, enforceable environmental provisions pursued as part of our bilateral and regional trade

314 | Chapter 7
agreements can help raise environmental standards in our trading partners, leveling the playing field for workers and businesses in America.
In addition to this values‑driven approach to trade policy, there are two broad channels through which trade can impact the environment: by changing the level of economic activity within trading countries, and by changing the composition of economic activity among trading countries. In each channel, there are ways in which trade can help encourage sustainable development and promote environmental protection.
It is well‑established that increases in trade activity among coun‑tries go hand in hand with increases in their overall economic activity. Environmentalists often point to this increase, known as the “scale effect,” as a cause for worry. A greater scale of economic activity likely means increases in transportation, shipping, production, and consumption—all pollution‑emitting activities. Note, however, that much of this concern would apply to any policy that increases productivity growth, including expanded research and education.
Higher productivity is associated with higher real incomes. Greater prosperity, in turn, can benefit the environment in multiple ways. Higher real incomes create opportunities for investment in research and develop‑ment in clean technology, allowing countries to “clean‑up” production tech‑niques. Higher real incomes can also generate greater ability and willingness to adopt, enforce, and pay for higher standards of environmental quality. For example, with more disposable income, families might be willing to pay a little extra to buy a hybrid car, or install solar panels for home‑electricity generation.
Ultimately, increased economic activity both generates and curbs pol‑lution; the overall effect on the environment depends on the relative magni‑tudes of each change. Empirical studies have produced relatively consistent results showing that trade does increase pollution, but also that accompany‑ing emissions reductions from cleaner technology are enough to offset that increase. For instance, Antweiler, Copeland, and Taylor (2001) remark that if trade liberalization raises GDP per capita by 1 percent, then pollution concentrations fall by about 1 percent. The authors decompose this effect as follows: a 1 percent increase in the scale of economic activity raises pol‑lution by around 0.5 percent, but the increase in income associated with international trade drives down pollution by around 1.5 percent. Similarly, Copeland and Taylor (2003) estimate the technique elasticity of pollution reduction with respect to income to be negative and greater than ‑1; that is, a given increase in real income is associated with an even greater reduction in pollution in percentage terms. Grether, Mathys, and de Melo (2010) analyze data on 62 countries and 7 manufacturing sectors and show that increases

The United States in a Global Economy | 315
in worldwide trade flows between 1990 and 2000 are associated with a 2 to 3 percent decrease in global sulfur dioxide emissions. Further, they show that manufacturing industries have become much cleaner over time—while, globally, industry’s employment and output levels rose 10 to 20 percent between 1990 and 2000, manufacturing emissions decreased by 10 percent. In other words, the evidence suggests that, likely due to a global shift toward cleaner technology, the net effect of increased trade on pollution is less than or equal to zero.
Compositional changes that occur in the economies of trading partners as trade promotes production specialization are a second mecha‑nism behind trade’s environmental impacts. A popular assumption is that specialization will send the most heavily polluting industries from rich countries with stricter environmental regulation to poor countries, which have relatively lax regulation. Theoretically, this migration would lead to an increase in world pollution levels and the creation of “pollution havens” in developing countries that, as exporters of the “dirtiest” goods, would bear a disproportionate amount of global pollution burdens. In a worst‑case scenario, environmentalists say, a “race to the bottom” in environmental regulation could ensue if developed countries saw an incentive to slow down efforts to raise environmental protection in an effort to forestall the “dirty” industries’ emigration. True, not all parties in a trade relationship can spe‑cialize in the cleanest industries, but concerns about “pollution havens” and “races to the bottom” are belied by the empirical evidence. In fact, there is reason to believe that compositional changes could actually yield net envi‑ronmental benefits.
Developed countries tend to be the best equipped for production of high‑polluting goods since the most‑polluting industries, which include manufacture of chemicals, metals, and paper, and oil refining, are capital intensive. The basic economic theory of comparative advantage suggests that those industries belong in countries with abundant capital—the richer, developed countries. Poorer countries with less capital on hand are more likely to specialize in industries that are more service‑oriented and labor‑intensive, and less polluting. If this is true, the compositional effects of trade could actually lead to reductions in global emissions, as pollution‑intensive production would occur in countries with stricter standards.
Of course, the issue is slightly more complicated, as environmental regulation can increase the marginal cost of production in polluting indus‑tries, driving them to less regulated countries. According to a 1999 WTO report, however, the increased marginal cost of pollution abatement in developed countries is no more than 1 percent of production costs for the average polluter (a maximum of 5 percent for the worst polluters). Such

316 | Chapter 7
small costs are likely not powerful enough to deter production and send it elsewhere and, according to the WTO, the developed‑country share of global production in polluting industries has remained relatively constant at around 75 to 80 percent over the past few decades (Nordstrom and Vaughan 1999). Regardless of environmental regulation, standard non‑environmental comparative advantage considerations seem to dominate location decisions.
Financial Flows
Financial flows are motivated by opportunities for mutual gain analogous to those driving trade in goods and services. In a world with uncertainty, cross‑border flows of financial assets broaden the scope for diversifying risk. The gains from international risk sharing are largest when the sources of risk are country‑specific; in that case, for example, a fall in the returns to investment in one country can be offset by increases in returns in other countries. Global financial markets also facilitate international borrowing and lending. If such activity across borders were prohibited, domestic investment would be limited by the supply of national saving. With integrated capital markets, however, the global supply of saving can be invested in the locations where it is most productive and therefore yields the highest returns. When markets function without distortions, the ability to diversify across countries and to allocate investment to its most produc‑tive use results in a globally efficient allocation of capital, higher returns to investment, and reduced wealth volatility—all shared by people around the world. In particular, net export deficits, which require foreign financing, do not necessarily imply lower economic growth, and may well be associated with higher growth (see Box 7‑3).
Along with the benefits of financial market integration come substan‑tial risks, as was amply demonstrated by the waves of crises that have swept through global financial markets since the 1980s. The increasingly tight interconnections among financial systems mean that disturbances in one market have the potential to reverberate around the globe. As discussed in this chapter, given the interdependence among national financial systems, it is not enough for national regulators to “keep one’s own house in order,” but governments must work together to develop and implement policies to safeguard global stability.
Figure 7‑7 illustrates the expansion of global financial flows relative to the growth in world trade in goods and services and world GDP since 1985. In this Figure, trade is measured as the average of global exports and imports and gross global asset flows are the average of inflows and outflows. Both global trade and GDP have grown since the 1980s, trade faster than GDP.

The United States in a Global Economy | 317
But even the pace of trade growth pales in comparison with that of interna‑tional financial flows in the early to mid‑2000s. Some of the increased asset trade can be attributed to the removal of capital controls and other barriers to cross‑border investment. The advanced economies were the first to lower barriers to capital flow as countries moved from fixed to flexible exchange rates in the early 1970s. Emerging markets followed suit in the 1990s as they became more integrated into global markets. But the pace of globalization in financial markets exploded in the 2000s, reaching its zenith on the eve of the global financial crisis in 2007, driven primarily by cross‑border bank loans. A notable retrenchment of cross‑border asset trade occurred in 2008; and in 2012 and 2013 the volume of global financial flows has hovered around $4 trillion, or roughly 5.5 percent of world GDP.
The expansion of financial flows coincided with increased financial‑ization within countries and the expansion of banking services across coun‑tries. Between 1980 and 2000, the share of the financial sector in the United States doubled from 4 to 8 percent of GDP (Philippon and Reshef, 2013). Up until the 1990s, international banking expanded in line with the growth in international trade and foreign direct investment as banks provided services supporting the international operations of business firms. There was a sharp liftoff in global banking activity in the 2000s as both the volume of cross‑border banking and the number of international subsidiaries and branches
GDP
Trade
Gross Financial Flows
2013
0
500
1,000
1,500
2,000
2,500
3,000
3,500
1985 1990 1995 2000 2005 2010
Figure 7-7Growth of Global GDP, Trade in Goods and Services,
and Financial Flows, 1985–2013Index, 1985=100
Note: All data are in nominal U.S. dollars. Global trade is defined as the average of global exports and imports of goods and services. Gross global financial flows are defined as the sum of direct investment, portfolio investment, and foreign exchange reserves. Values are obtained by averaging inflows and outflows to account for measurement error.Source: UNCTAD; IMF, International Financial Statistics.

318 | Chapter 7
expanded. At its peak in 2007, international claims of banks (cross‑border claims and local claims in foreign currency) accounted for over 60 percent of global GDP (Goldberg 2013).
Composition of International Capital FlowsInternational financial markets offer genuine opportunities for invest‑
ment and risk sharing, but they also serve as conduits for the cross‑border transmission of economic shocks, as well as for arbitrage between national regulatory and tax systems. From a stability perspective, the composition of international financial flows matters, as does the economic motivation underlying these transactions. Table 7‑2 shows the breakdown of total global financial flows into foreign direct investment, equity transactions, and debt and loans. Each of these flows is discussed in turn.
Foreign direct investment involves the acquisition of an ownership stake of 10 percent or more in a foreign firm. Economic studies suggest that FDI is associated with the transfer of technology and that foreign‑owned firms tend to be more productive than domestic firms.12 Alquist, Mukherjee, and Tesar (2014) find that FDI also serves as a source of liquidity in emerging markets where borrowing conditions are tight. This is especially beneficial during periods of financial stress in the local market, when the firm might otherwise be forced to liquidate assets, but instead can borrow from its parent. FDI has become an increasingly important form of cross‑border capital investment. Its share of total financial inflows has increased in both advanced countries and emerging markets. In 2013, FDI accounted for almost one‑half of international financial flows though the increase in the share is in part driven by the fall off in portfolio debt and loans. One reason for the growth of FDI is the desire of multinational firms to establish more finely articulated global supply chains that better exploit the scope for international specialization of production tasks.
Not all capital flows through multinationals are benign, however. International differences in tax rates can provide incentives for firms to engage in transactions that shift income from high‑tax to low‑tax jurisdic‑tions in order to minimize their global tax liability. In one example of “earn‑ings stripping,” a U.S. firm with a parent in a low‑tax jurisdiction outside the United States simply borrows from its foreign parent. The interest pay‑ments on that loan are deductible in the United States and are taxed abroad, reducing the firm’s overall global tax liability. While this shifting of profits
12 For evidence on technology transfer and productivity gains from FDI in the U.S., see Keller and Yeaple (2009) and Haskel, Perreira, and Slaughter (2007) for evidence from the UK. See Poole (2013) on wage and productivity spillovers from FDI in Brazil and Kee (2014) on evidence from Bangladesh.

The United States in a Global Economy | 319
is achieved without changing the consolidated balance sheet of the firm, the transaction does artificially inflate global gross financial flows by generating two offsetting international debt transactions, the only purpose of which is tax avoidance.13 Transactions can be much more complicated than this simple example and can be very difficult to track. And to be sure, not all such transactions are for tax avoidance purposes. The full amount of revenue lost to the U.S. Treasury through tax avoidance is difficult to estimate but the Treasury Department estimates that a single proposal to limit interest deductions for U.S. firms with much more debt than their foreign parent and its affiliates abroad would raise $64 billion over the period 2016 to 2025. See Chapter 5 for a detailed discussion of the international ramifications of the President’s approach to business tax reform.
Portfolio equity investment involves the purchase of shares in foreign companies. Share prices tend to be volatile and when markets in different countries fall together, as happened in the 2007‑08 crisis, even a globally diversified portfolio of equity does not provide much insurance. An advan‑tage of equities, however, is that the international distribution of payoffs happens automatically through changing share values and dividend pay‑ments without the risk of default, which can adversely affect financial market stability when debtors’ problems impair the perceived creditworthiness of their creditors.
13 Suppose the foreign parent lends a $1 bank deposit in London to its U.S. affiliate, which moves the $1 to its own London account. Then there is a financial inflow to the United States (the foreign borrowing by the U.S. affiliate) and an offsetting financial outflow from the U.S. (the U.S. affiliate acquires a $1 deposit in London). Corporate debt interest rates generally exceed bank deposit rates, however, so profits are indeed shifted out of the U.S. In the process, the global level of gross international financial flows rises by $2.
Gross Global Financial Flows 1985 1990 1995 2000 2005 2010 2013
Levels (Billions of U.S. Dollars)
Total 385 1031 1688 4244 7429 6150 4170 Direct Investment 59 250 365 1503 1392 1740 1944 Portfolio Equity 19 16 130 756 929 719 803 Portfolio Debt and Loans 307 765 1192 1985 5109 3691 1423 Of which: FX Reserves 14 90 190 178 632 1181 723
Shares 100% 100% 100% 100% 100% 100% 100% Direct Investment 15% 24% 22% 35% 19% 28% 47% Portfolio Equity 5% 2% 8% 18% 13% 12% 19% Portfolio Debt and Loans 80% 74% 71% 47% 69% 60% 34%
Table 7-2Gross Global Financial Flows, 1985-2013
Note: Levels represented in nominal dollars. FX reserves are foreign exchange reserves. Source: International Monetary Fund, Balance of Payments Statistics.

320 | Chapter 7
Box 7-3: Have U.S. Trade Deficits Reduced Output and Employment?
Countries that engage in free international trade rarely have bal‑anced trade—the state in which exports and imports are equal in value. Instead, they may lend to other countries when exports exceed imports, or borrow from them in the opposite case. The U.S. economy has run trade deficits in every year since 1976, borrowing from abroad in inter‑national financial markets to make up the difference between spending and income.
Economic commentators sometimes argue that these trade deficits have been a drag on the Nation’s economic growth and employment, and that reducing trade deficits (perhaps by restricting international trade) would have resulted in more U.S. output and jobs. On the surface, their argument seems straightforward: demand for imports, if somehow re‑directed to U.S. goods, would raise domestic demand, presumably generating more production by U.S. businesses and more employment to support that production. The truth, however, is substantially more complicated.
The factors that give rise to higher imports often raise demand for domestic goods at the same time. Eliminating those sources of higher import demand would therefore reduce, not raise, output and jobs. Moreover, measures a government might take to reduce imports can have effects elsewhere in the economy that counteract any anticipated improvement in the trade deficit. For example, a protective tariff may, in the first instance, make imports more expensive, but, by moving the balance of payments toward a surplus, the tariff will also lead the home currency to appreciate against foreign currencies, making imports cheaper again and exports less competitive. That change is likely to neutralize most or all of the trade‑balance effect of the tariff, but at the cost of a more distorted allocation of resources (which lowers output below potential).
Another way to see the fallacy is to realize that a trade deficit, which requires funding from foreign lenders, also means that our own saving is insufficient to finance domestic investment; whereas a trade surplus means that our saving is more than sufficient, with the excess of saving over domestic investment being lent to foreigners (who themselves must be running a trade deficit in this case). Trade balance improvement therefore requires some combination of a rise in saving or a fall in invest‑ment, neither of which generally causes higher output or job growth.
Because of this relationship, the U.S. trade balance is highly countercyclical, tending to register bigger deficits when the economy is stronger, not weaker (as Figure 7‑ii shows). Not surprisingly, this same pattern holds across most industrial economies. For advanced econo‑

The United States in a Global Economy | 321
mies in general, bigger trade deficits are associated with stronger, not weaker, growth because they tend to reflect higher overall demand that raises imports at the same time as it raises output. True, if imports were lower and nothing else in the economy changed, output would have to be higher to balance domestic supply with demand. In reality, however, it is impossible for policies to change imports without affecting a range of other macroeconomic variables in ways that will not necessarily help economic growth, and may well hurt it.
The preceding discussion of the short‑term relation between trade deficits and economic performance is only part of the story, of course. On the one hand, countries that have trade deficits because their higher investment levels are financing productive ventures will also see faster growth over the medium to long terms. But countries with poor investment allocation will eventually see their national income reduced, meaning that the short‑run demand boost from higher investment will result in a long‑run cost for the economy. In addition, large current account deficits can lead to financial instability—especially for emerging economies.
The bottom line is that the relationship between the trade balance and growth depends on circumstances and can vary according to the fac‑tors that cause the trade balance to change. Understanding those factors is essential, however, before we can decide if policies to alter the trade balance are desirable, and if so, what the proper policy choice would be.
Percent Unemployed(right axis)
2014
0
2
4
6
8
10
12
-9
-6
-3
0
3
6
9
12
1980 1985 1990 1995 2000 2005 2010
U.S. Trade Deficits and Economic Activity, 1980–2014Percent of GDP Percent Unemployed
Negative OutputGap
(left axis)
Figure 7-ii
Trade Deficit (left axis)
Note: Trade deficit illustrated is the deficit on goods and services. The negative output gap is calculated by subtracting potential GDP from actual GDP.Source: Bureau of Economic Analysis; Bureau of Labor Statistics; International Monetary Fund.
322 | Chapter 7
Viewed through the lens of optimal portfolio diversification, holdings of cross‑border equity are still low, even in advanced economies. Figure 7‑8 shows the degree of “home equity bias” in the U.S. equity portfolio. Home equity bias measures the percent of their shares that U.S. stock owners invest in the U.S. market, adjusted for the size of the U.S. stock market in the world market. If U.S. investors maximized their diversification by investing in home equities exactly in proportion to the size of the U.S. stock market in the world stock market, the degree of their home bias would be zero.14 But if they invested nothing abroad, their home bias would be 100 percent. As shown in Figure 7‑8, home bias has been declining since 2000 but still remains above 60 percent. Of course, setting portfolio weights equal to mar‑ket shares is just one benchmark from which to judge the extent of home bias. Other benchmarks would emerge from a portfolio allocation strategy based on an assumption about how investors trade off risk and return. The advantage of the market‑share benchmark is that it is simple to interpret and the implied shares are stable over time.
Far from being just a U.S. phenomenon, home bias is a fairly universal description of national portfolio choice. Using data from other countries, Coeurdacier and Rey (2013) report home bias ratios in 2008 ranging from 50 percent for individual euro area countries to 99 percent in Brazil and China. In emerging markets, extensive home bias is still likely to reflect barriers to international capital flows. In advanced economies, however, other factors such as limited information about foreign markets, institutional frictions, and perceptions about the riskiness of foreign markets continue to affect portfolio decisions. The chief takeaway here is that, as globalized as financial markets seem to be, there remains scope for further diversification gains through trade in equity shares. It is remarkable that home equity bias persists despite the high volumes of activity in international financial markets and the very large gross external asset and liability positions—sometimes mul‑tiples of GDP—that many (especially industrial) countries have developed.
A major weakness in the current financial system is the strong bias toward debt finance and flows of debt finance through banks. Though debt flows have declined as a share of total flows and home bias in debt portfolios has declined, debt transactions remain central to international finance. And, as was learned in the recent financial crisis, debt contracts have features that can be extremely damaging in some (and not altogether rare) circumstances.
Unlike equities, payoffs on debt contracts are fixed and do not take account of unexpected economic shocks that may make full repayment
14 If s is the share of their stocks that U.S. residents invest in the U.S. stock market and s* is the share of the U.S. stock market in the global stock market, then the degree of U.S. investors’ home bias is defined as 100 × 𝑠𝑠 − 𝑠𝑠 ∗
1 − 𝑠𝑠 ∗.

The United States in a Global Economy | 323
difficult or impossible. If the borrower hits hard times, the options are to renegotiate with the lender or default. The advantage of debt contracts is that they are structurally and informationally quite simple—payoffs on debt are not contingent on the performance of either party (provided there is no default), avoiding some types of moral hazard. Given this simple structure, debt contracts can easily be priced, securitized, and re‑sold to third parties under tranquil financial market conditions. The disadvantage, as repeated debt crises have demonstrated, is that in the event the borrower is unwilling or unable to pay, the amount of the payoff is unknown and depends on the enforceability of the original contract. Further, widespread borrower stress can lead to lender runs—refusals to roll over maturing debts—along with evaporation of market liquidity and a breakdown in the market’s ability to fairly price some debt securities. The institutions supporting debt contracts vary from place to place, and may change over time. International lenders learned the hard way that, for example, mortgages in the United States are non‑recourse loans, meaning that the loan is secured by a pledge of collat‑eral (the house itself) but the borrower is not personally liable for the loan. In many other countries, the lender can place a lien against the borrower’s income or seize other assets in the event of default.
The international financial system is strongly biased toward debt for several reasons. One is deposit insurance and implicit bailout guarantees, which effectively subsidize bank intermediation and, in some countries,
82.8
75.8 77.173.9 74.0
70.567.4
64.9 66.8 65.1 63.1 62.4 60.9 60.7
0
10
20
30
40
50
60
70
80
90
2000 2002 2004 2006 2008 2010 2012
Figure 7-8U.S. Equity Home Bias, 2000–2013Percent
Source: Federal Reserve Board, World Federation of Exchanges.

324 | Chapter 7
result in globally active banks that are too big to fail. Second, tax laws tend to favor debt over equity, tilting investment portfolios toward debt and away from equity, as discussed in Chapter 5. Third, equity markets remain under‑developed in some poorer developing countries, where the returns to investment are arguably still high. Fourth, national policies to promote home ownership effectively subsidize mortgage lending and the resulting securitized instruments.
An important caveat to the data in Table 7‑2 is that they may under‑state the degree of debt bias in international financial flows. Official statistics classify cross‑border lending between affiliated nonfinancial companies as FDI, even though these transactions take the form of debt. Thus, some FDI actually has no equity component, and instead is associated with some of the same risks as conventional lending flows (see Avdjiev, Chui, and Shin 2014). And as described above, some of these debt flows are motivated by tax avoidance. On the other hand, the amount of debt in the system could be overstated if it is measured both when debt is issued by the foreign affiliate and when it flows back to the headquarter firm.
The widespread global bias toward debt was a key contributor to the severity of the recent financial crisis and its global transmission. As is now well understood, the seeds of the crisis were sown in the U.S. mortgage mar‑ket. Securitization of subprime loans meant that exposure to delinquent U.S. mortgages was spread throughout the financial system, in the United States and abroad. The troubled mortgage problem was not confined to the United States, however, as real estate values and credit volumes rose rapidly in many countries during the 2000s. Lax regulation and asset booms occurred simul‑taneously, and, for somewhat different reasons, in Iceland, Ireland, Spain, the United Kingdom and many other countries. At the same time, high lev‑els of global saving kept world interest rates low, making debt cheap relative to other forms of finance. At a national level, low borrowing costs allowed some governments to finance macro imbalances through easy foreign bor‑rowing and to postpone tough policy choices. Optimism about the euro project resulted in low sovereign debt spreads in the euro area’s peripheral economies that did not reflect the actual risk of their national balance sheets, especially given the sizes and vulnerabilities of their banks. Ultimately, as housing prices started to fall and as different parts of the financial system suffered lender runs, the close interconnections among highly levered finan‑cial institutions threatened to destabilize the entire system.
Challenges in Regulating Global Financial Markets The global crisis exposed regulatory gaps and inconsistencies across
countries, exacerbated by the free flow of capital across borders. With
The United States in a Global Economy | 325
hindsight, the problems are easy to list: excessive leverage of banks and other financial institutions; lack of transparency and regulation in derivatives markets; increased importance of financial activity outside of the regulated banking sector (the “shadow banks”); and failure on the part of regulators to recognize the way in which risks were transferred across borders, between different types of financial institutions, and between the financial system and governments. The risks of new financial instruments were not well under‑stood and few connected the dots between global imbalances, globally rapid credit expansion, and asset price bubbles, especially in housing markets.
In the United States, the passage of the Dodd‑Frank Wall Street Reform and Consumer Protection Act in 2010 was an important step toward addressing problems at the core of the financial crisis. Wall Street Reform addressed difficult systemic problems by: appointing a new Financial Stability Oversight Council to monitor the stability of the U.S. financial sys‑tem as a whole, not just the safety and soundness of individual institutions; creating a process to resolve “too big to fail” firms without government bail‑outs; increasing transparency into previously unreported and unregulated financial products and services, to allow trading partners and investors to more accurately assess the risks associated with a contract or investment; centralizing previously scattered consumer financial protection authority under a single, new regulator; and better aligning the incentives for financial firms and their executives with the long‑term health of both the firm and the broader economy. Several of these measures are still being enacted, but Wall Street Reform has already reined in many practices that led to the financial crisis. It is essential for domestic and global stability that Wall Street Reform be fully implemented.
However, the tight interconnections between domestic and interna‑tional financial institutions mean that individual nations’ efforts to “keep one’s own house in order” are insufficient fully to attain global financial stability. Particularly challenging in the international context is the pres‑ence of currency risk—since internationally active banks do business in several major currencies—and regulatory arbitrage that exploits gaps and inconsistencies among national regulatory frameworks. The Basel process of international regulatory coordination emerged as a response to these challenges. The United States has provided strong leadership in developing and implementing the resulting international guidelines for monitoring and regulating international banking.
The Basel process has developed under the auspices of the Bank for International Settlements (BIS) and has its roots in the financial market turmoil that followed the collapse of the Bretton Woods system of managed exchange rates in the 1970s (BIS 2014). In 1974, central bank governors of

326 | Chapter 7
the G‑10 countries established the Committee on Banking and Regulation and Supervisory Practices and agreed to a set of principles regarding minimal capital standards and rules for regulating and sharing information among national regulators (the “Concordat”). At the outset, the concern was that international supervisory coverage be expanded so that no foreign banking establishment would be outside of the scope of supervision and that such supervision be consistent across member jurisdictions.
The outbreak of the debt crisis in Latin America in the early 1980s threatened the solvency of a number of large international banks and prompted revision of the Basel rulebook. The committee’s attention shifted toward capital adequacy standards, now referred to as Basel I. The 1988 Accord called for a minimum capital ratio of capital to risk‑weighted assets and the need to include off‑balance sheet transactions. Ultimately, these capital provisions were adopted by all countries with active international banks. The Basel agreements were amended over time as banking activity expanded and broadened in scope. Basel II, finalized in June 2004, included three “pillars”: minimal capital requirements; supervisory review of a bank’s capital adequacy and its internal assessment process; and effective use of disclosure to strengthen market discipline.
The recent financial crisis has resulted in a third round of major revi‑sions, which now involve the full G‑20 membership, with a target date of 2019 for full implementation. The Basel III package strengthens the Basel II standards and contains the additional components enumerated in Table 7‑3.
Other international institutions play a supporting role in global financial regulation. The BIS is also known as the “central bankers’ bank”: it supports central banks in implementing the Basel III measures, and also houses the global Financial Stability Board established in its present form by the G‑20 in 2009. The International Monetary Fund is a central institution for policy analysis, data reporting, and the provision of a global safety net through its lending operation and conditionality. The World Bank provides policy advice and financial assistance, particularly to low‑ to middle‑income countries.
While the Basel process is a critical step forward in the global regula‑tion of the financial sector, some important challenges remain. First, the Basel rules formally apply only to internationally active banks and the mea‑sures are focused almost exclusively on building ex ante capital and liquidity buffers at banks to prevent a crisis and less on tools that governments might use in the event of a crisis. There is broad consensus that there is a need for more capital and less liquidity risk in the banking system, especially for large systemically important institutions. There is less agreement that augmented bank capital and liquidity standards alone will be sufficient for preventing a

The United States in a Global Economy | 327
future crisis, particularly in light of the wide‑ranging activities undertaken by non‑bank financial institutions. The Federal Reserve has imposed stricter capital standards than Basel for U.S. banks, is proposing an even larger capital requirement for systemically important U.S. banks, and has required foreign banking organizations with U.S. non‑branch assets over $50 billion to set up holding companies subject to Federal Reserve regulation (Tarullo 2014).
A second challenge is the implementation of the Basel policies. Not all G‑20 members have fully implemented the recommended policies, and there remains the general problem that financial regulation and supervision remain largely at the national level but the externalities of weak financial institutions are potentially global. As Mervyn King, former Governor of the Bank of England, observed: “Financial institutions are global in life, but national in death.” That is, liquid financial institutions are everyone’s bank in the good times, but become the government’s bank in the event of a liquidity shortage or insolvency. For many countries, particularly in Europe, the size of the banking sector (indeed in some cases, the size of individual banks), remains larger than national GDP. Yet mechanisms are not in place to mobilize massive liquidity in multiple currencies in the event of a credi‑tor run. And if a bank is not just illiquid but also insolvent and needs to be resolved, its size could overwhelm the resources of its home government. Moreover, processes for unwinding large globally active systemic institu‑tions, especially when several governments are involved, remain imperfect.
Component Description
Capital ProtectionA supplemental layer of common equity that, when infringed upon, prohibits the distribution of earnings to assist in protecting the minimum common equity requirement.
Countercyclical Capital Preservation
A constraint placed on banks during credit booms with the intention of reducing their losses in the event of a credit bust.
Leverage Percentage A minimum amount of loss-absorbing capital relative to the bank’s assets and off-balance sheet liabilities irrespective of risk-weighting.
Liquidity Reserves A minimum liquidity ratio to distribute enough cash to cover funding necessities over a month-long period of stress.
Additional Measures to Govern Vital Banks
Such as requirements for additional capital, fortified arrangements for cross-border management, and resolution for banks that are large enough to destabilize the financial system.
Source: Bank for International Settlements.
Table 7-3Additional Basel III Components

328 | Chapter 7
Another challenge that is particular to global regulation is that countries are inherently different, with different sizes and business mod‑els of financial institutions and differing degrees of dependence on those institutions. This creates a trade‑off between rules that apply equally to all countries, and the need for regulation that is sensitive to macroeconomic and financial conditions at different times and in different places. In other words, there may be a tradeoff between the rules that create a level playing field, where all financial actors are treated equally, and the rules that create a safe playing field that recognizes asymmetries across players.
Deeper coordination does eventually seem to happen when minds become concentrated on the brink of disaster. But that is not enough and it has been harder to sustain cooperative momentum in periods of calm. Yet it is precisely in periods of calm when the investments and preparation for the next crisis need to occur. It is critical to maintain the pressure for financial reform while the memory of the last financial crisis is still fresh. Ultimately, international financial markets are necessary for risk mitigation, growth, and innovation, not just in the United States but in the global economy. For these markets to provide maximum benefits, however, governments must recognize potential risks and continue to collaborate in containing and managing them, just as they have collaborated in creating institutions and rules for the international trading system.
Conclusion
Through trade and financial linkages, the world’s economies are more interdependent than at any time in history. This interdependence has been supported not only by steep declines in the costs of international commu‑nication and shipping, but also by a reduction in governmental barriers to the cross‑border movement of goods, services, investment, and portfolio assets. Increasingly, economies are linked by production processes that cross international borders so as to minimize costs by better exploiting local comparative advantages.
The post‑World War II process of globalization has delivered impor‑tant benefits for U.S. consumers, workers, and businesses by increasing economies’ productivity, opening new markets for exports, and expand‑ing the range of products available for purchase. Expanded trade has also improved peoples’ lives in other, indirect ways, for example, raising living and working standards in other countries, and locking in meaningful envi‑ronmental protections.
Since the benefits of trade are often unevenly distributed, it is impor‑tant that globalization be accompanied by domestic and international

The United States in a Global Economy | 329
safeguards that prevent unfair trade practices. Such safeguards include poli‑cies that limit damage to the environment, protect displaced workers, and regulate risky financial practices that could cause financial instability.
Domestic U.S. policies are essential to help our economy take advan‑tage of the opportunities afforded by trade along with measures to counteract the potentially negative side effects of trade. But beyond these purely domes‑tic safeguards, an evolving structure of multilateral and regional agreements has worked to lower international trade barriers while reining in predatory trade practices and negative side effects. The World Trade Organization is central to that effort. In addition, the Administration is pursing compre‑hensive, high‑quality free trade agreements that provide U.S. exporters with enhanced market access while insisting that our trading partners do not compete on the basis of low worker‑ or environmental‑protection standards. In the financial sphere, international governmental collaboration and a set of central organizations including the Basel Committee, the Financial Stability Board, and the International Monetary Fund are key components in constructing a global safety net for crisis prevention and management.
