chapter 7: multispectral remote sensing - uprm · measurement sensor multispectral return beam...
TRANSCRIPT

1
CHAPTER 7:Multispectral
Remote SensingREFERENCE: Remote Sensing of the Environment John R. Jensen (2007)Second EditionPearson Prentice Hall
Overview of How Digital Remotely Sensed Data are Transformed into Useful Information

2
Aqua
Terra
TRMM
SeaWiFS
Aura
Meteor/SAGE
GRACE
ICESat
Cloudsat
Jason
CALIPSO
GIFTS
SORCE
NOAA/POES
Metop
GOES
MTSAT
MSG
TOPEX
Landsat
EXAMPLES OF MAIN PROGRAMS FOR ENVIRONMENTAL REMOTE SENSING
TIROS (USA) NOAA (USA) Nimbus (USA) Landsat (USA) GOES/METEOSAT (USA/Europe) SPOT (France) JERS (Japan) ERS (European Space Agency) IRS (India) RADARSAT (Canada)

3
SATELLITE ORBITS OFREMOTE SENSORS
Geostationary
Equatorial PolarNear Polar
Remote Sensing
System used for
Multispectral and
Hyperspectral Data
Collection
4
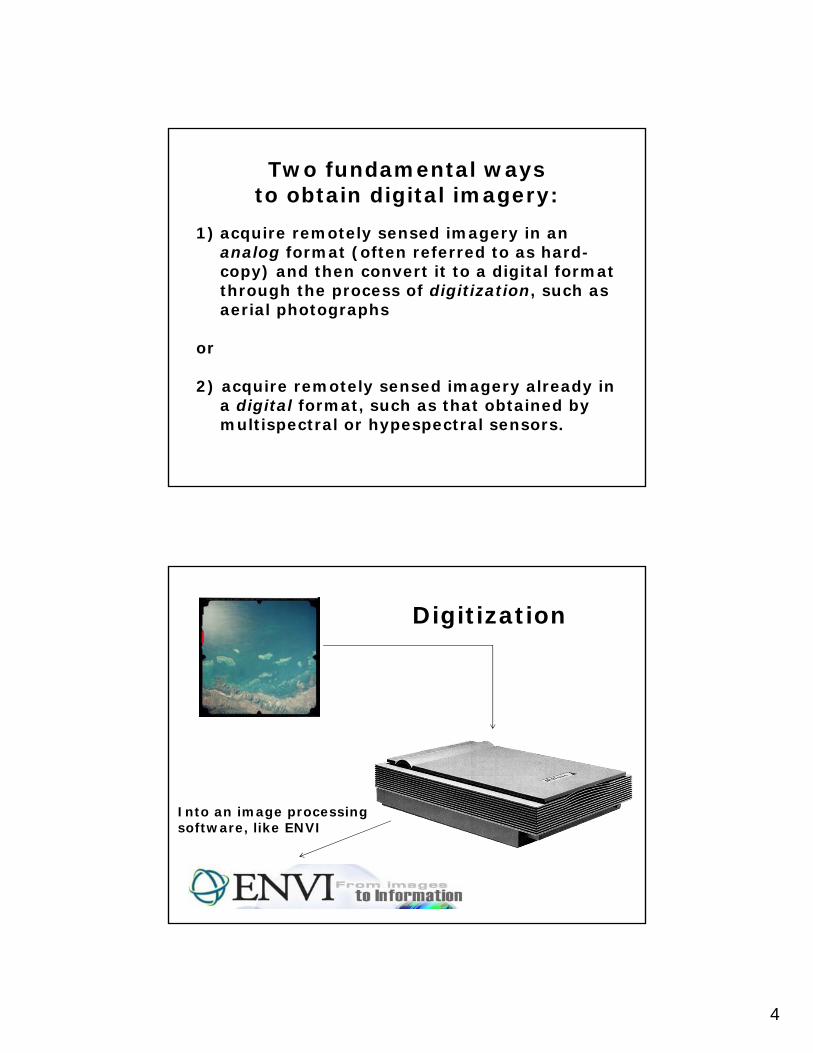
Two fundamental ways to obtain digital imagery:
1) acquire remotely sensed imagery in an analog format (often referred to as hard-copy) and then convert it to a digital format through the process of digitization, such as aerial photographs
or
2) acquire remotely sensed imagery already in a digital format, such as that obtained by multispectral or hypespectral sensors.
Digitization
Into an image processingsoftware, like ENVI

5
Relationship between digitizer
instantaneous-field-of-view measured in
dots per inch or micrometers, and the pixel
ground resolution at
various scales of
photography.
LANDSAT: REMOTE SENSORSReturn Beam Vidicon camera (RBV) B,G,R
Multispectral Scanner (MSS) G,R, 2 NIR
Thematic Mapper (TM) B,G,R, NIR, 2 MIR, FIR
Enhanced Thematic Mapper Plus (ETM+) B,G,R, NIR, 2 MIR, FIR, PAN
Operational Land Imager (OLI) 2B,G,R, NIR, 3MIR, PAN
Thermal Infrared Sensor (TIRS) 2 Thermal Bands

6
OLI / TIRS8
2013

7
LandsatMultispectral
Scanner (MSS) and Landsat
Thematic Mapper (TM)
Sensor SystemCharacteristics
Landsat Multispectral Scanning System (MSS)
Attitude-control subsystem
Wideband recorder electronics
Attitude measurement
sensor
Multispectral Scanner (MSS)Return Beam
Vidicon (RBV) cameras (3)
Data collection antenna
Solar array

8
Inclination of the Landsat Orbit to Maintain A Sun-synchronous Orbit
Landsat Multispectral Scanning System (MSS) Orbit

9
Orbit Tracks of Landsat 1, 2, or 3 During A Single Day of Coverage
Components of the Landsat
Multispectral Scanner (MSS)
System on Landsat 1 Through 5

10
MSS Image from Western PR

11
Landsat 4 and 5 Platform with Associated Sensor and
Telecommunication Systems
High-gain antenna
Multispectral Scanner (MSS)
Solar array panel
Thematic Mapper
(TM)
Global positioning system antenna
Attitude control module
Propulsion module
Power module

12
Components of the
Landsat4 and 5
Thematic Mapper

13
Jensen, 2007Jensen, 2007
Seven Bands of Landsat Thematic Mapper Data of Charleston, SC,
Obtained on February 3, 1994
Reflectance of the Upper Surface of A Sycamore Leaf at Different
Moisture Contents
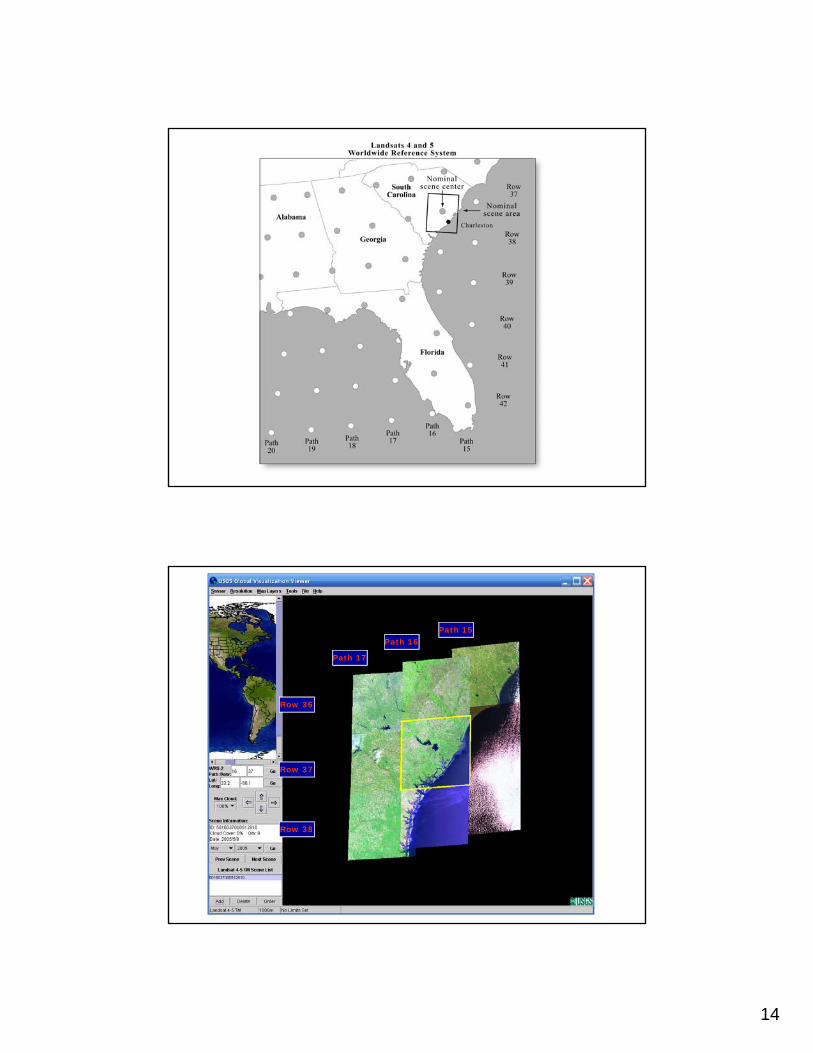
14
Row 37
Path 16Path 16Path 15Path 15
Path 17Path 17
Row 36
Row 38

15
X-BAND ANTENNAAt UPRM
RADARSAT
LANDSAT-7
ETM+
TERRA

16
ETM+ BANDS
Band MicrometersResolution
(M)
1 .45 to .515 30
2 .525 to .605 30
3 .63 to .690 30
4 .75 to .90 30
5 1.55 to 1.75 30
6 10.40 to 12.5 60
7 2.09 to 2.35 30
Pan .52 to .90 15
ETM+ TECHNICAL SPECIFICATIONS
Typeopto-mechanical
scanner
Spatial resolution
15/30/60 m
Spectral range 0.45-12.5 µm
Number of bands
8
Temporal resolution
16 days
Size of image 183 x 170 km
Swath 183 km
Stereo n
Programmable y
Enhanced Thematic Mapper +
Landsat 7Imagery

17
Landsat 7ETM+
ETM+ 13-NOV-2000

18
ETM+ 13-NOV-2000

19
Resolutions of OLI:
Spatial=30 m, 15 pan
Spectral=8 bands
Radiometric=12 bits
Temporal=16 days
http://glovis.usgs.gov
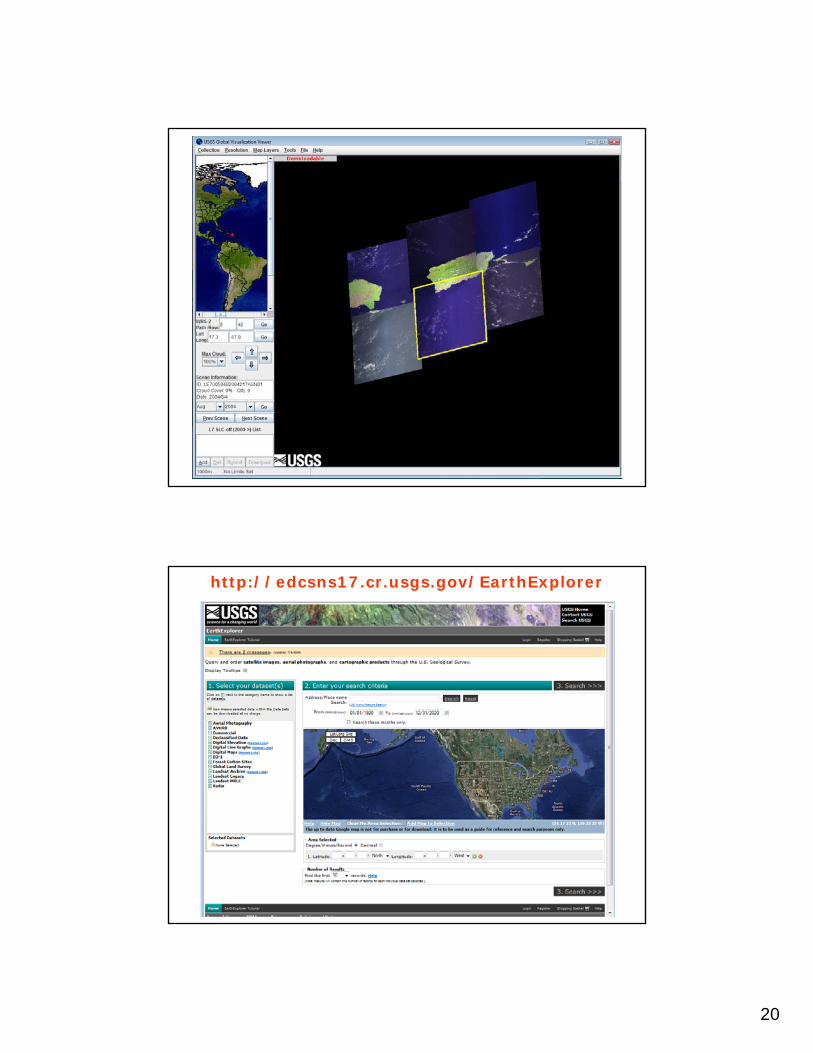
20
http://edcsns17.cr.usgs.gov/EarthExplorer

21
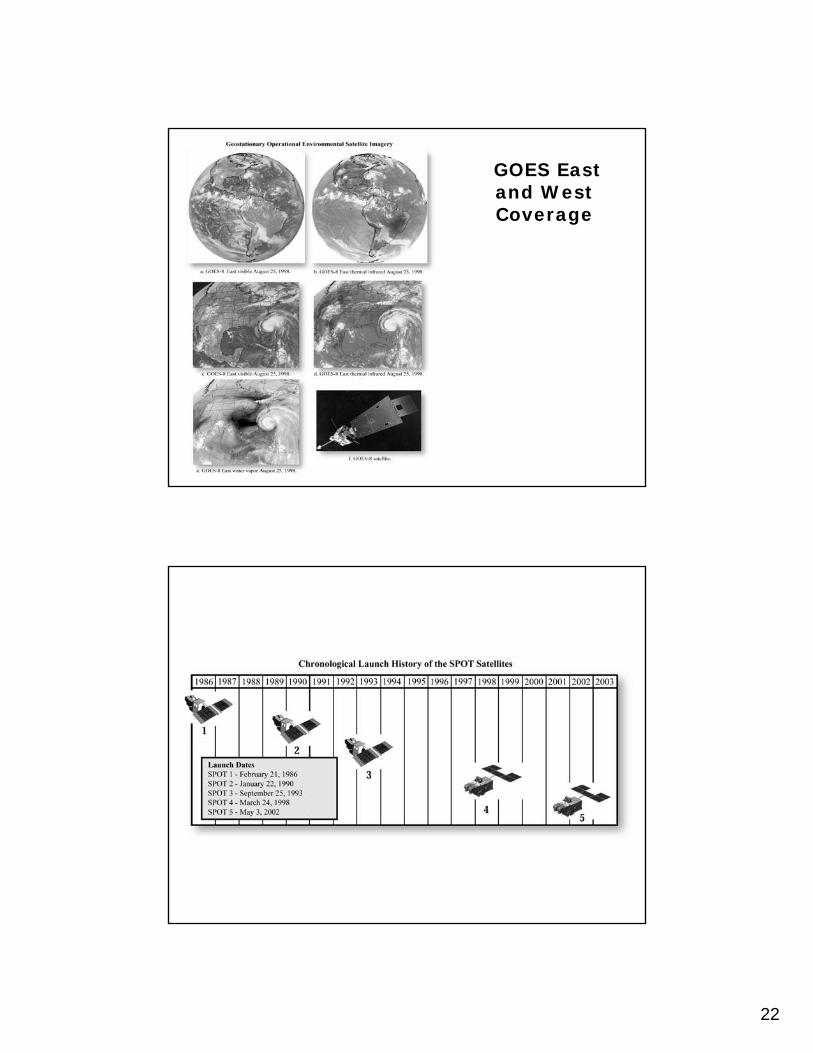
GOES East and West Coverage
140ÞE 180ÞE 20ÞE
Useful GOES coverage
Communication range
GOES West
GOES East
140ÞW 100ÞW 60ÞW 20ÞW
GOES West
GOES East
GOES Imager Optical Elements
22
GOES East and West Coverage
August 25, 1989
GOES East Infrared
August 25, 1989

23
SPOT Satellite System
Components

24
25
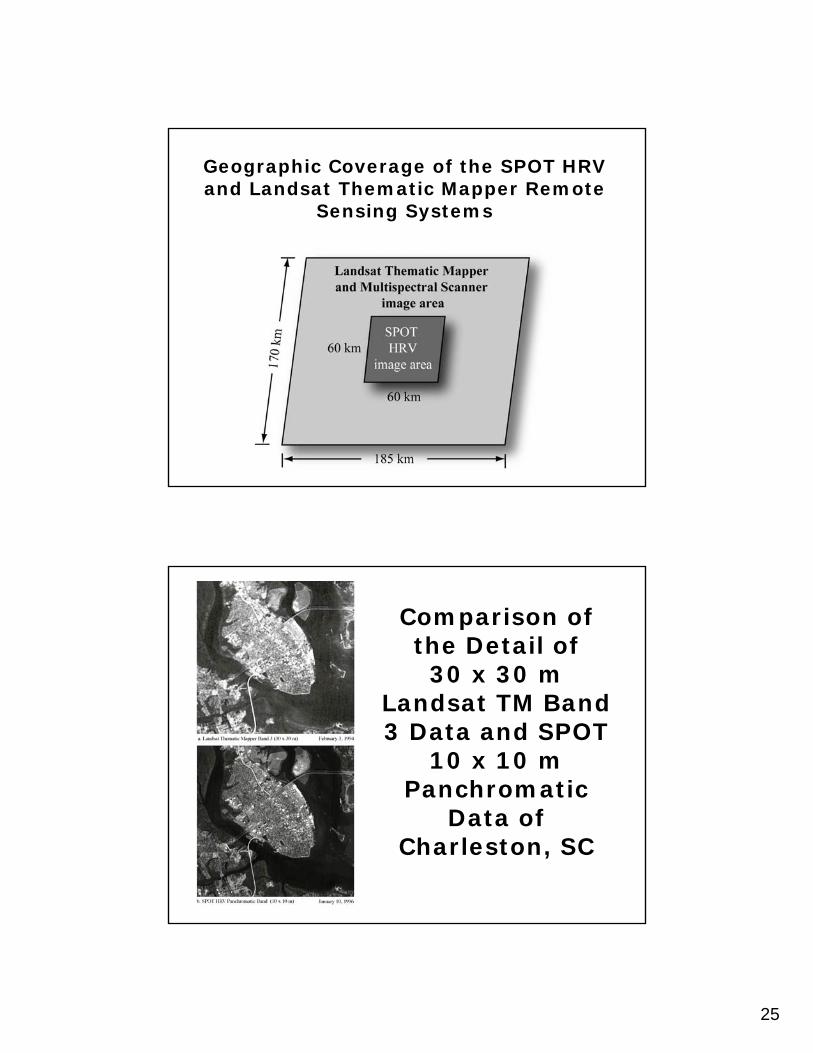
Geographic Coverage of the SPOT HRV and Landsat Thematic Mapper Remote
Sensing Systems
Comparison of the Detail of30 x 30 m
Landsat TM Band 3 Data and SPOT
10 x 10 m Panchromatic
Data of Charleston, SC

26
SPOT/LANDSAT TM

27
IKONOS SENSOR
IKONOS is derived from the Greek word for "image." The IKONOSsatellite is the world's first commercial satellite to collect black-and-white images with 1-meter resolution and multispectral imagery with4-meter resolution. IKONOS and was launched on September 24, 1999from Space Launch Complex 6 (SLC-6) at Vandenberg Air Force Base inCalifornia.
Sensor Characteristics
The IKONOS satellite weighs about 1600 pounds. It orbits the Earth every 98minutes at an altitude of approximately 680 kilometers or 423 miles. IKONOS waslaunched into a sun-synchronous orbit, passing a given longitude at about the samelocal time (10:30 A.M.) daily. IKONOS can produce 1-meter imagery of the samegeography every 3 days.
Spectral Range1-meter black-and-white
(panchromatic)0.45 - 0.90 mm.
4-meter multispectral Blue: 0.45 - 0.52 mm
Green: 0.51 - 0.60 mmRed: 0.63 - 0.70mm
Near IR: 0.76 - 0.85 mm
1 m
eter
–B
/W
1 m
eter
–Tr
ue
Co
lor
4 m
eter
–Fa
lse
Co
lor
4 m
eter
–Tr
ue
Co
lor

28
Viejo San Juan
Observatorio de Arecibo

29
Bahia de Mayaguez
Rio Añasco

30
El Combate
Arecibo

31
La Parguera
Bahia Mosquito, Vieques

32
Characteristics of the Daedalus Airborne Multispectral Scanner (AMS)
Aircraft Multispectral
Scanner

33
Advanced Thermal and LandApplications Sensor (ATLAS)

34
ATLAS2004
REFERENCE: Introduction to Remote Sensing, Chapter 11James B. Campbell (2007)The Guilford Press
DIGITAL IMAGECLASSIFICATION
35
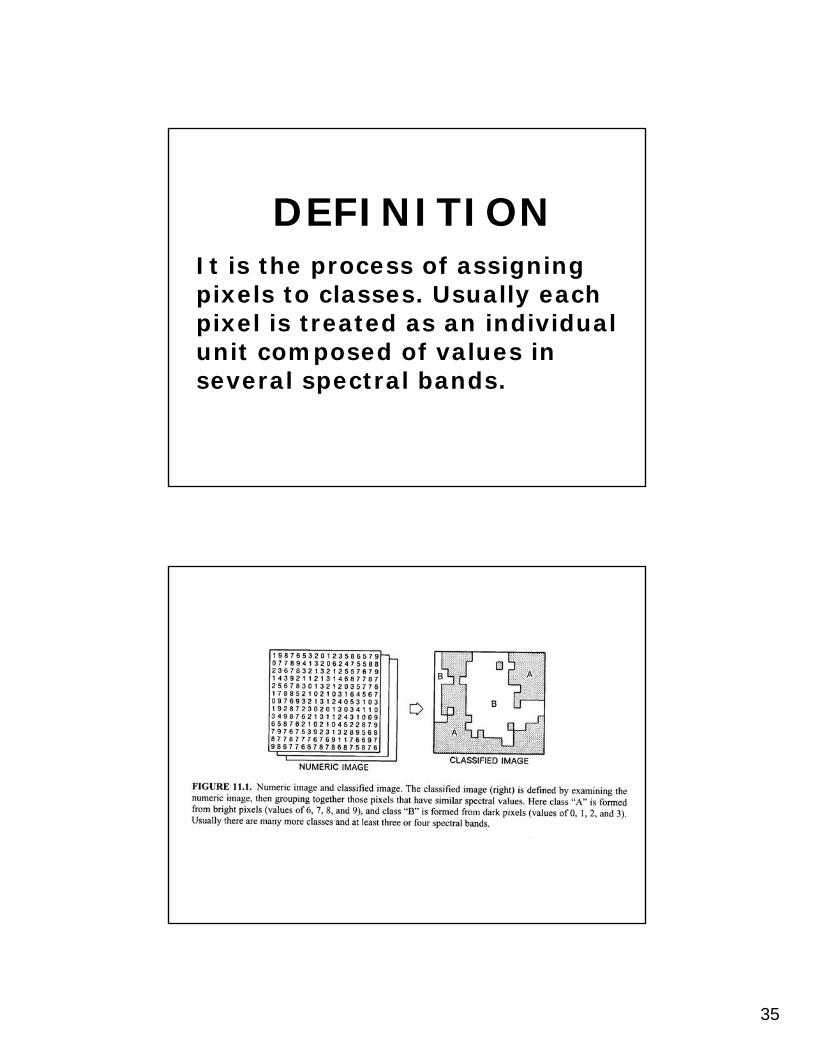
DEFINITIONIt is the process of assigning pixels to classes. Usually each pixel is treated as an individual unit composed of values in several spectral bands.

36
INFORMATIONAL CLASSES AND SPECTRAL CLASSES

37
UNSUPERVISED CLASSIFICATION
It can be defined as the identification of natural groups, or structures, within multispectral data.
ADVANTAGES OF THEUNSUPERVISED CLASSIFICATION
- No extensive prior knowledge of the region is required.
- The opportunity for human error is minimized.
- Unique classes are recognized as distinct units.

38
DISADVANTAGES OF THEUNSUPERVISED CLASSIFICATION
- Identifies spectrally homogeneous classes that do not necessary correspond to the categories that are of interests to the analyst.
- The analyst has limited control over the menu of classes and their identities.
- Spectral properties of specific classes will change over time.

39

40
SUPERVISED CLASSIFICATION
It can be defined as the process of using samples (training data) of known identity to classify pixels of unknown identity.
41
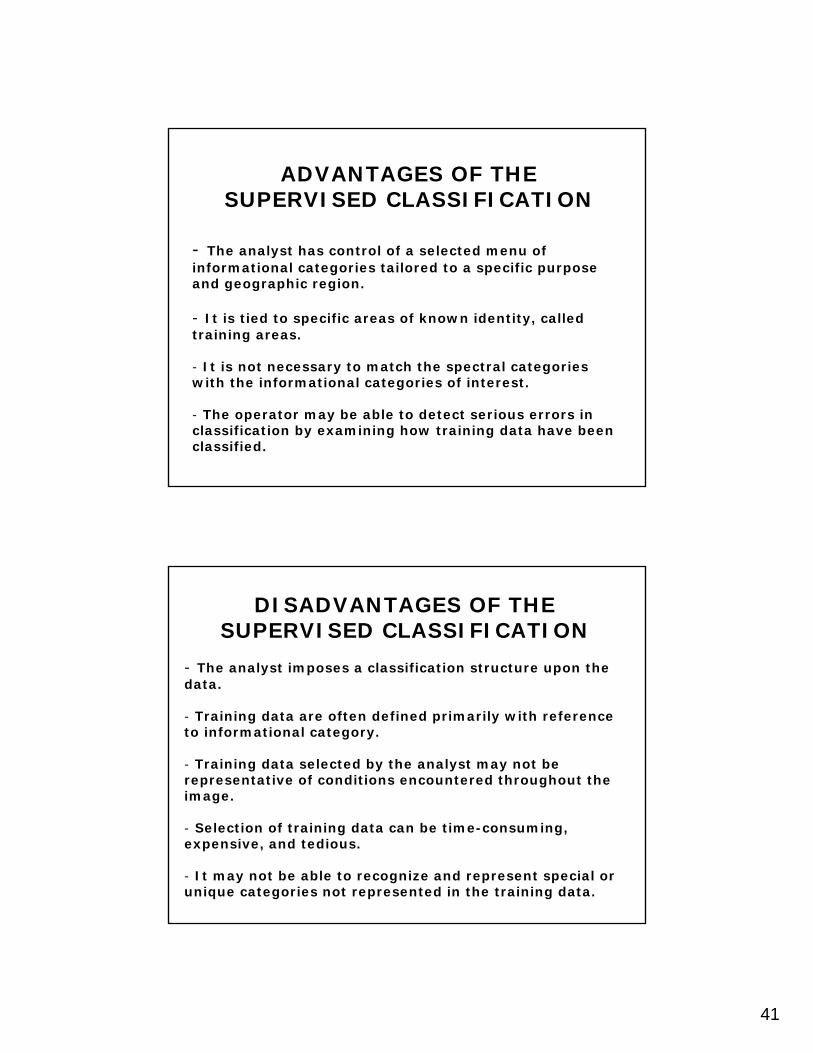
ADVANTAGES OF THESUPERVISED CLASSIFICATION
- The analyst has control of a selected menu of informational categories tailored to a specific purpose and geographic region.
- It is tied to specific areas of known identity, called training areas.
- It is not necessary to match the spectral categories with the informational categories of interest.
- The operator may be able to detect serious errors in classification by examining how training data have been classified.
DISADVANTAGES OF THESUPERVISED CLASSIFICATION
- The analyst imposes a classification structure upon the data.
- Training data are often defined primarily with reference to informational category.
- Training data selected by the analyst may not be representative of conditions encountered throughout the image.
- Selection of training data can be time-consuming, expensive, and tedious.
- It may not be able to recognize and represent special or unique categories not represented in the training data.

42
KEY CHARACTERISTICS OF TRAINING AREAS
1. Number of Pixels2. Size3. Shape4. Location5. Number6. Placement7. Uniformity

43

44
IDEALIZED SEQUENCE FOR SELECTING TRAINING DATA
1. Assemble information2. Field studies3. Carefully plan collection of field observations.4. Preliminary examination of the digital scene.5. Identify prospective training areas.6. Display digital image and identify training areas.7. Display and inspect histograms of all spectral bands.8. Modify boundaries of the training fields to eliminate
bimodality.9. Incorporate training data information into the
classification procedure.

45

46

47