chapter 7: evaluation of the impacts of feral camels gp ... · appendix 7.2 camel usage and impacts...
TRANSCRIPT
Desert Knowledge CRC 133Managing the impacts of feral camels in Austral ia: a new way of doing business
Chapter 7:
Evaluation of the impacts of feral camels
GP Edwards
B Zeng
WK Saalfeld
Desert Knowledge CRC134 Managing the impacts of feral camels in Austral ia: a new way of doing business Ch 7: Evaluat ion of the impacts of feral camels, pp 133–182
1. Summary .......................................................................................................................................... ..................... 1371.1 Recommendations ............................................................................................................... ..................... 138
2. Introduction ..................................................................................................................................... ..................... 1383. Methods............................................................................................................................................ ..................... 140
3.1 Economic impacts ............................................................................................................... ..................... 1403.2 Environmental impacts ....................................................................................................... ..................... 1403.3 Social/cultural impacts ........................................................................................................ ..................... 1413.4 Disease risk ........................................................................................................................ ..................... 1413.5 Scope of the problem ......................................................................................................... ..................... 141
4. Economic impacts ............................................................................................................................ ..................... 1414.1 Direct control and management costs ................................................................................. ..................... 1414.2 Damage to infrastructure, property, and people .................................................................. ..................... 1434.3 Lost pastoral production ..................................................................................................... ..................... 1484.4 Indirect economic impacts .................................................................................................. ..................... 148
5. Environmental impacts .................................................................................................................... ..................... 1495.1 Damage to vegetation ........................................................................................................ ..................... 1495.2 Damage to wetlands ........................................................................................................... ..................... 1525.3 Other sites of biological significance .................................................................................. ..................... 153
6. Social/cultural impacts ..................................................................................................................... ..................... 1536.1 Damage to Aboriginal culturally significant sites ............................................................... ..................... 1536.2 Damage to plant species of cultural/economic value to Aboriginal people ........................ ..................... 1536.3 Safety concerns ................................................................................................................... ..................... 155
7. Disease risk ...................................................................................................................................... ..................... 1558. Case studies ...................................................................................................................................... ..................... 156
8.1 Incursion of camels onto remote Aboriginal settlements and pastoral properties in January–March 2007 in the vicinity of the ‘western deserts’ ............................................................................... ..................... 156
8.2 General observations of camel impacts on waterholes across central Australia ................. ..................... 1598.3 Detailed assessment of camel impacts on a culturally important site in central Australia . ..................... 159
9. Positive impacts of feral camels ...................................................................................................... ..................... 1599.1 Benefits to landholders ........................................................................................................ ..................... 1599.2 Benefits to those involved in the meat and pet meat industries .......................................... ..................... 1599.3 Tourism ............................................................................................................................... ..................... 1609.4 Environmental benefits ...................................................................................................... ..................... 160
10. Relationship between negative impacts and density ...................................................................... ..................... 16111. Discussion ...................................................................................................................................... ..................... 162
11.1 Recommendations ............................................................................................................. ..................... 16412. References ...................................................................................................................................... ..................... 16513. Appendices ..................................................................................................................................... ..................... 168
Appendix 7.1 The impacts of camels on water bodies in Central Australia: A preliminary assessment ....... 168Appendix 7.2 Camel usage and impacts at a permanent spring in central Australia: A case study. ....... 172
Contents

Desert Knowledge CRC 135Managing the impacts of feral camels in Austral ia: a new way of doing business Ch 7: Evaluat ion of the impacts of feral camels, pp 133–182
Table 7.1: Annual impact of pest animals ............................................................................................ ..................... 139Table 7.2: Annual amount of money invested by both government (and research organisations) and pastoral and
conservation landholders (excluding in kind contributions) in the management of feral camels averaged over the period captured by the pastoralist an .................................................................................. ..................... 142
Table 7.3: Horse/camel-related road accidents in the NT, 2003–2006 ................................................ ..................... 147Table 7.4: Vehicle collisions involving camels over the period 2003–2007, Ngaanyatjarra Lands WA ....... 148Table 7.5: Number of animal-related collision claims for SA, WA, and the NT ................................ ..................... 148Table 7.6: Plant species of central Australia considered vulnerable to local extinction or severe impact as a result of
camel browsing......................................................................................................................... ..................... 150Table 7.7: Plants of cultural significance and their vulnerability to local extinction or decline as a result of camel
browsing. ................................................................................................................................. ..................... 154Table 7.8: Camel tourism businesses ................................................................................................... ..................... 160Table 7.9: The annualised monetary value of the economic impacts of feral camels ......................... ..................... 163Table A7.2.1: Dates of site visits and data collected from X ............................................................... ..................... 173Table A7.2.2: Faecal coliform results for water samples taken from X............................................... ..................... 175Table A7.2.3: Results of line-point intercept survey conducted in the weeks following moderate rains in November
2007, and during a dry period with heavy camel use in July 2008 ......................................... ..................... 176
Tables
List of shortened forms
Contributing author information
Glenn Edwards: Department of Natural Resources, Environment, The Arts and Sport, PO Box 1120, Alice Springs, Northern Territory 0871, Australia
Benxiang Zeng: Department of Natural Resources, Environment, The Arts and Sport, PO Box 1120, Alice Springs, Northern Territory 0871, Australia
Keith Saalfeld: Department of Natural Resources, Environment, The Arts and Sport, PO Box 1120, Alice Springs, Northern Territory 0871, Australia.
APY Anangu Pitjantjatjara YankunytjatjaraAUD Australian dollarBOM Bureau of MeterologyCLC Central Land CouncilNPYWC Ngaanyatjarra Pitjantjatjara Yankunytjatjara Women’s CouncilNRETAS Natural Resources, Environment, The Arts and Sport (NT Government Department of)NRM Natural Resource ManagementRFDS Royal Flying Doctor ServiceUKTNP Uluru–Kata Tjuta National Park

Desert Knowledge CRC136 Managing the impacts of feral camels in Austral ia: a new way of doing business Ch 7: Evaluat ion of the impacts of feral camels, pp 133–182
Figure 7.1: Operational input to camel management by government and research organisations over the period 1997–2008, exclusive of in-kind support ................................................................................. ..................... 142
Figure 7.2: (a) Self mustering gates on Andado station (NT) that have been damaged by camels; (b) Fence line on boundary between Tempe Downs station and Watarrka National Park (NT) damaged by camels in November 2008 .......................................................................................................................................... ..................... 143
Figure 7.3: (a) Toilet on an Aboriginal settlement near Warburton in the Ngaanyatjarra lands (WA) that has been damaged by camels (image courtesy P. Morrison); (b) Windmill at Blackstone in the Ngaanyatjarra lands (WA) that has been damaged by camels. .................................................................................. ..................... 144
Figure 7.4: Map of arid Australia showing the location of some key places mentioned in the text ... ..................... 145Figure 7.5: (a) Desert poplar on Curtin Springs station (NT) that has been damaged by camels; (b) quandong tree in
Great Victoria Desert (WA) that has been damaged by camels; (c) Mulga trees on Curtin Springs station (NT) that have been damaged by camels .......................................................................................... ..................... 151
Figure 7.6: Camels around a dry waterhole near Docker River (NT) in February 2007 ..................... ..................... 152Figure 7.8: (above) Camels on Mulga Park station (NT), February 2007; (right) Camel within Warakurna settlement
(WA), February 2007 ................................................................................................................ ..................... 157Figure 7.9: The relationship between the mean value of infrastructure damage reported by pastoral properties over
the period July 2005 – June 2007 and the estimated mean density of feral camels on the property ....... 161Figure 7.10: Map showing the level of damage reported by individual pastoral properties in relation to camel density
contours ................................................................................................................................... ..................... 162Figure A7.2.1: Examples of long-term water usage patterns by camels at X ..................................... ..................... 178Figure A7.2.2: Average monthly water volume in X ........................................................................... ..................... 178Figure A7.2.3: The mean monthly water levels (with SD) recorded ................................................... ..................... 179Figure A7.2.4: Photos taken by surveillance camera on 27–28 February 2008 .................................. ..................... 180Figure A7.2.5: Changes in water levels before and after camels visit X on 27–28 February 2008 ..... ..................... 181
Figures and graphs
Acknowledgements
This report is Chapter 7 of the final report for the project ‘Cross-jurisdictional management of feral camels to protect NRM and cultural values’. The project was funded by the Australian Government. The views expressed herein do not necessarily represent the views of Desert Knowledge CRC or its participants.
We thank Petronella Vaarzon-Morel, Fiona Walsh, David Alexander, David Hewitt, Andrew Drenen, Michael Balharry, Nick Swadling, Grant Williams, Peter Latz, Theresa Nano, Bob Henzell, Brian Watts, Chris Moon, Phil Gee, and Mark Williams for their advice and input with respect to various aspects of this report. We thank in particular Tracey Guest, Peter Barker, and Jayne Brim Box for their generous contributions to the case studies herein. Bo Raphael, Lyndee Matthews, James Wright, and Jenine Baker provided useful comments on drafts of this report.
Desert Knowledge CRC 137Managing the impacts of feral camels in Austral ia: a new way of doing business Ch 7: Evaluat ion of the impacts of feral camels, pp 133–182
1. SummaryIn this chapter we provide an assessment of the positive and negative impacts of feral camels. The impacts of pest animals typically fall into three main categories: economic, environmental, and social/cultural. The negative impacts of feral camels are manifested in all three areas, whereas positive impacts are largely confined to the economic arena. In this chapter we also provide an assessment of the disease risk posed by feral camels. In most instances we were able to estimate the fiscal magnitude of negative economic impacts but not of positive impacts. We were unable to estimate the monetary value of environmental or social/cultural impacts.
Negative economic impacts of feral camels mainly include direct control and management costs, impacts on livestock production through camels competing with stock for food and other resources, damage of infrastructure, and damage to people and vehicles due to collisions. The annualised monetary value of direct control and management costs (including government in-kind management costs, research costs, and landholder management costs) was estimated to be $2.36 million. The annualised monetary value of costs associated with damage to infrastructure on pastoral leases, Aboriginal settlements and conservation lands, damage to the dog fence, production losses, and road accidents was estimated to be $8.93 million. The annualised benefit that accrues to landholders mainly through the selling and eating of feral camels was estimated to be $0.62 million. This equates to an annual net economic loss of $10.67 million due to feral camels. We were unable to obtain reliable estimates of the economic value of damage to remote airstrips or of camels mustered and sold by Aboriginal people.
Negative environmental impacts of feral camels include damage to vegetation through feeding behaviour and trampling; suppression of recruitment in some plant species; damage to wetlands through fouling, trampling, and sedimentation; and competition with native animals for food and shelter.
Feral camels have significant negative impacts on the social/cultural values of Aboriginal people. Camels damage sites, such as waterholes, that have cultural significance to Aboriginal people; they destroy bush tucker resources, reduce people’s enjoyment of natural areas, create dangerous driving conditions, and cause a general nuisance in residential areas.
Although we were unable to estimate the monetary value of the environmental and social/cultural impacts of feral camels, such impacts are significant. Of particular concern is damage to, or associated with, wetlands which are both biologically and culturally/socially important. Camels not only damage the ecology and hydrology of wetlands, they can remove free-standing water and even destroy the ability of some wetland types to hold water. Wetlands are refugia for many native animals during droughts, and threats to wetlands and their environmental, cultural, and production values are a serious concern.
The climate change forecast for arid Australia out to 2030 is for a temperature increase of 1–1.2oC, higher frequency of hot days, a decline in rainfall of between 2–5%, higher evaporation rates, and higher frequency of droughts. Under this scenario, even if camel populations remain static, the negative impacts of camels are likely to be exacerbated. The exotic disease risk associated with feral camels is also likely to increase if camels are brought into closer contact with stock as they seek out scarcer water resources.
We established a positive density/damage relationship for camels and infrastructure on pastoral properties which is likely to hold true for environmental variables and cultural/social variables as well. Therefore, irrespective of climate change, the magnitude of the negative impacts of feral camels will undoubtedly increase if the population is allowed to continue to increase. Furthermore, the likelihood
Chapter 7: Evaluation of the impacts of feral camels

Desert Knowledge CRC138 Managing the impacts of feral camels in Austral ia: a new way of doing business Ch 7: Evaluat ion of the impacts of feral camels, pp 133–182
that camels would be epidemiologically involved in the spread of exotic diseases like bluetongue and surra (were there to be outbreaks of these diseases in Australia) is also very likely to increase with population density.
The positive density/damage relationship established for camels and infrastructure on pastoral properties indicates that the degree of damage increases significantly when camel densities exceed 0.4 camels/km2. This suggests that there are real gains to be made in maintaining camel densities on pastoral leases at <0.3 camels/km2. Nevertheless, damage still occurs at densities <0.3 camels/km2. It would seem that, in order to safeguard the survival of quandongs, curly pod wattles, and bean trees camel densities need to be kept at or below 0.3 camels/km2. There is an obvious need to clarify this threshold for these and other highly palatable species. On the basis of our current understanding, we recommend that feral camels be managed to a long-term target density of 0.1–0.2 camels/km2 at property to regional scales (areas in the order of 10 000–100 000 km2) in order to mitigate broadscale negative impacts on infrastructure on pastoral stations and in remote settlements, and on plant species that are highly susceptible to camel browsing.
1.1 RecommendationsThat management of feral camels should focus on mitigation of negative impacts, not reduction in the number of camels per se. However, as there is a positive relationship between camel density and degree of damage, reducing camel density will often be fundamental to achieving damage mitigation.That on the basis of our current understanding, feral camels be managed to a long-term target density of 0.1–0.2 camels/km2 at property to regional scales (areas in the order of 10 000–100 000 km2) in order to mitigate broadscale negative impacts on infrastructure on pastoral stations and in remote settlements, and on plant species that are highly susceptible to camel browsing.That there is a need to quantify the density/damage relationship for feral camels for response variables (particularly environmental variables) for which the relationship is not known across a range of environments and with particular emphasis on identifying the threshold density below which impacts are negligible.
2. Introduction Over the last 15 or so years, there has been a paradigm shift in the area of vertebrate pest control. The shift has been from animal control to animal damage control (Hone 2007). This shift recognises the fact that pest abundance by itself is not actually the problem; rather, it is the harmful impacts of the pest that are the problem (Hone 2007). Accordingly, the aim of vertebrate pest control should be to mitigate the damaging impacts of pests rather than controlling the pests themselves (Hone 2007, Australian Pest Animal Strategy 2007). Invariably there is a positive relationship between pest abundance and degree of impact, so damage mitigation involves reducing pest abundance (Hone 2007). Other factors that can affect the extent of pest damage include the availability of the resource that is being damaged (often a positive relationship), variation in landscape features that can lead to spatial heterogeneity in damage levels, and time of year (Braysher 1993, Hone 2007). Often there exists a threshold pest density below which damage is either non existent, negligible, or tolerable. The presence of a threshold means that not all pests have to be removed in order to mitigate damage (Hone 2007).
In Australia, the harmful impacts of pest animals fall into three main categories: economic, environmental, and social/cultural (Hart & Bomford 2006; Australian Pest Animal Strategy 2007). Pest animals such as rabbits and goats compete with livestock and wildlife for pasture and other resources, particularly during dry periods. Other pest animals including mice and some birds, such as the starling, cause extensive damage to crops. Predation by wild dogs and foxes can result in significant financial loss to producers through stock deaths and sub-lethal effects, including scarring. Predation by foxes and cats also poses a serious threat to the survival of many native animals. Pigs, goats, horses, and other pests can damage infrastructure on national parks, farms, and pastoral lands. Pest species such as the pig
•
•
•
Desert Knowledge CRC 139Managing the impacts of feral camels in Austral ia: a new way of doing business Ch 7: Evaluat ion of the impacts of feral camels, pp 133–182
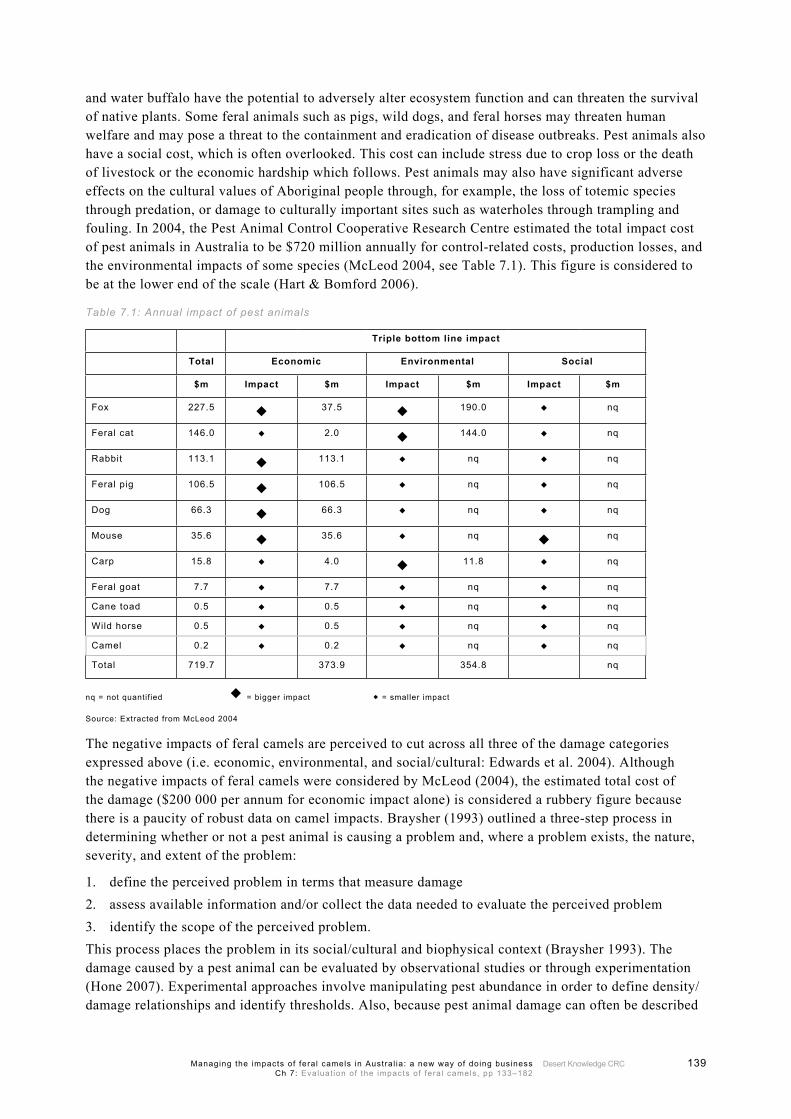
and water buffalo have the potential to adversely alter ecosystem function and can threaten the survival of native plants. Some feral animals such as pigs, wild dogs, and feral horses may threaten human welfare and may pose a threat to the containment and eradication of disease outbreaks. Pest animals also have a social cost, which is often overlooked. This cost can include stress due to crop loss or the death of livestock or the economic hardship which follows. Pest animals may also have significant adverse effects on the cultural values of Aboriginal people through, for example, the loss of totemic species through predation, or damage to culturally important sites such as waterholes through trampling and fouling. In 2004, the Pest Animal Control Cooperative Research Centre estimated the total impact cost of pest animals in Australia to be $720 million annually for control-related costs, production losses, and the environmental impacts of some species (McLeod 2004, see Table 7.1). This figure is considered to be at the lower end of the scale (Hart & Bomford 2006).
Table 7.1: Annual impact of pest animals
Triple bottom line impact
Total Economic Environmental Social
$m Impact $m Impact $m Impact $m
Fox 227.5 37.5 190.0 nq
Feral cat 146.0 2.0 144.0 nq
Rabbit 113.1 113.1 nq nq
Feral pig 106.5 106.5 nq nq
Dog 66.3 66.3 nq nq
Mouse 35.6 35.6 nq nq
Carp 15.8 4.0 11.8 nq
Feral goat 7.7 7.7 nq nq
Cane toad 0.5 0.5 nq nq
Wild horse 0.5 0.5 nq nq
Camel 0.2 0.2 nq nq
Total 719.7 373.9 354.8 nq
nq = not quantified = bigger impact = smaller impact
Source: Extracted from McLeod 2004
The negative impacts of feral camels are perceived to cut across all three of the damage categories expressed above (i.e. economic, environmental, and social/cultural: Edwards et al. 2004). Although the negative impacts of feral camels were considered by McLeod (2004), the estimated total cost of the damage ($200 000 per annum for economic impact alone) is considered a rubbery figure because there is a paucity of robust data on camel impacts. Braysher (1993) outlined a three-step process in determining whether or not a pest animal is causing a problem and, where a problem exists, the nature, severity, and extent of the problem:
define the perceived problem in terms that measure damageassess available information and/or collect the data needed to evaluate the perceived problemidentify the scope of the perceived problem.
This process places the problem in its social/cultural and biophysical context (Braysher 1993). The damage caused by a pest animal can be evaluated by observational studies or through experimentation (Hone 2007). Experimental approaches involve manipulating pest abundance in order to define density/damage relationships and identify thresholds. Also, because pest animal damage can often be described
1.2.3.

Desert Knowledge CRC140 Managing the impacts of feral camels in Austral ia: a new way of doing business Ch 7: Evaluat ion of the impacts of feral camels, pp 133–182
by relationships between variables, modelling can be used to understand the dynamics of the system under investigation, identify thresholds, and predict the effects of management actions (Hone 2007). In reality, it is very difficult to quantify all aspects of a pest animal’s impact.
The economic damage caused by pest animals (e.g. crop loss, aircraft bird strikes) can usually be estimated quite easily in monetary terms, which allows for simple economic analyses (Hone 2007). In contrast, damage to environmental and social/cultural values can rarely, if ever, be evaluated in monetary terms. For these values, the measurement of indicator variables to gauge the quality of the resource (e.g. water quality, degree of trampling) or specific value judgements (e.g. prevention of a species’ local or global extinction, time spent on country by Aboriginal people) with no specific economic basis are often used. However, in some instances, impact on environmental and/or cultural/social values may not be readily quantified (Braysher 1993).
In this chapter we follow the three step process of Braysher (1993) in order to refine our understanding of the damaging (negative) impacts of feral camels. We also note the realised and potential benefits (positive impacts) of feral camels.
3. MethodsA range of different non-experimental techniques was used to assess the positive and negative impacts of feral camels. We attempted to define perceived problems and benefits in ways that could be measured and then assessed the available information and/or collected new data to evaluate the perceived problem. In certain situations we scaled up damage information from particular sites to assess the overall scope of the problem.
3.1 Economic impactsWe collected information on the economic impacts of feral camels through:
standardised interviews with pastoral, conservation, and Aboriginal landholders conducted in person, by telephone, or by mail (see Zeng & Edwards 2008a, 2008b; Vaarzon-Morel 2008a for details)statistical information held by government agenciesformal interviews with key contacts and informants published literature and reports.
In most instances we were able to estimate the fiscal magnitude of negative economic impacts but not of all positive impacts. We conducted a simple cost-benefit analysis on the available economic data relating to impacts.
3.2 Environmental impactsWe collected information on the environmental impacts of feral camels through:
standardised interviews with pastoral, conservation, and Aboriginal landholders conducted in person, by telephone, or by mail (see Zeng & Edwards 2008a, 2008b; Vaarzon-Morel 2008a for details)published literature and reports formal interviews with scientific experts and key contacts and informants observational case study research.
We were unable to estimate the monetary value of environmental impacts.
1.
2.3.4.
1.
2.3.4.
Desert Knowledge CRC 141Managing the impacts of feral camels in Austral ia: a new way of doing business Ch 7: Evaluat ion of the impacts of feral camels, pp 133–182
3.3 Social/cultural impactsWe collected information on the social/cultural impacts/benefits of feral camels through:
standardised interviews with pastoral, conservation, and Aboriginal landholders conducted in person, by telephone, or by mail (see Zeng & Edwards 2008a, 2008b; Vaarzon-Morel 2008a for details)published literature and reports formal interviews with scientific experts and key contacts and informants observational case study research.
We were unable to estimate the monetary value of social/cultural impacts.
3.4 Disease risk We collected information on the disease risk posed by feral camels through:
published literature and reports formal interviews with scientific experts and key informants.
We were unable to estimate the monetary value of the disease risk posed by feral camels.
3.5 Scope of the problem Different techniques were applied in order to generalise information collected at specific sites to the whole of the camel range to get an overall estimate of the scope of economic impacts. The approaches used in particular situations are detailed in the relevant sections below.
4. Economic impactsNegative economic impacts of feral camels mainly include direct control and management costs, impacts on livestock production due to camels competing with stock for food and other resources, damage to infrastructure and property, and damage to people and vehicles due to collisions.
4.1 Direct control and management costsDirect control and management refers to the activities and actions directed at mitigating the negative impacts of feral camels including camel control-related research, planning and extension activities, and on-ground control actions.
From 1998 to 2008, on the basis of statistical information held by government agencies and reports, the total operational investment in direct control and management by government agencies and research organisations was $4.37 million (Figure 7.1). Note that the numbers in Figure 7.1 do not include the resources invested in camel management by pastoral or conservation land managers or the in-kind contribution of government agencies, research organisations, camel-related industries, or individuals. Since 2004/05, the annual amount of money invested in camel management by government agencies and research organisations has approximately doubled. This is probably a response to the increasing numbers of feral camels (Saalfeld & Edwards 2008) and increasing impacts (this chapter).
1.
2.3.4.
1.2.

Desert Knowledge CRC142 Managing the impacts of feral camels in Austral ia: a new way of doing business Ch 7: Evaluat ion of the impacts of feral camels, pp 133–182
257758
345367
245527
313493
234466 244545 230000
336471
598978
890610
668552
0
200000
400000
600000
800000
1000000
1997/1998
1998/1999
1999/2000
2000/2001
2001/2002
2002/2003
2003/2004
2004/2005
2005/2006
2006/2007
2007/2008
Year
Inpu
t am
ount
($)
Figure 7.1: Operational input to camel management by government and research organisations over the period 1997–2008, exclusive of in-kind support
The Northern Territory (NT) government currently contributes about $0.1 million annually in in-kind support to the management of feral camels through support of research and operational personnel (e.g. qualified aerial shooters) involved in ‘on-ground’ management (Glenn Edwards 2008, NRETAS, pers. comm.). Assuming that the other two states with large camel populations (Western Australia and South Australia) contribute the same amount of in-kind support, the total amount of in-kind is $0.3 million annually.
A two-year (July 2005 – June 2007) breakdown by activity of the annual amount of money invested by both government (and research organisations) and pastoral and conservation landholders in the management of feral camels over the period captured by the pastoralist and conservation manager surveys (Zeng & Edwards 2008a, 2008b) indicates that pastoralists contributed about 59% and conservation managers 5% of the total amount invested (Table 7.2).
Table 7.2: Annual amount of money invested by both government (and research organisations) and pastoral and conservation landholders (excluding in kind contributions) in the management of feral camels averaged over the period captured by the pastoralist and conservation manager survey, July 2005 – June 2007
Survey/monitoring
($)
Research:camel
management ($)
Research:industry ($)
Inputs for commercial
use ($)
Culling ($)
Other actions ($)
Total ($) %
Pastoralists (calculated from survey data reported in Zeng & Edwards 2008a Tables 3.11, 3.16)
0 0 0 288 956 525 735 400 142 1 214 833 59.1
Conservation land managers (calculated from survey data reported in Zeng & Edwards 2008b Tables 4.9, 4.14)
- - - - - - 96 729 4.7
Government, research organisations
127 500 319 975 84 350 101 818 69 651 41 500 744 794 36.2
Total 127 500 319 975 84 350 390 774 595 386 441 642 2 056 356 100

Desert Knowledge CRC 143Managing the impacts of feral camels in Austral ia: a new way of doing business Ch 7: Evaluat ion of the impacts of feral camels, pp 133–182
4.2 Damage to infrastructure, property, and peopleIn rural areas of arid and semi-arid Australia, damage to property and infrastructure by camels falls into three main categories: pastoral lands suffer major damage to fences, yards, and water troughs; government agencies and remote settlements suffer major damage to buildings, fixtures, fences, and bores; individuals suffer injury (including death), damage, and financial loss through vehicular collisions involving feral camels.
4.2.1 Pastoral properties
There are 1189 pastoral properties within or on the margins of the range of feral camels, covering an area of 2.22 million km2 (Zeng & Edwards 2008a). Two hundred and nine of these pastoral stations (i.e. 17.6%) were surveyed through the interview process described above. These stations covered an area of 706 489 km2 (i.e. about 32% of the total pastoral area of interest). Results of the survey are given in detail in Zeng & Edwards (2008a).
Overall, 74.2% (155/209) of land managers reported that camels had been found on their properties and 70.3% (109/155) of landholders claimed that camels caused some damage on their properties over the past two years. On the basis of the per square kilometre estimate of damage for surveyed properties, the value of infrastructure damage was estimated to be $2.40 million annually across all pastoral properties within or on the margins of the camel range (i.e. damage to fences, yards, and water equipment) (Zeng & Edwards 2008a). Figure 7.2 shows some of the damage inflicted by camels on infrastructure on pastoral properties.
(a) (b)
Figure 7.2: (a) Self mustering gates on Andado station (NT) that have been damaged by camels; (b) Fence line on boundary between Tempe Downs station and Watarrka National Park (NT) damaged by camels in November 2008
Note: 7.2a image courtesy of J Bloomfield; 7.2b image courtesy of K Schwartzkopff
4.2.2 Remote settlements
There are 89 major Aboriginal settlements (population >100 people) within the range of feral camels (see Vaarzon-Morel 2008a, 2008b). In recent years, there have been periodic reports of large numbers of feral camels entering some Aboriginal settlements in some regions in search of water. In the survey conducted with Aboriginal landholders, inhabitants in 19 of the 27 settlements surveyed indicated that camels caused damage to infrastructure in their communities or on outstations near the communities (Vaarzon-Morel 2008a, 2008b). Camels were reported to have damaged buildings, fences, and water-

Desert Knowledge CRC144 Managing the impacts of feral camels in Austral ia: a new way of doing business Ch 7: Evaluat ion of the impacts of feral camels, pp 133–182
related infrastructure including taps, windmills, and evaporative air conditioners. Figure 7.3 shows some of the damage inflicted by camels on infrastructure in Aboriginal settlements. The monetary cost of this damage was not estimated in the survey.
(a) (b)
Figure 7.3: (a) Toilet on an Aboriginal settlement near Warburton in the Ngaanyatjarra lands (WA) that has been damaged by camels (image courtesy P. Morrison); (b) Windmill at Blackstone in the Ngaanyatjarra lands (WA) that has been damaged by camels.
The most widespread and serious incursion of camels onto Aboriginal settlements occurred over the summer of 2006/07. At this time there was an influx of many, perhaps tens of thousands, of apparently starving and thirsty camels onto pastoral leases to the south of Alice Springs and onto Aboriginal settlements in the Anangu Pitjantjatjara Yankunytjatjara (APY) lands in SA, the Ngaanyatjarra lands in WA and in the Petermann Ranges in the NT (see Figure 7.4). An account of this incident is given in Case Study 8.1 below.
In January 2008, feral camels entered Tjukurla community in the Ngaanyatjarra lands (WA) where they caused damage estimated at more than $5000. David Hewitt (2008, Relief Manager, Punmu Community, Ngaanyatjarra lands WA, pers. comm.) gave the following description of the damage:
Camels knocked down a gate to the school principal’s house (he was on holidays). Next morning there were six in the yard. They had broken off a tap, spent the night wallowing in mud caused by the flowing water, and left an awful mess on the concrete verandah.
One weekend they removed a hand basin from the verandah of a vacant community house and broke the tap. As most people were away for the weekend the water ran for a couple of days. There was an awful mess by the time someone finally reported it and the main community water tank almost ran dry.
Camels camped for a couple of weeks on the verandah of another vacant community house leaving droppings completely covering the verandah. The Aboriginal people tried to drive the camels out by pushing them with the bullbar of a vehicle. They injured one camel that subsequently died.
A fellow watching TV one afternoon heard a noise out the back of his house. There was a camel in his laundry trying to get a drink.
It was very hot in January and the camels were desperate for water. One of the leading men in the community suggested that we re-activate a hose that was running into a hole in the ground just beyond the main tank to give the camels water and keep them out of the community. Only problem there was that we only had one bore pumping and with the hot weather we had no water to spare.

Desert Knowledge CRC 145Managing the impacts of feral camels in Austral ia: a new way of doing business Ch 7: Evaluat ion of the impacts of feral camels, pp 133–182
There has also been recent camel damage to infrastructure at Kalka in the APY lands and at Warakurna in the Ngaanyatjarra lands. At Kalka in 2008, a mob of over 100 camels broke down the fence to a children’s playground to reach a tap that was leaking, totally destroying the playground equipment that had cost the community $30 000 to install (David Hewitt 2008, Relief Manager, Punmu Community, Ngaanyatjarra lands WA, pers. comm.). At Warakurna in the summer of 2006/07, the estimated economic loss caused by camels was in the order of $100 000 due to damage to fences, air conditioners, houses, water tanks, wind mills, and cleanup activities (Chris Moon 2007, former Community Development Advisor, Warakurna, pers. comm.) (see Case Study 1).
On the basis that (a) inhabitants in 12 of the 23 major communities (population > 100) surveyed indicated that camels caused damage to infrastructure (excluding fences) in their communities or on outstations near the communities (Vaarzon-Morel 2008a, 2008b), and (b) there are 89 major Aboriginal settlements (population > 100) within the range of feral camels, and assuming that (c) the mean damage figures for Kalka, Tjukurla, and Warakurna ($135 000/3 = $45 000) are indicative of annual damage figures for other remote settlements that experience camel damage, the total annual monetary value of camel damage to infrastructure on remote settlements is 12/23*89*$45 000 = $2.09 million. Although this figure may appear high, it probably accurately reflects the true cost of repairing infrastructure damage in remote settlements. It is also worth noting that, our scaling up process was conservative as we did not include the four surveyed Aboriginal communities that reported infrastructure damage only to fencing. Finally, it is worth making the point that the damage estimate used for the scaling up procedure is based on data for only three communities and may not be a representative sample.
Figure 7.4: Map of arid Australia showing the location of some key places mentioned in the text
Desert Knowledge CRC146 Managing the impacts of feral camels in Austral ia: a new way of doing business Ch 7: Evaluat ion of the impacts of feral camels, pp 133–182
4.2.3 Conservation reserves
Thirteen conservation managers (including both site managers and regional managers who manage a group of reserves/parks) were surveyed through the interview process described above. The managers represented 70 nature reserves, conservation parks, timber reserves, forest reserves, and national parks within or on the margins of the camel distribution. These parks/reserves covered 250 629 km2, which is about 40% of the entire area of conservation lands in or on the margins of the camel range (approximately 630 811 km2). Results of the survey are given in detail in Zeng & Edwards (2008b).
Feral camels were reported as present on about 51 % of reserves. Camels were reported to cause problems on 94.4% (34/36) of the reserves on which they were reported present. Damage to water sources was reported in 64.7% (22/34) of cases, damage to fencing in 29.4% (10/34) of cases, and other damage in 9% of cases. On the basis of the per square kilometre estimate of damage for surveyed reserves, the value of infrastructure damage was estimated to be $0.08 million annually across all conservation lands within or on the margins of the camel range (i.e. damage to fences, yards, and water equipment) (see Zeng & Edwards 2008b).
4.2.4 Dog Fence
The ‘dog fence’ was built to protect the sheep industry from wild dog damage. The fence is 5614 kilometres long, extending from Jimbour in Queensland (Qld) to the Great Australian Bight (see Saalfeld & Edwards 2008). Increasingly, feral camels are damaging the dog fence, particularly along the southern sections. It is estimated that feral camels cause at least $43 361 damage to the fence each year in SA alone (Michael Balharry, Executive Officer, Dog Fence Board, SA).
4.2.5 Airstrips
There are about 1100 airstrips (airports, heliport, and landing grounds) in or on the margins of the camel range. About one-third of these airstrips are located in areas where there are medium to high camel densities. These airstrips are used by local communities for transportation, by the Royal Flying Doctor Services (RFDS) for heath services/emergency rescue, as well as for some special purposes such as tourism and expeditions. Increasingly, feral camels pose a threat to aviation safety by damaging the airstrips or by their presence on the airstrips.
David Hewitt (Relief manager, Punmu Community, Ngaanyatjarra lands WA), provided the following comments on the issue in the Nyanngtjiarra lands (WA):
The airstrip at Amata was recently fenced at a great cost to keep camels away and already they are trying to push it over. In another community to the west of here where my wife was relieving last year, the mail plane has threatened to cease calling unless the camels are controlled. (David Hewitt 2003, pers. comm.).
(Hereafter, David Hewitt 2008. pers. comm.):It is only a matter of time before there is a serious collision between a camel and an aircraft.
At Tjirrkarli two years ago we had to hunt camels off the airstrip before the mail plane could land.
While I was working at Blackstone last year they trampled over the airstrip lights damaging about six of them.
At Warakurna the police were called in to shoot several camels that would not leave the strip.
At Pipalyatjara fencing of the strip was started but the community ran out of money when it was about half finished. The money spent on fencing could be better spent on a more lasting control of camels, such as shooting them.

Desert Knowledge CRC 147Managing the impacts of feral camels in Austral ia: a new way of doing business Ch 7: Evaluat ion of the impacts of feral camels, pp 133–182
At Punmu we have a mail plane twice a week and I have to go out half an hour before the plane is due to check for camels on the airstrip. An attempt had been made to fence the strip but camels knocked the fence down, maybe last year. I have seen fresh tracks and droppings out there; the airstrip is five kilometres from the community. There could be a terrible accident between a camel and a light aircraft and I will be proposing an urgent cull of camels around the strip but it is hard to determine who is responsible there.
Camels have also caused problems on airstrips at Kiwirrkura in the Ngaanyatjarra lands (WA) and Mt Liebig in the NT (Vaarzon-Morel 2008b).
4.2.6 Road crashes
As the feral camel population increases, so does the number of vehicular collisions involving camels. Such collisions impose a high cost on regional economies, including labour loss (workplace, household, and community), repair and replacement costs for vehicles, loss of quality of life, insurance administration, legal fees, long-term care, travel delays, medical fees, and workplace disruption (BTE 2000).
The NT is the only jurisdiction that officially records information on whether road accidents are linked to camels. Information provided by the Department of Planning and Infrastructure of the NT shows that from 2003 to 2006 there were 26 accidents involving hitting horses or camels, injuring nine people (Table 7.3). Assuming that the proportion of camel-related crashes is one-third of these numbers (Grant Williams 2007, Road Safety NT, pers. comm.), it is estimated that there were 2.17 camel-related crashes annually over the period, injuring 0.75 people. In June 2008 two people were killed when their vehicle hit a camel while travelling between Yuendumu and Lajamanu, north-west of Alice Springs.
Table 7.3: Horse/camel-related road accidents in the NT, 2003–2006
Year Total no. of accidents
Total no. of injuries
Total no. of fatalities
Crash no. related to horses/camels
No. of injuries in horse/camel related crashes
No. of fatalities in horse/ camel related crashes
2003 2401 1114 53 8 4 0
2004 2142 1054 35 5 2 0
2005 2151 1009 55 6 2 0
2006 2049 911 44 7 1 0
In 2006, a herd of inquisitive camels delayed freight services into the NT by 24 hours after getting in the way of a 2.3 km-long freight train. The train hit four camels out of a herd of 10, just short of the NT border at Wirrida, SA. The collision damaged the train’s air brakes system and crews had to repair the train before it could continue (NT News 2006). There was no report of the estimated cost of this incident.
There were at least seven collisions between vehicles and camels on the Ngaanyatjarra Lands in WA (Table 7.4) between 2003 and mid-2008, or about 1.4 annually.
Desert Knowledge CRC148 Managing the impacts of feral camels in Austral ia: a new way of doing business Ch 7: Evaluat ion of the impacts of feral camels, pp 133–182
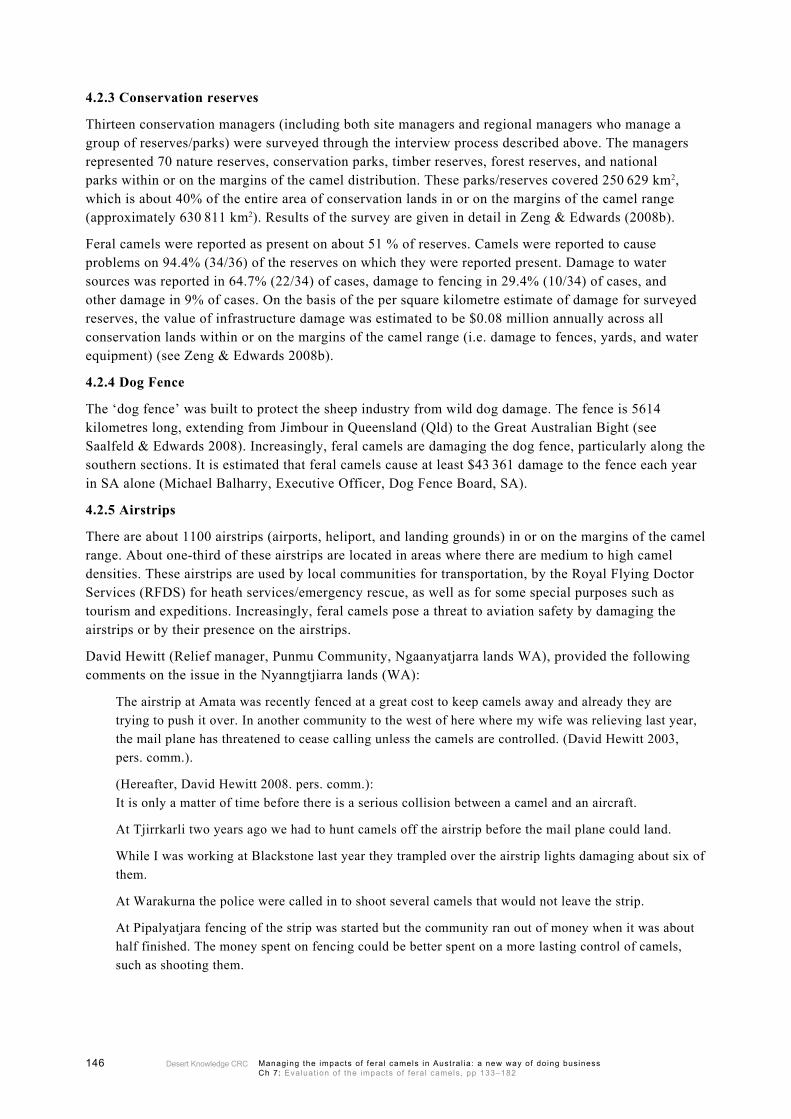
Table 7.4: Vehicle collisions involving camels over the period 2003–2007, Ngaanyatjarra Lands WA
Approx. date Details
2003 An environmental health officer in this region (Warburton area) did over $1000 damage to his vehicle in a collision with a camel recently and an Aboriginal person suffered serious injuries following a collision with a camel last year. Another issue we noticed last week is that the camels are having their dust baths on the roads. An otherwise smooth surface can suddenly be heaps of soft sand – a major hazard for vehicles.
Late 2003 Anthropology consultant hit two camels, 10 km west of Warburton. Both camels dead, vehicle presumably written off.
2004 or 2005 Two camels were hit and killed near Warakurna. Vehicle presumably written off.
2004 or 2005 Wife of Community Development Advisor at Tjirrkarli sideswiped a camel.
2004 The school vehicle (a troop carrier) rolled and one teacher was off work for a year.
2006 Two Ngaanyatjarra Health staff hit a camel and rolled vehicle on the back road to Patjarr. One person was off work for months.
Note: Information provided in 2007 by Andrew Drenen (Central Land Council, formerly land management officer with Ngaanyatjarra Land Council) and David Hewitt (Relief Manager, Punmu Community, Ngaanyatjarra lands WA).
In other states, there is no specific statistical information about camel-related crashes, but animal-related collisions are recorded. According to information from NRMA Insurance (NRMA 2005), there were more than 17 700 vehicle collision claims nationally for animal-related accidents in 2003. Camels were included in the ‘Others’ category for which there were 81 listings in SA, 116 in WA, and 6 in the NT (Table 7.5). The NT ‘Other’ figure of 6 is 2.77 times higher than the estimated annual camel-related accident figure of 2.17 calculated above. This provides a basis for estimating the number of camel-related accidents for SA and WA (i.e. WA, 116/2.77 = 41.9; SA, 81/2.77 = 29.3). However, because the NT data on which this calculation is based are a small sample, and camel density and the number of settlements varies within each jurisdiction, these estimates may be highly inaccurate. On the basis that there are have been 1.4 accidents involving camels per year from 2003–2007 in the Ngaanyatjarra Lands, which comprise about 10% of the area occupied by camels in WA, the WA figure may be closer to 14 accidents per year involving camels. Thus, a rough estimate of the number of vehicle collisions involving camels in Australia each year is 27.7 (10.5 in SA, 14 in WA, 2.2 in the NT).
The average cost of a road crash in SA is $29 303 (in 2004 AUD) (Baldock & McLean 2005). Using this figure, the speculative minimum monetary cost of camel-related road crashes in WA, SA, and NT is currently about $900 000 (in 2008 AUD) annually, assuming an annual inflation rate of 2.5%.
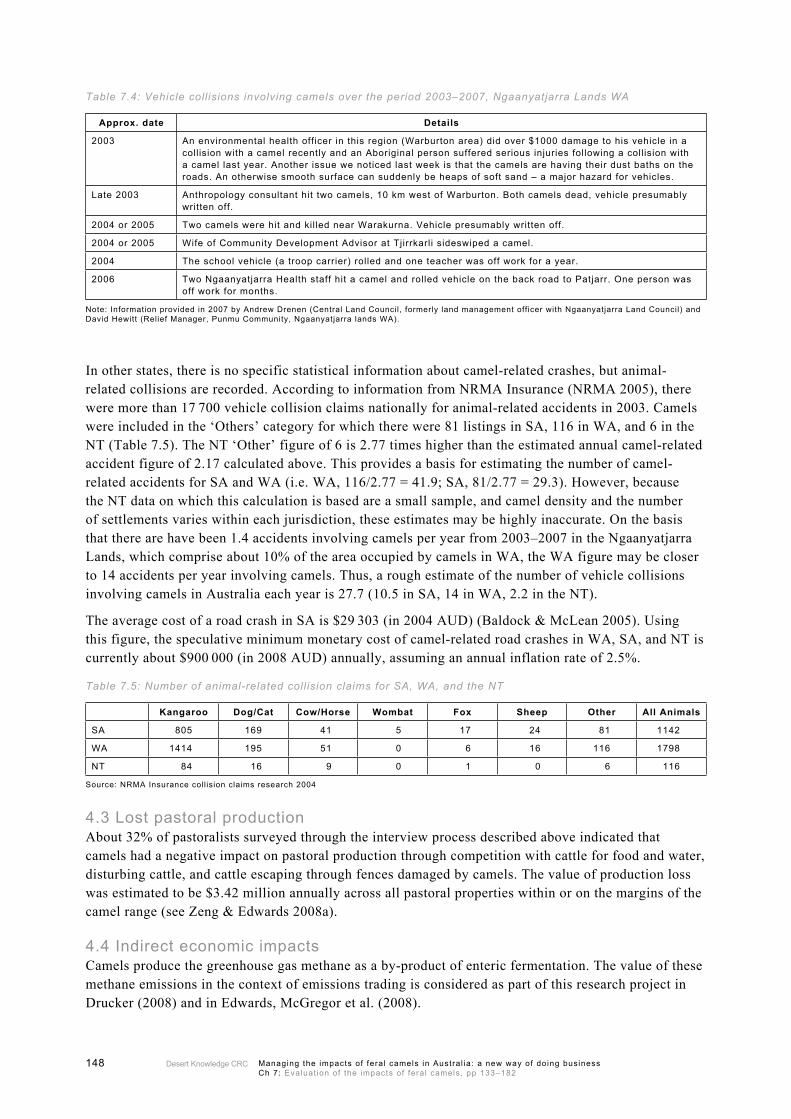
Table 7.5: Number of animal-related collision claims for SA, WA, and the NT
Kangaroo Dog/Cat Cow/Horse Wombat Fox Sheep Other All Animals
SA 805 169 41 5 17 24 81 1142
WA 1414 195 51 0 6 16 116 1798
NT 84 16 9 0 1 0 6 116
Source: NRMA Insurance collision claims research 2004
4.3 Lost pastoral productionAbout 32% of pastoralists surveyed through the interview process described above indicated that camels had a negative impact on pastoral production through competition with cattle for food and water, disturbing cattle, and cattle escaping through fences damaged by camels. The value of production loss was estimated to be $3.42 million annually across all pastoral properties within or on the margins of the camel range (see Zeng & Edwards 2008a).
4.4 Indirect economic impactsCamels produce the greenhouse gas methane as a by-product of enteric fermentation. The value of these methane emissions in the context of emissions trading is considered as part of this research project in Drucker (2008) and in Edwards, McGregor et al. (2008).

Desert Knowledge CRC 149Managing the impacts of feral camels in Austral ia: a new way of doing business Ch 7: Evaluat ion of the impacts of feral camels, pp 133–182
5. Environmental impactsNegative environmental impacts of feral camels include damage to vegetation through feeding behaviour and trampling; suppression of recruitment in some plant species; damage to wetlands through fouling, trampling, and sedimentation; and competition with native animals for food and shelter.
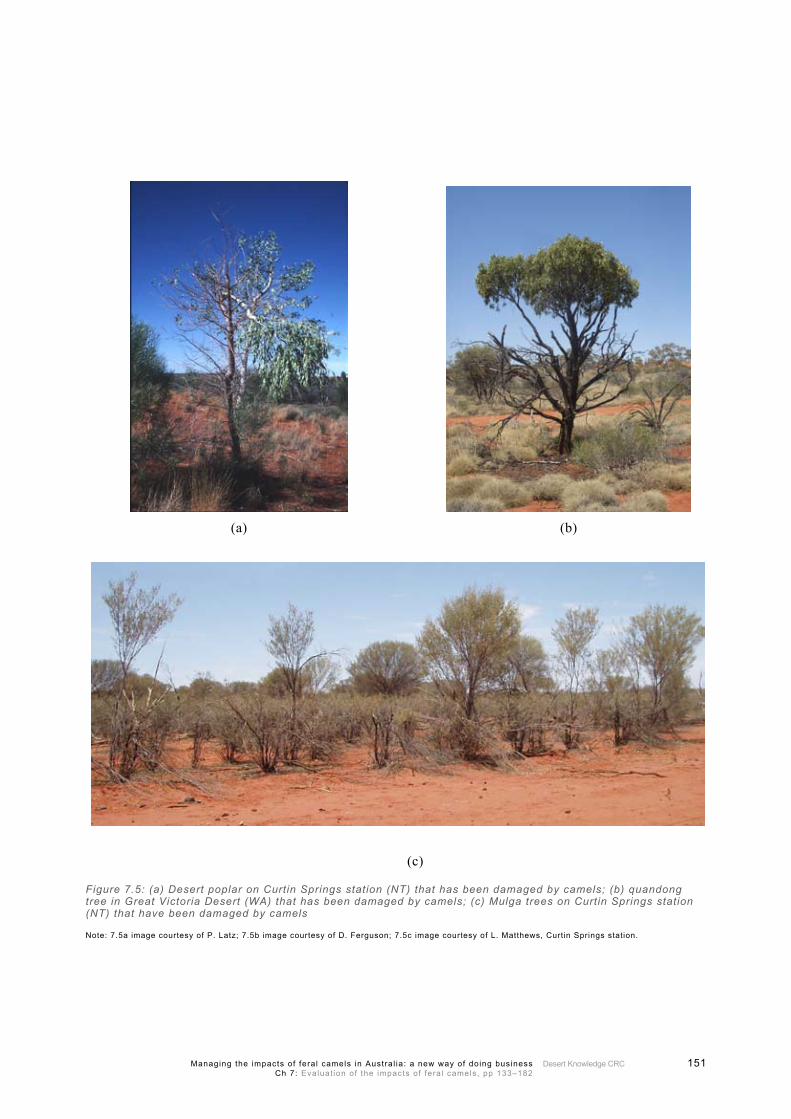
5.1 Damage to vegetation The diet of feral camels is discussed in Saalfeld & Edwards (2008). Camels have a broad diet, and although they are considered to be browsers, they have been observed to feed on most of the available plant species in areas where the diet has been examined, including pasture species (Dörges & Heucke 2003, Peeters et al. 2005). Camels are generally very flexible with food selection, particularly in drought times, but show distinctive preferences for certain plant species. During dry times camels mainly consume leaves from trees, while in wet periods they favour ground vegetation (Dörges & Heucke 2003). Camels damage trees and shrubs when browsing and can severely defoliate preferred trees, shrubs, and vines (Dörges & Heucke 2003; Copley et al. 2003; Vaarzon-Morel 2008b). They also inhibit recruitment of their preferred food species by suppressing flowering and fruit production and by browsing and killing juvenile plants (Dörges & Heucke 2003). It is considered that camels have the ability to cause the local extinction of highly preferred species like the quandong (Santalum acuminatum), plumbush (S. lanceolatum), curly pod wattle (Acacia sessiliceps), native apricot (Pittosporum augustifolium), bean tree (Erythrina vespertilio), and Lawrencia species (Dörges & Heucke 2003). In 2008, Peter Latz (Ecological consultant, Alice Springs, pers. comm.) noted that both quandong and native apricot had declined dramatically in the Petermann Ranges south-west of Alice Springs (see Figure 7.4) compared with the situation in the 1970s (see also Vintner & Collins 2008). Latz attributed this decline to a combination of inappropriate fire regime and camel browsing. Latz also noted severe damage to desert poplar (Codonocarpus cotinifolius) by camels (see also Vintner & Collins 2008). A list of the plant species on which camels are believed to have an impact is in Table 7.6.
In central Australia, serious and widespread negative impacts on vegetation have been recorded where camels occur at densities of >2 animals/km2, though damage to highly palatable species occurs at much lower densities (Dörges & Heucke 2003). In more arid country near Lake Eyre, significant negative impacts on vegetation have been recorded where camels occur at densities of >1 animals/km2 (Phil Gee 2008, Rural Solutions, pers. comm.). Camels already occur at localised densities >2 animals/km2 over much of their current range (Saalfeld & Edwards 2008). Figure 7.5 shows some of the impacts of feral camels on vegetation.

Desert Knowledge CRC150 Managing the impacts of feral camels in Austral ia: a new way of doing business Ch 7: Evaluat ion of the impacts of feral camels, pp 133–182
Table 7.6: Plant species of central Australia considered vulnerable to local extinction or severe impact as a result of camel browsing
Species name Common name Conservation status a
Palatability to camels b
Vulnerability to local extinction/severe depletion from camel
browsing c
Santalum acuminatum Quandong Vulnerable Extremely high Extremely high
Acacia oswaldii Umbrella wattle Data deficient ? Extremely high
Marsdenia australis Bush banana - Very high Extremely high
Marsdenia viridiflora Bush banana - ? Extremely high
Erythrina vespertil io Bean tree - Extremely high Extremely high
Santalum lanceolatum Plumbush - Very high High to Extremely high
Acacia sessiliceps Curly-pod wattle - Extremely high High
Pittosporum angustifolium Native apricot - Very high High
Codonocarpus cotinifolius Desert poplar - Very high High
Brachychiton gregorii Desert kurrajong - High High
Rhyncharrhena linearis Mulga bean - ? High
Canthium latifolium Native currant - High High
Eremophila longifolia Emu bush - Very high High
Ventilago viminalis Supplejack - Very high High
Salsola tragus Buckbush - Very high High
Crotalaria cunninghamii Bird flower - Very high High
Vigna lanceolata Pencil yam - ? Moderate
Atalaya hemiglauca Whitewood - Very high Moderate
Tecticornia verrucosa Mungilpa - High Low to Moderate
Ipomoea costata Bush potato - Very high Low to Moderate
Acacia victoriae Acacia bush - Very high Low
Acacia aneura Mulga - High Low
Solanum spp. Bush potato - Moderate Lowa Territory Parks and Wildlife Conservation Act and Albrecht et al. (2007)
b following Dörges & Heucke (2003)
c Based on Dörges & Heucke (2003) and information provided by Peter Latz, Theresa Nano, and Fiona Walsh in 2007 and 2008
Note: Species are listed by decreasing vulnerability to camel browsing
Desert Knowledge CRC 151Managing the impacts of feral camels in Austral ia: a new way of doing business Ch 7: Evaluat ion of the impacts of feral camels, pp 133–182
(a) (b)
(c)
Figure 7.5: (a) Desert poplar on Curtin Springs station (NT) that has been damaged by camels; (b) quandong tree in Great Victoria Desert (WA) that has been damaged by camels; (c) Mulga trees on Curtin Springs station (NT) that have been damaged by camels
Note: 7.5a image courtesy of P. Latz; 7.5b image courtesy of D. Ferguson; 7.5c image courtesy of L. Matthews, Curtin Springs station.

Desert Knowledge CRC152 Managing the impacts of feral camels in Austral ia: a new way of doing business Ch 7: Evaluat ion of the impacts of feral camels, pp 133–182
5.2 Damage to wetlands There are many different types of arid wetlands: salt lakes; saline swamps; saline channels; freshwater claypans; open freshwater lakes; wooded swamps; shrubby swamps; herbaceous swamps; permanent and long-lasting waterholes and rockholes; springs; ephemeral rivers and waterholes on large ephemeral rivers (see Duguid et al. 2005 for definitions). Although wetlands form a relatively small proportion of the arid landscape they are of high biological importance (Duguid et al. 2005). Wetlands support a diverse and distinctive range of plants and animals, are important for a range of migratory birds, serve as refugia and as source populations for aquatic animals and plants, and serve as refugia for many terrestrial animal species during drought (Duguid et al. 2005; Box et al. 2008). The larger wetlands and wetland aggregations that occur within the current range of the feral camel are shown in Appendix 11.12 in Saalfeld et al. (2008). The need for water coupled with the need to consume salt (Wilson 1984), which occurs naturally in vegetation fringing saline wetlands, means that camels frequent wetland habitats across arid Australia (Dörges & Heucke 2003). In these areas, the negative impacts of feral camels can be significant. Camels can drink all of the water in small waterholes, rockholes, or soaks leaving little or no water for native wildlife or people (Copley et al. 2003; Vaarzon-Morel 2008b; Fiona Walsh 2008, CSIRO, pers. comm.). Camels also fall into rockholes and get bogged in soaks where they subsequently die causing pollution, eutrophication, and infill/siltation (Copley et al. 2003; Vaarzon-Morel 2008b). Figure 7.6 shows some of the impacts of feral camels on wetlands. In the survey conducted with Aboriginal landholders, inhabitants in 23 of the 27 settlements surveyed raised concerns over the impacts of camels on wetlands (Vaarzon-Morel 2008a, 2008b). Case studies 8.2 and 8.3 below provide an account of the impacts of camels on selected wetlands in central Australia. Saalfeld and Zeng (2008) provide an account of some of the activities being undertaken on Aboriginal lands and on pastoral leases in respect of protecting wetlands from the impacts of feral camels.
Figure 7.6: Camels around a dry waterhole near Docker River (NT) in February 2007Note the dead and dying camels in the waterhole (Image courtesy of R. Bugg)

Desert Knowledge CRC 153Managing the impacts of feral camels in Austral ia: a new way of doing business Ch 7: Evaluat ion of the impacts of feral camels, pp 133–182
5.3 Other sites of biological significanceIn addition to wetlands, there are numerous other sites of biological significance within the range of the feral camel. These include sites with threatened fauna and sites of botanical significance (see Saalfeld et al. 2008). The extent of the impacts of feral camels on these sites is unquantified.
6. Social/cultural impactsFeral camels have significant negative impacts on the social/cultural values of Aboriginal people. Camels damage sites, such as waterholes, that have cultural significance to Aboriginal people; they destroy bush tucker resources; reduce people’s enjoyment of natural areas; create dangerous driving conditions; and cause a general nuisance in residential areas. Negative impacts in remote settlements and driving conditions are described in sections 4.2.2, 4.2.5, and 4.2.6 above.
6.1 Damage to Aboriginal culturally significant sitesAboriginal culturally significant sites include sacred sites, burial sites, ceremonial grounds, water places, places of birth, places (including trees) where spirits of deceased people are said to dwell, and resource points (areas with concentrations of food or areas where ochres, flints, particular food types, or other important resources can be obtained) (Petronella Vaarzon-Morel 2008, Consulting anthropologist, pers. comm.). In particular, water places (waterholes, rockholes, soaks, springs, etc.) are special places for desert Aboriginal people and many, but not all, are sacred sites (Yu 2002). The reason for this is obvious. As stated above, wetlands are drought refugia for many types of terrestrial wildlife. Prehistorically, wetlands were also drought refugia for Aboriginal people, providing not only water but also good hunting, even in dry times. Nowadays, wetlands still provide reliable drinking water for Aboriginal people when they are out on country and are used for recreational and ceremonial purposes. Thus, the negative impacts of camels on wetland areas (which are described above and in the case studies below) also have a very important social/cultural dimension. It is worth restating that, in the survey conducted with Aboriginal landholders, inhabitants in 23 of the 27 settlements surveyed raised concerns over the impacts of camels on wetlands (Vaarzon-Morel 2008a, 2008b). It is also worth noting that inhabitants in 19 of the 27 settlements that were surveyed indicated that camels caused damage to culturally significant sites other than water-related sites (Vaarzon-Morel 2008b). The negative impacts of camels on sites that are culturally important because of plant/food resources are described in the next section.
6.2 Damage to plant species of cultural/economic value to Aboriginal peopleMany plant species are of cultural and/or economic value to desert Aboriginal people. At least 35 of the plant species that occur in central Australia and are known to have a contemporary resource value to Aboriginal people are either highly palatable or preferred camel food species and, as such, are vulnerable to damage and decline by camel browsing (Table 7.7). These plants are used by Aboriginal people for a range of purposes including medicinal, ceremonial, artefact production, or as a food resource (Latz 1995). Many species are of great significance due to their dreaming associations, though it is not within the scope of this research to consider the impact of camels on this aspect in any exhaustive manner. In the survey conducted with Aboriginal landholders, inhabitants in 20 of the 27 settlements surveyed indicated that camels caused damage to plants of cultural or economic value (Vaarzon-Morel 2008b).
A small-scale commercial industry in bushfood production based on wild-harvest by Aboriginal people has been in operation in central Australia for several decades. Between 2000 and 2005, about 30 species were traded for food and/or landscape rehabilitation (Walsh & Douglas in review). Harvesters sold an average of 7.5 tonnes of seed and fruit products each year from 2000–2004 with a wholesale value of about $90 000 per annum. The main species traded were bush tomato (Solanum centrale fruit), mulga (Acacia aneura seed) and dogwood (Acacia coriacea ssp. sericophylla seed) (Walsh and Douglas in
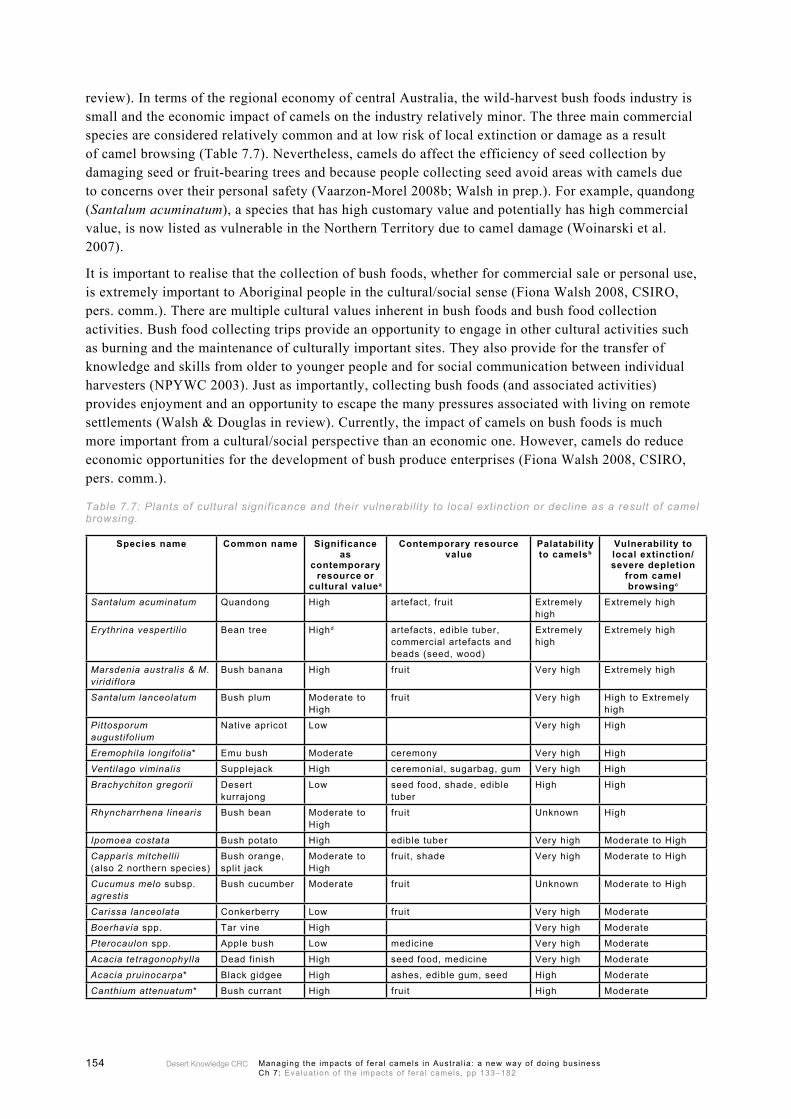
Desert Knowledge CRC154 Managing the impacts of feral camels in Austral ia: a new way of doing business Ch 7: Evaluat ion of the impacts of feral camels, pp 133–182
review). In terms of the regional economy of central Australia, the wild-harvest bush foods industry is small and the economic impact of camels on the industry relatively minor. The three main commercial species are considered relatively common and at low risk of local extinction or damage as a result of camel browsing (Table 7.7). Nevertheless, camels do affect the efficiency of seed collection by damaging seed or fruit-bearing trees and because people collecting seed avoid areas with camels due to concerns over their personal safety (Vaarzon-Morel 2008b; Walsh in prep.). For example, quandong (Santalum acuminatum), a species that has high customary value and potentially has high commercial value, is now listed as vulnerable in the Northern Territory due to camel damage (Woinarski et al. 2007).
It is important to realise that the collection of bush foods, whether for commercial sale or personal use, is extremely important to Aboriginal people in the cultural/social sense (Fiona Walsh 2008, CSIRO, pers. comm.). There are multiple cultural values inherent in bush foods and bush food collection activities. Bush food collecting trips provide an opportunity to engage in other cultural activities such as burning and the maintenance of culturally important sites. They also provide for the transfer of knowledge and skills from older to younger people and for social communication between individual harvesters (NPYWC 2003). Just as importantly, collecting bush foods (and associated activities) provides enjoyment and an opportunity to escape the many pressures associated with living on remote settlements (Walsh & Douglas in review). Currently, the impact of camels on bush foods is much more important from a cultural/social perspective than an economic one. However, camels do reduce economic opportunities for the development of bush produce enterprises (Fiona Walsh 2008, CSIRO, pers. comm.).
Table 7.7: Plants of cultural significance and their vulnerability to local extinction or decline as a result of camel browsing.
Species name Common name Significance as
contemporary resource or
cultural valuea
Contemporary resource value
Palatability to camelsb
Vulnerability to local extinction/ severe depletion
from camel browsingc
Santalum acuminatum Quandong High artefact, fruit Extremely high
Extremely high
Erythrina vespertil io Bean tree Highd artefacts, edible tuber, commercial artefacts and beads (seed, wood)
Extremely high
Extremely high
Marsdenia australis & M. viridiflora
Bush banana High fruit Very high Extremely high
Santalum lanceolatum Bush plum Moderate to High
fruit Very high High to Extremely high
Pittosporum augustifolium
Native apricot Low Very high High
Eremophila longifolia* Emu bush Moderate ceremony Very high High
Ventilago viminalis Supplejack High ceremonial, sugarbag, gum Very high High
Brachychiton gregorii Desert kurrajong
Low seed food, shade, edible tuber
High High
Rhyncharrhena linearis Bush bean Moderate to High
fruit Unknown High
Ipomoea costata Bush potato High edible tuber Very high Moderate to High
Capparis mitchelli i (also 2 northern species)
Bush orange, split jack
Moderate to High
fruit, shade Very high Moderate to High
Cucumus melo subsp. agrestis
Bush cucumber Moderate fruit Unknown Moderate to High
Carissa lanceolata Conkerberry Low fruit Very high Moderate
Boerhavia spp. Tar vine High Very high Moderate
Pterocaulon spp. Apple bush Low medicine Very high Moderate
Acacia tetragonophylla Dead finish High seed food, medicine Very high Moderate
Acacia pruinocarpa* Black gidgee High ashes, edible gum, seed High Moderate
Canthium attenuatum* Bush currant High fruit High Moderate

Desert Knowledge CRC 155Managing the impacts of feral camels in Austral ia: a new way of doing business Ch 7: Evaluat ion of the impacts of feral camels, pp 133–182
Species name Common name Significance as
contemporary resource or
cultural valuea
Contemporary resource value
Palatability to camelsb
Vulnerability to local extinction/ severe depletion
from camel browsingc
Vigna lanceolata Pencil yam Moderate to High
edible tuber Unknown Moderate
Owenia reticulata Desert walnut Moderate kernel, gum, shade Unknown Moderate
Grevillea juncifolia Desert grevillea High honey Very high Low to Moderate
Grevillea eriostachya Honey grevillea High honey High Low to Moderate
Tecticornia verrucosa Samphire Low seed Unknown Low to Moderate
Acacia victoriae Victoria wattle Highd commercial seed Very high Low
Capparis spinosa subsp. nummularia
Bush passionfruit
Moderate to High
fruit Very high Low
Acacia aneura (especially sub-species other than tenius)
Mulga Highd firewood, shade, artefact timber, honey, honey ant, ashes, red kangaroo habitat, commercial artefact production, commercial seed
High Low
Acacia kempeana Witchetty bush High edible grub High Low
Acacia coriacea Dogwood Highd green seed food, dry seed commercial
Moderate Low
Corymbia opaca Bloodwood Highd artefacts, sugarbag, bush coconut, commercial artefacts and beads
Moderate Low
Solanum centrale Bush tomato Highd Fruit food, commercial fruit Moderate Low
Solanum ellipticum Bush tomato Moderate fruit Moderate Low
Solanum chippendalei Bush tomato High fruit Unknown Low
Stylobasium spathulatum Lowd commercial artefacts (seed) Unknown Low
Acacia murrayana Highd commercial seed Unknown Unknown
Acacia colei Highd seed food - commercial seed
Unknown Unknown
aContemporary significance of species varies regionally and further consultations are required with Aboriginal people to gain a better understanding of each species local importancebFollowing Dörges & Heucke (2003)
cBased on Dörges & Heucke (2003) and information provided by Peter Latz, Theresa Nano, and Fiona Walsh in 2007 and 2008
dSpecies is of commercial importance
* Camels and/or fire prevent plants from reaching maturity or full potential and may render them worthless as resource species
Note: Species are listed by decreasing vulnerability to camel browsing.
6.3 Safety concernsIn the survey conducted with Aboriginal landholders, inhabitants in 17 of the 27 settlements surveyed expressed concerns over the dangers that camels posed both on and off the road (Vaarzon-Morel 2008b). Camel-related road accidents are discussed in 4.2.6 above. Concerns over camels are affecting the way that people use country (Vaarzon-Morel 2008b). For example, many people claimed that they no longer camped out in areas with lots of camels and would not leave children unattended in such areas (Vaarzon-Morel 2008b). This may restrict the transmission of cultural knowledge and practices concerning country to future generations (Vaarzon-Morel 2008b).
7. Disease riskIn general, camels in Australia suffer little disease. Skin disease, including sarcoptic mange, is the most prevalent cause of camel morbidity (Brown 2004) in Australia. Camel pox, another skin disease that causes considerable morbidity and fatalities in camels in overseas countries (Koenig 2007) is not present in Australia. In 1999, a review of Australia’s preparedness for exotic disease outbreaks focusing on feral herbivores concluded that camels were unlikely to be involved in exotic disease outbreaks (Henzell et al. 1999). This conclusion was underpinned by a camel population estimate of 170 000 (based on that of Short et al. 1988 with an estimated correction factor of 4) (Robert Henzell 2008, SA Animal and Plant Control Group, pers. comm.). This centred on the assumptions that camels were sparsely distributed in
Desert Knowledge CRC156 Managing the impacts of feral camels in Austral ia: a new way of doing business Ch 7: Evaluat ion of the impacts of feral camels, pp 133–182
the arid zone, mainly inhabited remote areas, had little contact with other species (especially stock), and only infrequently visited water points (Henzell et al. 1999). The situation is now quite different: the current camel population is estimated to be at least seven times higher than the estimate used for the Henzell et al. (1999) review (Saalfeld & Edwards 2008); camels are increasingly moving out of remote areas and coming into regular contact with cattle and other feral animals (Zeng & Edwards 2008a); and camels now regularly visit water points across their range (section 5.2), including stock waters on pastoral leases (Zeng & Edwards 2008a). While it is arguably still the case that the likelihood of an exotic disease being introduced into an area occupied by camels is still lower than for many other parts of Australia, there is now an increased likelihood that camels would be epidemiologically involved in the spread of diseases like bluetongue, Rinderpest, Rift valley fever, surra (trypanosomosis), and bovine tuberculosis were there to be outbreaks of these diseases in Australia (Brown 2004; Robert Henzell 2008, SA Animal and Plant Control Group, pers. comm.). Whether camels would be epidemiologically involved in the spread of foot-and-mouth disease is still open to debate (Manefield & Tinson 1996, Wernery & Kaaden 2004).
8. Case studies
8.1 Incursion of camels onto remote Aboriginal settlements and pastoral properties in January–March 2007 in the vicinity of the ‘western deserts’Most of central Australia experienced below average rainfall over the period 2002–2006 and at the start of 2007 conditions were very dry in most parts of the region. In December 2006 there were reports of camels moving into remote Aboriginal settlements (Warakurna) in WA in search of water. In mid-January 2007, a narrow band of rain that extended through Alice Springs and into SA (flooding Hawker and Coober Pedy), exacerbated the situation. While pastoral properties to the immediate south of Alice Springs received some rain at that time, the Great Sandy, Great Victoria, and southern Tanami Deserts (i.e. the western deserts – see Figure 7.7) received no rain and remained very dry. Camels responded by moving eastwards out of the dry deserts, apparently following the rain. There was an influx of many, perhaps tens of thousands, of apparently starving and thirsty camels onto pastoral leases to the south of Alice Springs and onto Aboriginal settlements in the APY lands in SA, the Ngaanyatjarra lands in WA, and in the Petermann Ranges in the NT (Figure 7.4).
Several pastoral properties in the NT (including Mulga Park and Curtin Springs) experienced considerable damage to infrastructure and the depletion of scant stock water reserves as a result of the camel influx. There was also intense competition between cattle and camels for what little forage remained. Pastoralists responded by ground shooting camels and by engaging the services of a pet meating contractor. Mulga Park and Curtin Springs stations shot to waste approximately 4500 camels (using ground-based shooters) during the 2006–2007 summer and the months that followed.

Desert Knowledge CRC 157Managing the impacts of feral camels in Austral ia: a new way of doing business Ch 7: Evaluat ion of the impacts of feral camels, pp 133–182
Figure 7.7. Map showing the deserts of Australia’s rangelands
Figure 7.8: (above) Camels on Mulga Park station (NT), February 2007; (right) Camel within Warakurna settlement (WA), February 2007Source: 7.8 (above) image courtesy Mulga Part Station; 7.8 (right) image courtesy L. Matthews, Curtin Springs Station
On the Aboriginal lands, hundreds of dead camels were found in waterholes south of the Petermann Ranges, often near settlements, and near Docker River in the NT (Figure 7.4). On 28 February 2007, Brian Watts (Chief Executive Officer at Docker River in the southwest corner of the NT) advised ‘the community has major problems with the camels. Each morning there are between 500–600 camels roaming through the community in search of water. Each night we turn on three fire hydrants for several hours to provide some water. Each day I drag one or two dead camels from the community’. The

Desert Knowledge CRC158 Managing the impacts of feral camels in Austral ia: a new way of doing business Ch 7: Evaluat ion of the impacts of feral camels, pp 133–182
Centralian Advocate newspaper in Alice Springs reported thousands of camels were dying of thirst at Docker River at this time. Camels in Docker River caused severe damage to water-related infrastructure including taps, water tanks, toilets, and evaporative air conditioners.
The situation was no different in SA where mobs of up to 500 feral camels moved into settlements in the western APY lands and caused considerable damage and fouling to water supplies and infrastructure (Mark Williams 2008, Senior Technical Adviser, Department of Water, Land and Biodiversity Conservation, SA, pers. comm.). In March 2007 near Amata in South Australia, 46 dead camels were pulled from one rockhole alone (David Hewitt 2007, Relief Manager, Punmu Community, Ngaanyatjarra lands WA, pers. comm.).
In Warakurna, one of 12 settlements of the Ngaanyatjarra lands about 800 km west of Alice Springs, the estimated economic loss caused by camels over the 2006–07 summer was in the order of $100 000 due to damage to fences, air conditioners, houses, water tanks, wind mills, and cleanup activities (Chris Moon 2007, former Community Development Advisor, Warakurna, pers. comm.).
The Western Desert camel problem dissipated in the third week of March 2008 following widespread rainfall. Most of the camels rapidly returned to the more remote desert country within a few days, although some remained on fringing pastoral properties in higher than expected numbers.
During the summer 2006–07 camel incident there were significant issues in respect to human health and safety and concerns over the welfare of the camels. In the NT, the Central Land Council (CLC) held a series of emergency consultations with traditional owners at Docker River on how to best tackle the immediate camel crisis for the community, while discussions continued with the Indigenous Land Corporation regarding support for addressing the growing problem in the broader south-west region of the NT. After initial strong resistance from traditional owners to a culling proposal, an agreement was eventually reached to undertake an aerial cull of all camels within a 50 km radius of the community using the limited financial resources available to the CLC and assisted by Parks and Wildlife NT. However, the cull did not occur due to the rapid and complete dispersal of camels from the Docker River area following significant rainfall in the west virtually on the eve of Parks and Wildlife deploying a helicopter to carry out the shoot (David Alexander 2007, CLC, pers. comm.). In SA, the Department of Water, Land and Biodiversity Conservation held two meetings with key stakeholders (March 6 and 14, 2007) to scope the camel problem and discuss emergency management options. The APY Executive did not support a proposal to aerially cull the camels on affected settlements and expressed the view that without integrated cross-jurisdictional management, strategic planning, and adequately funded control there would be ongoing increases in the population and corresponding impacts at a landscape scale (Mark Williams 2008, Senior Technical Adviser, Department of Water, Land and Biodiversity Conservation, SA, pers. comm.). The APY Land Management Group responded to the immediate problem by moving camels away from settlements using helicopter mustering and turning on some bores outside of settlements to provide water for the thirsty animals. The APY Land Management Group is currently exploring a range of commercial utilisation opportunities for camel meat to provide a long-term solution to the camel problem in the APY lands.
In summary, there were significant economic and social impacts from the invasion of Aboriginal settlements and pastoral leases by camels from the western deserts over the summer of 2006–07. There were also major issues in regards to animal welfare. There was neither a pre-existing plan outlining how to respond to this type of situation, nor a reserved pool of money to immediately fund appropriate management intervention. Any aerial culling operation to manage the immediate camel problem would have been expensive – it is possible that as many as 10 000 camels would have to have been removed in order to mitigate impacts and resolve animal welfare issues. The cost of aerial culling varies with the density of the target species over a range of $20–100 per animal (see Saalfeld & Zeng 2008). Assuming that aerial culling costs would have been at the lower end of this range because the camels were aggregated, it would have cost a minimum of $200 000 to remove 10 000 camels from affected areas if
Desert Knowledge CRC 159Managing the impacts of feral camels in Austral ia: a new way of doing business Ch 7: Evaluat ion of the impacts of feral camels, pp 133–182
that were the required level of management. Management actions at this scale are relatively ineffective in dealing with the overall camel problem. Without integrated cross-jurisdictional management, strategic planning, and adequately funded control, there will be ongoing increases in the population (Saalfeld & Edwards 2008) and corresponding impacts at a landscape scale. Although there is resistance to the culling of camels to waste on Aboriginal lands (Vaarzon-Morel 2008a, 2008b), support for culling programs may be forthcoming if the need is major and pressing as occurred at Docker River in 2007.
8.2 General observations of camel impacts on waterholes across central AustraliaAppendix 7.1 contains (1) a synthesis of the negative impacts of camels on waterholes, based on observations made across central Australia; and (2) a preliminary assessment of the negative impacts of camels on sites in Uluru–Kata Tjuta National Park (UKTNP) and the Petermann and Katiti Land Trusts.
8.3 Detailed assessment of camel impacts on a culturally important site in central AustraliaAppendix 7.2 contains a detailed assessment of camel use of and negative impacts on a permanent spring located near UKTNP.
9. Positive impacts of feral camelsFeral camels can have both positive economic and environmental impacts. Landholders can derive economic benefit from feral camels by using them for food (Zeng & Edwards 2008a, 2008b; Vaarzon-Morel 2008a) or by selling them for uses which include pet meat and meat for human consumption (Zeng & Edwards 2008a, 2008b; Vaarzon-Morel 2008a). Economic benefit from the sale of camels by landholders accrues along the supply chain as transporters, wholesalers, agents, meat processors, and meat marketers handle the product.
9.1 Benefits to landholdersIn the survey conducted with pastoral landholders (Zeng & Edwards 2008a), 10 of 209 respondents (4.8%) derived some income from selling camels, 32 (15.3%) reported eating camels, and two (1.0%) reported deriving some other economic benefit from camels (e.g. some pastoralists in Qld are using feral camels for woody weed control). The value of the benefit that pastoralists realised from feral camels was estimated to be about $0.59 million annually across all pastoral properties within or on the margins of the camel range (Zeng & Edwards 2008a).
In the survey conducted with conservation landholders (Zeng & Edwards 2008b), three out of 70 reserves derived some income from selling camels, while three reported eating camels. The value of the benefit that conservation landholders realised from feral camels was estimated to be about $0.03 million annually across all conservation properties within or on the margins of the camel range (Zeng & Edwards 2008b).
In the survey conducted with Aboriginal landholders (Vaarzon-Morel 2008a, 2008b), inhabitants in nine of the 27 settlements surveyed indicated that they had at some stage derived economic benefit from mustering and selling camels; inhabitants in nine settlements indicated that they killed and ate camels; while inhabitants in 13 settlements indicated that they derived other benefits from camels, mainly from keeping young camels as pets (Vaarzon-Morel 2008b). People in most settlements expressed the view that feral camels should be used to provide benefits to local people including income and jobs (Vaarzon-Morel 2008b).
9.2 Benefits to those involved in the meat and pet meat industriesThe use of camels for pet meat and meat for human consumption is discussed in Zeng & McGregor (2008).
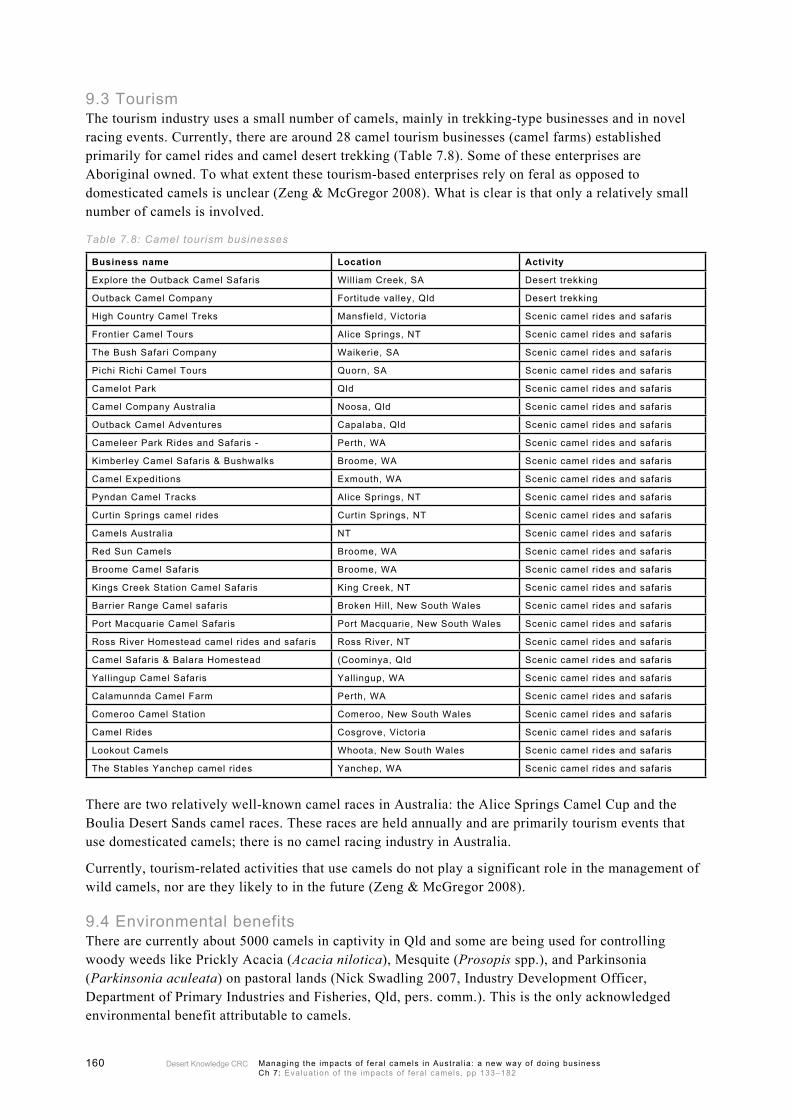
Desert Knowledge CRC160 Managing the impacts of feral camels in Austral ia: a new way of doing business Ch 7: Evaluat ion of the impacts of feral camels, pp 133–182
9.3 TourismThe tourism industry uses a small number of camels, mainly in trekking-type businesses and in novel racing events. Currently, there are around 28 camel tourism businesses (camel farms) established primarily for camel rides and camel desert trekking (Table 7.8). Some of these enterprises are Aboriginal owned. To what extent these tourism-based enterprises rely on feral as opposed to domesticated camels is unclear (Zeng & McGregor 2008). What is clear is that only a relatively small number of camels is involved.
Table 7.8: Camel tourism businesses
Business name Location Activity
Explore the Outback Camel Safaris Will iam Creek, SA Desert trekking
Outback Camel Company Fortitude valley, Qld Desert trekking
High Country Camel Treks Mansfield, Victoria Scenic camel rides and safaris
Frontier Camel Tours Alice Springs, NT Scenic camel rides and safaris
The Bush Safari Company Waikerie, SA Scenic camel rides and safaris
Pichi Richi Camel Tours Quorn, SA Scenic camel rides and safaris
Camelot Park Qld Scenic camel rides and safaris
Camel Company Australia Noosa, Qld Scenic camel rides and safaris
Outback Camel Adventures Capalaba, Qld Scenic camel rides and safaris
Cameleer Park Rides and Safaris - Perth, WA Scenic camel rides and safaris
Kimberley Camel Safaris & Bushwalks Broome, WA Scenic camel rides and safaris
Camel Expeditions Exmouth, WA Scenic camel rides and safaris
Pyndan Camel Tracks Alice Springs, NT Scenic camel rides and safaris
Curtin Springs camel rides Curtin Springs, NT Scenic camel rides and safaris
Camels Australia NT Scenic camel rides and safaris
Red Sun Camels Broome, WA Scenic camel rides and safaris
Broome Camel Safaris Broome, WA Scenic camel rides and safaris
Kings Creek Station Camel Safaris King Creek, NT Scenic camel rides and safaris
Barrier Range Camel safaris Broken Hill, New South Wales Scenic camel rides and safaris
Port Macquarie Camel Safaris Port Macquarie, New South Wales Scenic camel rides and safaris
Ross River Homestead camel rides and safaris Ross River, NT Scenic camel rides and safaris
Camel Safaris & Balara Homestead (Coominya, Qld Scenic camel rides and safaris
Yallingup Camel Safaris Yallingup, WA Scenic camel rides and safaris
Calamunnda Camel Farm Perth, WA Scenic camel rides and safaris
Comeroo Camel Station Comeroo, New South Wales Scenic camel rides and safaris
Camel Rides Cosgrove, Victoria Scenic camel rides and safaris
Lookout Camels Whoota, New South Wales Scenic camel rides and safaris
The Stables Yanchep camel rides Yanchep, WA Scenic camel rides and safaris
There are two relatively well-known camel races in Australia: the Alice Springs Camel Cup and the Boulia Desert Sands camel races. These races are held annually and are primarily tourism events that use domesticated camels; there is no camel racing industry in Australia.
Currently, tourism-related activities that use camels do not play a significant role in the management of wild camels, nor are they likely to in the future (Zeng & McGregor 2008).
9.4 Environmental benefits There are currently about 5000 camels in captivity in Qld and some are being used for controlling woody weeds like Prickly Acacia (Acacia nilotica), Mesquite (Prosopis spp.), and Parkinsonia (Parkinsonia aculeata) on pastoral lands (Nick Swadling 2007, Industry Development Officer, Department of Primary Industries and Fisheries, Qld, pers. comm.). This is the only acknowledged environmental benefit attributable to camels.
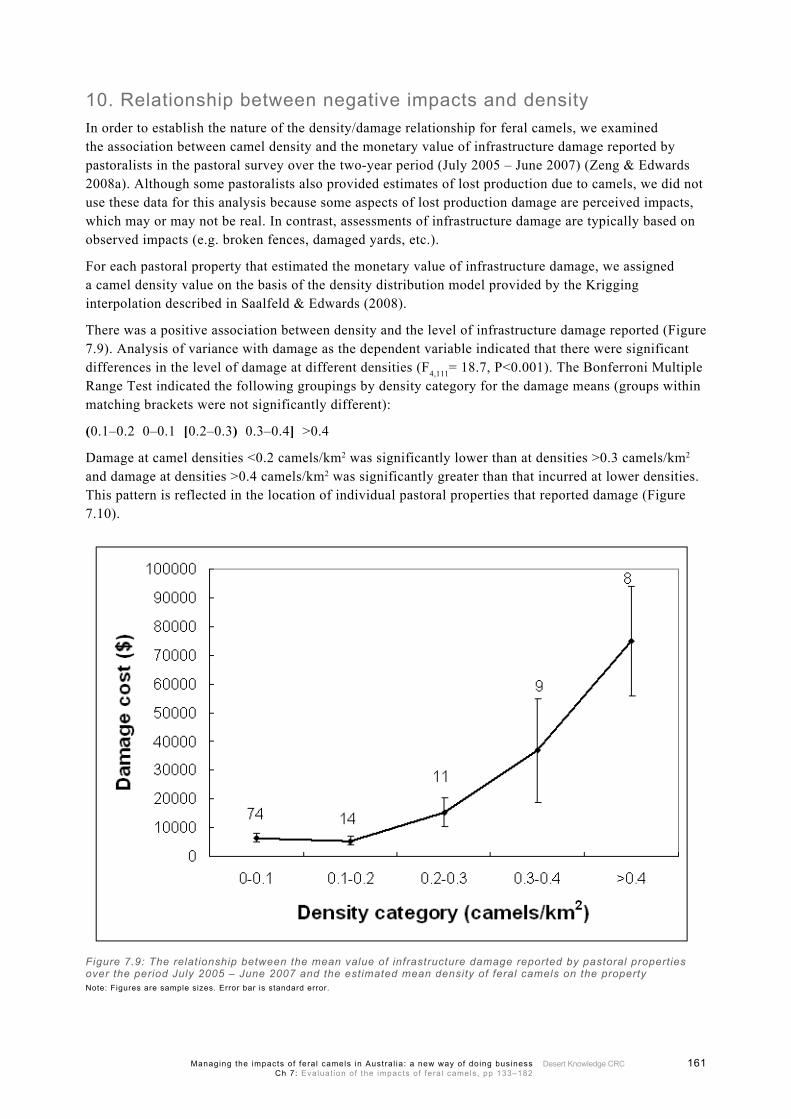
Desert Knowledge CRC 161Managing the impacts of feral camels in Austral ia: a new way of doing business Ch 7: Evaluat ion of the impacts of feral camels, pp 133–182
10. Relationship between negative impacts and densityIn order to establish the nature of the density/damage relationship for feral camels, we examined the association between camel density and the monetary value of infrastructure damage reported by pastoralists in the pastoral survey over the two-year period (July 2005 – June 2007) (Zeng & Edwards 2008a). Although some pastoralists also provided estimates of lost production due to camels, we did not use these data for this analysis because some aspects of lost production damage are perceived impacts, which may or may not be real. In contrast, assessments of infrastructure damage are typically based on observed impacts (e.g. broken fences, damaged yards, etc.).
For each pastoral property that estimated the monetary value of infrastructure damage, we assigned a camel density value on the basis of the density distribution model provided by the Krigging interpolation described in Saalfeld & Edwards (2008).
There was a positive association between density and the level of infrastructure damage reported (Figure 7.9). Analysis of variance with damage as the dependent variable indicated that there were significant differences in the level of damage at different densities (F4,111= 18.7, P<0.001). The Bonferroni Multiple Range Test indicated the following groupings by density category for the damage means (groups within matching brackets were not significantly different):
(0.1–0.2 0–0.1 [0.2–0.3) 0.3–0.4] >0.4
Damage at camel densities <0.2 camels/km2 was significantly lower than at densities >0.3 camels/km2 and damage at densities >0.4 camels/km2 was significantly greater than that incurred at lower densities. This pattern is reflected in the location of individual pastoral properties that reported damage (Figure 7.10).
Figure 7.9: The relationship between the mean value of infrastructure damage reported by pastoral properties over the period July 2005 – June 2007 and the estimated mean density of feral camels on the propertyNote: Figures are sample sizes. Error bar is standard error.

Desert Knowledge CRC162 Managing the impacts of feral camels in Austral ia: a new way of doing business Ch 7: Evaluat ion of the impacts of feral camels, pp 133–182
Figure 7.10: Map showing the level of damage reported by individual pastoral properties in relation to camel density contours
11. DiscussionTable 7.9 provides a summary of the monetary value of the economic impacts of feral camels described in this study. The negative economic impacts arise from direct damage by camels to infrastructure, property and people and losses in production, and costs associated with management-related activities. The positive economic impacts of feral camels with respect to landholders arise from the consumption and sale of camels. In Table 7.9 we have not attempted to capture the economic benefits of commercially utilised feral camels that accrue to those further up the supply chain. On the basis of this approach, the negative economic impacts outweigh the positive economic impacts by a factor of about 18. The net economic impact is -$10.67 million annually. We were unable to obtain reliable estimates of the economic value of damage to remote airstrips or of camels mustered and sold by Aboriginal people.
Although we were unable to estimate the monetary value of the environmental and social/cultural impacts of feral camels, such impacts are significant. Of particular concern is damage to, or associated with, wetlands which are both biologically and culturally/socially important. Camels not only damage the ecology and hydrology of wetlands, they can remove free-standing water and even destroy the ability of some wetland types to hold water. As a result, the ability of wetlands to act as refugia for many types of aquatic and terrestrial wildlife, particularly during droughts, is being undermined. Many Aboriginal people raised this as an issue during the survey of Aboriginal communities, particularly in relation to highly prized kuka (bush meat) species including red kangaroos (Macropus rufus), emus (Dromaius novaehollandiae), and bustards (Ardeotis australis). Aboriginal people saw these species as being deprived of grass and water by camels, and being scared away, and therefore declining in abundance (Vaarzon-Morel 2008b).

Desert Knowledge CRC 163Managing the impacts of feral camels in Austral ia: a new way of doing business Ch 7: Evaluat ion of the impacts of feral camels, pp 133–182
Table 7.9: The annualised monetary value of the economic impacts of feral camels
Cost/benefit component Cost ($ million)
Benefit ($ million)
Net cost/benefit ($ million)
Economic impacts
1) Direct control and management costs
Govt. in-kind management cost -0.30 -0.30
Govt. management/research costa -0.75 -0.75
Pastoralist management cost -1.21 -1.21
Conservation land management cost -0.10 -0.10
2) Damage to infrastructure/property/people
Pastoral stations -2.40 -2.40
Aboriginal settlements -2.09 -2.09
Conservation reserves -0.08 -0.08
Dog fence -0.04 -0.04
Airstrips NQ
Road crashes -0.90 -0.90
3) Production loss
Pastoral stations -3.42 -3.42
3) Landholder benefit
Selling, eating, other uses (pastoral) 0.59 0.59
Selling, eating, other uses (Aboriginal) NQ
Selling, eating, other uses (conservation) 0.03 0.03
Total -11.29 0.62 -10.67aIncludes non-government conservation lands
Note: The positive economic impacts are those for landholders, not those that accrue along the commercial supply chain. Note that the monetary value of camels mustered and sold by Aboriginal people and of damage by camels to airstrips were not quantified (NQ) in this study.
The climate change forecast for arid Australia out to 2030 is for a temperature increase of 1–1.2oC, higher frequency of hot days, a decline in rainfall of between 2–5%, higher evaporation rates, and higher frequency of droughts (CSIRO 2007). Under this scenario, even if camel populations remain static, the negative impacts of camels are likely to be exacerbated. Water will be a scarcer resource and camels will put more pressure on water resources on pastoral leases, in remote settlements, and in wetlands. As droughts increase in frequency so too will the frequency of camels moving en masse onto pastoral leases and into remote settlements in search of water as described in Case Study 8.1. Wetlands will become increasingly important as refugia in arid Australia as the frequency of droughts increases, and this will magnify the effects of feral camels on environmental values. The exotic disease risk associated with feral camels is also likely to increase if camels are brought into closer contact with stock as they seek out scarcer water resources.
The positive density/damage relationship established for camels and infrastructure on pastoral properties is likely to hold true for environmental variables and cultural/social variables as well. Therefore, irrespective of climate change, the magnitude of the negative impacts of feral camels will undoubtedly increase if the population is allowed to continue to increase. Furthermore, the likelihood that camels would be epidemiologically involved in the spread of exotic diseases (were there to be outbreaks of these diseases in Australia) is also very likely to increase with population density.
The positive density/damage relationship established for camels and infrastructure on pastoral properties indicates that the degree of damage increases significantly when camel densities exceed 0.3 camels/km2. This suggests that there are real gains to be made in maintaining camel densities on pastoral leases at <0.3 camels/km2. Figure 7.9 shows that the amount of damage tends to flatten out at densities between 0.1–0.2 camels/km2, at levels of about $5000–6000 over two years. For most pastoralists, this may be a tolerable level of damage. According to Dörges and Heucke (2003), the long-term survival of environmentally and culturally important tree species like quandong, curly pod wattle, and bean tree

Desert Knowledge CRC164 Managing the impacts of feral camels in Austral ia: a new way of doing business Ch 7: Evaluat ion of the impacts of feral camels, pp 133–182
is compromised even at ‘low’ densities of camels. While Dörges and Heucke (2003) did not provide a definition for ‘low’ density of camels, they did recommend that, in order to protect the vegetation resource in managed situations, densities of camels during dry times should not exceed 0.5 camels/km2 in woodland/shrubland habitats and 0.3 camels/km2 in sandplain/sand dune habitats. Even in such situations, Dörges and Heucke (2003) recommended fencing off stands of highly preferred species in order to protect them. Thus it would seem that, in order to safeguard the survival of quandongs, curly pod wattles, and bean trees, camel densities need to be kept at or <0.3 camels/km2. There is an obvious need to clarify this threshold for these and other highly palatable species. On the basis of our current understanding, we recommend that feral camels be managed to a long-term target density of 0.1–0.2 camels/km2 at property to regional scales (areas in the order of 10 000–100 000 km2) in order to mitigate broadscale negative impacts on infrastructure on pastoral stations and in remote settlements, and plant species which are highly susceptible to camel browsing.
11.1 RecommendationsThe management of feral camels should focus on mitigation of negative impacts, not reduction in the number of camels per se. However, as there is a positive relationship between camel density and degree of damage, reducing camel density will often be fundamental to achieving damage mitigation.That on the basis of our current understanding, feral camels be managed to a long-term target density of 0.1–0.2 camels/km2 at property to regional scales (areas in the order of 10 000–100 000 km2) in order to mitigate broadscale negative impacts on infrastructure on pastoral stations and in remote settlements, and on plant species that are highly susceptible to camel browsing.There is a need to quantify the density/damage relationship for feral camels for response variables (particularly environmental variables) for which the relationship is not known across a range of environments and with particular emphasis on identifying the threshold density below which impacts are negligible.
•
•
•
Desert Knowledge CRC 165Managing the impacts of feral camels in Austral ia: a new way of doing business Ch 7: Evaluat ion of the impacts of feral camels, pp 133–182
12. ReferencesAlbrecht DE, Duguid AW, Coulson H, Harris MG and Latz PK. 2007. Vascular plant checklist for the
southern bioregions of the Northern Territory, 2nd edn, Northern Territory Government.Australian Pest Animal Strategy – a national strategy for the management of vertebrate pest animals in
Australia. 2007. Natural Resources Ministerial Council, Canberra.Baldock M and McLean A. 2005. The economic cost and impact of the road toll on South Australia.
Centre for Automotive Safety Research, The University of Adelaide, South Australia.Barker P and Brim Box J. 2008. Central Australia Wetlands Monitoring Framework Parts I and II: water
quality and aquatic fauna sampling, Prepared for the Central Australian Water for Life Project. Greening Australia, NT.
Bayly IAE. 1999. Review of how indigenous people managed for water in desert regions of Australia. Journal of the Royal Society of Western Australia 82, pp. 17–25.
Box JB, Duguid A, Read R, Kimber RG, Knapton A, Davis J and Bowland AE. 2008. Central Australian waterbodies: the importance of permanence in a desert landscape. Journal of Arid Environments 72, pp. 1395–1413.
Braysher M. 1993. Managing vertebrate pests: principles and strategies. Australian Government Publishing Service, Canberra.
Brown A. 2004. A review of camel diseases in central Australia. Northern Territory Department of Primary Industry, Fisheries and Mines, Technical Bulletin 314, Alice Springs. Available: Technical Publications, Northern Territory Department of Primary Industry, Fisheries and Mines.
BTE. 2000. Road crash cost in Australia. Bureau of Transport Economics, Canberra.Bureau of Meteorology. 2008. Climate statistics for Australian locations. Available from <http://www.
Bom.gov.au/climate/averages/tables/cw_015527.All.shtml> Copley PB, Baker LM, Nesbitt BJ and Foulkes JN. 2003. ‘Mammals’, in A Biological Survey of the
Anangu Pitjantjatjara Lands, South Australia, 1991–2001, ed. AC Robinson, PB Copley, PD Canty, LM Baker and BJ Nesbitt. Department for Environment and Heritage, Adelaide.
CSIRO. 2007. Climate change in Australia, technical report. CSIRO. Available from <http://www.climatechangeinaustralia.gov.au/resources.php>
Davis JA, Harrington SA and Friend JA. 1993, Invertebrate communities of relict streams in the arid zone: the George Gill Range, Central Australia. Australian Journal of Marine and Freshwater Research 44, pp. 483–505.
Dörges B and Heucke J. 2003. Demonstration of ecologically sustainable management of camels on aboriginal and pastoral land, Final report on project number 200046, Natural Heritage Trust (Online). Available from <http://www.camelsaust.com.au/NHTreport2003.doc>
Drucker AG. 2008. Economics of camel control in the central region of the Northern Territory, DKCRC Research Report 52. Desert Knowledge CRC, Alice Springs.
Dufour A, Snozzi M, Koster W, Bartram J, Ronchi E and Fewtrell L (Eds). 2003. Assessing microbial safety of drinking water: improving approaches and methods. IWA Publishing, London.
Duguid A, Barnetson J, Clifford B, Pavey C, Albrecht D, Risler J and McNellie M. 2005. Wetlands in the arid Northern Territory: a report to the Australian Government Department of the Environment and Heritage on the inventory and significance of wetlands in the arid NT. Northern Territory Government Department of Natural Resources, Environment and the Arts, Alice Springs.
Edwards GP, Saalfeld K and Clifford B. 2004. Population trend of feral camels in the Northern Territory, Australia. Wildlife Research 31, pp. 509–517.
Edwards GP, McGregor M, Zeng B, Saalfeld WK, Vaarzon-Morel P and Duffy M. 2008. Synthesis and key recommendations. In: GP Edwards et al. (Eds), Managing the impacts of feral camels in Australia: a new way of doing business. DKCRC Report 47. Desert Knowledge Cooperative Research Centre, Alice Springs. pp 331–360. Available at http://www.desertknowledgecrc.com.au/publications/contractresearch.html
Desert Knowledge CRC166 Managing the impacts of feral camels in Austral ia: a new way of doing business Ch 7: Evaluat ion of the impacts of feral camels, pp 133–182
Edwards GP, Zeng B, Saalfeld WK, Vaarzon-Morel P and McGregor M (Eds). 2008. Managing the impacts of feral camels in Australia: a new way of doing business. DKCRC Report 47. Desert Knowledge Cooperative Research Centre, Alice Springs. Available at http://www.desertknowledgecrc.com.au/publications/contractresearch.html
Hart Q and Bomford M. 2006. Australia’s pest animals: new approaches to old problems. Department of Agriculture, Fisheries and Forestry, Canberra.
Henzell R, Caple P and Wilson G. 1999. Wildlife and exotic disease preparedness in Australia. Feral herbivores. Australian Government Publishing Service, Canberra.
Herrick JE, Van Zee JW, Havstad KM, Burkett LM and Whitford WG. 2005. Monitoring Manual for Grassland, Shrubland and Savannah Ecosystems: Volume I – ‘Quick Start’. USDA-ARS Jornada Experimental Range, Las Cruces, New Mexico.
Hone J. 2007. Wildlife Damage Control. CSIRO Publishing, Collingwood.Koenig R. 2007. Camel scientists ask: What’s sinking the ships of the desert? Science 318, pp. 1372–
1373.Latz P. 1995. Bushfires and bushtucker: Aboriginal plant use in central Australia. IAD Press, Alice
Springs.Manefield GW and Tinson AH. 1996. Camels. A compendium, The TG Hungerford Vade Museum
Series for Domestic Animals, Series C, No 22. University of Sydney Post Graduate Foundation in Veterinary Science, Sydney.
McLeod R. 2004. Counting the cost: Impact of invasive animals in Australia 2004. Cooperative Research Centre for Pest Animal Control, Canberra.
Norris A and Low T. 2005. Review of the management of feral animals and their impact on biodiversity in the rangelands: A resource to aid NRM planning. Pest Animal Control CRC Report 2005, Pest Animal Control CRC, Canberra.
NPYWC. 2003. Ngayu - Lampa Mirrka, Our food: Report on the research done to investigate the viability of establishing an Aboriginal Bush Food Collective on the NPY lands. NPY Women’s Council, Alice Springs.
NRMA. 2005. Safety alert: drivers approach riskiest time for animal smashes – NSW, Available from <http://www.nrma.com.au/about-us/media-releases/20050629-a.shtml>
NT News. 2006. ‘Troubled year for trains’. 13 December, p. 4.Peeters PJ, Jennings S, Carpenter RJ and Axford G. 2005. Assessing the abundance and impacts of feral
camels in the Great Victoria Desert, A report to the Aboriginal Lands Integrated Natural Resource Management Group. Department for Environment and Heritage, South Australia.
Saalfeld WK and Edwards GP. 2008. Ecology of feral camels in Australia. In: GP Edwards et al. (Eds), Managing the impacts of feral camels in Australia: a new way of doing business. DKCRC Report 47. Desert Knowledge Cooperative Research Centre, Alice Springs. pp 9–34. Available at http://www.desertknowledgecrc.com.au/publications/contractresearch.html
Saalfeld WK, Edwards GP, Zeng B and Lamb D. 2008. A Multiple Criteria Decision Support Tool for feral camel management. In: GP Edwards et al. (Eds), Managing the impacts of feral camels in Australia: a new way of doing business. DKCRC Report 47. Desert Knowledge Cooperative Research Centre, Alice Springs. pp 287–330. Available at http://www.desertknowledgecrc.com.au/publications/contractresearch.html
Saalfeld WK and Zeng B. 2008. Review of non-commercial control methods for feral camels in Australia. In: GP Edwards et al. (Eds), Managing the impacts of feral camels in Australia: a new way of doing business. DKCRC Report 47. Desert Knowledge Cooperative Research Centre, Alice Springs. pp 185–220. Available at http://www.desertknowledgecrc.com.au/publications/contractresearch.html
Sada DW and Vinyard GL. 2002. ‘Anthropogenic changes in historical biogeography of Great Basin aquatic biota, in Great Basin Aquatic Systems History’, pp. 277–293, Eds R Hershler, DB Madsen and D Currey, Smithsonian Contributions to the Earth Sciences No. 33.
Desert Knowledge CRC 167Managing the impacts of feral camels in Austral ia: a new way of doing business Ch 7: Evaluat ion of the impacts of feral camels, pp 133–182
Short J, Caughley G, Grice D and Brown B. 1988. The distribution and relative abundance of camels in Australia, Journal of Arid Environments, vol. 15, 91–97.
Solinst Canada Ltd. 2008, User Guide for Solinst Levelogger Model 3001. Software Version 3.2.3, Georgetown, Ontario.
Vaarzon-Morel P. 2008a. Key stakeholder perceptions of feral camels: Aboriginal community survey (abridged). In: GP Edwards et al. (Eds), Managing the impacts of feral camels in Australia: a new way of doing business. DKCRC Report 47. Desert Knowledge Cooperative Research Centre, Alice Springs. pp 79–124. Available at http://www.desertknowledgecrc.com.au/publications/contractresearch.html
Vaarzon-Morel P. 2008b. Key stakeholder perceptions of feral camels: Aboriginal community survey, DKCRC Research Report 49. Desert Knowledge CRC, Alice Springs.
Vintner A and Collins T. 2008. Lost in the desert for 135 years – and found alive, TSN News, Winter 2008.
Walsh FJ and Douglas J. In review. Harvester–trader exchanges: a critical element of sustainable bush harvest to 2006, in Sustainable bush produce systems, Working Paper, Desert Knowledge Cooperative Research Centre, Alice Springs.
Walsh FJ. In prep. ‘ “To hunt and to hold”: Martu Aboriginal people’s uses and knowledge of their country, with implications for co-management in Karlamilyi National Park and the Great Sandy Desert, Western Australia’. Schools of Social and Cultural Studies (Anthropology) and Plant Biology (Ecology), PhD thesis, The University of Western Australia, Perth.
Wernery U and Kaaden OR. 2004. Foot-and-mouth disease in camelids: a review, Veterinary Journal 168, pp. 134–142.
Wilson RT. 1984. The camel. Longman Group Ltd., London and New York.Woinarski J, Pavey C, Kerrigan R, Cowie I and Wards S. (Eds.). 2007. Lost from our landscape:
Threatened species of the Northern Territory. Northern Territory Government, Darwin.Yu S. 2002. Ngapa kunangkul (Living water): an Indigenous view of groundwater. In: Country: visions
of land and people in Western Australia, Eds A Gaynor, M Trinca and A Haebich, Perth, Western Australian Museum and Lotteries Commission of Western Australia.
Zeng B and Edwards GP. 2008a. Key stakeholder perceptions of feral camels: pastoralist survey. In: GP Edwards et al. (Eds), Managing the impacts of feral camels in Australia: a new way of doing business. DKCRC Report 47. Desert Knowledge Cooperative Research Centre, Alice Springs. pp 35–62. Available at http://www.desertknowledgecrc.com.au/publications/contractresearch.html
Zeng B and Edwards GP. 2008b. Key stakeholder perceptions of feral camels: Conservation manager survey. In: GP Edwards et al. (Eds), Managing the impacts of feral camels in Australia: a new way of doing business. DKCRC Report 47. Desert Knowledge Cooperative Research Centre, Alice Springs. pp 63–78. Available at http://www.desertknowledgecrc.com.au/publications/contractresearch.html
Zeng B and McGregor M. 2008. Review of commercial options for management of feral camels. In: GP Edwards et al. (Eds), Managing the impacts of feral camels in Australia: a new way of doing business. DKCRC Report 47. Desert Knowledge Cooperative Research Centre, Alice Springs. pp 221–282. Available at http://www.desertknowledgecrc.com.au/publications/contractresearch.html
Desert Knowledge CRC168 Managing the impacts of feral camels in Austral ia: a new way of doing business Ch 7: Evaluat ion of the impacts of feral camels, pp 133–182
13. Appendices
Appendix 7.1 The impacts of camels on water bodies in Central Australia: A preliminary assessmentPeter Barker1, Jayne Brim Box2, and Tracey Guest3
1 Greening Australia NT, Alice Springs, NT.2 Biodiversity Conservation Unit, Department of Natural Resources, Environment, The Arts and Sport, Alice Springs, NT.3 Uluru–Kata Tjuta National Park, Natural and Cultural Resources, Yulara, NT.
IntroductionArid water bodies have been called the ‘precious jewels of the desert’ because they not only provide reliable water for humans, livestock, and native terrestrial and aquatic animals, but because they are often biological hotspots and areas of high endemism (Box et al. 2008). Arid water bodies are also jewel-like in their fragility, and extinction rates for animals and plants that rely on arid waterbodies are often higher than rates in other arid land types (Sada & Vinyard 2002).
Many water bodies in central Australia are also precious because they have deep ceremonial, economic, and social significance for Aboriginal people. Historically, Aboriginal people had an encyclopaedic knowledge of all waters within their own traditional country and often a good knowledge of the waters in the countries of their neighbours. Aboriginal people also actively managed many water bodies or sites, and permanent waterbodies were of particular importance as they were essential for survival during severe droughts (Bayly 1999). Most, if not all, are still considered culturally significant.
Camels and other large feral herbivores can impact isolated waterbodies by trampling, grazing, fouling, muddying, destabilizing, and drinking. The environmental impacts of feral animals on waterbodies in other areas of Australia have been well documented (for a review see Norris & Low 2005). Camels, in part because of their large numbers, can potentially pose significant threats to central Australian water bodies.
Over the period January 2005 – July 2008, the environmental impacts of camels were noted or evaluated during fieldwork associated with several natural resource management projects undertaken by Greening Australia and landholders at various locations in central Australia. These observations were mainly in regards to the impacts of camels on isolated water bodies, both temporary and permanent, and/or the surrounding watershed. Impact assessments included mainly qualitative evaluations of how camels affected erosion processes, water levels, aquatic animals, aquatic and riparian plants, and water quality. In some cases quantitative assessments were made. This report is in two parts: (1) a synthesis of camel impacts on waterholes, based on observations made across central Australia; and (2) a preliminary assessment of camel impacts on the Petermann and Katiti Land Trusts.
1. The impacts of camels on waterholes in central Australia: general observations
Methods
The following observations were made over the period January 2005 – July 2008 across a number of Aboriginal land trusts and pastoral leases in central Australia, primarily by Peter Barker of Greening Australia, NT. These observations were made during fieldwork associated with the Water for Life program, and in the course of site evaluations and the construction of large camel exclusion fences
Desert Knowledge CRC 169Managing the impacts of feral camels in Austral ia: a new way of doing business Ch 7: Evaluat ion of the impacts of feral camels, pp 133–182
under the Protecting Central Australian Rockholes project funded by the Australian Government. A range of water body types was visited including permanent spring-fed rockholes, semi-permanent alluvial waterholes, gnamma holes, and soakages.
Vegetation cover around waterholes
Camels and other large feral herbivores can cause significant damage to the vegetation around permanent and semi-permanent waterholes. When a large number of camels is present, a significant percentage (e.g. > 80%) of the ground cover near the waterhole is often destroyed by trampling. After rain events and/or if the soil moisture is sufficient, annual plants (often weed species) and some stunted perennials may be present, but in most cases these do not survive long after germination due to trampling. In areas less accessible to camels (e.g. those close to rock faces or in low traffic areas), perennial grasses and some unpalatable shrub and tree species may be present.
Sedimentation/erosion
Sedimentation of water bodies occurs when sites are devoid of vegetation and have camel pads leading to them. At some water bodies, up to eight pads were observed. These pads often change the hydrology of the surrounding landscape by channelling water to or away from the water bodies. Camel carcasses were excavated by hand in collaboration with Traditional Owners from beneath 1.5 m of sediments at some water bodies. Traditional Owners noted that some waterholes that were silted in due to camel impacts were historically over 2 m deep.
The emptying of waterholes by camels
Sites at which camel exclusion fences were constructed were visited repeatedly (e.g. 3 times per week) during the construction phase and then at periodic intervals to monitor fence performance. This provided the opportunity for the taking of basic measurements/calculations of water losses due to camels drinking. At one site an estimated 50 000 litres of water were removed by camels over a six-month period, after taking into consideration seepage and evaporation. This particular waterhole was at an isolated riverine site and was completely emptied by the camels over the observation period. This water loss was significant in that it represented over 50% of the standing free water available in this particular area.
Direct camel impacts on water
Many dead and dying camels were observed to have fallen into waterholes where they perished. Some waterholes had as many as 10 dead camels in them. Camel carcasses can cause major nutrient loading. In addition, because most waterholes are considered biologically and culturally significant, the presence of dead camels often caused major distress to Traditional Owners, who often expressed that waterholes were spoiled by rotting dead camels. In addition, camel manure contributes to water fouling (see Appendix 7.2), making water undrinkable for native animals or humans.
Camels ‘padding’ at water sites
After temporary waterholes have dried, camels often try to dig these sites out for more water. This process is called ‘padding’. Padding is thought to be a major source of soil compaction, which may make it difficult for plants to recolonise or germinate at affected sites.
Browse line
A distinct browse line is often observed on palatable vegetation at waterholes visited by large numbers of camels. This line can often extend for several kilometres away from a waterhole. In addition to the browse line, small palatable trees are often completely defoliated by camels near waterholes, and there is very little recruitment of these species in affected areas.

Desert Knowledge CRC170 Managing the impacts of feral camels in Austral ia: a new way of doing business Ch 7: Evaluat ion of the impacts of feral camels, pp 133–182
2. A preliminary assessment of camel impacts on waterholes in the Petermann and Katiti Aboriginal Land Trusts
Methods
In May–June 2007, the authors were invited to participate in preliminary discussions with Traditional Owners, staff from Natural and Cultural Resources at Uluru–Kata Tjuta National Park (UKTNP), and the Central Land Council (CLC) regarding the status (i.e. ecological and cultural health) of 15 waterholes on the Petermann and Katiti Aboriginal Land trusts in the vicinity of UKTNP. At this meeting the Traditional Owners categorised these waterholes as ‘good’, ‘not sure (of status)’, or ‘in need of help’. Shortly thereafter, the authors were invited to visit five of these water bodies that had been categorised as either ‘not sure (of status)’ or ‘in need of help’ to determine their ecological health, in collaboration with Traditional Owners and UKTNP staff. The five water bodies that were visited included the following wetland types: a small alluvial upland soakage/waterhole, a permanent spring, an isolated rockhole (or gnamma hole), and two isolated soakages.
Initial trips were made to all five water bodies in May and June 2007. Additional trips were made in November 2007 and in January and February 2008. In general, the following were assessed for each site either through direct observations, discussions with Park staff and/or Traditional Owners, or the collection of physical data:
whether camels were present in the area, had access to and were using the water body or surrounding area for drinking or grazing, and if camel impacts were noticeable either in the water body or the surrounding landscape whether water was present (i.e. permanent or temporary sources), and whether camels were using the site as a water source the overall state of water quality, including whether any obvious signs of enrichment or eutrophication were present the condition of the surrounding watershed and/or countryside, including erosion, sedimentation of existing waterholes, browsing, or over-grazing by camels or other animals.
Results and discussion
Sedimentation, erosion and changes to hydrology
All of the waterholes studied were affected by sedimentation to some degree. Some were completely silted up, and water was only present when sediments were dug out. In one case the Traditional Owners indicated they did not want a waterhole cleaned out because of concerns that if water was present, camels would return and cause more damage. Other water bodies had only localised sedimentation, largely because they occurred at the top of catchments and were less accessible to camels.
Camels cause erosion because they destroy ground cover vegetation and make definitive pads to and from water places. At one site, a one-meter-wide camel pad led to a particular waterhole, and camel trampling and grazing probably contributed to the development of an erosion channel at the site. The presence of a number of dead ironwood (Acacia estrophiolata) and red gum (Eucalyptus camaldulensis) trees that now occurred a long way from the current hydrologic channel suggests that the hydrological pattern for this site had changed from a broad flood-out to a relatively narrow channel, thereby cutting off the water supply for the trees. Such changes to hydrologic patterns are not uncommon at waterholes in soft substrates that are heavily used by camels.
Emptying of water
Many of the waterholes that were assessed were clearly being emptied by camels. One particular waterhole is a good example of this and also of the associated impacts on native fauna. When the site was first visited in January 2008, the waterhole was partially filled with an estimated 6000
1.
2.
3.
4.

Desert Knowledge CRC 171Managing the impacts of feral camels in Austral ia: a new way of doing business Ch 7: Evaluat ion of the impacts of feral camels, pp 133–182
litres of water and contained thousands of tadpoles. About 30 camels were observed in the area at that time. Two days later, one of the authors (T. Guest) returned to find that this waterhole was dry. Although evaporation was undoubtedly responsible for some of the water loss, the expected amount of evaporation, based on January pan evaporation estimates for Yulara airport (Bureau of Meterology 2008), was much less than 6000 litres. It is suspected that camels drank this waterhole dry. Thousands of dead and dying tadpoles were found at this waterhole after it had been emptied of surface water. This accelerated draining of a temporary water body may have implications for local frog populations which may not be able to complete their life cycle under such circumstances. According to Joseph R Mendelson III (2008, Curator of Herpetology, Zoo Atlanta, pers. comm.), ‘Waterholes are a limited resource in deserts, and local [frog] populations often show a high degree of fidelity to particular historical waterholes, with only limited amounts of risky cross-country emigrations.’ However, this assertion needs to be tested.
Management
One waterhole had been fenced in 2000 by UKTNP staff and Traditional Owners. The fence consisted of cable strung between concreted poles. The fence excluded camels while allowing native wildlife (kangaroos, birds) to access the site (i.e. kangaroo and bird droppings were found inside the fence). Although there was evidence that camels had tried to penetrate the fence, they had not managed to break through. In other areas camels have been observed to kill themselves trying to get through fences for water. A permanent spring located about 20 kms from the site fenced in 2000 may have served as an alternate water source for camels in the area, thereby taking pressure off the fence.
Observed camel numbers
There were many camels in the areas visited. During the first two-day trip, seven groups of camels were seen, with the largest group consisting of around 200 camels. These visual observations were consistent with the high camel densities estimated for the area during an aerial survey conducted in 2001 (Edwards et al. 2004).
Acknowledgments
We thank and greatly appreciate the guidance, discussions with, and participation of the following Traditional Owners and Mutitjulu community members during our visits: Cassidy Uluru, Reggie Uluru, Steven Uluru, Johnny Jingo, Wangan No.1., Ashely Paddy, Lochlan Jingo, David Moneymoon, Robert Sevens, Richard Kulitja, Joyce Tjiliri, Wionna Palma, Selwyn Kurukringa, Pamala Ray, and Bessie Nipper. We thank Mirjana Jambrecina, Daisy Walkabout, Phillip Driften, Sam Steel, and Steve Anderson of Natural and Cultural Resources/UKTNP for their field and office help, insights, and support for this assessment. We thank Sean Moran, Andrew Drenen, and David Alexander of the Central Land Council for their support and guidance. This assessment was supported by the DKCRC camel project, UKTNP, Central Land Council, Greening Australia, and Biodiversity Conservation South (NRETAS).
Desert Knowledge CRC172 Managing the impacts of feral camels in Austral ia: a new way of doing business Ch 7: Evaluat ion of the impacts of feral camels, pp 133–182
Appendix 7.2 Camel usage and impacts at a permanent spring in central Australia: A case study. Tracey Guest1, Peter Barker2, Jayne Brim Box3, Mirjana Jambrecina4, and Sean Moran5
1, 4 Uluru–Kata Tjuta National Park, Natural and Cultural Resources, Yulara, NT, Australia2 Greening Australia NT, Alice Springs, NT, Australia3 Biodiversity Conservation Unit, Department of Natural Resources, Environment and the Arts, Alice Springs, NT, Australia5 Central Land Council, Mutitjulu, NT, Australia
IntroductionIn May–June 2007, the authors were invited to participate in preliminary discussions with Traditional Owners, staff from Natural and Cultural Resources at Uluru–Kata Tjuta National Park (UKTNP), and the Central Land Council (CLC) regarding the status (i.e. ecological and cultural health) of 15 waterholes on the Petermann and Katiti Aboriginal Land trusts in the vicinity of UKTNP. At this meeting the Traditional Owners categorised these waterholes as ‘good’, ‘not sure (of status)’, or ‘in need of help’ Shortly thereafter, the authors were invited to visit five of these water bodies that had been categorised as either ‘not sure (of status)’ or ‘in need of help’ to determine their ecological health, in collaboration with Traditional Owners and UKTNP staff.
Here we report on the ecological health of one of these water bodies. Because of sensitivities regarding the location and name of the water body, we have not named it in this report. Instead we will refer to it simply as ‘X’. X is a small, well-defined spring-fed rockhole and short spring run located on the Petermann Aboriginal Land Trust. It consists of a small pool at the spring head, and a series of small, seasonal shallow pools in a poorly-defined short spring run. Traditional Owners commented that, in regards to local water sites, X was the site most visited by community members, native wildlife, and camels. X is often used as a water source for people travelling through the area.
Traditional Owners suggested X’s status was, ‘needs help’, primarily because they and UKTNP staff had noted heavy usage by camels on previous visits. In order to determine in more detail the impacts that camels were having on X, the following objectives were proposed, in consultation with Traditional Owners:
determine the overall water quality, including whether faecal contamination from camels was present.determine if camels were using X as a water source.collect information on the aquatic animals (including frogs) that occur in X to assess whether camels were impacting aquatic animal species occurrences.determine whether camels had impacted the area immediately around X, by conducting a ground cover survey and assessing trampling, browsing, etc.
Methods
A total of ten trips were made to X from May 2007 to July 2008. A list of visitation dates and the data collected at each visit is presented in Table A7.2.1. Physical aspects of the site, including dimensions of the rockhole, downstream pools, and suspected flow paths, were recorded on multiple visits. On each visit, observations were recorded on whether camels or native wildlife were observed near the spring.
1.
2.3.
4.

Desert Knowledge CRC 173Managing the impacts of feral camels in Austral ia: a new way of doing business Ch 7: Evaluat ion of the impacts of feral camels, pp 133–182
Table A7.2.1: Dates of site visits and data collected from X
Date of visit Data collected
31 May 2007 Site visit with Traditional Owners.
Aquatic invertebrates sampled.
04 June 2007 Microbial water sample collected.
Aquatic invertebrates sampled.
28 June 2007 Physical measurements of site taken.
Aquatic invertebrates sampled.
13 August 2007 Depth logger deployed.
20 November 2007 Data from depth logger retrieved.
Microbial water sample collected.
Aquatic invertebrates sampled.
Ground cover sampled.
18 January 2008 Data from depth logger retrieved.
Aquatic invertebrates sampled.
27 February 2008 Cameras installed.
Data from depth logger retrieved.
Aquatic invertebrates sampled.
28 February 2008 Cameras retrieved.
28 May 2008 Depth logger retrieved.
09 July 2008 Ground cover sampled.
Water quality
Water chemistry was assessed using a Horiba U-10 multi-parameter water quality meter. Conductivity, pH, turbidity, dissolved oxygen, temperature, and salinity levels were recorded at least once, and in most cases on multiple visits. Because camel dung was conspicuous around the spring, and X is commonly used as a source of drinking water by people travelling through the county, water samples were taken in June and in November 2007 for microbial analysis (Table A7.2.1).
Macro-invertebrates
Semi-quantitative collections of macro-invertebrates (and tadpoles, if present) were made on five separate visits (Table A7.2.1). Macro-invertebrates were collected using standard techniques (e.g. Davis et al. 1993). In addition, both day and night samples were collected, as previous sampling efforts in central Australia have shown that this is the most effective means of collecting a representative sample of macro-invertebrates present (Barker & Brim Box 2008). Specimens were preserved and later sorted and identified using available taxonomic keys. Samples are stored at Biodiversity Conservation Unit, Department of Natural Resources, Environment, The Arts and Sport, Alice Springs.
Vegetation and ground cover sampling
Surveys of the area or ‘riparian zone’ surrounding X were conducted on 20 November 2007 and on 9 July 2008. A line-point intercept method was used to determine vegetation, litter, rock, and soil cover and to interpret erosion processes and where water infiltration occurred (Herrick et al. 2005). A total of 92 (80 cm2) points from 8 transects were sampled from an approximately 22 m x 8 m area immediately in front of the spring source that was considered the riparian zone.
Water level monitoring and surveillance cameras
To assess whether camels were drinking from X, a HOBO water level logger was deployed on 13 August 2007 (Table A7.2.1). The data logger recorded the barometric pressure, which was later used to estimate changes in water level over time. The data logger was programmed to record a water level
Desert Knowledge CRC174 Managing the impacts of feral camels in Austral ia: a new way of doing business Ch 7: Evaluat ion of the impacts of feral camels, pp 133–182
every six minutes. Water temperature was also recorded at these times. The data logger was removed on 28 May 2008. In some cases the memory card on the logger filled before data could be downloaded. Therefore, there are a few gaps (e.g. 12–20 November 2007) in the otherwise continuous record.
To check if changes in water level depths corresponded to times when camels were actively drinking from X, two infra-red, motion-detecting surveillance cameras were deployed on the evening of 27 February 2008. Timers on the cameras were coordinated with the water level logger timer on site and immediately before deployment. A night trial was chosen because, based on some of the preliminary water level data, it was suspected that camels were drinking from X more often at night. The cameras were retrieved the following morning.
Data analysis for water level logger
Water level loggers measure absolute pressure (water pressure plus atmospheric pressure). In order to determine water column depth based on water pressure alone, several steps were needed to convert the data to water column depth. These steps are outlined below.
Step 1. Compensate for atmospheric pressure.
This step is needed because atmospheric pressure fluctuates during a 24-hour period. In this case the atmospheric pressure (recorded in 30-minute intervals) collected by the Bureau of Meteorology (BOM) from the Yulara airport was used. The following linear regression was used to compensate for the change in elevation between X (642 m) and Yulara (492 m):
Pressure (mbar) at site X = -0.113(elevation (m)) + 1011.52
Step 2. Estimate atmospheric pressure for time periods not recorded at the Yulara airport.
The water logger recorded absolute pressure in 6 minute intervals, but atmospheric pressure was recorded at the Yulara airport every 30 minutes. To estimate the atmospheric pressure at intervals not recorded by the BOM at Yulara, a linear interpolation was used to estimate the atmospheric pressure between every two time steps recorded at Yulara (e.g. 1:30 am and 2:00 am).
Step 3. Determine water pressure and water column height.
Estimated water pressure for each 6-minute reading was determined by subtracting the estimated air pressure (mbar) from the absolute pressure recorded on the logger. To determine the water column equivalent height for each reading, the following conversion was used (Solinst 2008):
One unit pressure (mbar) = 0.01022 water column equivalent (m)
Step 4. Determine volume of water in X from water column height.
Based on field measurements, it was assumed that X most closely approximated a cylinder. To convert from water column height to litres of water, the volume of water in X was first calculated for each water pressure reading. For example:
If the water column level (h) = 0.642 (m), then volume = π r2 h, where,
r = radius of the opening of the rockhole, for X estimated to be 0.2 m,
h = 0.642 m, or estimated height of the water column.
These data (m3) were then multiplied by 1000 to obtain estimated litres of water at each time step.

Desert Knowledge CRC 175Managing the impacts of feral camels in Austral ia: a new way of doing business Ch 7: Evaluat ion of the impacts of feral camels, pp 133–182
Results and discussion
Water quality
The results of the microbial analyses of water samples are in Table A7.2.2. On the first date (5 June 2007), two samples were taken: one from a pool that had formed directly below the spring [(a) in Table A7.2.2 below] and where camel dung was obvious, and one from the spring source [(b) in Table A7.2.2 below]. The third sample was taken from the spring source after moderate rains in November [(c) in Table A7.2.2 below].
Table A7.2.2: Faecal coliform results for water samples taken from X
Date Time sampled Temp (oC) Coliform per 100 ml
E. coli per 100 ml
Plate count organisms Drinking mode
5/6/2007 (a) 19:30 10.9 >2420 >2420 2940 no
5/6/2007 (b) 19:30 16.8 2420 0 1750 yes
20/11/2007 (c) 18:20 27.2 >2420 1986 >10 000 no
Drinking Mode was determined using guidelines developed for the Northern Territory.
Faecal contamination was detected on both dates that samples were taken. However, on the first date (5 June 2007) faecal coliforms were only found in the pool below the spring (Table A7.2.2). It is not surprising that faecal contamination was present in the lower pool in June 2007, as the water was green in that pool and camel dung was obvious. Faecal coliforms are thought to only live for a short time outside an animal’s gut, and these results suggest that camels, and possibly other animals and birds, were visiting the waterhole at this time. In comparison, the water was clean in the spring source and considered drinkable based on water quality guidelines for the NT.
In November 2007, however, faecal contamination was detected in the spring source and the water would not have been considered drinkable. Interestingly, this faecal contamination was not obvious; the water was clear (i.e. turbidity was 2 NTU) and no camel dung was apparent in the rockhole.
Faecal coliforms include bacteria that originate in faeces (e.g. Escherichia coli) as well as bacteria (e.g. Citobacter) that are found in faeces but are also commonly found in water, soils, and wastewater. Faecal coliform counts are intended to indicate faecal contamination, and the presence of E. coli is used as an indicator or surrogate microorganism for other pathogens (e.g. protozoans) that may be present in a water body but are not measured (for a comprehensive treatment of microbial safety of drinking water see Dufour et al. 2003). Waterborne pathogenic diseases can lead to a wide variety of human health problems, including hepatitis A, ear infections, and gastroenteritis.
High faecal counts are potentially harmful to humans if they indicate other pathogens are present. In addition, high faecal counts can also be detrimental to overall water quality and animals that are found in those waters. For example, organic matter that may accompany or be the source of faecal coliforms can lead to reduced dissolved oxygen levels when this matter decomposes. Low dissolved oxygen levels can harm aquatic animals, especially those that are sensitive to changes in water quality. Organic matter is also often acidic and can lower the pH of water. Such changes in pH can adversely affect water quality and aquatic lifeforms.
Vegetation and ground cover sampling
The first vegetation survey (20 November 2007) was conducted following moderate rains in early and mid-November. Camels had apparently dispersed from X from 30 October –12 November, based on water level logger data (Figure A7.2.1) (no data were recorded from 12 November until the vegetation survey was conducted as the data logger memory card was full). The second survey (9 July 2008) was conducted following a dry period and associated heavy camel usage at X.
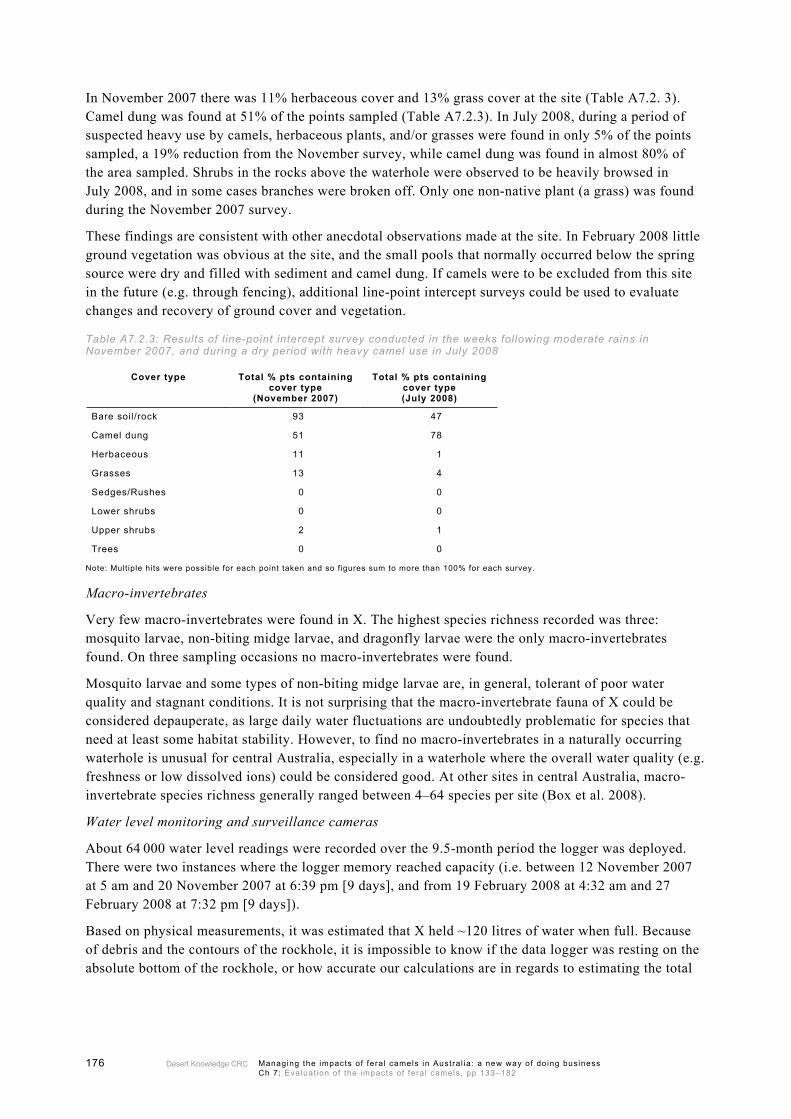
Desert Knowledge CRC176 Managing the impacts of feral camels in Austral ia: a new way of doing business Ch 7: Evaluat ion of the impacts of feral camels, pp 133–182
In November 2007 there was 11% herbaceous cover and 13% grass cover at the site (Table A7.2. 3). Camel dung was found at 51% of the points sampled (Table A7.2.3). In July 2008, during a period of suspected heavy use by camels, herbaceous plants, and/or grasses were found in only 5% of the points sampled, a 19% reduction from the November survey, while camel dung was found in almost 80% of the area sampled. Shrubs in the rocks above the waterhole were observed to be heavily browsed in July 2008, and in some cases branches were broken off. Only one non-native plant (a grass) was found during the November 2007 survey.
These findings are consistent with other anecdotal observations made at the site. In February 2008 little ground vegetation was obvious at the site, and the small pools that normally occurred below the spring source were dry and filled with sediment and camel dung. If camels were to be excluded from this site in the future (e.g. through fencing), additional line-point intercept surveys could be used to evaluate changes and recovery of ground cover and vegetation.
Table A7.2.3: Results of l ine-point intercept survey conducted in the weeks following moderate rains in November 2007, and during a dry period with heavy camel use in July 2008
Cover type Total % pts containing cover type
(November 2007)
Total % pts containing cover type (July 2008)
Bare soil/rock 93 47
Camel dung 51 78
Herbaceous 11 1
Grasses 13 4
Sedges/Rushes 0 0
Lower shrubs 0 0
Upper shrubs 2 1
Trees 0 0
Note: Multiple hits were possible for each point taken and so figures sum to more than 100% for each survey.
Macro-invertebrates
Very few macro-invertebrates were found in X. The highest species richness recorded was three: mosquito larvae, non-biting midge larvae, and dragonfly larvae were the only macro-invertebrates found. On three sampling occasions no macro-invertebrates were found.
Mosquito larvae and some types of non-biting midge larvae are, in general, tolerant of poor water quality and stagnant conditions. It is not surprising that the macro-invertebrate fauna of X could be considered depauperate, as large daily water fluctuations are undoubtedly problematic for species that need at least some habitat stability. However, to find no macro-invertebrates in a naturally occurring waterhole is unusual for central Australia, especially in a waterhole where the overall water quality (e.g. freshness or low dissolved ions) could be considered good. At other sites in central Australia, macro-invertebrate species richness generally ranged between 4–64 species per site (Box et al. 2008).
Water level monitoring and surveillance cameras
About 64 000 water level readings were recorded over the 9.5-month period the logger was deployed. There were two instances where the logger memory reached capacity (i.e. between 12 November 2007 at 5 am and 20 November 2007 at 6:39 pm [9 days], and from 19 February 2008 at 4:32 am and 27 February 2008 at 7:32 pm [9 days]).
Based on physical measurements, it was estimated that X held ~120 litres of water when full. Because of debris and the contours of the rockhole, it is impossible to know if the data logger was resting on the absolute bottom of the rockhole, or how accurate our calculations are in regards to estimating the total

Desert Knowledge CRC 177Managing the impacts of feral camels in Austral ia: a new way of doing business Ch 7: Evaluat ion of the impacts of feral camels, pp 133–182
volume of X. In addition, although one of the aims of this project was to obtain estimates of how much an individual camel could drink in one sitting, it became obvious that the total volume of X was too small to accurately make these estimates.
Water levels varied considerably over the period of record. The lowest levels (~3 litres) were recorded in September 2007 and January 2008. The highest level (~91 litres) was recorded in December 2007. Although small fluctuations were probably due to changes in barometric pressure and/or native animals drinking, and in some cases may have been due to people re-filling their water supplies, there are no other large feral or domestic herbivores in the area that could remove large volumes of water. Therefore, the large fluctuations in water levels recorded were assumed to be caused by camels drinking the water. To test this assertion, surveillance cameras were used for a 12-hour trial period (see below).
Figure A7.2.1 illustrates how water levels varied over two extensive periods during the study. Changes in water levels varied by month, diurnally, and before and after rain events. In general, camels appeared to use X more often during low rainfall periods, and dispersed from X in the days immediately before a rain event, for weeks at a time. It is probable that as less permanent sources of water dried, they returned to permanent waterholes like X.
The average monthly amount of water in X was significantly correlated (p < 0.05) with the amount of monthly rainfall (Figure A7.2.2). There could be two reasons for this. First, recharge rates into X are probably higher after rain events, especially if some of the groundwater recharge is from stored surface water. If these recharge rates are exceptionally high then even if camels were drinking, recharge may be high enough to replace water as it is being removed by camels. This scenario seems unlikely given the small size of X, estimates of how slowly it refills (see below), and how quickly camels are able to draw down the waterhole. Second, camels may move away from X during and after rain events in search of food because water is no longer a limiting factor.
(a)

Desert Knowledge CRC178 Managing the impacts of feral camels in Austral ia: a new way of doing business Ch 7: Evaluat ion of the impacts of feral camels, pp 133–182
(b)
Figure A7.2.1: Examples of long-term water usage patterns by camels at X
Note: (a) 20 November 2007 – 19 January 2008, (b) 28 February 2008 – 28 May 2008. In (a), it appears that camels used X until the afternoon of December 7. A small amount of rain fell on 11 December (< 1mm) and on 12 December over 20 mm of rain fell in the area. By then, camels were no longer drinking from X. In (b) camels used X almost continuously in early March, until rains on 24 March. Camels appeared to disperse for about a week after that rain event.
Nov.Dec.
Jan.
March
Aug.
Oct.
Feb.
May
Sept.
April
0
10
20
30
40
50
60
70
80
90
0 0 0.2 1.6 1.6 2.2 6.2 10.8 35.8 59.8total monthly rainfall (mm)
Avg
. vol
ume
wat
er in
X (l
)
Figure A7.2.2: Average monthly water volume in X
Note: Total monthly rainfall was significantly positively correlated (p < 0.05) with the volume of water in X. In general the greater the monthly rainfall, the less camels used X as a source of water.
Camels also appeared to spend more time at X at night than during the day. The volume of water in X was significantly less during the night than during the day for each month sampled (two sample t-test assuming unequal variances. Note: a large number of samples were taken each month) (Figure A7.2.3).
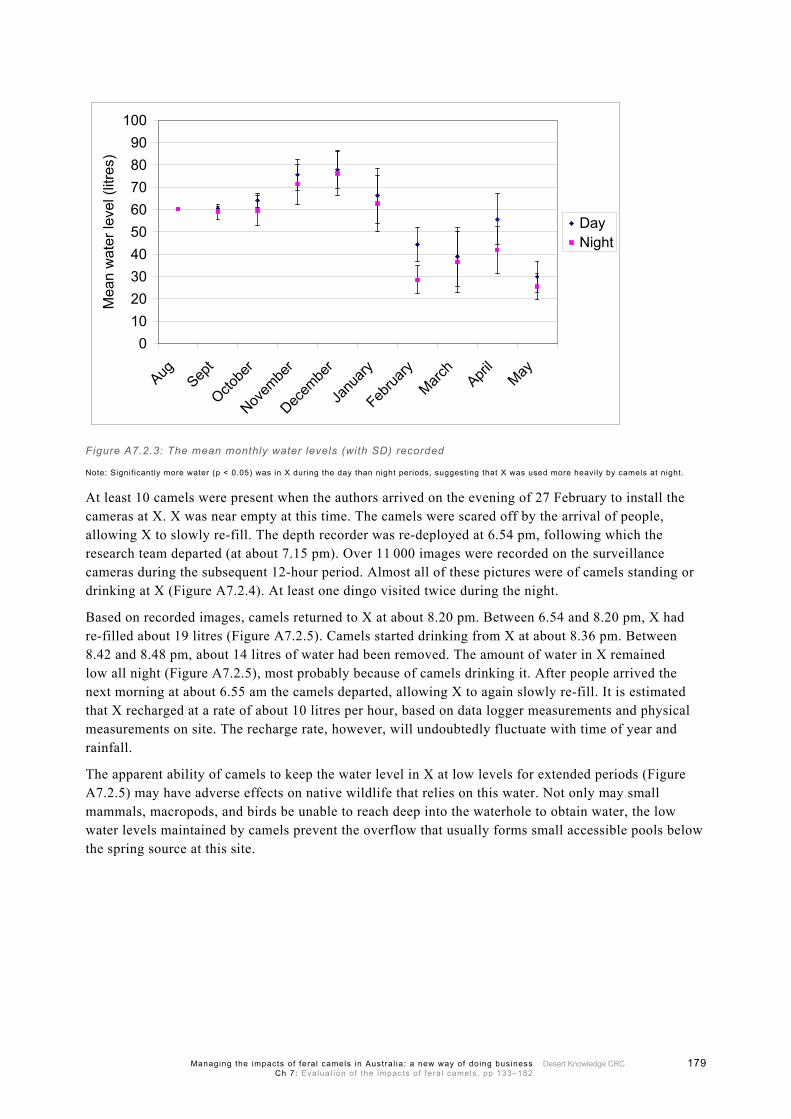
Desert Knowledge CRC 179Managing the impacts of feral camels in Austral ia: a new way of doing business Ch 7: Evaluat ion of the impacts of feral camels, pp 133–182
0102030405060708090
100
AugSep
t
Octobe
r
Novem
ber
Decem
ber
Janu
ary
Februa
ryMarc
hApri
lMay
Mea
n w
ater
leve
l (lit
res)
DayNight
Figure A7.2.3: The mean monthly water levels (with SD) recorded
Note: Significantly more water (p < 0.05) was in X during the day than night periods, suggesting that X was used more heavily by camels at night.
At least 10 camels were present when the authors arrived on the evening of 27 February to install the cameras at X. X was near empty at this time. The camels were scared off by the arrival of people, allowing X to slowly re-fill. The depth recorder was re-deployed at 6.54 pm, following which the research team departed (at about 7.15 pm). Over 11 000 images were recorded on the surveillance cameras during the subsequent 12-hour period. Almost all of these pictures were of camels standing or drinking at X (Figure A7.2.4). At least one dingo visited twice during the night.
Based on recorded images, camels returned to X at about 8.20 pm. Between 6.54 and 8.20 pm, X had re-filled about 19 litres (Figure A7.2.5). Camels started drinking from X at about 8.36 pm. Between 8.42 and 8.48 pm, about 14 litres of water had been removed. The amount of water in X remained low all night (Figure A7.2.5), most probably because of camels drinking it. After people arrived the next morning at about 6.55 am the camels departed, allowing X to again slowly re-fill. It is estimated that X recharged at a rate of about 10 litres per hour, based on data logger measurements and physical measurements on site. The recharge rate, however, will undoubtedly fluctuate with time of year and rainfall.
The apparent ability of camels to keep the water level in X at low levels for extended periods (Figure A7.2.5) may have adverse effects on native wildlife that relies on this water. Not only may small mammals, macropods, and birds be unable to reach deep into the waterhole to obtain water, the low water levels maintained by camels prevent the overflow that usually forms small accessible pools below the spring source at this site.
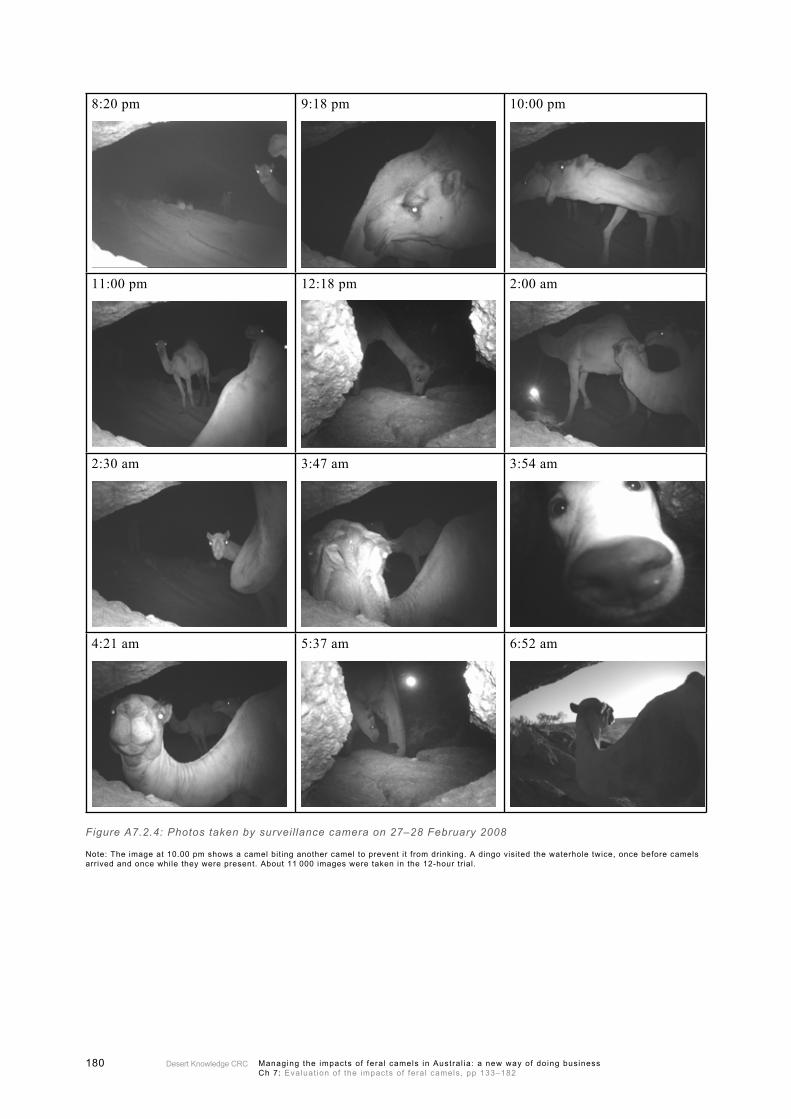
Desert Knowledge CRC180 Managing the impacts of feral camels in Austral ia: a new way of doing business Ch 7: Evaluat ion of the impacts of feral camels, pp 133–182
8:20 pm 9:18 pm 10:00 pm
11:00 pm 12:18 pm 2:00 am
2:30 am 3:47 am 3:54 am
4:21 am 5:37 am 6:52 am
Figure A7.2.4: Photos taken by surveillance camera on 27–28 February 2008
Note: The image at 10.00 pm shows a camel biting another camel to prevent it from drinking. A dingo visited the waterhole twice, once before camels arrived and once while they were present. About 11 000 images were taken in the 12-hour trial.

Desert Knowledge CRC 181Managing the impacts of feral camels in Austral ia: a new way of doing business Ch 7: Evaluat ion of the impacts of feral camels, pp 133–182
Figure A7.2.5: Changes in water levels before and after camels visit X on 27–28 February 2008
Note: Between 8.36 pm and 8.42 pm the water level starts to drop. By 9.00 pm about 25 litres has been removed. Water levels are kept low all night by camels drinking. After people arrive at 6.55 am the water level starts to rise, and by 7.42 am the water level had risen about 12 litres (i.e. recharged).
Conclusions
It is apparent that camels have multiple significant impacts on X. Camels appear to use X most heavily in periods when rainfall is scant, and more at night than during the day. However, in long periods with little or no rainfall, it appears that camels use X heavily during the day and night, and there is little chance for X to re-fill. Consequently, small pools that form when X is full, and can be readily accessed by native wildlife, are dry and filled with soil and dung during periods of heavy camel use. This lack of access to an otherwise permanent waterhole may have negative impacts on native animal species that rely on this water. In addition, the low number of macro-invertebrates present during the study period suggests that the aquatic fauna is also negatively impacted by the presence of camels.
Not surprisingly, the vegetation surrounding X was found to be heavily impacted by camels. Shrubs near X showed signs of heavy browsing, and the ground cover became mainly denuded of vegetation due to camel browsing and trampling during dry periods. This could lead to long-term alternations in drainage patterns and erosion of the site. Follow-up vegetation and ground cover surveys are needed to better assess these impacts.
X was and is a traditional source of drinking water for people travelling through the country. Preliminary microbial analysis indicates that at certain periods X is not suitable for drinking, even if the water itself looks ‘clean’ or clear. The faecal contamination evident was most probably due to camel use of the waterhole. These results have been discussed with Traditional Owners, but further microbial analyses may be needed for longer-term assessments.
Acknowledgments
We thank and greatly appreciate the guidance, discussions with, and participation of the following Traditional Owners and Mutitjulu community members during our visits; Cassidy Uluru, Reggie Uluru, Steven Uluru, Johnny Jingo, Wangan No.1., Ashely Paddy, Lochlan Jingo, David Moneymoon, Robert
Desert Knowledge CRC182 Managing the impacts of feral camels in Austral ia: a new way of doing business Ch 7: Evaluat ion of the impacts of feral camels, pp 133–182
Sevens, Rene and Richard Kulitja, Joyce Tjiliri, Wionna Palma, Selwyn Kurukringa, Pamala Ray, and Bessie Nipper. We thank Daisy Walkabout, Phillip Driften, Sam Steel, Niall Stephen, Amber Forbes, and Steve Anderson of UKTNP for their field and office help, insights, and support for this assessment. We especially thank Rene and Richard Kulitja for their help and insights regarding rockhole X. We thank Andrew Drenen and David Alexander of the Central Land Council for their support and guidance. This assessment was supported by the DKCRC camel project, UKTNP, Central Land Council, Greening Australia, and Biodiversity Conservation South (NRETAS).