chapter 7 empirical results - …shodhganga.inflibnet.ac.in/bitstream/10603/4889/13/13_chapter...
TRANSCRIPT

CHAPTER 7
EMPIRICAL RESULTS
7.1 Introduction
This chapter bears the most important findings of this thesis. Here the testing
of the hypotheses pertaining to the relationship between market orientation
and business performance, the role of the antecedents to market orientation
and the role of moderators are performed. The effect of the antecedents and
moderators pertaining to the Indian seafood industry, and their relationship to
the constructs of intelligence generation, intelligence dissemination and
responsiveness and to business perfonnance are detailed through the method
of stepwise multiple regression analysis.
7.2 Hypothesis Testing using Stepwise Regression Analysis
This section includes the results of the major hypotheses of the thesis.
Hypothesis testing is done by the multiple regression analysis, using the step
wise method. Coakes and Steed (2001) have laid down the rule regarding the
use of the regression analysis, namely that the study should have at least five
times the number of cases than the independent variables. This study meets
with the above requirement comfortably. All the assumptions of regression

C!iapter 7
analysis are fulfilled, as shown in Chapter 3. The stepwise regression analysis is
based on the variance of the variables. The probability for entry and removal of
the variables are specified and accordingly, the variables in the order of
importance are loaded onto the mode1. The probability value for entry into the
model is 0.05 while the probability for removal of the variable is 0.1. Stepwise
procedures select the most correlated independent first, remove the variance in
the dependent, then select the second independent which most correlates with
the remaining variance in the dependent, and so on until selection of an
additional independent does not increase the R-squared by a significant
amount (usually significant = 0.05). Mainly four major hypotheses are being
tested in this chapter. They include:
Hypothesis I
Antecedents significantly determine levels of Intelligence genera tion.
Antecedents significantly determine levels of Intelligence dissemination
Antecedents significantly determine levels of Intelligence responsiveness
Hypothesis 11
Antecedents determine the level of overall market orientation of firms.
Hypothesis III
Market orientation significantly determines level of Business performance.
146

Hypothesis IV
The market orientation-business performance relationship is moderated by
market turbulence, technological turbulence and competitive intensity.
The hypotheses and results of regression analyses are discussed in the
following sections.
7.2.1 Hypothesis 1:-
7.2.1.1 Antecedents significantly determine levels of Intelligence
generation.
The first regression analysis involves the relationship between the seven
independent variables, i.e., the antecedents and the dependent variable
intelligence generation. This hypothesis thus involves seven sub-hypotheses 1-7
jointly given:
Intelligence generation increases when, the top management
emphasis increases, the top management risk aversion decreases,
the interdepartmental connectedness increases, the
interdepartmental conflict decreases, the formalization decreases,
the centralization decreases, and when the reward system
orientation increases.
They are represented by the following regression equation:
147
Cliapter 7
I.G.=a+ 6.xTME+B2X RA+ B3X IDCN + B4 x D>CL+ Bsx FM+ B6 X CN
+ B,x RSO + ei
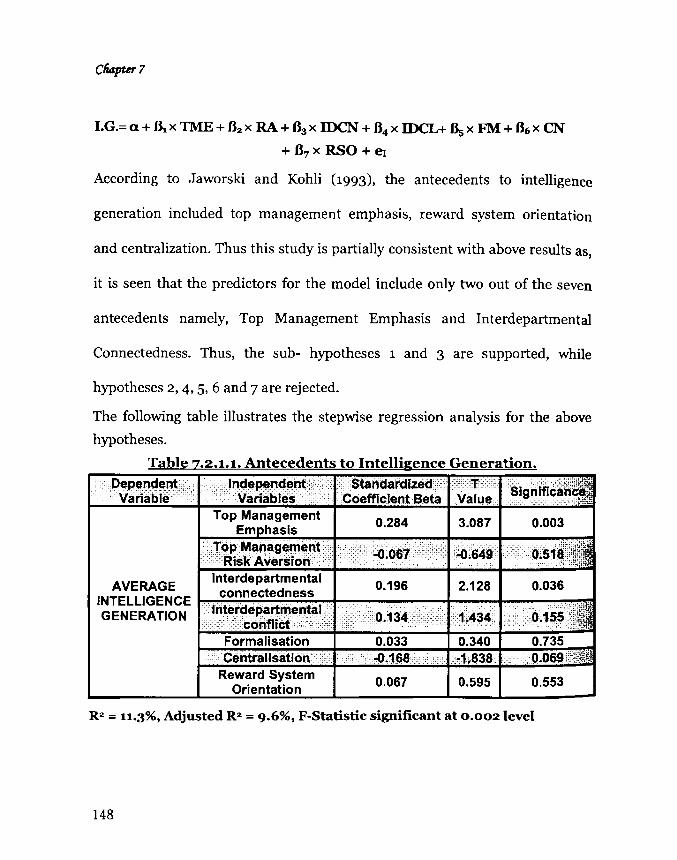
According to Jaworski and Kohli (1993), the antecedents to intelligence
generation included top management emphasis, reward system orientation
and centralization. Thus this study is partially consistent with above results as,
it is seen that the predictors for the model include only two out of the seven
antecedents namely, Top Management Emphasis and Interdepartmental
Connectedness. Thus, the sub- hypotheses 1 and 3 are supported, while
hypotheses 2, 4, 5, 6 and 7 are rejected.
The following table illustrates the stepwise regression analysis for the above
hypotheses.
Table 7.2.1.1. Antecedents to Intelligence Generation . ..• Dependent.. Independent •. .:.Standardize~. • T
. Variable·· Variables·· Coefficient Beta
0.284
AVERAGE INTELLIGENCE h;;;;;;;~~:;;;;;r1~777:77t~~r~:-::S GENERATION
R2 = 11.3%, Adjusted R2 = 9.6%, F-Statistic significant at 0.002 level
148

The regression explains only 10 % of the variance in intelligence generation
and is lower than Jaworski & Kohli's 1993 study, which had an R2 value of 0.34,
for Sample I and 0.33 for Sample n. Nevertheless, its F value is highly significant
at the 0.002 level. Thus, although the model explains a statistically significant
amount of the variation, it still leaves most of it unexplained.
Thus the estimated model, which contains two independent factors, is as
represented below-:
Intelligence Generation= 1.484 + 0.284 x Top Management
Emphasis+ 0.196 x Interdepartmental Connectedness.
Further, the t values and the significance level suggest that for the given model
the two independent variables are useful predictors of intelligence generation.
The top management emphasis (13=0.284, P=0.003) is statistically significant
and positively related to the market orientation construct of intelligence
generation. This suggests that Indian seafood firms can increase their market
orientation and therein their business performance, if the top management
commits more of their time and energy towards creating and inculcating a
market oriented behaviour in their employees. This change will be brought
about through the construct of intelligence generation. The studies also reveal
that, holding interdepartmental connectedness constant, with the change of
149

Cliapter 7
one unit of top management emphasis, the intelligence generation of the
seafood firms in India is increased by 0.28 units. This reinforces the theory
that the top management's active participation is necessary to effect any
possible positive change in the firm towards market orientation.
Alternatively, it also suggests that with all other variables kept constant i.e. the
top management emphasis on market orientation, intelligence generation
increases by 0.20 units, with a unit change in interdepartmental
connectedness. This relationship further shows that in firms which are more
internally connected, the intelligence generated seems to be more than in
firms, which are less internally connected. It thus follows that, if the finns
focus on increasing their interdepartmental communication, then the market
orientation will increase through an increase in the intelligence generated.
Therefore, there is partial support for Hypothesis 7.2.1.1.
7.2.1.2 Antecedents significantly determine levels of Intelligence
dissemination
The second stepwise multiple regression analysis assesses the relationship
between the seven independent variables, i.e., the antecedents and the
150
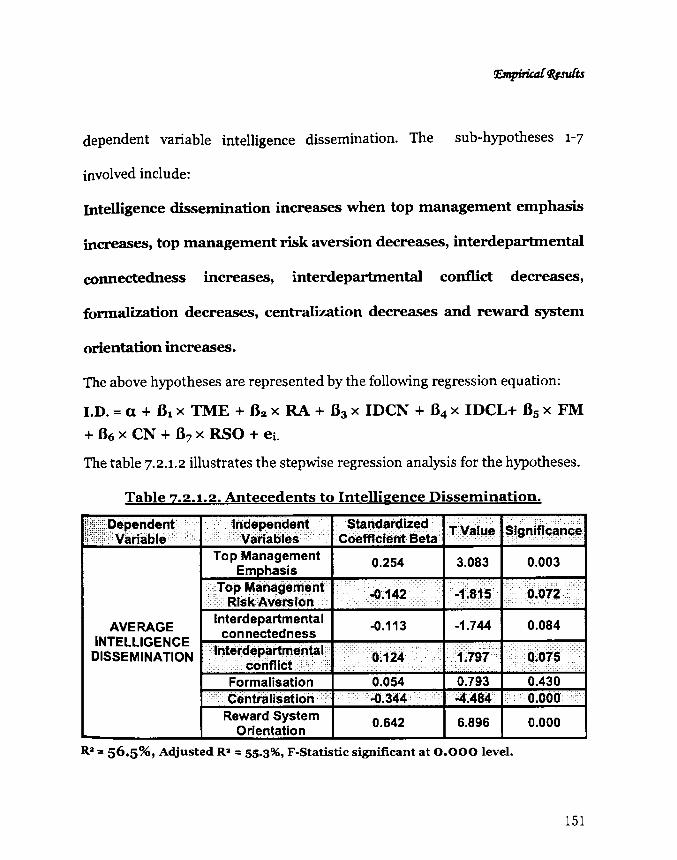
dependent variable intelligence dissemination. The sub-hypotheses 1-7
involved include:
Intelligence dissemination increases when top management emphasis
increases, top management risk aversion decreases, interdeparbnental
connectedness increases, interdeparbnental conflict decreases,
fonnalization decreases, centralization decreases and reward system
orientation increases.
The above hypotheses are represented by the following regression equation:
I.D. = a + 6 1 X TME + 6 2 X RA + 6 3 x IDCN + 6 4 x IDCL+ 6 5 x FM
+ 66 x CN + 6 7 x RSO + et
The table 7.2.1.2 illustrates the stepwise regression analysis for the hypotheses.
Table 7.2.1.2. Antecedents to Intelligence Dissemination.
ii~mm,gep-:pdent" " ,Independent 'Standardized ',', ":,:' :c:- -;::", :, .... ,:,
,,{,,:,:: .. :" Vanable Variables Coefficient Beta TValue Significance
Top Management 0.254 3.083 0.003 Emphasis , .• :Top M.ariagsrtl .. nt "
.. 0.072· .• ·:·
" Risk Aversion ~;142 ".;1:;815'
AVERAGE Interdepartmental -0.113 -1.744 0.084
INTELLIGENCE connectedness
DISSEMINATION Interdepartmental 0.124 .1.797" ",Q;O!$ , conflict" Formalisation 0.054 0.793 0.430
" Centralisation -0;344' 4.484 ., 0.000 Reward System 0.642 6.896 0.000
Orientation
Ra::: 56.5%, Adjusted Ra ::: 55.3%, F-Statistic significant at 0.000 level.
151

Cliapter 7
The regression explains 55 % of the variance in intelligence dissemination and
its F value is highly significant at the 0.000 level. From the above table, it is
seen that there are three significant and useful predictors for the model,
namely Top Management Emphasis, Centralisation and Reward System
Orientation. Thus, the sub- hypotheses 1, 6 and 7 are supported, while
hypotheses 2, 3, 4 and 5 are rejected. Jaworski & Kohli's seminal work included
the antecedents of conflict and connectedness, besides the above three
antecedents revealed in the present study.
Thus the estimated model, which contains three independent factors, is as
represented -:I.D. = 1.842 + 0.254 x TME - 0.344 x eN + 0.642 x RSO.
The top management emphasis and reward system orientation are statistically
significant and positively related to the market orientation construct of
intelligence dissemination, while the predictor variable Centralisation shows a
negative but statistically significant relationship, as expected. This suggests
that intelligence sharing in Indian seafood firms increases with active
encouragement from the top management, formulation of the right reward
systems and adoption of a decentralised pattern of decision making. The
results further imply that, holding the other predictor variables constant, with
the change of one unit of top management emphasis, the intelligence
152

dissemination in the seafood firms in India is increased by 0.25 units. This
reinforces the necessity of the top management's active participation in
effecting any possible positive change in the firm towards the adoption of the
market orientation philosophy.
Alternatively, it also suggests that with all other variables kept constant, a unit
decrease in centralisation brings about an increase in market orientation by
0.34 units. Similarly, a unit increase in the institution of reward systems
increases the market oriented behaviour of firms by 0.64 units.
Thus, the three antecedents influencing level of intelligence dissemination in
Indian seafood processing firms include top management emphasis,
centralisation and reward system orientation, while the other four antecedents
namely, risk aversion of top management, interdepartmental connectedness,
conflict and formalisation were insignificant and were subsequently removed
from the regression equations during the stepwise regression procedure.
Therefore, Hypothesis 7.2.1.2 is partially supported.
7.2.1.3. Antecedents significantly determine levels of Intelligence
responsiveness
The second stepwise multiple regression analysis assesses the relationship
between the seven independent variables, Le., the antecedents and the
153

C!iapter .,
dependent variable intelligence responsiveness. This hypothesis involves sub-
hypotheses 1-7 givenjontly, as below:
Intelligence responsiveness increases when, top management
emphasis increases, risk aversion decreases, interdeparbnental
connectedness increases, interdeparbnental conflict decreases,
formalization increases, centralization decreases and reward system
orientation increases.
The above hypotheses are represented by the following regression equation:
I.R. = a + 6 1 X TME + 6 2 X RA + 6 3 x IDCN + 6 4 x IDCL+ 6 5 x FM
+ 66 x CN + 67 x RSO + ei.
The table 7.2.1.3 illustrates the stepwise regression analysis for the above
hypotheses.
Table 7.2.1.3. Antecedents to Intelligence Responsiveness.
AVERAGE INTELLIGENCE
RESPONSIVENESS
R2 = 64.0%, Adjusted R2 = 62.2%, F-Statistic significant at 0.000 level
154

The resultant model is: I.R. = 3.310 + 0.179 x R.A - 0.299 x IDCN +
0.273 x ID CL - 0.449xCM+ 0.675x RSO.
The t values and significance levels corresponding to the factors included in the
model shows that all the factors are useful predictors of average intelligence
responsiveness. Thus the predictor variables in the model include top
management risk aversion, interdepartmental connectedness,
interdepartmental conflict, centralisation and reward system orientation. The
factors excluded from the chosen model, namely top management emphasis
and formalization, are not significant and are not useful predictors of the
dependent variable. Further, their partial correlation values are low.
It is seen that, contrary to the hypothesized relations, the interdepartmental
connectedness and conflict are both oppositely related to market
responsiveness.
7.2.2. Hypothesis 11:-
7.2.2.1 Antecedents determine the level of firms' overall market
orientation.
Here, the market orientation represents the unweighted average of all the three
constructs namely, intelligence generation, intelligence dissemination and
responsiveness to the information which was generated and disseminated.
155

Cliapter 7
This hypothesis involves seven sub-hypotheses, namely:
Market Orientation increases when, top management emphasis
increases, risk aversion decreases, interdepartmental
connectedness increases, interdepartmental conflict decreases,
formalization increases, centralization decreases and reward
system orientation increases.
The regression equation for market orientation is:
MARKOR = a + 61 X TME + 6 2 X RA + 6 3 x IDCN + 6 4 x IDCL+ 65
x FM + 66 x CN + 67 x RSO + ei
The table 6.3-4 illustrates the stepwise regression analysis for the above
hypotheses. The table shows that the significant predictors for the dependent
variable include top management emphasis, interdepartmental conflict,
centralisation and reward system orientation. This is consistent with Jaworski
and Kohli's study, which also additionally includes interdepartmental
connectedness. Sample I of the Jaworski & Kohli study includes centralisation,
but in Sample II of the same study, centralisation is deemed insignificant. The
table 6.3-4 represents the summary of the above regression analysis.
156

Table 7.2.2.1. Antecedents to Market Orientation .
Depenct~nt: .• Ig~~~~9tValiable$ . ,Standardized ,TValu8. Significaru::e '1 Variable:· Coefflcrent Beta Top Management 0.190 2.477 0.015
Emphasis Top Management Risk -0.059 ..Q.803 0.424 ... .... : ,Aversion .
AVERAGE Interdepartmental -0.043 -0.711 0.479
connectedness MARKET
.: Jnterdepartlllental' ORIENTATION 0~213 3.346 0.001 ,·conflict ......
Formalisation 0.117 1.663 0.099 ., .: Centralisation ........ -..0.422 ·.-5.635 •. 0.000
Reward System 0.709 8.241 0.000 Orientation
R2; 64.1%, Adjusted R2 = 62.7%, F-Statistic significant at .000 level
The four predictors account for 62.7% of the variance. The F-statistic is found
significant at the 0.000 level. Thus, the sub- hypotheses 1, 4, 6 and 7 are
supported, while hypotheses 2, 3 and 5 are rejected. Thus the estimated model,
which contains three independent factors, is as represented below-:
MARKOR = a + 0.190 x TME + 0.213 x IDCL - 0.422 x CN +
0.709 x RSO + ei
The top management emphasis and the reward systems are both positively
related and significant to market orientation, while the centralisation variable
is negatively related and significant to market orientation, as expected.
Another point of interest was that the interdepartmental connectedness was
157

negatively and insignificantly related to the dependent variable, while the
interdepartmental conflict was positively and significantly related. The
negative and significant value of the centralisation variable shows that a
decentralised mode of decision-making would help in fostering market
orientation, and that the top management needs to adopt a bottoms-up
approach and encourage and empower the employees to make decisions
regarding their work, so that they are motivated to do their best and are
committed to the goals of the organisation.
Although the positive relationship between the conflict variable and market
orientation is contrary to the findings of Jaworski and Kohli (1993), Pulendran
et al., (2000), SeInes et al., (1996) etc, support is found in a similar observation
has been made by Qu et al., (2002) in Chinese firms across two different
industries. Therefore hypothesis 7.2.2.1 is partially supported.
7.2.2.2. Summary of Stepwise Regression Analysis - Antecedents to
Market Orientation
A consolidated analysis of the regression results of the two hypotheses is given
below in the Table 7.2.2.2. The regression results of the relationships between
the independent variables, i.e. the antecedents and the dependent variables
158

namely intelligence generation, intelligence dissemination, responsiveness and
overall market orientation are shown in the following summary. The results
show only the relevant significant values of the standardized beta regression
coefficients.
Table 7.2.2.2. Summary of Step wise Regression Analysis - Antecedents
to Market Orientation- Anticipated and Obtained Results
od'· . '. d . t . i ,; Ov.e .. ra .. 1.I.Mark~t .; Intelligence Intelligence R . . I . J!"'~"'11 en." .'. ". '.. . espons veness V*rlables., •. "" ........ Orientation' 'Generation Dissemination Top Managemeni 0.190 0.284 0.254 Emphasis (+) (+) (+)
Connectedness
Formalisation
Reward System
Constant
~c[usted R:l (%) FtStatistic . S!gnificance
- NS 0.196 - NS (+) (+) (+)
+NS (-)
0.709 (+)
2.217 0.641··· .. 62.7% 46~001"'"
0.000
+ NS (-)
+NS (+)
1.484 0.113" 9.6%
.6.663 .. •···· 0.002
+ NS (-)
. -0.344 . {-} 0.642
(+)
1.842 0.565 55.3% 45.107 0.000
+NS (+)
..... O~179" (-f
-0.299 (+)
0.273 .. ,>/~, ....... . , ,-, ,. - NS (-)
0.675 {+} .... ' .. ,..
3.310 0.640 . 0.622 36;224 • 0.000
Anticipated Result in Parentheses; NS- Not significant; **p<O.Ol; **" p<O.OOl;
On reviewing the results of the stepwise regression analysis with respect to the
relationship between the antecedents and the market orientation in Indian
159

chapter 7
seafood processing firms, it is noted that the results show a marked
convergence to the existing market orientation literature. The only exceptions
relate to the antecedents of interdepartmental connectedness and conflict,
which show opposite relationship to market orientation. Each of the factors is
examined here individually.
1. Top management emphasis is important in the collection and sharing of
information, but it is insignificant in framing a response to the intelligence
generated. It also forms a significant variable of overall market orientation.
The relationships are all positive, as hypothesized.
2. Top management risk aversion has been hypothesized to be significant and
negative in all relationships to the constructs of market orientation and overall
market orientation. But the results show that, out of the three constructs of
market orientation, it is only significant in the responsiveness construct, where
it is positively related. It shows a negative but insignificant relationship in the
case of intelligence generation and intelligence dissemination.
3. Interdepartmental connectedness is hypothesized to have a positive effect
on all the four dependent variables. But the results demonstrate that all the
relationships with the exception of intelligence generation, are found to be
negatively related. The results are significant only in the case of intelligence
160

generation and responsiveness, whereas it is insignificant III intelligence
dissemination and overall market orientation.
4. Interdepartmental conflict is hypothesized to be negatively related to all the
four dependent variables. Existing literature also emphasizes the adverse effect
of conflict on all the marketing constructs. But this study shows that conflict is
positively related to overall market orientation and responsiveness. In the case
of intelligence generation and dissemination, the value of standardized beta
coefficient is positive but insignificant.
5. In the case of formalisation, the study corrobates the findings of Jaworski
and Kohli (1993), SeInes et al., (1996), Pulendran, Speed and Widing Jr.
(2000), and Shoham and Rose (2001), in that all of them reported insignificant
influence of formalisation on market orientation. The only difference was that
in this study formalisation showed positive but insignificant relation to overall
market orientation, intelligence generation and dissemination, while
responsiveness remained true to the hypothesis.
6. The antecedent centralisation, as hypothesized was found to have a
significant negative relation to all the dependent variables, except for
intelligence generation, where the /3 value was insignificant, although negative.
161

Cnapter7
Nevertheless, centralisation is an important factor affecting overall market
orientation.
7. The reward system orientation based on customer satisfaction, has the
highest B value for all the constructs. It has a positive relationship to all the
dependent variables, except intelligence generation. Reward system
orientation, as proposed by Jaworski & Kohli (1993) thus plays a very
important role in facilitating market orientation.
7.2.3 Hypothesis Ill: Market orientation significantly determines
level of Business Performance.
7.2.3.1. Market orientation significantly determines level of Overall
Business performance.
This is the most important objective of this thesis. This study thus attempts to
replicate the studies done by Kohli & Jaworski (1991) and Jaworski & Kohli
(1993). The postulate that improved business performance is the consequence
of implementing market orientation is tested here. The table 6.3.3.1 below
presents the results of the stepwise regression analysis for the major
consequence namely business performance. The table below shows that in the
Indian seafood industry, out of the three constructs of market orientation, the
162

intelligence generation and intelligence dissemination significantly determine
business performance, while responsiveness is insignificant.
Table 7.2.3.1.0verall Business Performance Consequence of Market
Orientation.
BUSINESS PERFORMANCE
.. ', Independent '.' ", Variables ,' .. " Intelligence Generation
. '. InteIUgence.'. ., : Dissemination·' Responsiveness
Standardized Coefficient Beta
0.402
.- '':0.216",.
-0.015
TValue Significance
4.248 0.000
2~286 0.024, '
-0.141 0.888
R2 = 29.5%, Adjusted R2 = 28.1%, F-Statistic significant at 0.000 level
The model explains 28% of the variance in business performance and is
significant at the 0.000 level. The table demonstrates that, of the three
constructs of market orientation, only the first two namely intelligence
generation and intelligence dissemination are significantly and positively
related to business performance. The third construct of responsiveness showed
an insignificant value and was hence dropped from the stepwise regression
analysis.
The table also holds that if keeping the intelligence dissemination constant,
one unit of intelligence generation is increased, there is also an increase in the
business performance by 0-402 units. Similarly a unit increase in intelligence
163

Cnapter'1
dissemination produces a 0.216 unit increase in business performance keeping
the intelligence generation variables constant.
This partially proves the original hypothesis that business performance in
Indian seafood firms will be increased, if the firms adopt market orientation.
7.2.3.2. Market orientation significantly determines level of
Economic Performance and Non-Economic Performance.
A further classification of the overall business performance into economic
performance and non-economic performance was done to study the impact of
market orientation on the respective performances. The economic business
performance comprised of five subjective measures namely, increase in
performance over last year, performance relative to major competitors, return
on investment relative to all competitors, sales of the firm relative to all
competitors last year, and the business performance relative to expected
outcomes last year. The table below shows the relationship between economic
business performance and market orientation.
164

Table 7.2.3.2.1. Economic Business Performance Consequence of
Market Orientation . r-~tillIqeJ)erld'~t:: .!;~: ::·I"d~p~nderlt . :Sta~c:I.,udiz~ ..
..
IfVetlue Significance ·::variable;:: ..... .:.;" Variables· . Coefficient Beta ' ". ",': '.
Intelligence 0.469 5.460 0.000 ECONOMIC Generation BUSINESS <·Intelligence ' , , ....
;0:182 ""0.856 PERFORMANCE 'Dissemination .0.018 , ,,,'
Responsiveness -0.060 -0.667 0.506
R2 = 22.0%, Adjusted R2 = 21.2%, F-Statistic significant at 0.000 level
From the table it is clear that only the intelligence generation is positively and
significantly related to and accounts for 21.2% of the variation in economic
business performance. The other two constructs have been removed from the
stepwise regression analysis, due to their insignificant contributions.
The non-economic performance measures included sixteen subjective
measures, which included scales on the customer satisfaction, repeat purchase
frequency, employee consequences, equity measures, environmental factors
affecting the job, introduction of new products, relative trend of product
pricing, material usage efficiency, labour efficiency, capital utilization
efficiency, environment protection awareness and market expansion.
165
C!iapter 7
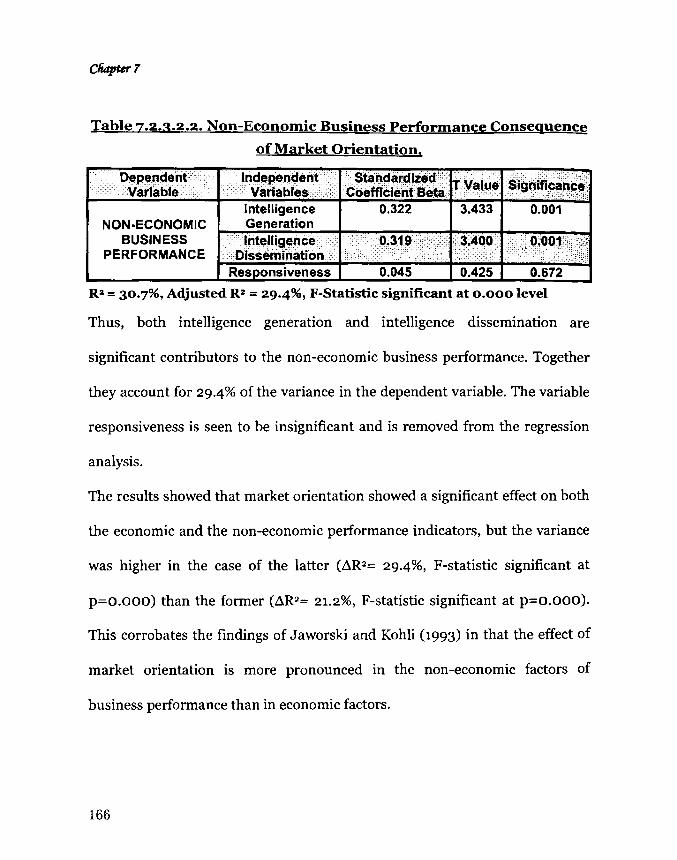
Table 7.2.3.2.2. Non-Economic Business Performance Consequence
of Market Orientation .
. Dependent· . . • Variable .':
NON·ECONOMIC BUSINESS
PERFORMANCE
IndepEmdent . Variable$·: Intelligence Generation
.• Stan~~r(;f~(F [r Vaill~ ~.)g"i.'fic:a .. ,·.',~,· .•. c .•. · .. • .•. ,.·,l.",.· CoefficientBeta.·· '......... . . .... 0.322 3.433 0.001
. . Intelligence. .. . ..•.. ·.'0.319··:! '3~400 • I" O;001j~c,.[ .. Dissemination: .•. ... >.: •.• ",:.:, .• ' : :<:::,:;
Responsiveness 0.045 0.425 0.672
R2 = 30.7%, Adjusted R2 ;;: 29.4%, F-Statistic significant at 0.000 level
Thus, both intelligence generation and intelligence dissemination are
significant contributors to the non-economic business performance. Together
they account for 29-4% of the variance in the dependent variable. The variable
responsiveness is seen to be insignificant and is removed from the regression
analysis.
The results showed that market orientation showed a significant effect on both
the economic and the non-economic performance indicators, but the variance
was higher in the case of the latter (~R2= 29-4%, F-statistic significant at
p=o.ooo) than the former (~R2= 21.2%, F-statistic significant at p=o.ooo).
This corrobates the findings of Jaworski and Kohli (1993) in that the effect of
market orientation is more pronounced in the non-economic factors of
business performance than in economic factors.
166

7.2.3.3. Market orientation significantly detennines level of Customer
Consequences.
This includes the measures of customer satisfaction and repeat customers.
Table 7.2.3.3. Customer Consequences of Market Orientation.
.. ··Dependent Independent Standard ized. TValue Significance liU.·:;;:: :Variable' '. Variables Coefficient Beta Intelligence 0.153 1.476 0.143
CUSTOMER Generation
. . .. Intelligence ...... '··0.370.: .. 4.104 0.000 '.
CONSEQUENCES :.Disseminatlc)O . -:. >, : .. :,. , '. '.
....
Responsiveness 0.199 1.732 0.086
R2 = 13.7%, Adjusted R2 = 12.9%, F-Statistic significant at .000 level
The table also reveals that intelligence dissemination accounts for 12. 9% of the
customer consequences (6=0.370, p=o.ooo). The other two constructs of
market orientation were removed from the regression analysis due to
insignificant contributions. Hence increasing a unit of intelligence
dissemination increases the benefits to consumers by 0.37 units.
7.2.3.4. Market orientation significantly determines level of
Employee Consequences.
The employee consequences include measures like employee commitment,
employee job satisfaction and job security, improvement in equity of the
company and improvement in training function.
167

Cliapter7
Table 7.2.3.4. Employee Consequences of Market Orientation .
. Dependent •. . ,:, Variable
EMPLOYEE CONSEQUENCES
Intelligence 0.010 0.098 0.922 Generation
'0:500· . 5.939. ..' O~OOQ '.' . .. :,,:,. ' ...•. :';.L c;.:
Intelljg'nce:. ,. Dissemirultion .'. ", .. ' .... : ....
Responsiveness -0.098 -0.908 0.366
R";;;;; 25.0%, Adjusted R" ;;;;; 24.3%, F-Statistic significant at 0.000 level
The result shows that only intelligence dissemination contributes to the
dependent variable employee consequences and accounts for 24.3% of its
variance.
7.2.3.5. Market orientation significantly detennines level of Customer
Retention Consequences.
In the Indian seafood processing industry it is seen that both intelligence
generation and intelligence responsiveness contribute to customer retention
significantly. Intelligence dissemination is seen to be removed from the
regression analysis as it is insignificant.
Table 7.2.3.5. Customer Retention Consequence of Market Orientation.
1:::t.~V:~~~=t .. :< 'In~:~:~~tnr: 6:~;~rer::~.:a ryalue. ~lij~Jf§~~~~ NUMBER OF
REPEAT CUSTOMERS INCREASING.
Intelligence 0.225 2.388 0.019 Generation
Intelligence... • . '.' .• :~(J .•.. ~f)~ ....•... ; '. .."O~04~.. '.' ..... O~968": '. Oissemln·ation.: .. , .".. . i..... .£
Responsiveness 0.240 2.547 0.012
R";;;;; 13.8%, Adjusted R2 ;;;;; 12.2%, F-Statistic significant at 0.000 level
168

The model accounts for 12% of the variance in the customer retention
consequence. While keeping intelligence generation constant, a unit increase in
responsiveness leads to an increase in customer retention by 0.24 units.
Similarly a unit increase in intelligence generation leads to a 0.225 unit
increase in customer retention.
7.2.3.6. Market Orientation Significantly Determines Level of
Introduction of New or Modified Products.
The construct of intelligence dissemination is seen to be the only significant
variable affecting the success rate in introduction of new or modified products.
The table 7.2.3.6 shows that intelligence dissemination accounts for 9% of
variance in the new product introduction success. The standardized regression
coefficient shows that for a unit increase in the intelligence dissemination, the
dependent variable increases by 0.312 units.
Table 7.2.3.6. Increasing Success in Introduction of new or
modified products Consequence of Market Orientation. ..
l.';;~ , : D~pendel)t·· ... Independent, •. > Standardized Signlfican~ : ~ ::~: -~' ... "[Value ".,:. " ::~Variable;: . Variables···· 6oefflci~mt Beta ....
SUCCESS RATE IN Intelligence 0.054 0.502 0.617 INTRODUCING NEW Generation
OR MODIFIED In~ellige.l1ce .... ··'·0;312 3.3:r~: .0.001· PRODUCTS Dissemination·
' '-';:<:';, .. ., .,
INCREASING Responsiveness 0.190 1.617 0.109
R:z = 9.7%, Adjusted R:z ;;:: 8.9%, F-Statistic significant at 0.001 level
169
Cliapter7
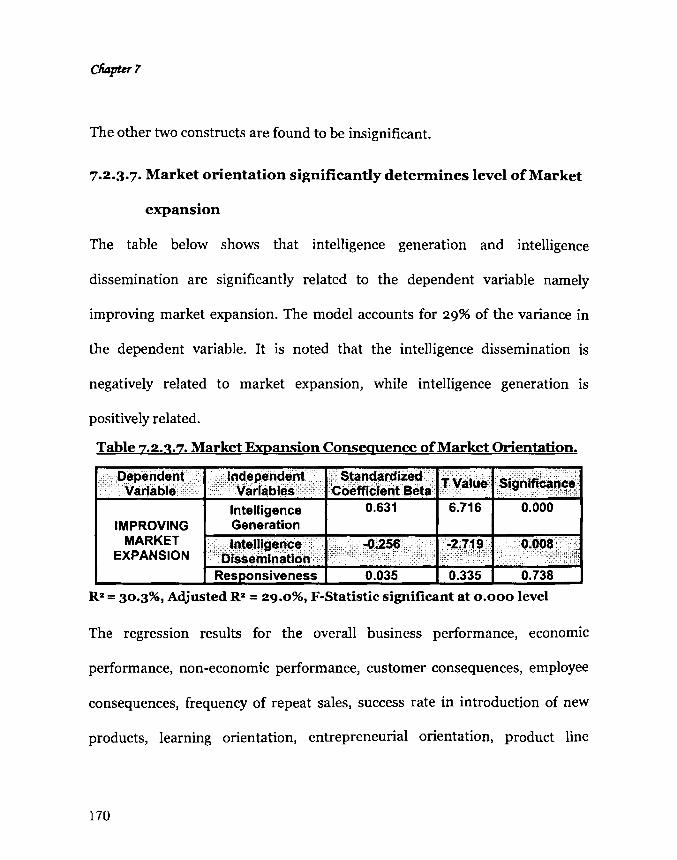
The other two constructs are found to be insignificant.
7.2.3.7. Market orientation significantly determines level of Market
expansion
The table below shows that intelligence generation and intelligence
dissemination are significantly related to the dependent variable namely
improving market expansion. The model accounts for 29% of the variance in
the dependent variable. It is noted that the intelligence dissemination is
negatively related to market expansion, while intelligence generation is
positively related.
Table 7.2.3.7. Market Expansion Consequence of Market Orientation.
·:~';')v~~~:.:~· > .. >II1~=~:~~~n~i):' :~:~~~reWt~!ta: f:.val\tei~ignifiba~~'r
IMPROVING MARKET
EXPANSION
Intelligence Generation
0.631 6.716 0.000
<lnteUigellc::e. ~.256 Diss~mination< :.,ii .... ·: ······:"~.r19
Responsiveness 0.035 0.335 0.738
R2 = 30.3%, Adjusted R2 = 29.0%, F-Statistic significant at 0.000 level
The regression results for the overall business performance, economic
performance, non-economic performance, customer consequences, employee
consequences, frequency of repeat sales, success rate in introduction of new
products, learning orientation, entrepreneurial orientation, product line
170

expansion and innovation consequences are all discussed below.
Table 7.2.3.8 Summary of Stepwise Regression Analysis -
Conseauences of Market Orientation ':':", :",,, ',' ,",' , ',.' ,Dependent, ... Standardized
T Significance R'
Adjusted Independent Variabl8$- , Coefficient ,; "
Variable ' Consequences ' ,Beta"
Value "
~
Overall Business 0.488 5.752 0.000 0.238 0.231 Perfonnance
Economic 0.315 3.420 0.001, 0.099 0.091 PerformanCe "
Non Economic 0.545 6.688 0.000 0.297 0.290 Perfonnance
Customer" ' , 0.452 >5.220 0.000 0.204 0.197
AVERAGE COnsequences'
MARKET Employee 0.453 5.230 0.000 0.205 0.198
ORIENTATION Consequences " Repeat Sales "'·0.345 ," 3.786< o.OOO,>c, 0;119 0.111 Success rate of 0.379 4.211 0.000 0.143 0.135 new products
Learning 0.677 9.464 0.000 0.458 0.453 OriEmtatioil
Entrepreneurial 0.675 9.419 0.000 0.456 0.450 Orientation
Pdt expansiOn ,,' , ,', '0.261 " :,' 2.782 0.006 0:068 ,0.059 Innovation 0.441 5.064 0.000 0.195 0.187
The results show that the market orientation accounts for 23% of the variation
in overall business performance i.e., there is a significant positive relationship
between market orientation and overall business performance in Indian
seafood processing finns. This proves the original hypothesis that business
performance in Indian seafood firms will be increased, if the firms adopt
market orientation (l3=O.488, p=o.OOO). This result is consistent with the
171

C!iapter 7
existing literature studies. Jaworski and Kohli (1990, 1993), Narver and Slater
(1990), Pulendran, et al.,(2000), Shoham and Rose (2001), SeInes et al.,
(1996) and Mehta and Joag (1981) all report that market orientation is
significantly and positively related to business performance.
7.2.4. Hypothesis IV
The Market orientation-business performance relationship is
moderated by environmental moderators like market turbulence,
technological turbulence and competitive intensity.
It is hypothesized that Business performance increases when, technological
turbulence decreases, market turbulence increases and competitive intensity
increases.
The regression equation for the above hypothesis is as follows:
Business Perfonnance = a + fit x MARKOR + lh x MKITURB + 6:J x
TECHnJRB + 6 4 x COMPINT + 6 s x MARKOR * MKITURB + & x
MARKOR * TECHTURB + ~x MARKOR * COMPINT + ei
Where MARKOR*MK1TURB=the multiplicative interactive term of market
turbulence, MARKOR*TECHTURB:::the multiplicative interactive term of
technological turbulence and MARKOR*COMPINT ::: the multiplicative
interactive term of competitive intensity.
172

The results of the studies on the effect of the moderators on the relationship
between market orientation and business performance has been cited
frequently in the market orientation literature, mainly by Kohli and Jaworski
(1990), Jaworski and Kohli (1993), Narver and Slater (1990), Slater and Narver
(1994a), Greenley (199Sb), SeInes et al., (1996), Pulendran et al., (2000) etc.
Jaworksi & Kohli (1993) found no effect of moderators, while Narver and Slater
(1994) reported limited effect of competitive environment on the market
orientation-business performance relationship. Greenley (1995) in his study
on the effect of market orientation on business perfonnance in the fonn of new
product success found that market turbulence and technological turbulence
had a negative effect on the market orientation and business performance
relationship. Pulendran, et al., (2000) report that market turbulence plays a
positive moderator role on the market orientation-business performance
relationship. The moderated regression analysis test as recommended by
Sharma et al., (1981) was used to test for moderators in the relationship
between market orientation and business performance.
7.3 Moderated Regression Analysis
The hypotheses are first tested with moderated regression analysis as proposed
by Sharma, Durand and Gur-Arie (1981). If the relationship is significant this
173
Cfi4pter7
suggests the presence of a moderator effect, conversely the absence of a
significant relationship leads to the next step wherein it is determined whether
the hypothesized moderator is related to either the predictor or criterion
variable.
According to the moderator regression analysis, Sharma, Dmand and Gm-Arie
(1981) propose that the following three equations be considered for equality of
regression coefficients (Zedeck, 1971):
y = a + b I x ---- (1)
y = a + bI x + b2z ---- (2)
y = a + bI x + b2 z+ b3xz ---- (3)
They classify hypothesized moderators into three namely, pure moderators,
homologizers and quasi moderators. If equations (2) and (3) are not
significantly different, Le., b3=o, b2 *o, then the variable z is not a moderator
variable instead an independent predictor variable. If z is a pure moderator
variable, then b2 =o, b3*o, Le. equations (1) and (2) are significantly similar,
but different from equation (3). Conversely it is a quasi moderator variable if
b2 *o, b3*o i.e. if all the three equations are significantly different from each
other.
Here it is seen that, in the case of market turbulence, b2 *o, b3=o. Therefore as
174
Sharma et al., (1981) advocate, market turbulence is not a moderator variable
instead is an independent predictor variable. Therefore it should be treated as
an independent predictor variable. Then the competitive intensity variable is a
pure moderator as the values for b2 =o, b3*o, pending further analysis as per
the framework proposed by Sharma et al., (1981).
The framework proposed by Sharma et al., (1981) for identifying moderator
variables, includes the following four steps:
1. Using the Moderated Regression Analysis (MRA) procedure to determine
whether any significant interaction exists between the hypothesized moderated
variable, z, and the market orientation variable. If a significant interaction
exists, they suggest proceeding to Step 2, and if not, proceeding to Step 3.
The stepwise regression results are given in the table below for the
relationships between the overall business performance, and the dependent
variables of:
(a) Market orientation,
(b) The hypothesized moderators namely, competitive intensity, market
turbulence and technological turbulence, and
(c) The multiplicative interaction terms of market orientation and
competitive intensity (MARKO R* COM PINT) , market orientation and market
175
Cliapter 7
turbulence (MARKOR*MKTTURB) and market orientation and technological
turbulence (MARKOR* TECHTURB).
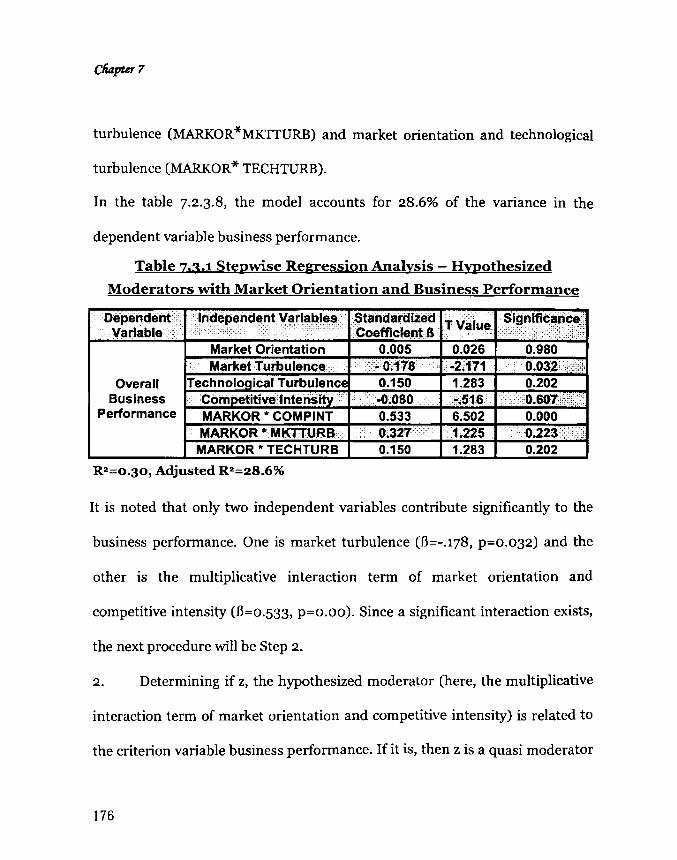
In the table 7.2.3.8, the model accounts for 28.6% of the variance in the
dependent variable business performance.
Table 7.3.1 Stepwise Regression Analysis - Hypothesized
Moderators with Market Orientation and Business Performance
.. Dependent 0 ·'Independent Variables ... StandardiZed TValue Signlfle~o~e.
.. Variable· ; ....
Coefficient B ,.';;.",: ":,;,:0-;,:":,
Market Orientation 0.005 0.026 0.980 . Market Turbulence , .. · .. ·0.178· -2.171 ... 0;032;,;<'1!,
Overall Technological Turbulence 0.150 1.283 0.202 Business " Competitive Intensity· ' .. ··..()~080 -~516 , '.0;607::: :;::::~;~
Performance MARKOR * COMPINT 0.533 6.502 0.000 .. MARKOR*' MKTTURB .. 0;327 1~225 .. • :o·0~223
. ... , ::,::<:;~
MARKOR * TECHTURB 0.150 1.283 0.202
It is noted that only two independent variables contribute significantly to the
business performance. One is market turbulence (6=-.178, P=0.032) and the
other is the multiplicative interaction term of market orientation and
competitive intensity (6=0.533, p=o.oo). Since a significant interaction exists,
the next procedure will be Step 2.
2. Determining if z, the hypothesized moderator (here, the multiplicative
interaction term of market orientation and competitive intensity) is related to
the criterion variable business performance. If it is, then z is a quasi moderator
176

variable, and if not, then z is a pure moderator. This is verified by conducting a
Pearson's correlation test among the variables.
Table 7.3.2. Correlation Analysis of the Hypothesized Moderators
with Market Orientation and Overall Business Performance.
·····Variables MARKOR OBP MKTTURB TECHTURB COMPINT MKTTURB -0.100 -0.133 1 0.649(**) 0.285{**)
•••• p= 0.152 0.085 - 0.000 0.001
TECHTURB 0.244{**) 0.150 0.649(**) 1 0.378{**) ... p~ . 0.005 0.061 0.000 - 0.000··· COMPINT 0.461(**) 0.365(**) 0.285(**) 0.378(**) 1
'.,:', p= 0.000 ·0.000· 0,001 0.000 -** Correlation is significant at the 0.01 level (i-tailed).
Competitive intensity shows significant relationship towards both market
orientation and business performance. Hence it is not a pure moderator;
instead it is a quasi moderator. Market turbulence shows no relationship to
either market orientation or business performance. Hence we next proceed to
Step 3.
3. Determining if z is related to the criterion variable - business performance
or the predictor variable - market orientation, if yes, then z is not a moderator,
instead an exogenous, predictor, intervening. antecedent or a suppressor
variable. If z is not related to either variable then they recommend proceeding
to Step 4.
Here, for those hypothesized moderators which did not yield significant results
177

CIi4pter7
in terms of their multiplicative interaction terms, namely market turbulence
and technological turbulence, it is determined whether they are related either
to the criterion variable or the predictor variable. It is noted from the
correlation test that technological turbulence is related to the predictor
variable market orientation, while market turbulence is not related to either of
them. Thus according to Sharma et al., (1981), it holds that technological
turbulence is not a moderator, while market turbulence needs to be checked to
see if it is a homologizer.
4. This step involves splitting the total sample into subgroups on the basis of
the hypothesized moderator variable based on the median or similar type of
split. Then a test of significance is to be done for differences across the
subgroups. If significant differences exist, z is a homologizer, operating
through the error term, if not, z is not a moderator and the analysis concludes.
AB described above, the subgroup analysis was conducted for testing presence
of homologizer by splitting the samples into two halves based on the median,
running correlation analysis and testing significance for differences between
the correlation coefficients for subgroups. The results for the subgroup analysis
shows that there is no difference between the two subgroups of market
turbulence. Thus market turbulence is not a homologizer.
178

Therefore, the only moderator variable mediating the relationship between
market orientation and business performance in the seafood industry is
competitive intensity. It is positively and significantly related to the market
orientation-business performance relationship.
7.4 Conclusions
• In Hypothesis 7.2.1.1, the sub-hypotheses 1 and 3 are supported.
• In Hypothesis 7.2.1.2, the sub-hypotheses 1,6 and 7 are supported.
• In Hypothesis 7.2.1.3, the sub-hypotheses 2,6 and 7 are supported. In
hypotheses 2,3 and 4 are not supported but are signigficant.
• In Hypothesis 7.2.2.1, the sub-hypotheses 1,6 and 7 supported, while
sub hypothesis 4 is significant, that is not supported.
• In Hypothesis 7.2.3.1, the sub-hypothesis 1 is suppotreted.
• In Hypothesis 7.2.3.2 the sub-hypotheses 1 and 2 are supported.
• In Hypothesis 7.2.3.3, the sub-hypothesis 2 is supported
• In Hypothesis 7.2.3.4 , the sub-hypothesis 2 is supported.
• In Hypothesis 7.2.3.5 J the sub-hypotheses 1 and 3 are supported
• In Hypothesis 7.2.3.6 J the sub-hypotheses 2 is supported
• In Hypothesis 7.2.3.7 , the sub-hypotheses 1 and 2 are supported.
• In Hypothesis 7.2.4 , the sub-hypotheses 3 is supported.
179

Cliapter7
This chapter thus examined the main hypotheses of the study and studied its
relevance in the light of the Indian seafood processing industry. The results of
the hypothesis testing are given below:
1. None of the antecedents are seen to significantly affect all the four
dependent variables namely, the three constructs of market orientation and the
overall market orientation.
2. The overall market orientation construct is affected by antecedents top
management emphasis, conflict, centralization and reward system.
3. Top Management Emphasis is antecedent to all the dependent variables
except responsiveness, while top management risk aversion is significant only
in case of responsiveness.
4. Interdepartmental connectedness is antecedent to intelligence generation
and responsiveness, but not for dissemination and overall market orientation.
Interdepartmental risk aversion is antecedent to both overall market
orientation and responsiveness, but it shows a positive significance to both,
instead of the hypothesized negative relationship.
5. Fonnalisation is not an antecedent to any of the dependent variables, while
centralization is antecedent to all the dependent variables except intelligence
generation.
180

6. Reward system orientation is seen as the most significant antecedent to all
the dependent variables except intelligence generation.
7. Among the hypothesized moderators, it is noted that only competitive
intensity is a moderator. An increase in the competitive intensity in the seafood
processing industry leads to a stronger relationship between market
orientation and business performance. Market turbulence and technological
turbulence have no impact on the relationship between market orientation and
business performance.
181