chapter 7 earnings and cash flow analysis - jan römanjanroman.dhis.org/finance/books notes thesises...
TRANSCRIPT

CHAPTER 7
Earnings and Cash Flow Analysis
Cash flow is a company’s lifeblood, and for a healthy company the primary
source of cash flow is earnings. Little wonder that security analysts are
obsessed with both. Their goal is to predict future earnings and cash flow. An
analyst who predicts well has a head start in knowing which stocks will go up
and which stocks will go down.
In the previous chapter, we examined some important concepts of stock analysis and
valuation. Here, we probe deeper into the topic of common stock valuation through an analysis of
earnings and cash flow. In particular, we focus on earnings and cash flow forecasting. This chapter,
will acquaint you with financial accounting concepts necessary to understand basic financial
statements and perform earnings and cash flow analysis using these financial statements. You may
not become an expert analyst yet - this requires experience. But you will have a grasp of the
fundamentals, which is a good start.
Unfortunately, most investors have difficulty reading financial statements and instead rely on
various secondary sources of financial information. Of course, this is good for those involved with
publishing secondary financial information. Bear in mind, however, that no one is paid well just for
reading such sources of financial information. By reading this chapter, you take an important step
toward becoming financial-statement literate, and an extra course in financial accounting is also
helpful. But ultimately you learn to read financial statements by reading financial statements! Like a
good game of golf or tennis, financial-statement reading skills require practice. If you have an
2 Chapter 7
aptitude for it, financial statement analysis is a skill worth mastering. Good analysts are paid well, but
good analysis is expected in return. Maybe you too can become one of the few, the proud - a financial
analyst.
7.1 Sources of Financial Information
Good financial analysis begins with good financial information. An excellent primary source
of financial information about any company is its annual report to stockholders. Most companies
expend considerable resources preparing and distributing annual reports. In addition to their
stockholders, companies also make annual reports available to anyone requesting a copy. A
convenient way to request copies of annual reports from several companies simultaneously is to use
the annual reports service provided by the Wall Street Journal. If you open the Journal to its daily
stock price reports, you will see a shamrock symbol Ê next to entries for many individual stocks. The
shamrock indicates that the company will send annual reports to readers through the Wall Street
Journal. Requests can be submitted by telephone or by fax.
The Internet is a convenient source of financial information about many companies. For
example, the New York Stock Exchange website (www.nyse.com) provides a directory of websites
for companies whose stock trades on the exchange. The content of company websites varies greatly,
but many provide recent quarterly or annual financial reports.
In addition to company annual reports, a wealth of primary financial information is available
to investors through the Securities and Exchange Commission. The SEC requires corporations with
publicly traded securities to prepare and submit financial statements on a regular basis. When
received, these documents are made available for immediate public access through the SEC’s

Earnings/Cash Flow Analysis 3
Electronic Data Gathering and Retrieval (EDGAR) archives. The EDGAR archives are accessible
free of charge through the Internet (www.sec.gov) and are an excellent source of timely financial
information.
(marg. def. 10K Annual company report filed with the SEC). 10Q Quarterly updatesof 10K filed with SEC. EDGAR Electronic archive of company filings with the SEC.)
The most important EDGAR document is the annual 10K report, often simply called the
"10K." Companies are required to submit an EDGAR-compatible 10K file to the SEC at the end of
each fiscal year. They are also required to file quarterly updates, called 10Qs. The 10Q is a mini-10K
filed each quarter, except when the 10K is filed. Every 10K and 10Q report contains three important
financial statements: a balance sheet, an income statement, and a cash flow statement. You must be
familiar with these three financial statements to analyze company earnings and cash flow.
(marg. def. balance sheet Accounting statement that provides a snapshot view of acompany’s assets and liabilities on a particular date.)
(marg. def. income statement Summary statement of a firm’s revenue and cash flowover a specific accounting period, usually a quarter or a year.)
(marg. def. cash flow statement Analysis of a firm’s sources and uses of cash overthe accounting period, summarizing operating, investing, and financing cash flows.)
7.2 Financial Statements
Financial statements reveal the hard facts about a company’s operating and financial
performance. This is why the SEC requires timely dissemination of financial statements to the public.
It’s also why security analysts spend considerable time poring over a firm’s financial statements
before making an investment recommendation. A firm’s balance sheet, the income statement, and cash
flow statement are essential reading for security analysts. Each of these interrelated statements offers

4 Chapter 7
a distinct perspective. The balance sheet provides a snapshot view of a company’s assets and liabilities
on a particular date. The income statement measures operating performance over an accounting
period, usually a quarter or a year, and summarizes company revenues and expenses. The cash flow
statement reports how cash was generated and where it was used over the accounting period.
Understanding the format and contents of these three financial statements is a prerequisite for
understanding earnings and cash flow analysis.
We begin by considering the basic structure and general format of financial statements through
a descriptive analysis of the balance sheet, income statement, and cash flow statement of a
hypothetical intergalactic company - the Borg Corporation.
(marg. def. asset Anything a company owns that has value. liability A firm's financialobligations. equity An ownership interest in the company.)
7.2a The Balance Sheet
Figure 7.1 presents year-end 2535 and 2536 balance sheets for Borg Corporation. The format
of these balance sheets is typical of that contained in company annual reports distributed to
stockholders and 10K filings with the SEC. Get used to the accounting practice of specifying
subtraction with parentheses and calculating subtotals while moving down a column of numbers. For
example, Borg's 2536 fixed assets section is reproduced below, with the left numerical column
following standard accounting notation and the right numerical column follows standard arithmetic
notation.

Earnings/Cash Flow Analysis 5
Fixed Assets: Accounting style Numeric style
Plant Facilities $35,000 $35,000Production Equipment 20,000 +20,000Administrative Facilities 15,000 +15,000Patents 10,000 +10,000Accumulated Depreciation (20,000) !20,000Total Fixed Assets $60,000 $60,000
Common to both numerical columns, an underline indicates that the numbers listed above should be
summed. However, accounting notation omits the plus "+" sign and subtraction is indicated by
parentheses "( )" instead of the more familiar minus "!" sign. Referring back to Figure 7.1, notice that
total fixed assets is a subtotal used to calculate total assets, which is indicated by a double underline.
With these conventions in mind, let us look over these sample balance sheets and try to become
familiar with their format and contents.

6 Chapter 7
Figure 7.1 Borg Corporation Balance Sheets, 2535 and 2536
Year 2536 Year 2535Current assets:
Cash $2,000 $1,356Accounts receivable $1,200 $1,200Prepaid expenses $500 $500Materials & supplies $300 $300Inventory $6,000 $6,000Total current assets $10,000 $9,356
Fixed assets:Plant facilities $35,000 $35,000Production equipment $20,000 $20,000Administrative facilities $15,000 $15,000Patents $10,000 $10,000Accumulated depreciation ($20,000) ($17,000)Total fixed assets $60,000 $63,000
Investments:Cardassian Mining
7% Preferred stock $10,000 $10,000Klingon Enterprises
Common stock $10,000Goodwill $5,000
Total investments $25,000 $10,000Other assets $5,000 $5,000Total assets $100,000 $87,356
Current liabilities:Short-term debt $10,000 $10,000Accounts payable $2,000 $2,000Leasing obligations $3,000 $3,000Total current liabilities $15,000 $15,000
Long-term debt $30,000 $20,000Other liabilities $5,000 $5,000Total liabilities $50,000 $40,000Stockholder equity:
Paid-in capital $10,000 $10,000Retained earnings $40,000 $37,356Total stockholder equity $50,000 $47,356
Total liabilities and equity $100,000 $87,356Shares outstanding 2,000 2,000Year-end stock price $40 $36
Earnings/Cash Flow Analysis 7
The Borg Corporation balance sheet has four major asset categories: current assets, fixed
assets, investments, and other assets. Current assets are cash or items that will be converted to cash
or be used within a year. For example, inventory will be sold, accounts receivable will be collected,
and materials and supplies will be used within a year. Cash is, or course, the quintessential current
asset. Fixed assets have an expected life longer than one year and are used in normal business
operations. Fixed assets may be tangible or intangible. Property, plant, and equipment are the most
common tangible fixed assets. Rights, patents, and licenses are common intangible assets. Except for
land, all fixed assets normally depreciate in value over time. Investments include various securities
held for investment purposes. Goodwill measures the premium paid over market value to acquire an
asset. For example, a company may pay $50 per share for stock with a market price of $40 per share
when acquiring a very large block of stock. Other assets include miscellaneous items not readily
fitting into any of the other asset categories. The sum of these four categories of assets is the firm’s
total assets
The Borg balance sheet has three major liability categories: current liabilities, long-term debt,
and other liabilities. Current liabilities normally require payment or other action within a one-year
period. These include accounts payable and accrued taxes. Long-term debt includes notes, bonds, or
other loans with a maturity longer than one year. Other liabilities include miscellaneous items not
belonging to any other liability category. Stockholder equity is the difference between total assets and
total liabilities. It includes paid-in capital, which is the amount received by the company from issuing
common stock, and retained earnings, which represent accumulated income not paid out as dividends
but instead used to finance company growth.

8 Chapter 7
A fundamental accounting identity for balance sheets states that assets are equal to liabilities
plus equity:
Assets = Liabilities + Equity. [1]
This identity implies that the balance sheet always “balances” because the left side is always equal in
value to the right side. If an imbalance occurs when a balance sheet is created, then an accounting
error has been made and needs to be corrected.
Financial analysts often find it useful to condense a balance sheet down to its principal
categories. This has the desirable effect of simplifying further analysis while still revealing the basic
structure of the company’s assets and liabilities. How much a balance sheet can be condensed and still
be useful is a subjective judgment of the analyst. When making this decision, recall Albert Einstein's
famous dictum: "Simplify as much as possible, but no more."
Figure 7.2 Borg Corporation Condensed Balance Sheet
Cash $2,000 Current liabilities $15,000Operating assets $8,000 Long-term debt $30,000Fixed assets $60,000 Other liabilities $5,000Investments $25,000Other assets $5,000 Stockholder equity $50,000Total assets $100,000 Total liabilities and equity $100,000
Figure 7.2 is a condensed version of Borg’s balance sheet that still preserves its basic
structure. Notice that current assets are reduced to two components, cash and operating assets. We
separate cash from operating assets for a good reason. Later, we show that net cash flow from the
cash flow statement is used to adjust cash on the balance sheet. This adjustment is more clearly
illustrated by first separating current assets into cash and operating assets.

Earnings/Cash Flow Analysis 9
CHECK THIS
7.2a What are some examples of current assets?
7.2b. What are some examples of fixed assets?
7.2c. What are some examples of current liabilities?
7.2d. Which accounts in Figure 7.1 show changes between 2535 and 2536 balance sheets?
Figure 7.3 Borg Corporation Condensed Income Statement
Net sales $90,000 $90,000Cost of goods sold (70,000) !70,000Gross profit $20,000 $20,000Operating expenses (13,000) !13,000Operating income $7,000 $7,000Investment income 700 +700Interest expense (2,000) !2,000Pretax income $5,700 $5,700Income taxes1 (2,056) !2,056Net income $3,644 $3,644Dividends (1,000) !1,000Retained earnings $2,644 $2,644
1. A tax rate of 40 percent applies to the total of Operating Income less InterestExpense plus the taxable 20% portion of preferred stock dividends, i.e., $7,000 -$2,000 + 20% × 7% × $10,000 = $5,140 and 40% × $5,140 = $2,056.
(marg. def. net income The difference between a company's revenues and expenses,used to either pay dividends to stockholders or kept as retained earnings within thecompany to finance future growth.)
7.2b The Income Statement
Figure 7.3 is a condensed income statement for Borg Corporation. The left column follows
standard accounting notation and the right column follows familiar arithmetic notation. Of course,
the right column would not appear in an actual financial statement and is included here for

10 Chapter 7
1 Actually, the exclusion is either 70 or 80 percent depending on how much of anothercompany’s stock is held.
convenience only. This income statement reports revenues and expenses for the corporation over a
one-year accounting period. Examine it carefully and be sure you are familiar with its top-down
structure.
The income statement begins with net sales, from which cost of goods sold (COGS) is
subtracted to yield gross profit. Cost of goods sold represents direct costs of production and sales;
that is, costs that vary directly with the level of production and sales. Next, operating expenses are
subtracted from gross profit to yield operating income. Operating expenses are indirect costs of
administration and marketing; that is, costs that do not vary directly with production and sales.
In addition to operating income from its own business operations, Borg Corporation has
investment income from preferred stock dividends. Adding this investment income and then
subtracting interest expense on debt yields pretax income. Finally, subtracting income taxes from
pretax income yields net income. Net income is often referred to as the “bottom line” because it is
normally the last line of the income statement. In this example, however, we have added dividends
and retained earnings information, items that often appear in a separate financial statement. To avoid
a separate statement, we here show that Borg Corporation paid dividends during the year. The sum
of dividends and retained earnings is equal to net income:
Net Income = Dividends + Retained Earnings. [2]
The footnote to Figure 7.3 explains that only 20 percent of preferred stock dividends are
taxable. This feature of the federation tax code allows a company to exclude 80 percent of dividends
received from another company from federal income tax.1 In this case, Borg receives $700 in

Earnings/Cash Flow Analysis 11
dividends from Cardassian Mining and pays taxes on only $140 (20 percent) of this amount.
Assuming a 40 percent tax rate, the actual tax amount is $56 = 40% × $140.
CHECK THIS
7.2e. What is cost of goods sold (COGS)?
7.2f. What is the difference between gross profit and operating income?
7.2g. What is the difference between net income and pretax income?
7.2h. What is meant by retained earnings?
(marg. def. cash flow Income realized in cash form.)
(marg. def. noncash items Income and expense items not realized in cash form.)
7.2c The Cash Flow Statement
The cash flow statement reports where a company generated cash and where cash was used
over a specific accounting period. The cash flow statement assigns all cash flows to one of three
categories: operating cash flows, investment cash flows, or financing cash flows.
Figure 7.4 Borg Corporation Condensed Cash Flow Statement
Net Income $3,644 $3,644Depreciation 3,000 +3,000Operating Cash Flow $6,644 $6,644Investment Cash Flow1 ($15,000) !15,000Financing Cash Flow2 $9,000 +9,000Net Cash Increase $644 $644
1. December 2536 purchase of 50 percent interest in Klingon Enterprises for $15,000(including $5,000 goodwill).2. Issue of $10,000 par value 8 percent coupon bonds, less a $1,000 dividend payout.

12 Chapter 7
Figure 7.4 is a condensed cash flow statement for Borg Corporation. (This is the last
appearance of both accounting and arithmetic notation.) The cash flow statement begins with net
income, which is the principal accounting measure of earnings for a corporation. However, net
income and cash flow are not the same and often deviate greatly from each other. A primary reason
why income differs from cash flow is that income contains noncash items. For example, depreciation
is a noncash expense that must be added to net income when calculating cash flow. Adjusting net
income for noncash items yields operating cash flow.
(marg. def. operating cash flow Cash generated by a firm’s normal businessoperations.)
(marg. def. investment cash flow Cash flow resulting from purchases and sales offixed assets and investments.)
(marg. def. financing cash flow Cash flow originating from the issuance orrepurchase of securities and the payment of dividends.)
Operating cash flow is the first of three cash flow categories reported in the cash flow
statement. The second and third categories are investment cash flow and financing cash flow.
Investment cash flow includes any purchases or sales of fixed assets and investments. For example,
Borg's purchase of Klingon Enterprises common stock reported in footnote 1 is an investment cash
flow. Financing cash flow includes any funds raised by an issuance of securities or expended by a
repurchase of outstanding securities. In this example, Borg’s $10,000 debt issue and $1,000 dividend
payout reported in footnote 2 are examples of financing cash flows.
Standard accounting practice specifies that dividend payments to stockholders are financing
cash flows, whereas interest payments to bondholders are operating cash flows. One reason is that
dividend payments are discretionary, while interest payments are mandatory. Also, interest payments

Earnings/Cash Flow Analysis 13
are tax-deductible expenses, but dividend payouts are not tax deductible. In any case, interest
payments are cash expenses reported on the income statement. Since they are cash expenses, they do
not appear in the cash flow statement to reconcile the difference between income and cash flow.
The sum of operating cash flow, investment cash flow, and financing cash flow yields the net
change in the firm’s cash. This change is the “bottom line” of the cash flow statement and reveals how
much cash flowed into or out of the company’s cash account during an accounting period.
CHECK THIS
7.2i. What is the difference between net income and operating cash flow?
7.2j. What are some noncash items used to calculate operating cash flow?
7.2k. What is the difference between an investment cash flow and a financing cash flow?
7.2l. What is meant by net increase in cash?
7.2m. Can you explain why a cash item like interest expense does not appear on the cash flow
statement?

14 Chapter 7
(marg. def. return on assets (ROA) Net income stated as a percentage of totalincome.)
(marg. def. return on equity (ROE) Net income stated as a percentage ofstockholder equity.)
7.2d Performance Ratios and Price Ratios
Annual reports and 10Ks normally contain various items of supplemental information about
the company. For example, certain profitability ratios may be reported to assist interpretation of the
company's operating efficiency. For Borg Corporation, some standard profitability ratios are
calculated as follows.
Ratio Formula Calculation
Gross margin Gross profit / Net sales $20,000 / $90,000 = 22.2%
Operating margin Operating income / Net sales $7,000 / $90,000 = 7.8%
Return on assets (ROA) Net income / Total assets $3,644 / $100,000 = 3.64%
Return on equity (ROE) Net income / Stockholder equity $3,644 / $50,000 = 7.29%
Notice that return on assets (ROA) and return on equity (ROE) are calculated using current year-
end values for total assets and stockholder equity. It could be argued that prior-year values should
be used for these calculations. However, standard practice calls for the use of current year-end values.
Annual reports and 10Ks may also report per-share calculations of book value, earnings, and
operating cash flow, respectively. Per-share calculations require the number of common stock shares

Earnings/Cash Flow Analysis 15
outstanding. Borg's balance sheet reports 2,000 shares of common stock outstanding. Thus for Borg
Corporation, these per-share values are calculated as follows.
Ratio Formula Calculation
Book value per share(BVPS)
Stockholder equity / Shares outstanding
$50,000 / 2,000= $25
Earnings per share(EPS)
Net income / Shares outstanding
$3,644 / 2,000= $1.82
Cash flow per share(CFPS)
Operating cash flow / Shares outstanding
$6,644 / 2,000= $3.32
Notice that cash flow per share (CFPS) is calculated using operating cash flow - NOT the bottom line
on the cash flow statement! Most of the time when you hear the term "cash flow," it refers to
operating cash flow.
Recall that in the previous chapter, we made extensive use of price ratios to analyze stock
values. Using per-share values calculated immediately above, and Borg's year-end stock price of $40
per share, we get the following price ratios:
Ratio Formula Calculation
Price-book(P/B)
Stock price / BVPS $40 / $25 = 1.6
Price-earnings(P/E)
Stock price / EPS $40 / $1.82 = 22
Price-cash flow(P/CF)
Stock price / CFPS $40 / $3.32 = 12
We use these price ratios later when assessing the potential impact of a sales campaign on Borg
Corporation's future stock price.

16 Chapter 7
CHECK THIS
7.2n. What is the difference between gross margin and operating margin?
7.2m. What is the difference between return on assets (ROA) and return on equity (ROE)?
7.2o. What is the difference between earnings per share (EPS) and cash flow per share (CFPS)?
7.2p. How is cash flow per share (CFPS) calculated?
(marg. def. pro forma financial statements Statements prepared using certainassumptions about future income, cash flow, and other items. Pro forma literallymeans according to prescribed form.)
7.3 Financial Statement Forecasting
In December 2536, Borg publicly announced the completed acquisition of a 50 percent
financial interest in Ferengi Traders. However, half the acquired shares do not carry voting rights, so
the acquisition is treated as a simple investment on the balance sheet. The stated purpose of the
acquisition was to expand sales outlets. Complementing the acquisition, Borg also announced plans
for a marketing campaign to increase next year’s net sales to a targeted $120,000. As a Borg analyst,
you must examine the potential impact of these actions. You immediately contact Borg management
to inquire about the details of the acquisition and the marketing campaign. Armed with this additional
information, you decide to construct pro forma financial statements for Borg Corporation for the year
2537. You also decide to formulate your analysis by considering two scenarios: an optimistic sales
scenario and a pessimistic sales scenario. Under the optimistic scenario, the marketing campaign is
successful and targeted Net Sales of $120,000 are realized with an assumed cost of goods sold of
$90,000. Under the pessimistic scenario, only $100,000 of net sales are realized with a cost of goods
sold of $80,000. Operating expenses will be $17,000 under both scenarios, reflecting the costs of the

Earnings/Cash Flow Analysis 17
marketing campaign. The appropriate sequence for your analysis is to construct pro forma income
statements, then pro forma cash flow statements, followed by pro forma balance sheets.
Figure 7.5 Borg Corp. Pro Forma Income Statements
Scenario: Optimistic Pessimistic
Net Sales $120,000 $100,000Cost of Goods Sold (90,000) (80,000)Gross Profit $30,000 $20,000Operating Expenses (17,000) (17,000)Operating Income $13,000 $3,000Investment Income1 2,200 700Interest Expense2 (2,800) (2,800)Pretax Income $12,400 $900Income Taxes3 (4,136) (136)Net Income $8,264 $764Dividends4 $1,000 $1,000Retained Earnings $7,264 ($236)
1. Preferred stock dividends of $700 plus $1,500 investment income from FerengiTraders under optimistic sales results and $0 under pessimistic sales results, i.e.,$700 + $1,500 = $2,200.2. Prior-year interest expense of $2,000 plus payment of 8 percent coupons on theDecember 2536 debt issue of $10,000, i.e., $2,000 + 8% × $10,000 = $2,800.3. Tax rate of 40 percent applied to the sum of Operating Income less InterestExpense plus the 20% taxable portion of preferred stock dividends, i.e., ($13,000 - $2,800 + 20% × 7% × $10,000) × 40% = $4,136.4. Assumes no change in dividends from prior year.
7.3a The Pro Forma Income Statement
Figure 7.5 contains side-by-side pro forma income statements for Borg Corporation
corresponding to optimistic and pessimistic sales scenarios in the coming year. These begin with the
assumed net sales and cost of goods sold values for both scenarios. They then proceed with the
standard top-down calculations of income where several calculation methods and additional

18 Chapter 7
assumptions are explained in footnotes. The optimistic sales scenario produces a net income of
$8,264, of which $1,000 is paid as dividends and $7,264 is kept as retained earnings. Under the
pessimistic sales scenario net income is only $764, with $1,000 of dividends and -$236 of retained
earnings.
Footnote 1 explains that investment income is $2,200 under optimistic sales and $700 under
pessimistic sales. This reflects constant preferred stock dividends of $700 and assumed noncash
investment income from Ferengi Traders of $1,500 under optimistic sales and $0 under pessimistic
sales. The difference in scenario investment incomes stems from the fact that Ferengi is involved with
the sales campaign.
Footnote 3 explains that taxes are paid on operating income less interest expense plus the
taxable portion of preferred stock dividends. Notice that Borg's noncash investment income from
Ferengi Traders is not taxed because Ferengi paid no dividends. In this situation, Borg records the
value of its investment in Ferengi as its share of Ferengi's stockholder equity value. Thus when
Ferengi adds retained earnings to its equity value, Borg records its share of the addition as noncash
income and changes the balance sheet value of its investment in Ferengi accordingly. The next step
of your analysis is construction of pro forma cash flow statements.
CHECK THIS
7.3a. Create a pro forma income statement for Borg Corporation corresponding to pessimistic sales
results assuming noncash investment losses of $1,000.
Earnings/Cash Flow Analysis 19
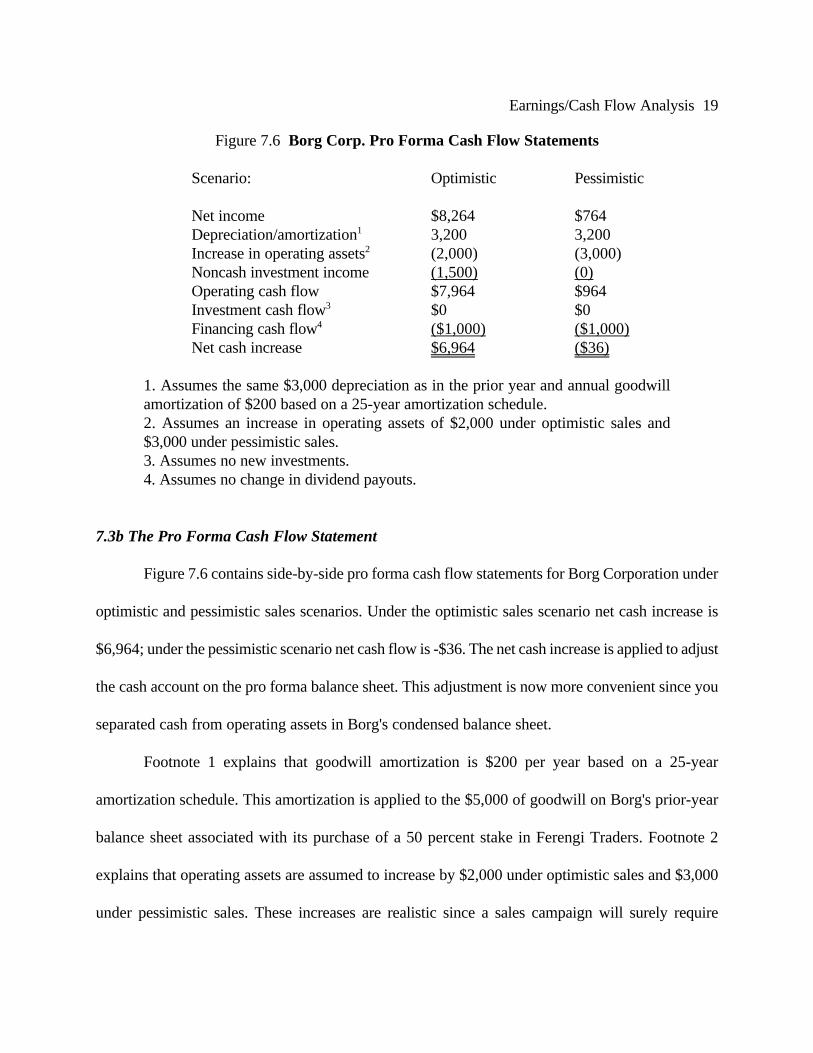
Figure 7.6 Borg Corp. Pro Forma Cash Flow Statements
Scenario: Optimistic Pessimistic
Net income $8,264 $764Depreciation/amortization1 3,200 3,200Increase in operating assets2 (2,000) (3,000)Noncash investment income (1,500) (0)Operating cash flow $7,964 $964Investment cash flow3 $0 $0Financing cash flow4 ($1,000) ($1,000)Net cash increase $6,964 ($36)
1. Assumes the same $3,000 depreciation as in the prior year and annual goodwillamortization of $200 based on a 25-year amortization schedule.2. Assumes an increase in operating assets of $2,000 under optimistic sales and$3,000 under pessimistic sales.3. Assumes no new investments.4. Assumes no change in dividend payouts.
7.3b The Pro Forma Cash Flow Statement
Figure 7.6 contains side-by-side pro forma cash flow statements for Borg Corporation under
optimistic and pessimistic sales scenarios. Under the optimistic sales scenario net cash increase is
$6,964; under the pessimistic scenario net cash flow is -$36. The net cash increase is applied to adjust
the cash account on the pro forma balance sheet. This adjustment is now more convenient since you
separated cash from operating assets in Borg's condensed balance sheet.
Footnote 1 explains that goodwill amortization is $200 per year based on a 25-year
amortization schedule. This amortization is applied to the $5,000 of goodwill on Borg's prior-year
balance sheet associated with its purchase of a 50 percent stake in Ferengi Traders. Footnote 2
explains that operating assets are assumed to increase by $2,000 under optimistic sales and $3,000
under pessimistic sales. These increases are realistic since a sales campaign will surely require

20 Chapter 7
additional inventory. The increase is bigger under pessimistic sales because more inventory goes
unslod. Your next step is to create the pro forma balance sheet for Borg Corporation.
CHECK THIS
7.3b. Create a pro forma cash flow statement for Borg Corporation under pessimistic sales results
assuming noncash investment losses of $1,000.
Figure 7.7 Borg Corporation Pro Forma Balance Sheets
Scenario: Optimistic Pessimistic
Cash1 $8,964 $1,964Operating assets2 10,000 11,000Fixed assets3 57,000 57,000Investments4 26,300 24,800Other assets 5,000 5,000Total assets $107,264 $99,764
Current liabilities $15,000 $15,000Long-term debt 30,000 30,000Other liabilities 5,000 5,000Stockholder equity5 57,264 49,764Total liabilities and equity $107,264 $99,764
1. Prior-year cash of $2,000 plus $6,964 net cash flow from the pro forma cash flowstatement.2. Prior-year operating assets of $8,000 plus an additional $2,000 under optimistic sales and$3,000 under pessimistic sales.3. Prior-year fixed assets of $60,000 less the assumed $3,000 depreciation.4. Prior-year investments of $25,000 plus noncash investment income of $1,500 underoptimistic sales only less $200 goodwill amortization.5. Prior-year equity of $50,000 plus $7,264 retained earnings from the pro forma incomestatement.

Earnings/Cash Flow Analysis 21
7.3c The Pro Forma Balance Sheet
Figure 7.7 contains side-by-side pro forma balance sheets for Borg Corporation as they might
result from optimistic and pessimistic sales scenarios. This balance sheet is created by starting with
the prior-year condensed balance sheet and then making the following adjustments consistent with
the pro forma income statements and cash flow statements.
1. Cash of $2,000 is adjusted by net cash increase of $6,964 under the optimistic salesscenario and -$36 under the pessimistic sales scenario.
2. Current assets of $8,000 are increased by $2,000 under the optimistic sales scenarioand increased by $3,000 under the pessimistic sales scenario.
3. Fixed assets of $60,000 are adjusted by depreciation of $3,000, which is the sameunder both sales scenarios.
4. Investments of $25,000 are increased by the assumed noncash investment incomefrom Ferengi Traders of $1,500 under optimistic sales and $0 under pessimistic sales,less $200 of goodwill amortization. As noted earlier, the difference by scenario isbased on the fact that Ferengi is involved with the sales campaign.
5. Equity of $50,000 is adjusted for retained earnings of $7,264 under optimistic salesand -$236 under pessimistic sales.
All other accounts remain unchanged, which is a simplifying assumption made to focus attention on
the immediate impact of the sales campaign.
CHECK THIS
7.3c. Create a pro forma balance sheet for Borg under a pessimistic sales scenario assuming
noncash investment losses of $1,000.
22 Chapter 7
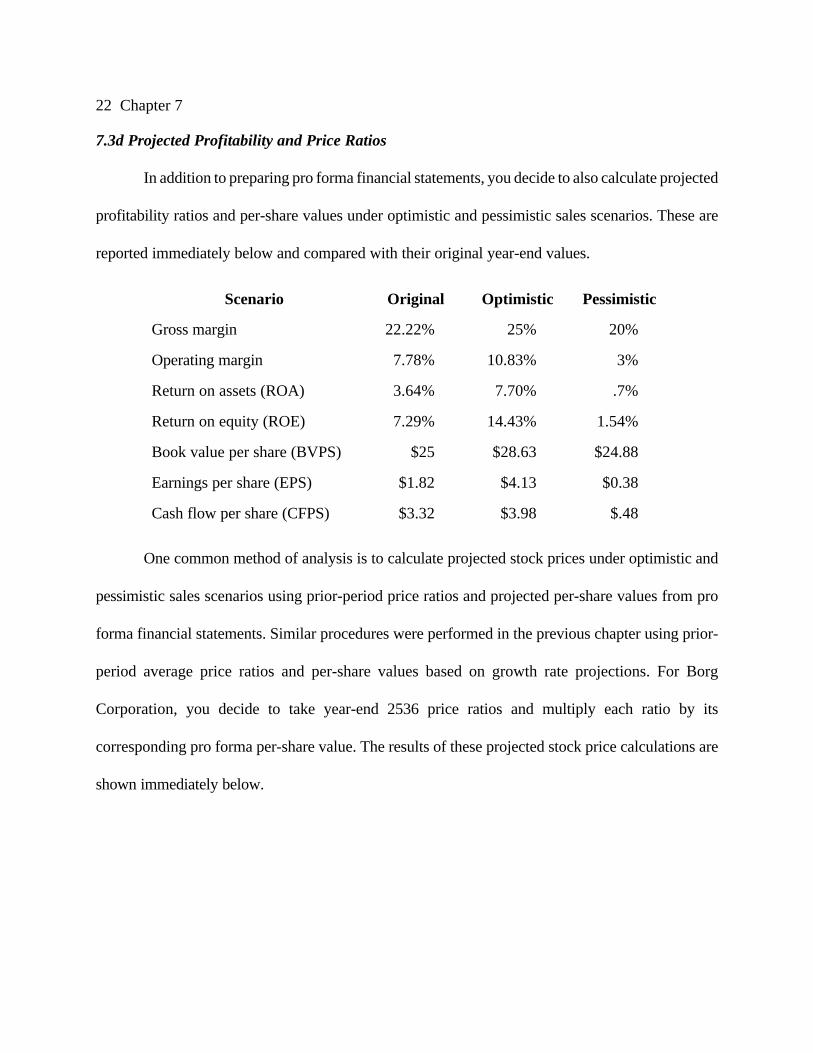
7.3d Projected Profitability and Price Ratios
In addition to preparing pro forma financial statements, you decide to also calculate projected
profitability ratios and per-share values under optimistic and pessimistic sales scenarios. These are
reported immediately below and compared with their original year-end values.
Scenario Original Optimistic Pessimistic
Gross margin 22.22% 25% 20%
Operating margin 7.78% 10.83% 3%
Return on assets (ROA) 3.64% 7.70% .7%
Return on equity (ROE) 7.29% 14.43% 1.54%
Book value per share (BVPS) $25 $28.63 $24.88
Earnings per share (EPS) $1.82 $4.13 $0.38
Cash flow per share (CFPS) $3.32 $3.98 $.48
One common method of analysis is to calculate projected stock prices under optimistic and
pessimistic sales scenarios using prior-period price ratios and projected per-share values from pro
forma financial statements. Similar procedures were performed in the previous chapter using prior-
period average price ratios and per-share values based on growth rate projections. For Borg
Corporation, you decide to take year-end 2536 price ratios and multiply each ratio by its
corresponding pro forma per-share value. The results of these projected stock price calculations are
shown immediately below.

Earnings/Cash Flow Analysis 23
Projected stock prices
Scenario Optimistic Pessimistic
BVPS × P/B $45.81 $39.81
EPS × P/E $90.86 $8.36
CFPS × P/CF $47.76 $5.76
These projected stock prices reflect widely varying degrees of sensitivity to optimistic and pessimistic
sales scenario outcomes. For example, projected prices based on EPS and CFPS are especially
sensitive to which scenario is realized. On the other hand, projected stock prices based on BVPS are
far less sensitive to scenario realization.
Which projected stock price is correct? Well, it clearly depends on which sales scenario is
realized and which price ratio the financial markets will actually use to value Borg Corporation's
stock. This is where experience and breadth of knowledge count immensely. Of course no one can
make perfectly accurate predictions, but the analyst's job is to expertly assess the situation and make
an investment recommendation supported by reasonable facts and investigation. But some analysts
are better than others. Like professional baseball players, professional stock analysts with better
batting averages can do well financially.
7.4 Adolph Coors Company Case Study
After carefully reading the analysis of Borg Corporation, you should have a reasonably clear
picture of how earnings and cash flow analyses might proceed using pro forma financial statements.
To further illustrate the use of pro forma financial statements in earnings and cash flow analysis, this

24 Chapter 7
section presents an analysis based on the 1995 financial statements for Adolph Coors Company.
Using data for a real company provides a real challenge (You didn’t believe Borg was real?).
This section begins with a review of Coors 1995 financial statements. We then proceed to
analyze the effects on earnings and cash flow that might result from product sales either rising or
falling by 10 percent. The analysis is similar to that for Borg Corporation, but there are a few
important differences. Amounts shown are in thousands of dollars (except earnings per share).
Figure 7.8 Adolph Coors Company 1995 Balance Sheet
Cash and cash equivalents $32,386Operating assets 330,134Property, plant, equipment 887,409Goodwill 26,470Other assets 110,458Total assets $1,386,857
Current liabilities $323,663Long-term debt 195,000Other liabilities 173,178Total liabilities $691,841
Paid-in capital $43,726Retained earnings 651,290Total shareholder equity $695,016
Total liabilities and equity $1,386,857

Earnings/Cash Flow Analysis 25
Figure 7.9 Adolph Coors Company 1995 Income Statement
Net sales $1,675,379Cost of goods sold (1,091,763)Gross profit $583,616Operating expenses (503,688)Operating income $79,928Other income 3,868Net interest expense (10,518)Pretax income $73,278Income tax 30,100Net income $43,178Earnings per share $1.13Shares outstanding 38,170
Figure 7.10 Adolph Coors Company 1995 Cash Flow Statement
Net income $43,178Depreciation and amortization 122,830Loss on Sale of properties 1,274Change in deferred taxes (1,744)Changes in operating assets (19,122)Changes in current liabilities (56,319)Operating cash flow $90,097
Net additions to properties ($101,349)Changes in other assets (14,823)Investing cash flow ($116,172)
Issuance/redemption of long-term debt $56,000Issuance/purchase of stock (5,819)Dividends paid (19,066)Other financing (116)Financing cash flow $30,999
Net cash increase $4,924Net cash increase after foreigncurrency translation adjustment $5,218
26 Chapter 7
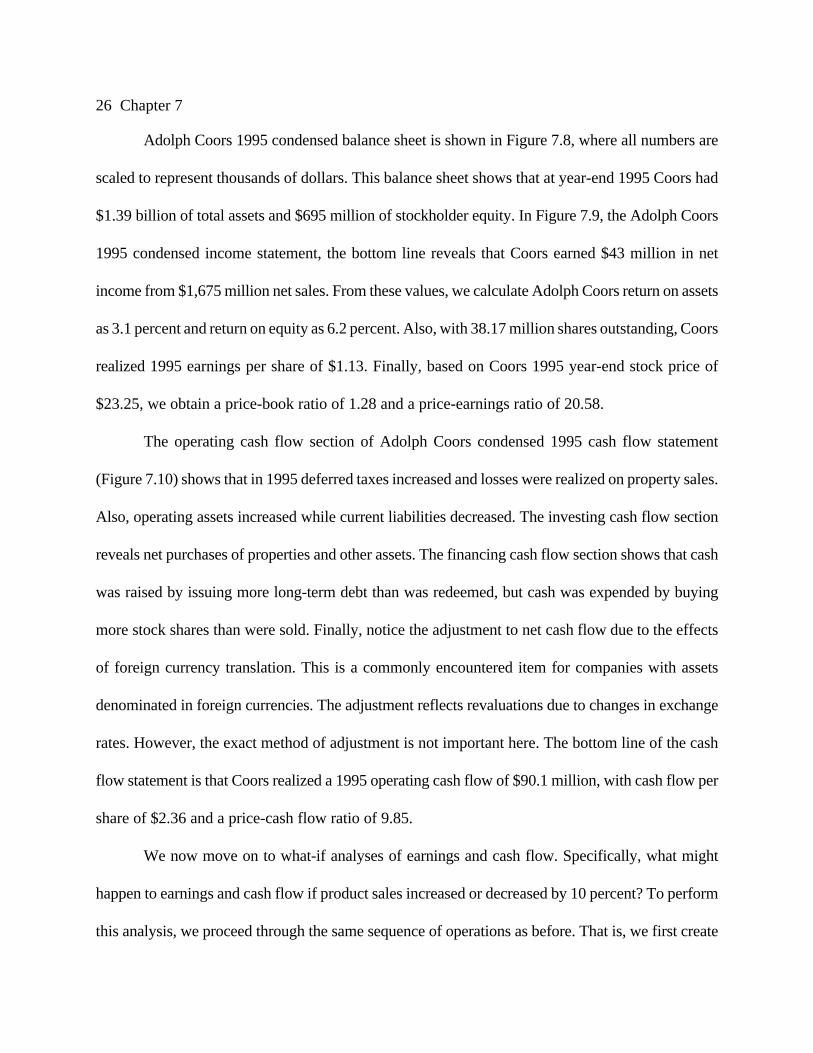
Adolph Coors 1995 condensed balance sheet is shown in Figure 7.8, where all numbers are
scaled to represent thousands of dollars. This balance sheet shows that at year-end 1995 Coors had
$1.39 billion of total assets and $695 million of stockholder equity. In Figure 7.9, the Adolph Coors
1995 condensed income statement, the bottom line reveals that Coors earned $43 million in net
income from $1,675 million net sales. From these values, we calculate Adolph Coors return on assets
as 3.1 percent and return on equity as 6.2 percent. Also, with 38.17 million shares outstanding, Coors
realized 1995 earnings per share of $1.13. Finally, based on Coors 1995 year-end stock price of
$23.25, we obtain a price-book ratio of 1.28 and a price-earnings ratio of 20.58.
The operating cash flow section of Adolph Coors condensed 1995 cash flow statement
(Figure 7.10) shows that in 1995 deferred taxes increased and losses were realized on property sales.
Also, operating assets increased while current liabilities decreased. The investing cash flow section
reveals net purchases of properties and other assets. The financing cash flow section shows that cash
was raised by issuing more long-term debt than was redeemed, but cash was expended by buying
more stock shares than were sold. Finally, notice the adjustment to net cash flow due to the effects
of foreign currency translation. This is a commonly encountered item for companies with assets
denominated in foreign currencies. The adjustment reflects revaluations due to changes in exchange
rates. However, the exact method of adjustment is not important here. The bottom line of the cash
flow statement is that Coors realized a 1995 operating cash flow of $90.1 million, with cash flow per
share of $2.36 and a price-cash flow ratio of 9.85.
We now move on to what-if analyses of earnings and cash flow. Specifically, what might
happen to earnings and cash flow if product sales increased or decreased by 10 percent? To perform
this analysis, we proceed through the same sequence of operations as before. That is, we first create

Earnings/Cash Flow Analysis 27
a pro forma income statement, then a pro forma cash flow statement, and finally a pro forma balance
sheet.
Figure 7.11 Adolph Coors Company Pro Forma 1996 Income Statements
Sales growth (%) +10% -10%Net sales $1,842,917 $1,507,841Cost of goods sold1 (1,200,939) (982,587)Gross profit $641,978 $525,254Operating expenses* (503,688) (503,688)Operating income $138,290 $21,566Other income 3,868 3,868Net interest expense (10,518) (10,518)Pretax income $131,640 $14,916Income tax2 (53,972) (6,116)Net income $77,668 $8,800Dividends 19,066 19,066Retained earnings 58,602 (10,266)Earnings per share $2.03 $0.23Shares outstanding 38,170 38,170
1. Assumes a constant 1995 gross margin, which implies that cost of goods soldchanges by the same ±10% as net sales.2. Assumes a constant 1995 average tax rate of 41 percent.* Italics indicate items with constant 1995 values.
Pro forma income statements corresponding to a 10 percent increase and a 10 percent
decrease in net sales and cost of goods sold for Coors are shown in Figure 7.11. For convenience,
italics indicate items for which constant 1995 values are used. The ±10 percent changes in net sales
and cost of goods sold cause gross profit to increase and decrease by 10 percent also. However, since
operating expenses are assumed to be a constant 1995 value across the two sales scenarios, operating
income varies considerably. Carrying forward 1995 other income and net interest expense yields
pretax incomes that vary significantly across sales scenarios. By assuming the same average tax rate
28 Chapter 7
as in 1995, we obtain net income values across both sales scenarios. Then, letting 1995 dividends
continue unchanged, we get positive and negative pro forma retained earnings values. These retained
earnings values from the pro forma income statement will be used to adjust cumulative retained
earnings on the pro forma balance sheet. But first we take these pro forma net income values as
starting points to create pro forma cash flow statements.
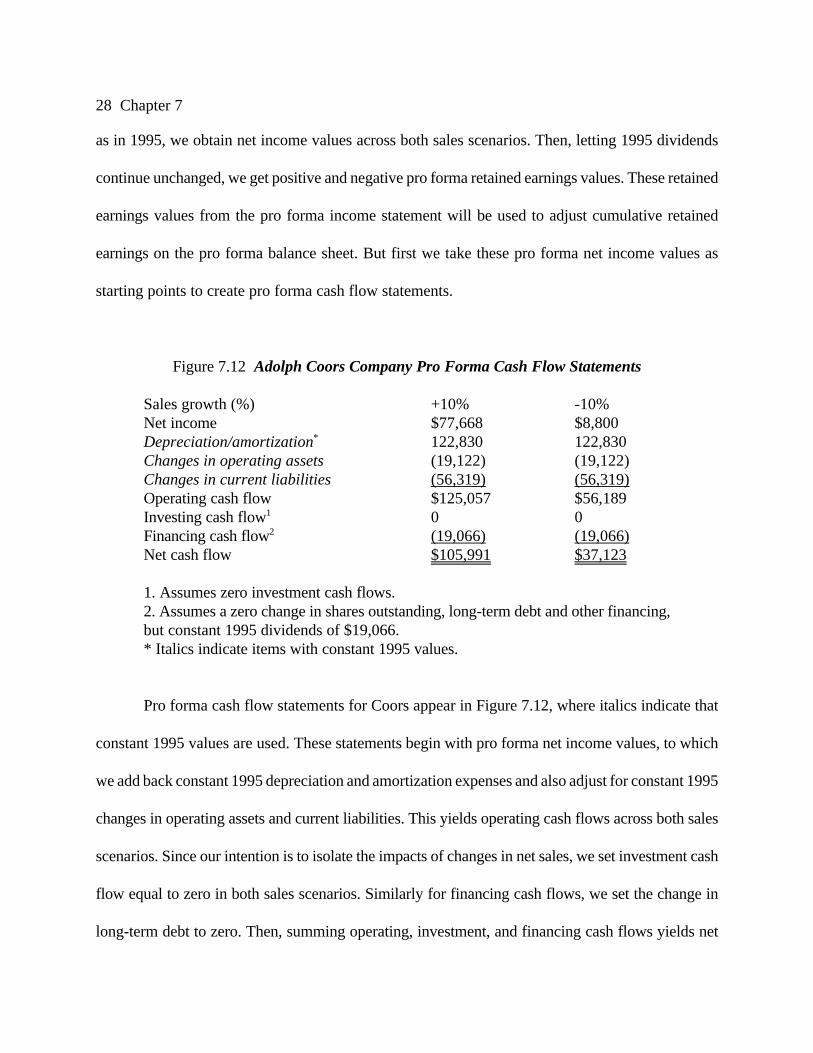
Figure 7.12 Adolph Coors Company Pro Forma Cash Flow Statements
Sales growth (%) +10% -10%Net income $77,668 $8,800Depreciation/amortization* 122,830 122,830Changes in operating assets (19,122) (19,122)Changes in current liabilities (56,319) (56,319)Operating cash flow $125,057 $56,189Investing cash flow1 0 0Financing cash flow2 (19,066) (19,066)Net cash flow $105,991 $37,123
1. Assumes zero investment cash flows.2. Assumes a zero change in shares outstanding, long-term debt and other financing,but constant 1995 dividends of $19,066.* Italics indicate items with constant 1995 values.
Pro forma cash flow statements for Coors appear in Figure 7.12, where italics indicate that
constant 1995 values are used. These statements begin with pro forma net income values, to which
we add back constant 1995 depreciation and amortization expenses and also adjust for constant 1995
changes in operating assets and current liabilities. This yields operating cash flows across both sales
scenarios. Since our intention is to isolate the impacts of changes in net sales, we set investment cash
flow equal to zero in both sales scenarios. Similarly for financing cash flows, we set the change in
long-term debt to zero. Then, summing operating, investment, and financing cash flows yields net

Earnings/Cash Flow Analysis 29
cash increases for the two sales scenarios. Since currency translation effects are unrelated to sales,
we exclude them from our analysis. Now, we move on to the pro forma balance sheets.
Figure 7.13 Adolph Coors Company Pro Forma Balance Sheet
Sales growth (%) +10% -10%Cash $138,377 $69,509Operating assets1 349,256 349,256Property, plant, equipment2 767,226 767,226Goodwill 23,823 23,823Other assets* 110,458 110,458Total assets $1,389,140 $1,320,272
Current liabilities3 $267,344 $267,344Long-term debt 195,000 195,000Other liabilities 173,178 173,178Total liabilities $635,522 $635,522
Paid-in capital $43,726 $43,726Retained earnings 709,892 641,024Total shareholder equity $753,618 $684,750
Total liabilities and equity $1,389,140 $1,320,272
1. 1995 Operating assets of $330,134 plus an increase of $19,1222. Depreciation and amortization of $122,830 is allocated as $2,647 of amortization(10 percent of 1995 goodwill) and $120,183 of depreciation.3. 1995 Current liabilities of $323,663 less $56,319.* Italics indicate items with constant 1995 values.
To create Coors pro forma balance sheets as in Figure 7.12, the first two steps should be:
1. Adjust retained earnings on the balance sheet with retained earnings from the
income statement.
2. Adjust cash on the balance sheet with net cash increase from the cash flow
statement.

30 Chapter 7
Since retained earnings and the net cash increase are not equal, at this point the balance sheets will
not balance. However, all items making up the difference between retained earnings and the net cash
increase appear on the cash flow statement. Therefore, all subsequent adjustments will come from the
cash flow statement. In this example, two adjustments are needed.
First, property, plant, and equipment and goodwill accounts must be adjusted to reflect
depreciation and amortization. For realistic detail, notice that constant 1995 depreciation and
amortization of $122,830 is allocated in 1996 as $2,647 of amortization (10 percent of 1995
goodwill) and $120,183 of depreciation as follows.
1995 Property, plant, and equipment $887,4091996 Depreciation (120,183)1996 Property, plant, and equipment $767,226
1995 Goodwill $26,4701996 Amortization (2,647)1996 Goodwill $23,823
Since depreciation and amortization are part of the difference between retained earnings and net cash
flow, these adjustments move the balance sheet closer to balancing. Second, the operating assets line
is increased by $19,122 and current liabilities decreased by $56,319. This brings the balance sheet to
a complete balance.
To complete the analysis of Adolph Coors, projected profitability ratios and per-share values
under increased and decreased sales scenarios are reported immediately below and compared with
their original year-end 1995 values.
Earnings/Cash Flow Analysis 31
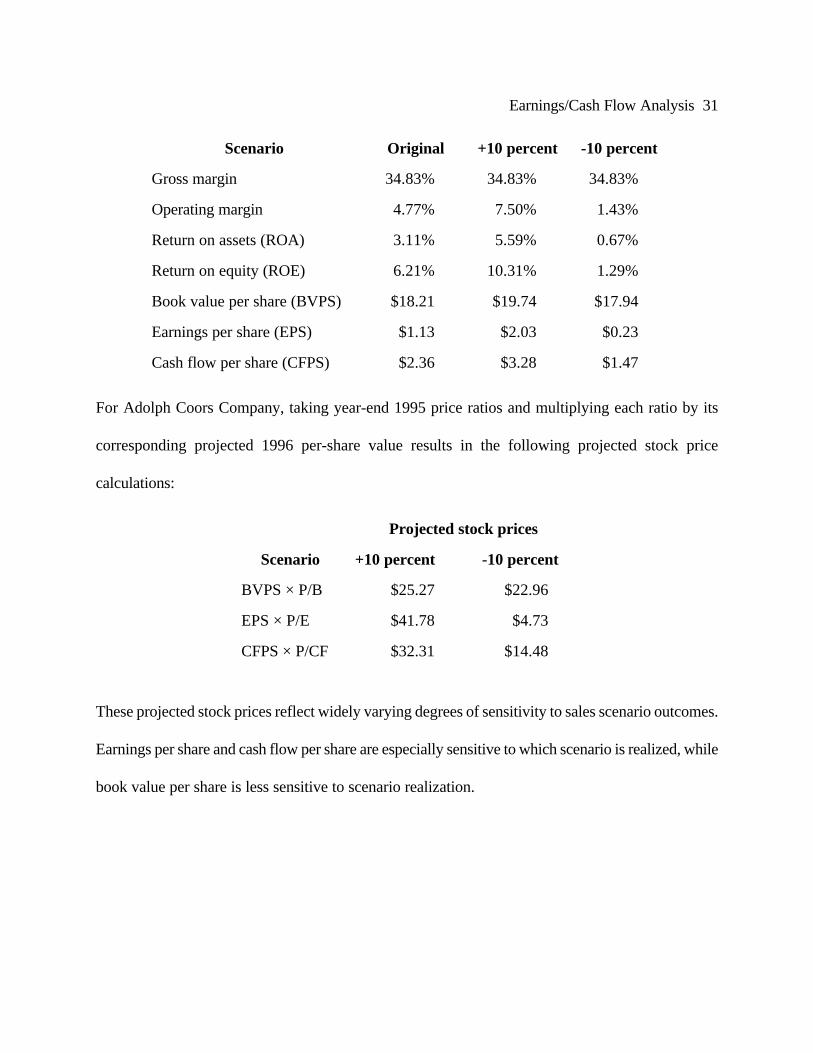
Scenario Original +10 percent -10 percent
Gross margin 34.83% 34.83% 34.83%
Operating margin 4.77% 7.50% 1.43%
Return on assets (ROA) 3.11% 5.59% 0.67%
Return on equity (ROE) 6.21% 10.31% 1.29%
Book value per share (BVPS) $18.21 $19.74 $17.94
Earnings per share (EPS) $1.13 $2.03 $0.23
Cash flow per share (CFPS) $2.36 $3.28 $1.47
For Adolph Coors Company, taking year-end 1995 price ratios and multiplying each ratio by its
corresponding projected 1996 per-share value results in the following projected stock price
calculations:
Projected stock prices
Scenario +10 percent -10 percent
BVPS × P/B $25.27 $22.96
EPS × P/E $41.78 $4.73
CFPS × P/CF $32.31 $14.48
These projected stock prices reflect widely varying degrees of sensitivity to sales scenario outcomes.
Earnings per share and cash flow per share are especially sensitive to which scenario is realized, while
book value per share is less sensitive to scenario realization.

32 Chapter 7
7.5 Summary and Conclusions
This chapter focuses on earnings and cash flow analysis using financial statement information.
Several important aspects of financial statements and their use were covered. These are summarized
as follows.
1. A primary source of financial information is a company's annual report. In addition, the annual10K report and quarterly 10Q updates filed with the SEC are available from the EDGARarchives.
2. Three financial statements are essential reading for securities analysts: the balance sheet, theincome statement, and the cash flow statement.
3. The balance sheet has three sections: assets, which are used to generate earnings; liabilities,which are financial obligations; and equity representing ownership claims. A fundamentalaccounting identity for balance sheets states that assets are equal to liabilities plus equity:
Assets = Liabilities + Equity.
4. The balance sheet has four major asset categories: current assets, fixed assets, investments,and other assets.
5. The balance sheet has three major liability categories: current liabilities, long-term debt, andother liabilities.
6. The income statement reports revenues and expenses. Income is used to pay dividends orretained to finance future growth. Net income is the “bottom line” for a company.
7. The cash flow statement reports how cash was generated and where it was used. The cashflow statement assigns all cash flows to one of three categories: operating cash flow,investment cash flow, or financing cash flow. The sum of operating cash flow, investmentcash flow, and financing cash flow yields the net cash increase.
8. Profitability ratios based on financial statement information are often reported to assistinterpretation of a company's operating efficiency. Some standard profitability ratios arecalculated as follows.
Gross margin = Gross profit / Net salesOperating margin = Operating income / Net salesReturn on assets (ROA) = Net income / Total assetsReturn on equity (ROE) = Net income / Stockholder equity

Earnings/Cash Flow Analysis 33
9. Annual reports and 10Ks may also report per-share calculations of book value, earnings, andoperating cash flow, respectively. These per-share values are calculated as follows:
Book value per share (BVPS) = Stockholder equity / Shares outstandingEarnings per share (EPS) = Net Income / Shares outstandingCash flow per share (CFPS) = Operating cash flow / Shares outstanding
Dividing the common stock price by the preceding per-share values, we get the followingprice ratios:
Price-book ratio (P/B) = Stock price / BVPSPrice-earnings ratio (P/E) = Stock price / EPSPrice--Cash flow ratio (P/CF) = Stock price / CFPS
10. One common method of analysis is to calculate projected stock prices using prior-period priceratios and projected per-share values from pro forma financial statements. These projectedstock prices are calculated as follows.
BVPS × P/B = Projected price based on pro forma book valueEPS × P/E = Projected price based on pro forma earningsCFPS × P/CF = Projected price based on pro forma cash flow
Key terms
EDGAR asset
10K, 10Q liability
balance sheet equity
income statement income
cash flow statement retained earnings
cash flow operating cash flow
noncash items investing cash flow
financing cash flow pro forma financial statements

34 Chapter 7
This chapter builds on the preceding chapter by going deeper into earnings and cash flow, twoof the most important tools of fundamental analysis. It focuses on using financial statementinformation to develop pro forma numbers to use in stock valuation. How should you, as aninvestor or investment manager, put this information to work?
The answer is you need to get your fingers dirty! Financial statement information is easy to get,either on the web through EDGAR (or any number of other sources) or through the mail,using, for example, The Wall Street Journal’s statement service. As with all forms of financialanalysis, the only way to gain experience is through practice. Nowhere is that more true thanthe examination of financial statements. The only way to learn to read with a expert eye isstudy a large number of them.
To get started, pick a stock that you like, perhaps because it appears cheap based on our lastchapter, and examine its financial statements. Follow this chapter’s Coors analysis to do this.When you are finished, you will have created your own pro forma statements, and you willhave an idea of the possible range of values for the stock price next year. Does the stock stilllook cheap?
As you read a company’s financial statements, an important exercise is to try to understandwhat each number really represents. Why is it there? Is it a cash or market value? Or is it justan accounting number (like depreciation)? Financial analysts spend a great deal of time“adjusting” the numbers on financial statements, trying to make them correspond more closelyto current market conditions than to historical costs.
Get Real!

Earnings/Cash Flow Analysis 35
Chapter 7Earnings and Cash Flow Analysis
End of Chapter Questions and Problems
Review Problems and Self-Test
1. Margin calculations Use the following income statement for McGwire-Sosa Lumber Co.to calculate gross and operating margins.
McGwire-Sosa Limber 1999 Income Statement
Net sales $4,000Cost of goods sold (3,200)Gross profit $800Operating expenses (200)Operating income $600Other income 40Net interest expense ( 60)Pretax income $580Income tax 232Net income $348Earnings per share $1.74
Recent price $38.28

36 Chapter 7
2. Return calculations Use the following balance sheet for McGwire-Sosa Lumber Co. alongwith the income statement in the previous question to calculate return on assets and returnon equity.
McGwire-Sosa Lumber 1999 Balance Sheet
Cash and cash equivalents $ 200Operating assets 200Property, plant, and equipment 1,580Other assets 108Total assets $2,088
Current liabilities $ 370Long-term debt 306Other liabilities 20Total liabilities $696
Paid-in capital $ 300Retained earnings 1,092Total shareholder equity $1,392
Total liabilities and equity $2,088
3. Pro forma income statements Prepare a pro forma income statement for McGwire-SosaLumber Co. assuming a 5 percent increase in sales. Based only on the pro forma incomestatement, what is the projected stock price (hint: what is the price-earnings ratio?).
Answers to Self-Test Problems
1. Gross margin is $800/$4,000 = 20%Operating margin is $600/$4,000 = 15%.
2. Return on asssets is $348/$2,088 = $16 b.Return on equity is $348/$1,392 = 25%.
3. With 5 percent sales growth, sales will rise to $4,000 from $4,200. The pro forma incomestatement follows. A constant gross margin is assumed, implying that Cost of Goods Sold willalso rise by 5 percent. A constant tax rate of 40 percent is used. Items in italics are carriedover unchanged.

Earnings/Cash Flow Analysis 37
McGwire-Sosa Lumber pro forma 2000 Income Statement
Net sales $4,200Cost of goods sold (3,360)Gross profit $840Operating expenses (200)Operating income $640Other income 40Net interest expense ( 60)Pretax income $620Income tax 248Net income $372Earnings per share $1.86
To get a projected stock price, notice that the price-earnings ratio was $38.28/$1.74 = 22.Using this ratio as a benchmark, the pro forma earnings of $1.86 imply a stock price of22 × $1.86 = $40.92.
Test Your IQ (Investments Quotient)
1. Cash flow Cash flow per share is calculated as
a. net cash flow / shares outstandingb. operating cash flow / shares outstandingc. investing cash flow / shares outstandingd. financing cash flow / shares outstanding
2. Cash flow Which of the following is not an adjustment to net income used to obtainOperating Cash Flow?
a. changes in operating assetsb. changes in current liabilitiesc. loss on sale of assetsd. dividends paid
3. Financial ratios Which of the following profitability ratios is incorrect?
a. Gross margin = Gross profit / Cost of goods soldb. Operating margin = Operating income / Net salesc. Return on assets = Net income / Total assetsd. Return on equity = Net income / Stockholder equity

38 Chapter 7
4. Financial ratios Which of the following per-share ratios is incorrect?
a. Book value per share = Total assets / Shares outstandingb. Earnings per share = Net income / Shares outstandingc. Cash Flow per share = Operating cash flow / Shares outstandingd. Dividends per share = Dividends paid / Shares outstanding
5. Stock repurchase A company repurchase of common stock outstanding has which of thefollowing effects on the balance sheet?
a. an increase in shares outstandingb. an increase in stockholder equityc. a decrease in paid-in capitald. a positive investment cash flow
Use the following raw data to answer the next four questions:
Net income $8Depreciation/amortization $2Repurchase of outstanding common stock $5Issuance of new debt $9Sale of property $6Purchase of equipment $7Dividend payments $2
6. Cash flow analysis Operating cash flow is
a. $10b. $8c. $6d. $15
7. Cash flow analysis Investing cash flow is
a. $1b. $(1)c. $6d. $(6)

Earnings/Cash Flow Analysis 39
8. Cash flow analysis Financing cash flow is
a. $4b. $(4)c. $2d. $(2)
9. Cash flow analysis Net cash flow is
a. $9b. $10c. $11d. $12
Use the following financial data to answer the next three questions:
Cash payments for interest $(12)Retirement of common stock $(32)Cash payments to merchandise suppliers $(85)Purchase of land $( 8)Sale of equipment $ 30Payments of dividends $(37)Cash payment for salaries $(35)Cash collection from customers $260Purchase of equipment $(40)
10. Cash flow analysis Cash flows from operating activities are (1994 CFA exam)
a. $91b. $128c. $140d. $175
11. Cash flow analysis Cash flows from investing activities are (1994 CFA exam)
a. $(67)b. $(48)c. $(18)d. $(10)

40 Chapter 7
12. Cash flow analysis Cash flows from financing activities are (1994 CFA exam)
a. $(81)b. $(69)c. $(49)d. $(37)
13. Cash flow analysis A firm has net sales of $3,000, cash expenses (including taxes) of$1,400 and depreciation of $500. If accounts receivable increase over the period by $400,cash flow from operations equals (1994 CFA exam)
a. $1,200b. $1,600c. $1,700d. $2,100
14. Cash flow analysis A firm using straight-line depreciation reports gross investment in fixedassets of $80 million, accumulated depreciation of $45 million, and annual depreciationexpense of $5 million. The approximate average age of fixed assets is (1994 CFA exam)
a. 7 yearsb. 9 yearsc. 15 yearsd. 16 years
15. Preferred dividends What proportion of preferred stock dividends received by acorporation is normally exempt from federal income taxation?
a. 25 percentb. 50 percentc. 80 percentd. 100 percent
Questions and Problems
Core Questions
1. 10K and 10Q What are the 10K and 10Q reports? Who are they filed by? What do theycontain? Who are they filed with? What is the easiest way to retrieve one?
2. Financial Statements In very broad terms, what is the difference between an incomestatement and a balance sheet?

Earnings/Cash Flow Analysis 41
3. Current Events What makes current assets and liabilities “current?” Are operating assets“current?”
4. Income and EPS What is the relationship between net income and earnings per share (EPS)?
5. Noncash Items Why do we say depreciation is a “noncash item”?
6. Cash Flow What are the three sections on a standard cash flow statement?
7. Operating cash flow In the context of the standard cash flow statement, what is operating cashflow?
8. Pro formas What is a pro forma financial statement?
9. Retained earnings What is the difference between the “retained earnings” number on theincome statement and the balance sheet?
10. Gross! What is the difference between gross margin and operating margin? What do they tellus? Generally speaking, are larger or smaller values better?
11. More Gross Which is larger, gross margin or operating margin? Can either be negative? Canboth?
12. Dividends and Taxes Are dividends paid a tax-deductible expense to the paying company?Suppose a company receives dividends from another. How are these taxed?
Intermediate Questions
13. Cash Flows The bottom line on a standard cash flow statement is calculated how? Whatexactly does it represent?
14. Cash Flow Cash flow per share is a commonly evaluated number. How is it conventionallycomputed?
15. Retained Earnings Take a look at the Balance Sheet for Coors (Figure 7.8). On it, retainedearnings are about $651 million. How do you interpret this amount? Does it mean that Coors has$651 million in cash available to spend?

42 Chapter 7
Use the following financial statement information to answer the next four questions. Amounts are inthousands of dollars (except number of shares and price per share):
Dixie Chickens 2000 Balance Sheet
Cash and cash equivalents $100Operating assets 300Property, plant, and equipment 800Other assets 40Total assets $1,240
Current liabilities $100Long-term debt 400Other liabilities 20Total liabilities $520
Paid-in capital $ 30Retained earnings 690Total shareholder equity $720
Total liabilities and equity $1,240
Dixie Chickens 2000 Income Statement
Net sales $2,480Cost of goods sold (1,660)Gross profit $820Operating expenses (600)Operating income $220Other income 90Net interest expense ( 70)Pretax income $240Income tax (96)Net income $144Earnings er share $1.20
Shares outstanding 120,000Recent price $24

Earnings/Cash Flow Analysis 43
Dixie Chickens 2000 Cash Flow Statement
Net income $144Depreciation and amortization 100Changes in operating assets (50)Changes in current liabilities 40Operating cash flow $234
Net additions to properties $(200)Changes in other assets (40)Investing cash flow $(240)
Issuance/redemption of long-term debt $94Dividends paid (72)Financing cash flow $22
Net cash increase $16
16. Calculating Margins Calculate the gross and operating margins for Dixie Chickens:
17. Calculating Profitability Measures Calculate ROA and ROE for Dixie Chickens. How doyou interpret these ratios?
18. Calculating Per Share Measures Calculate the price=book, price-earnings, and price-cashflow ratios for Dixie Chickens.
19. Pro forma Financial Statements Following the Coors example in the chapter, prepare a proforma income statement, balance sheet, and cash flow statement for Dixie Chickens assuminga 10 percent increase in sales.
20. Projected Share Prices Based on the previous two questions, what is the projected stockprice assuming a 10 percent increase in sales?
44 Chapter 7
Chapter 7Earnings and Cash Flow Analysis
Answers and solutions
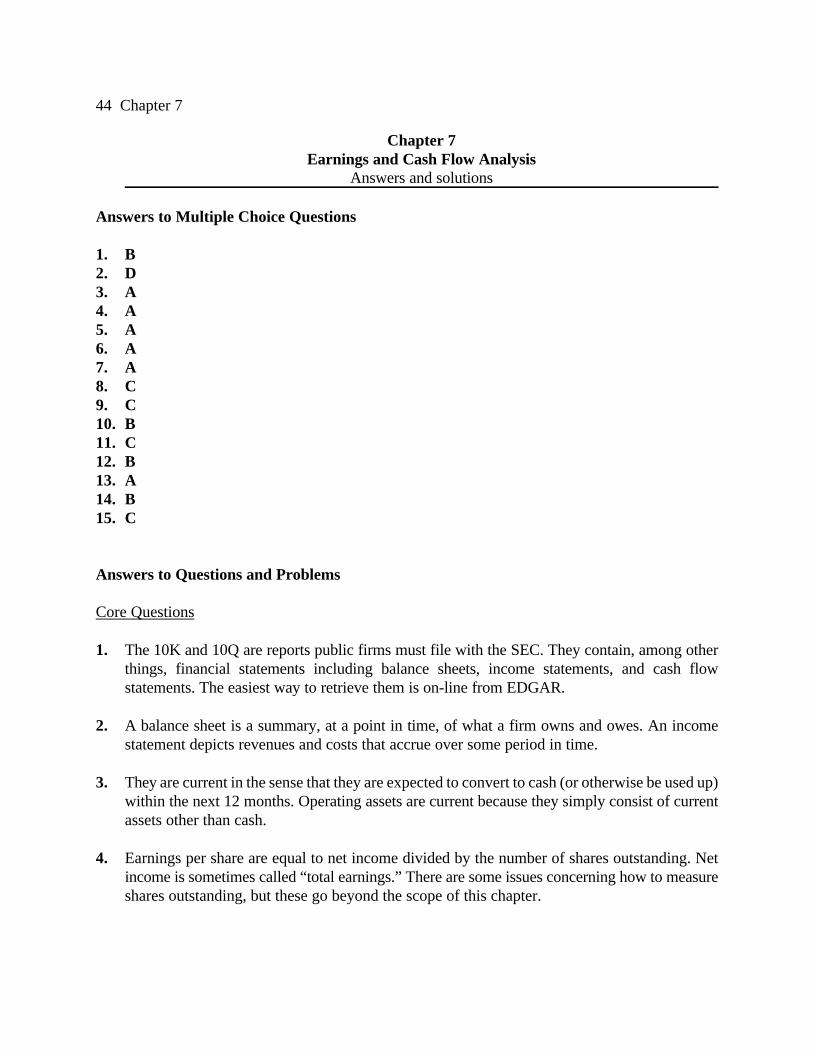
Answers to Multiple Choice Questions
1. B2. D3. A4. A5. A6. A7. A8. C9. C10. B11. C12. B13. A14. B15. C
Answers to Questions and Problems
Core Questions
1. The 10K and 10Q are reports public firms must file with the SEC. They contain, among otherthings, financial statements including balance sheets, income statements, and cash flowstatements. The easiest way to retrieve them is on-line from EDGAR.
2. A balance sheet is a summary, at a point in time, of what a firm owns and owes. An incomestatement depicts revenues and costs that accrue over some period in time.
3. They are current in the sense that they are expected to convert to cash (or otherwise be used up)within the next 12 months. Operating assets are current because they simply consist of currentassets other than cash.
4. Earnings per share are equal to net income divided by the number of shares outstanding. Netincome is sometimes called “total earnings.” There are some issues concerning how to measureshares outstanding, but these go beyond the scope of this chapter.

Earnings/Cash Flow Analysis 45
5. Depreciation is a “noncash item” because the depreciation deduction does not literally representa cash outflow. It is instead purely an accounting entry.
6. Operating cash flow; investment cash flow, and financing cash flow.
7. It is the cash generated by ordinary business activity, meaning the everyday, routine functioningof the business.
8. A pro forma financial statement is essentially a hypothetical financial statement, meaning that itis a financial statement that is based on specific sets of assumptions and/or events that have notoccurred (and may not ever occur). The term “pro forma” literally means “according to aparticular form,” but a better translation in this context is “hypothetical.”
9. The retained earnings number on the income statement is amount retained that year. The numberon the balance sheet is the cumulative amount from all previous years. Put differently, the incomestatement number is the increment or addition to the balance sheet number.
10. Gross margin is gross profit divided by sales, where gross profit is sales less cost of goods sold.Operating margin is operating profit divided by sales, where operating profit is equal to grossprofit less operating expenses. Thus, the difference is that operating margin considers both costsof goods sold and operating expenses. They indicate how much of each sales dollar is left afteraccounting for costs of goods sold (gross margin) and, additionally, for operating expenses(operating margin). Generally speaking, larger values are better.
11. Gross margin will be larger (why?). Both can be negative. Also, gross margin can be positivewhile operating margin is negative, but not the other way around (why?).
12. No, but dividend paying companies certainly wish they were! Dividends received from anothercompany are taxed preferentially. Depending on the circumstances, only 20 percent or 30 percentare subject to taxes; the rest is not taxed.
Intermediate Questions
13. The bottom line on the cash flow statement is operating cash flow, less money spent on fixedassets and other investments, less the net amount paid or raised due to financial transactions (i.e.,things like borrowing money, paying dividends, or paying interest). It actually measures thechange in the amount of cash the firm has available from one period to the next.
14. It’s conventionally computed as operating cash flow divided by the number of sharesoutstanding.

46 Chapter 7
15. The literal interpretation is that it is the sum of all the yearly retained earnings numbers. Thereare two important things to recognize. First, in any given year, the retained earnings number onthe income statement is simply what’s left over after dividends are subtracted from net income.Dividends are paid in cash, but net income is not a cash flow (because, for example, it includesnoncash deductions). As a result, the retained earnings are not cash flows either. The actual cashflow that is “retained” is some very different number. Second, to the extent that Coors does“retain” cash, that cash doesn’t just sit there. Instead, it is used to do things like purchase assetsand pay off debts. Thus, cash or earnings aren’t so much “retained” as they are “reinvested.”Thus, the retained earnings number isn’t cash, and even it were, it would just be a pile of cashsitting around somewhere.
16. Gross margin is $820/$2,480 = 33.1%. Operating margin is $220/$2,480 = 8.9%.
17. Return on asssets (ROA) is $144/$1240 = 11.6%. Return on equity (ROE) is $144/$720 = 20%.
18. Note that, measured in thousands, there are 120 shares. Book value per share (BVPS) is thus$720/120 = $6. Earnings per share (EPS) is $144/120 = $1.20 (as shown on the incomestatement). Cash flow per share (CFPS) is $234/120 = $1.95. The recent price per share is $24,so the Price/Book ratio is 4; the Price/Earnings ratio is 20; and the Price/Cash flow ratio is12.31.
19. With 10% sales growth, sales will rise to $2,728 from $2,480. The pro forma income statementfollows. A constant gross margin is assumed, implying that Cost of Goods Sold will also rise by10%. A constant tax rate of 40% is used. Items in italics are carried over unchanged.
Dixie Chickens pro forma 2001 Income Statement
Net sales $2,728Cost of goods sold (1,826)Gross profit $902Operating expenses (600)Operating income $302Other income 90Net interest expense ( 70)Pretax income $322Income tax 129Net income $193Earnings per share $1.61
Shares outstanding 120,000Recent price $n/a

Earnings/Cash Flow Analysis 47
Next, we prepare the cash flow statement. Notice that we pick up the $193 net income from thepro forma income statement. Items in italics are carried over unchanged. By assumption, noinvestments occur, and no long-term debt is issued or redeemed.
Dixie Chickens pro forma 2001 Cash Flow Statement
Net income $193Depreciation and amortization 100Changes in operating assets (50)Changes in current liabilities 40Operating cash flow $283
Net additions to properties $0Changes in other assets 0Investing cash flow $0
Issuance/redemption of long-term debt $0Dividends paid (72)Financing cash flow $(72)
Net cash flow $211
Finally, we have the balance sheet. Cash rises by the $211 Net Cash Flow from the cash flowstatement. The $50 increases in Operating Assets and the $40 increase in Current Liabilities arealso from the cash flow statement. The $100 reduction in Property, Plant, and Equipment is theamount of the depreciation deduction shown on the cash flow statement. The increase in retainedearnings is equal to pro forma Net Income less pro forma Dividends.

48 Chapter 7
Dixie Chickens pro forma 2001 Balance Sheet
Cash and cash equivalents $311Operating assets 350Property, plant, and equipment 700Other assets 40Total assets $1,401
Current liabilities $140Long-term debt 400Other liabilities 20Total liabilities $560
Paid-in capital $ 30Retained earnings 811Total shareholder equity $841
Total liabilities and equity $1,401
20. Using the benchmark from question 18, projected stock prices are:
BVPS × P/B = ($841/120) × 4 = $28.03EPS × P/E = $1.61 × 20 = $32.20CFPS × P/CF = ($283/120) × 12.31 = $29.03
Thus, projected prices assuming a 10% sales increase are in the $28 - $32 range.