chapter (7) continuous probability distributions...
TRANSCRIPT

1
Chapter (7)
Continuous Probability Distributions
Examples Normal probability distribution
Example (1)
How to find the area under the normal curve?
If 6&50
Find
9641.04641.05.0
8.105.08.16
8.10
6
508.608.601
ZPZpZP
ZPXP
9641.04641.05.0
08.15.08.16
8.10
6
502.392.392
ZPZpZP
ZPXP
0359.04641.05.0
8.105.08.16
8.10
6
508.608.603
ZPZpZP
ZPXP

2
0359.04641.05.0
08.15.08.16
8.10
6
502.392.394
ZPZpZP
ZPXP
0309.04332.04641.0
5.108.108.15.16
8.10
6
9
6
508.60
6
50598.60595
ZPZPZpZP
ZPXP
0309.04332.04641.0
5.108.10
5.18.16
9
6
8.10
6
5041
6
502.39412.396
ZPZP
ZpZP
ZPXP
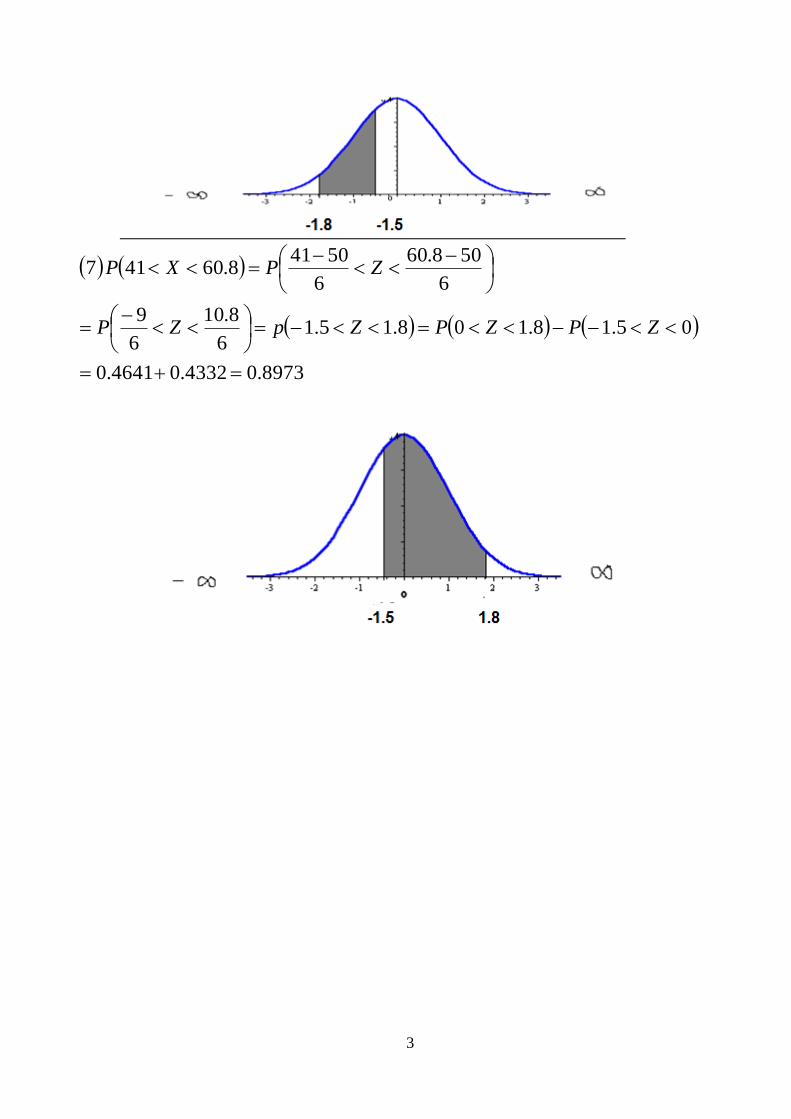
3
8973.04332.04641.0
05.18.108.15.16
8.10
6
9
6
508.60
6
50418.60417
ZPZPZpZP
ZPXP

4
Example (2)
Let X is a normally distributed random variable with mean 65 and standard
deviation 13. Find the standard normal random variable (z) for P( X >80)
Solution:
)15.1()13
15()
13
6580()80(
ZPZPZPXP
1251.03749.05.0 Example (3)
If the mean = 65 and standard deviation =13. Find x from the following:
1. z = 0.6
2. z = -1.93
Solution:
1. 8.728.765136.065
6.0
x
z
2. 91.3909.25651393.165
93.1
x
z
The Empirical Rule
Example (4) A sample of the rental rates at University Park Apartments approximates a
systematical, bell- shaped distribution. The sample mean is $500; the
standard deviation is $20.Using the Empirical Rule, answer these questions:
About 68 percent of the monthly food expenditures are between what two
amounts?
1. About 95 percent of the monthly food expenditures are between what two
amounts?
1. About all of the monthly (99.7%) food expenditures are between what two
amounts?

5
Solution
1-
520,$480$
205002015001 X
About 68 percent are between $480 and $520.
2-
540,$460$
405002025002 X
About 95 percent are between $460 and $540.
3-
560,$440$
605002035002 X
About 99.7 percent are between $440 and $560.
Example (5)
The mean of a normal probability distribution is 120; the standard deviation
is 10.
a. About 68 percent of the observations lie between what two values?
b. About 95 percent of the observations lie between what two values?
c. About 99 percent of the observations lie between what two values?
Solution:
a.
110130
101201011201
and
b.
100140
201201021202
and
c.
90150
301201031203
and
Example (6)
Studies show that gasoline use for compact cars sold in the United States is
normally distributed, with a mean of 25.5 miles per gallon (mpg) and a
standard deviation of 4.5 mpg. Find the probability of compact cars that get:
1. 30 mpg or more.
2. 30 mpg or less.
3. Between 30 and 35.
4. Between 30 and 21.

6
Solution: 5.45.25
1.
1587.03413.05.0
15.01)5.4
5.4()
5.4
5.2530(30
zPZPZPxP
2.
30 25.5 4.530 1 0.5 1
4.5 4.5
0.5 0.3413 0.8413
P x P Z P Z P z
3.
30 25.5 35 25.5 4.5 9.530 35
4.5 4.5 4.5 4.5
1 2.11 2.11 1 0.4826 0.3413 0.1413
P x P Z P Z
P z
4.
21 25.5 30 25.5 4.5 4.521 30
4.5 4.5 4.5 4.5
1 1 1 1 0.3413 0.3413 0.6826
P x P Z P Z
P z

7
Example (7)
Suppose that X ~N (3, o.16). Find the following probability:
1. .3xP
2. .1.38.2 xP
Solution: 4.03 u
1. 5000.004.0
333
zPZPxP
2.
2902.00987.01915.025.05.025.050.0
)4.0
1.0
4.0
2.0(
4.0
31.3
4.0
38.21.38.2
zP
ZPZPxP
Example (8)
The grades on a short quiz in math were 0, 1, 2…, 10 point, depending on the
number answered correctly out of 10 questions. The mean grade was 6.7 and
the standard deviation was 1.2. Assuming the grades to be normally
distributed, determine:
1. The percentage of students scoring more than 6 points.
2. The percentage of students scoring less than 8 points.
3. The percentage of students scoring between 5.5and 6 points.
4. The percentage of students scoring between 5.5and 8 points.
5. The percentage of students scoring less than 5.5 points.
6. The percentage of students scoring more than 8 points.
7. The percentage of students scoring equal to 8 points.
8. The maximum grade of the lowest 5 % of the class.
9. The minimum grade of the highest 15 % of the class.
Solution: 2.17.6
1.
7190.02190.05.058.05.0
58.02.1
7.0
2.1
7.666
zPZPZPxP
2.
8599.03599.05.008.15.0
08.12.1
3.1
2.1
7.688
zPZPZPxP
3.
1223.02190.03413.058.0158.1
2.1
7.0
2.1
2.1
2.1
7.66
2.1
7.65.565.5
zP
ZPZPxP
4.
7012.03413.03599.0108.108.11
2.1
3.1
2.1
2.1
2.1
7.68
2.1
7.65.585.5
ZP
ZPZPxP

8
5.
1587.03413.05.015.01
2.1
2.1
2.1
7.65.55.5
zP
ZPZPXP
6.
1401.03599.05.008.15.0
08.12.1
3.1
7.1
7.688
zPZPZPxP
7. 0)8( xP
8.
7.4~726.4974.17.62.1645.17.6
645.1
4500.005.05.0
x
z
9.
9.7~948.7248.17.62.104.17.6
04.1
3500.015.05.0
x
z
Example (9)
If the heights of 300 students are normally distributed, with a mean 172
centimeters and a standard deviation 8 centimeters, how many students have
heights?
1. Greater than 184 centimeters.
2. Less than or equal to 160 centimeters.
3. Between 164 and 180 centimeters inclusive.
4. Equal to 172 centimeters. 8172300 n
1.
200668.0300184
0668.04332.05.05.115.1
8
12
8
172184184
thangreaterheightshavestudentsofnumber
zP
ZPZPxP

9
2.
200668.0300160
0668.04332.05.05.15.05.1
8
12
8
172160160
thanlessheightshavestudentsofnumber
zP
ZPZPxP
3.
205~78.2046826.0300180164
6826.03413.03413.01111
8
8
8
8
8
172180
8
172164180164
andbetweenheightshavestudentsofnumber
zP
ZPZPxP
4. 0172 xP
Example (10)
What is the area under a normal curve that falls between the mean and one
standard deviation below the mean?
Solution:
3413.010 Zp

10
Example (11)
If P (Z z1) = 0.9099, what does the (z1) equal?
Solution:
34.1
4099.05.9099.0
9099.0
4099.0
1
Z
zZp
If P (Z ≥ z1) = 0.9099, what does the (z1) equal?
Solution:
34.1
4099.05.9099.0
9099.0
4099.0
1
Z
zZp
Example (12)
The mean of a normal probability distribution is 130; the standard
deviation is 10.
What observation which more than or equal 84.13% percent of the
observations?
Solution:
1
0.3413
0.8413
0.8413 .5 0.3413
1
130 10( 1) 130 10 120
p Z z
Z
X u Z
What observation which less than or equal 84.13% percent of the
observations?
Solution:
14010130)1(10130
1
3413.05.8413.0
8413.0
3413.0
1
ZuX
Z
zZP
Example (13)
The mean of a normal probability distribution is 130; the standard
deviation is 10.
What observation which more than or equal 8.85 % percent of the
observations?

11
Solution:
5.1435.13130)35.1(10130
35.1
4115.00885.05.0
0885.0
4115.0
1
ZuX
Z
zZp
What observation which less than or equal 8.85 % % percent of
the observations?
Solution:
5.1165.13130)35.1(10130
35.1
4115.00885.05.0
0885.0
4115.0
1
ZuX
Z
zZp

12
Z-Table
0.00 0.01 0.02 0.03 0.04 0.05 0.06 0.07 0.08 0.09
0.0 0.0000 0.0040 0.0080 0.0120 0.0160 0.0199 0.0239 0.0279 0.0319 0.0359
0.1 0.0398 0.0438 0.0478 0.0517 0.0557 0.0596 0.0636 0.0675 0.0714 0.0753
0.2 0.0793 0.0832 0.0871 0.0910 0.0948 0.0987 0.1026 0.1064 0.1103 0.1141
0.3 0.1179 0.1217 0.1255 0.1293 0.1331 0.1368 0.1406 0.1443 0.1480 0.1517
0.4 0.1554 0.1591 0.1628 0.1664 0.1700 0.1736 0.1772 0.1808 0.1844 0.1879
0.5 0.1915 0.1950 0.1985 0.2019 0.2054 0.2088 0.2123 0.2157 0.2190 0.2224
0.6 0.2257 0.2291 0.2324 0.2357 0.2389 0.2422 0.2454 0.2486 0.2517 0.2549
0.7 0.2580 0.2611 0.2642 0.2673 0.2704 0.2734 0.2764 0.2794 0.2823 0.2852
0.8 0.2881 0.2910 0.2939 0.2967 0.2995 0.3023 0.3051 0.3078 0.3106 0.3133
0.9 0.3159 0.3186 0.3212 0.3238 0.3264 0.3289 0.3315 0.3340 0.3365 0.3389
1.0 0.3413 0.3438 0.3461 0.3485 0.3508 0.3531 0.3554 0.3577 0.3599 0.3621
1.1 0.3643 0.3665 0.3686 0.3708 0.3729 0.3749 0.3770 0.3790 0.3810 0.3830
1.2 0.3849 0.3869 0.3888 0.3907 0.3925 0.3944 0.3962 0.3980 0.3997 0.4015
1.3 0.4032 0.4049 0.4066 0.4082 0.4099 0.4115 0.4131 0.4147 0.4162 0.4177
1.4 0.4192 0.4207 0.4222 0.4236 0.4251 0.4265 0.4279 0.4292 0.4306 0.4319
1.5 0.4332 0.4345 0.4357 0.4370 0.4382 0.4394 0.4406 0.4418 0.4429 0.4441
1.6 0.4452 0.4463 0.4474 0.4484 0.4495 0.4505 0.4515 0.4525 0.4535 0.4545
1.7 0.4554 0.4564 0.4573 0.4582 0.4591 0.4599 0.4608 0.4616 0.4625 0.4633
1.8 0.4641 0.4649 0.4656 0.4664 0.4671 0.4678 0.4686 0.4693 0.4699 0.4706
1.9 0.4713 0.4719 0.4726 0.4732 0.4738 0.4744 0.4750 0.4756 0.4761 0.4767
2.0 0.4772 0.4778 0.4783 0.4788 0.4793 0.4798 0.4803 0.4808 0.4812 0.4817
2.1 0.4821 0.4826 0.4830 0.4834 0.4838 0.4842 0.4846 0.4850 0.4854 0.4857
2.2 0.4861 0.4864 0.4868 0.4871 0.4875 0.4878 0.4881 0.4884 0.4887 0.4890
2.3 0.4893 0.4896 0.4898 0.4901 0.4904 0.4906 0.4909 0.4911 0.4913 0.4916
2.4 0.4918 0.4920 0.4922 0.4925 0.4927 0.4929 0.4931 0.4932 0.4934 0.4936
2.5 0.4938 0.4940 0.4941 0.4943 0.4945 0.4946 0.4948 0.4949 0.4951 0.4952
2.6 0.4953 0.4955 0.4956 0.4957 0.4959 0.4960 0.4961 0.4962 0.4963 0.4964
2.7 0.4965 0.4966 0.4967 0.4968 0.4969 0.4970 0.4971 0.4972 0.4973 0.4974
2.8 0.4974 0.4975 0.4976 0.4977 0.4977 0.4978 0.4979 0.4979 0.4980 0.4981
2.9 0.4981 0.4982 0.4982 0.4983 0.4984 0.4984 0.4985 0.4985 0.4986 0.4986
3.0 0.4987 0.4987 0.4987 0.4988 0.4988 0.4989 0.4989 0.4989 0.4990 0.4990