chapter 6.2 opportunities and limitations of object-based image
TRANSCRIPT
Chapter 6.2
Opportunities and limitations of object-based image analysis for detecting urban impervious and vegetated surfaces using true-colour aerial photography
M. Kampouraki, G. A. Wood, T. R. Brewer
School of Applied Sciences, Department of Natural Resources, Cranfield University, Bedfordshire, MK43 0AL, UK (m.kampouraki.s04, g.a.wood, t.brewer)@cranfield.ac.uk
KEYWORDS: Object, Classification, Urban, Mapping, Remote sensing
ABSTRACT: Monitoring soil sealing in urban environments is of great interest as a key indicator of sustainable land use. Many studies have at-tempted to automatically classify surface impermeability by using satellite or aerial imagery. Air photo interpretation (API) has been used as a method to verify their accuracy. However, independent accuracy assess-ments of API have not been widely reported. The aims of this research are, firstly, to investigate independent accuracy assessments of API. Secondly, to determine whether object-based image analysis could replace manual in-terpretation for the detection of sealed soil and vegetated surfaces at the residential garden plot level. Four study areas, representing the industrial, commercial and residential parts of Cambridge, UK were manually digi-tised and classified by API. The same areas were automatically segmented and manually classified with the use of eCognition. The two methods were compared and the average overall mapping agreement was estimated to be 92%. The disagreement was qualitatively analysed and the advantages and disadvantages of each method were discussed. The very high agreement between the two methods in conjunction with the benefits of the automated method led to the conclusion that automated segmentation using eCogni-tion could replace the manual boundary delineation when true-colour aerial
556 M. Kampouraki, G. A. Wood, T. R. Brewer
photography is used. Future work will examine automated image classifi-cation methods, using eCognition, as a replacement for normal image in-terpretation methods.
1 Introduction
Urban development presents the greatest driver of soil loss due to sealing-over by buildings, pavement and transport infrastructure. Soil sealing is recognised as one of the major threats to soil. The ability to monitor the rates, types and geo-spatial distribution of soil sealing is crucial to under-standing the severity of pressure on soils and their impact on European and global socio-economic and environmental systems (Wood et al., 2006).
1.1 Monitoring soil sealing by remote sensing
There are few internationally recognised definitions of soil sealing (Burghardt et al. 2004). The European Union accepts that “soil sealing re-fers to changing the nature of a soil such that it behaves as an impermeable medium and describes the covering or sealing of the soil surface by imper-vious materials” (EEA glossary 2006). Remotely sensed data cannot di-rectly measure whether a surface is permeable but it can monitor cover types (e.g. concrete or tarmac) and infer permeability. Grenzdörffer (2005) categorised sealed areas simply as either built-up or non-built-up areas.
Arguably, the most detailed mapping of soil sealing was carried by the Office for Urban Drainage Systems in Dresden, Germany. They used orthorectified aerial photography (1:50,000 scale) and digitized soil sealing values for the whole city by air photo interpretation (API). The degree of sealing was estimated for each housing plot and given a soil sealing value, e.g. roofs were 100% sealed; green roofs, 50%; concrete-asphalt 100%; semi-permeable areas (paving stone) 70%; water-absorbing areas like gravel, 50% and residual areas, 0% (Meinel and Hering 2005).
Recently, a variety of projects have been undertaken in Europe to de-velop more automated methods for detecting soil sealing at European, na-tional or regional scales such as the SoilSAGE project, the GMES Urban Services (GUS) project, the GMES Service Element (GSE) Land monitor-ing project, the Monitoring Urban Dynamics (MURBANDY) project and the Monitoring Land Use/Cover Change Dynamics (MOLAND) project. Soil sealing has also been investigated by the Technical Working Groups (TWG) of the Soil Thematic Strategy described by Burghardt et al. (2004) in two reports. Most of these projects have used remote sensing image
Opportunities and limitations of object-based image analysis 557
classification techniques based on pixel procedures. The argument for using object-based image analysis over pixel-based
methods will not be repeated here (see Blaschke and Strobl 2001; Caprioli and Tarantino 2003; Yuan and Bauer 2006). Suffice it to say that real-world objects are not characterized by single, square pixels. In the case of high and very high resolution imagery, groups of individual pixels are more likely to represent what would normally be interpreted as recognis-able land cover features. Object-based image analysis is based on sensible pixel groupings and is, therefore, more representative of the systematic process carried out in API. Delineating image objects by ‘segmentation’ in the digital domain is analogous to API boundary delineation.
Automatic segmentation is not new (Blaschke and Strobl 2001). Exist-ing algorithms include texture segmentation, watershed information and mean shift, but none of them have proved to be a robust, operational ap-proach (Zhou and Wang, 2006). More recently, with the introduction of eCognition software, from Definiens Imaging GmbH, homogeneous image object extraction, over a range of image object sizes, is now possible. In contrast to pixel approaches, image objects produced using eCognition contain spectral, shape and texture information but also a whole network of relations which connects image objects and incorporates contextual in-formation. The objects extracted during the segmentation process are then later classified.
Many studies have attempted to extract urban features and classify ur-ban land cover and land use by using eCognition, e.g. Hoffman (2001); Herold et al. (2003); Wang et al. (2004); Frauman and Wolf (2005); Blaschke et al. (2005). Mittelberg (2002) attempted to analyse the urban environment by using aerial photography and very high resolution IKONOS data. Hodgson et al. (2003) used aerial photography along with elevation data (Lidar) to identify urban imperviousness. The data were compared with visual interpretation of aerial photography which was seg-mented using eCognition. Cothren and Gorham (2005) analysed QuickBird images to detect impervious and permeable surfaces. Grenzdorffer (2005) used a combination of satellite (Landsat TM and SPOT) images with high resolution aerial photographs to identify urban land use change. Yuan and Bauer (2006) investigated digital classification techniques (both pixel and object-based) for mapping urban impervious surfaces using QuickBird im-ages. In most cases, the classification results were compared with an air photo interpretation of ortho-rectified aerial photography.
API is considered de facto as the most accurate procedure for mapping land cover and none of the studies cited determines the appropriateness of using API methods to assess the accuracy of boundary delineation for landcover mapping. API is also subjective, time consuming, expensive, la-
558 M. Kampouraki, G. A. Wood, T. R. Brewer
bour intensive, and requires skilled operators. This paper aims to evaluate manual classification of aerial photography
by comparing it with results produced using eCognition. The work specifi-cally focuses on the segmentation stage of the process, where API will be compared with semi-automated object-based procedures. The scope is to investigate whether object-based image analysis could replace the tradi-tional way of manual digitising and visual labelling for the detection of sealed soil and vegetated surfaces at the residential garden plot level.
2 Data and methods
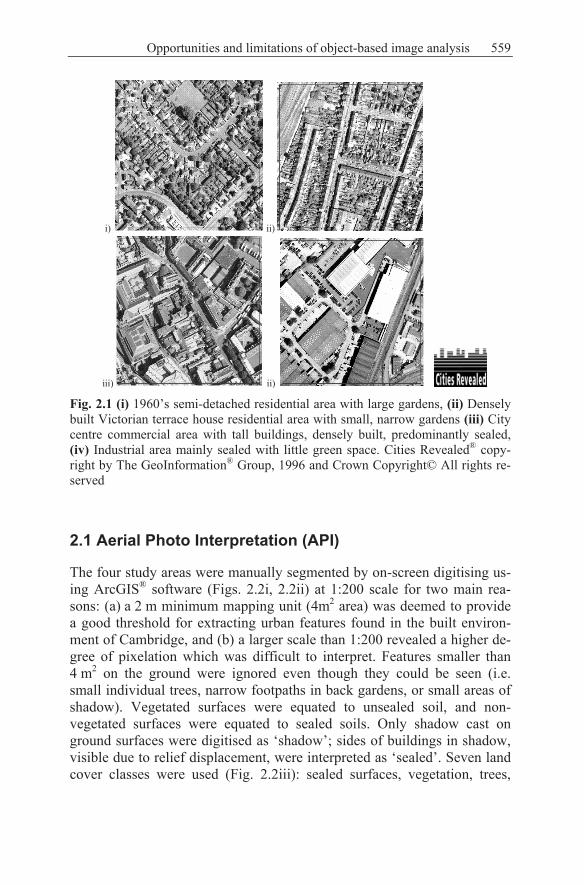
The study area is the city of Cambridge, UK. The data source acquired for the analysis is ortho-rectified aerial photography, taken in June-July 2003 at 0.125 m spatial resolution and scanned to an 8 bit RGB format. The im-age provided, was an already geometrically corrected mosaic where the stereo pairs were unavailable. Four study areas of 250 by 250 m were se-lected as representative land covers of the built environment: two types of residential, one commercial and an industrial part of Cambridge (Fig. 2.1).
559
i) ii)
iii) ii) Fig. 2.1 (i) 1960’s semi-detached residential area with large gardens, (ii) Densely built Victorian terrace house residential area with small, narrow gardens (iii) City centre commercial area with tall buildings, densely built, predominantly sealed, (iv) Industrial area mainly sealed with little green space. Cities Revealed® copy-right by The GeoInformation® Group, 1996 and Crown Copyright© All rights re-served
2.1 Aerial Photo Interpretation (API)
The four study areas were manually segmented by on-screen digitising us-ing ArcGIS® software (Figs. 2.2i, 2.2ii) at 1:200 scale for two main rea-sons: (a) a 2 m minimum mapping unit (4m2 area) was deemed to provide a good threshold for extracting urban features found in the built environ-ment of Cambridge, and (b) a larger scale than 1:200 revealed a higher de-gree of pixelation which was difficult to interpret. Features smaller than 4 m2 on the ground were ignored even though they could be seen (i.e. small individual trees, narrow footpaths in back gardens, or small areas of shadow). Vegetated surfaces were equated to unsealed soil, and non-vegetated surfaces were equated to sealed soils. Only shadow cast on ground surfaces were digitised as ‘shadow’; sides of buildings in shadow, visible due to relief displacement, were interpreted as ‘sealed’. Seven land cover classes were used (Fig. 2.2iii): sealed surfaces, vegetation, trees,
Opportunities and limitations of object-based image analysis

560 M. Kampouraki, G. A. Wood, T. R. Brewer
shadow, rail tracks, bare soil and temporary features. Shadow was further classified as ‘sealed surface in shadow’, ‘grass in shadow’, ‘tree in shadow’, and ‘mixed or unclassified shadow’ when it was impossible to identify the kind of objects in the shadow.
i)
ii)
iii)
Residential areadescription
1= sealed surfaces2= vegetation3= trees4= shadow5= rail tracks6= bare soil
Fig. 2.2 (i) On-screen manual digitising of the densely built residential study area (ii) Delineation of feature detail, (iii) Manual classification. No temporary features were identified in this example
2.2 Semi-automated object-based classification approach
The four study areas were automatically segmented with the use of eCog-nition software, Definiens Professional version 5. The multi-resolution segmentation, which generates objects resembling ground features very closely (Definiens User Guide 2006), was used for this study. As a first step, eCognition links pixels to produce image objects by extracting ho-mogeneous areas. The outcome of the segmentation is dependent on sev-eral parameters, such as, scale, colour, shape, compactness and image layer weights. These parameters are defined manually by the user. The scale pa-rameter determines the maximum allowable heterogeneity for the resulting image objects and, consequently, their size.
A new feature of eCognition v.5 is the process editor. A single process represents an individual operation of an image analysis routine and defines
561
an algorithm which is executed on a specific image object domain. The image object domain describes the area of interest where the algorithm will be executed in the image hierarchy (Definiens User Guide 2006) and can either be the raw data at the pixel level, all of the image objects in a spe-cific level of the hierarchy, or a specific object class from any level. The flexibility of the new version gives the ability to apply rules in a specific class domain of the class hierarchy that suits local conditions in an image. This affords similar flexibility that an interpreter has during manual API.
A general rule of thumb for a meaningful segmentation is to create im-age objects as large as possible and as small as necessary (Definiens User Guide 2006). The image must be segmented at such a scale so as to iden-tify the smallest feature of interest. It is very important to use as many ob-ject levels, at different scales, as necessary until all image objects explic-itly represent the classes to be assigned for the classification procedure. For a detailed description of image segmentation using eCognition and how the parameters affect the image analysis, see Baatz and Schape (2000), Benz et al (2003) and Definiens User Guide (2006).
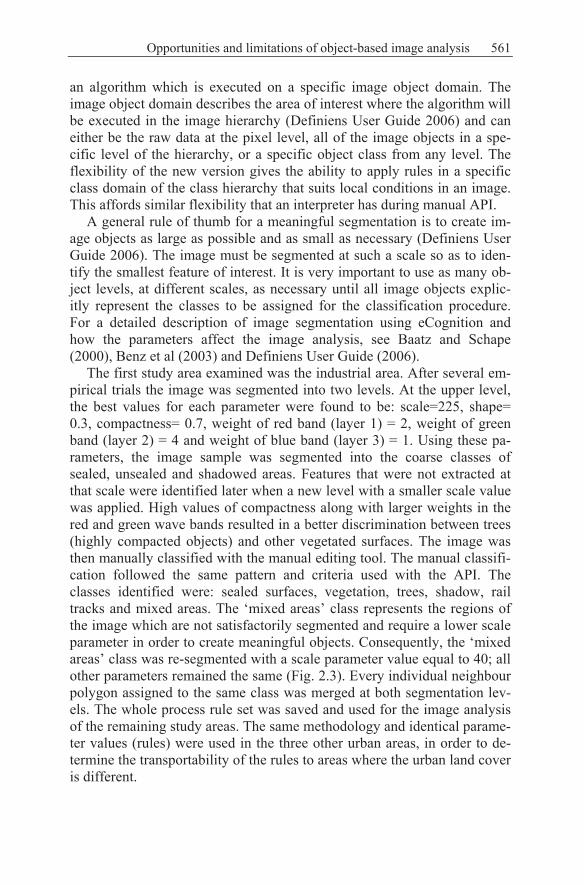
The first study area examined was the industrial area. After several em-pirical trials the image was segmented into two levels. At the upper level, the best values for each parameter were found to be: scale=225, shape= 0.3, compactness= 0.7, weight of red band (layer 1) = 2, weight of green band (layer 2) = 4 and weight of blue band (layer 3) = 1. Using these pa-rameters, the image sample was segmented into the coarse classes of sealed, unsealed and shadowed areas. Features that were not extracted at that scale were identified later when a new level with a smaller scale value was applied. High values of compactness along with larger weights in the red and green wave bands resulted in a better discrimination between trees (highly compacted objects) and other vegetated surfaces. The image was then manually classified with the manual editing tool. The manual classifi-cation followed the same pattern and criteria used with the API. The classes identified were: sealed surfaces, vegetation, trees, shadow, rail tracks and mixed areas. The ‘mixed areas’ class represents the regions of the image which are not satisfactorily segmented and require a lower scale parameter in order to create meaningful objects. Consequently, the ‘mixed areas’ class was re-segmented with a scale parameter value equal to 40; all other parameters remained the same (Fig. 2.3). Every individual neighbour polygon assigned to the same class was merged at both segmentation lev-els. The whole process rule set was saved and used for the image analysis of the remaining study areas. The same methodology and identical parame-ter values (rules) were used in the three other urban areas, in order to de-termine the transportability of the rules to areas where the urban land cover is different.
Opportunities and limitations of object-based image analysis

562 M. Kampouraki, G. A. Wood, T. R. Brewer
i) ii) Fig. 2.3 (i) Industrial area segmentation at scale 225 and manually classified. (ii) The bright areas are the mixed areas which were later re-segmented at scale 40
2.4 Accuracy assessment
The results from eCognition were exported to ArcGIS® as smoothed poly-gons in vector format. The accuracy of the results was quantitatively as-sessed by comparison with the visual interpretation of the ortho-rectified aerial photography by cross-tabulation. The maps were also qualitatively analysed in order to understand any differences between the two ap-proaches.
3. Results and discussion
3.1 Quantitative analysis
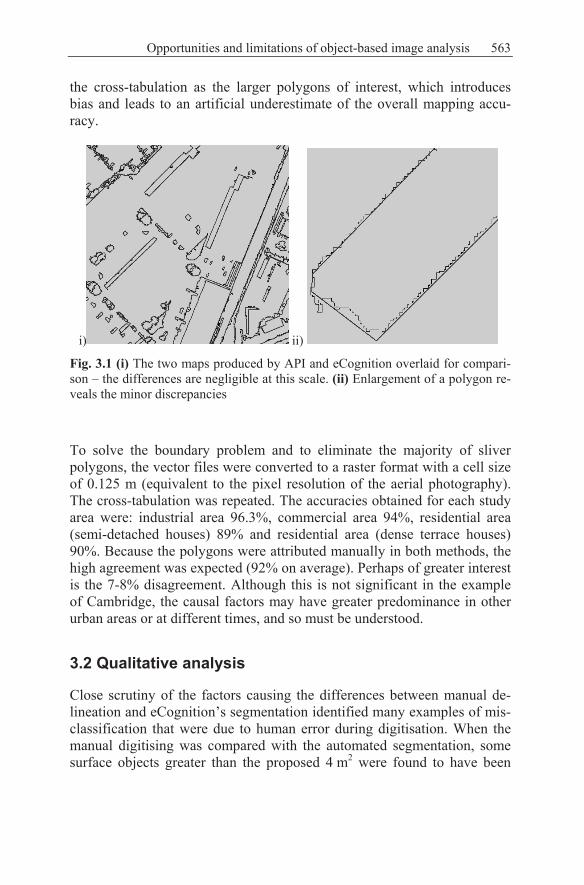
Initially, all the maps produced by the two methods were in vector format. The data from each method in a study area were merged together by a un-ion function and the attributes of the new map were exported to a spread-sheet for the production of confusion matrices. The results showed very low agreement between the two methods. All four areas had accuracies be-tween 28-29% which can be explained by the fact that although the two segmentations look very similar at the small scale, the boundaries of each polygon do not match perfectly (Fig. 3.1). Many insignificant ‘sliver’ poly-gons were produced when the maps were combined. This is due to the fact that eCognition follows a pixel pattern while the interpreter digitizes with smoother lines. The very small sliver polygons carry the same weight in
563
the cross-tabulation as the larger polygons of interest, which introduces bias and leads to an artificial underestimate of the overall mapping accu-racy.
i) ii) Fig. 3.1 (i) The two maps produced by API and eCognition overlaid for compari-son – the differences are negligible at this scale. (ii) Enlargement of a polygon re-veals the minor discrepancies
To solve the boundary problem and to eliminate the majority of sliver polygons, the vector files were converted to a raster format with a cell size of 0.125 m (equivalent to the pixel resolution of the aerial photography). The cross-tabulation was repeated. The accuracies obtained for each study area were: industrial area 96.3%, commercial area 94%, residential area (semi-detached houses) 89% and residential area (dense terrace houses) 90%. Because the polygons were attributed manually in both methods, the high agreement was expected (92% on average). Perhaps of greater interest is the 7-8% disagreement. Although this is not significant in the example of Cambridge, the causal factors may have greater predominance in other urban areas or at different times, and so must be understood.
3.2 Qualitative analysis
Close scrutiny of the factors causing the differences between manual de-lineation and eCognition’s segmentation identified many examples of mis-classification that were due to human error during digitisation. When the manual digitising was compared with the automated segmentation, some surface objects greater than the proposed 4 m2 were found to have been
Opportunities and limitations of object-based image analysis
564 M. Kampouraki, G. A. Wood, T. R. Brewer
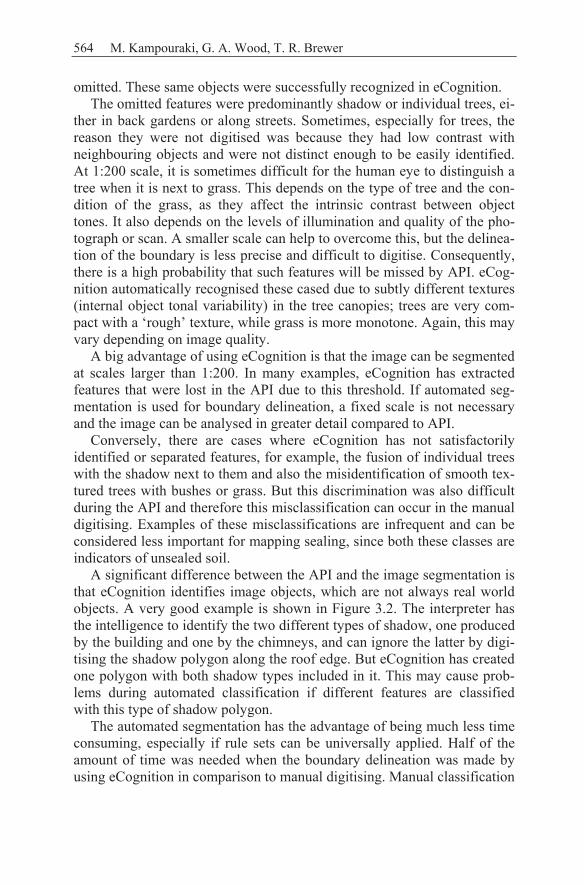
omitted. These same objects were successfully recognized in eCognition. The omitted features were predominantly shadow or individual trees, ei-
ther in back gardens or along streets. Sometimes, especially for trees, the reason they were not digitised was because they had low contrast with neighbouring objects and were not distinct enough to be easily identified. At 1:200 scale, it is sometimes difficult for the human eye to distinguish a tree when it is next to grass. This depends on the type of tree and the con-dition of the grass, as they affect the intrinsic contrast between object tones. It also depends on the levels of illumination and quality of the pho-tograph or scan. A smaller scale can help to overcome this, but the delinea-tion of the boundary is less precise and difficult to digitise. Consequently, there is a high probability that such features will be missed by API. eCog-nition automatically recognised these cased due to subtly different textures (internal object tonal variability) in the tree canopies; trees are very com-pact with a ‘rough’ texture, while grass is more monotone. Again, this may vary depending on image quality.
A big advantage of using eCognition is that the image can be segmented at scales larger than 1:200. In many examples, eCognition has extracted features that were lost in the API due to this threshold. If automated seg-mentation is used for boundary delineation, a fixed scale is not necessary and the image can be analysed in greater detail compared to API.
Conversely, there are cases where eCognition has not satisfactorily identified or separated features, for example, the fusion of individual trees with the shadow next to them and also the misidentification of smooth tex-tured trees with bushes or grass. But this discrimination was also difficult during the API and therefore this misclassification can occur in the manual digitising. Examples of these misclassifications are infrequent and can be considered less important for mapping sealing, since both these classes are indicators of unsealed soil.
A significant difference between the API and the image segmentation is that eCognition identifies image objects, which are not always real world objects. A very good example is shown in Figure 3.2. The interpreter has the intelligence to identify the two different types of shadow, one produced by the building and one by the chimneys, and can ignore the latter by digi-tising the shadow polygon along the roof edge. But eCognition has created one polygon with both shadow types included in it. This may cause prob-lems during automated classification if different features are classified with this type of shadow polygon.
The automated segmentation has the advantage of being much less time consuming, especially if rule sets can be universally applied. Half of the amount of time was needed when the boundary delineation was made by using eCognition in comparison to manual digitising. Manual classification

565
in eCognition was also faster but the interpreter was familiar with the area as the classification was repeated during API. The advantages and disad-vantages of each method are summarised in Table 1.
Fig. 3.2 eCognition’s segmentation of shadows cast by buildings and chimneys
Opportunities and limitations of object-based image analysis

566 M. Kampouraki, G. A. Wood, T. R. Brewer
Table 1. The advantages and disadvantages of using either API or eCognition to delineate real-world objects from remotely sensed imagery
Advantages Disadvantages
API
♦ Interpretation of real objects
♦ Identification of com-plex patterns and com-plex situations
♦ Ability to include or ignore features intelli-gently
♦ Multi-scale representa-tion
♦ Use of shape, context, neighbourhood rela-tionships
♦ Subjective ♦ Time consuming ♦ A fixed scale is nec-
essary ♦ Inconsistency in the
use of a steady scale to the whole image
♦ Human error ♦ Imprecise boundary
delineation
eCognition
♦ Objective (the rules and chosen parameters are subjective but the rules are applied to the whole image objec-tively)
♦ Multi-scale representa-tion
♦ Hierarchical connec-tion between multi-scales
♦ Use of shape, context, neighbourhood rela-tionships
♦ Transferable rules: boundaries reproduced automatically across different data sets
♦ Quick method
♦ Identification of im-age objects, not real objects
♦ Inability to include or ignore features in-telligently
♦ Fusion of real ob-jects due to spectral confusion
567
4. Conclusions
In this paper, two approaches for mapping urban land cover (for the pur-poses of identifying sealed soils) using true colour ortho-rectified aerial photography have been presented. The traditional technique of aerial photo interpretation (API) has been used to compare against new automated methods for boundary delineation, with the use of eCognition software. A quantitative analysis showed a very high agreement between the two methods across a range of different UK urban land use types: 1960s resi-dential, Victorian residential, commercial, and industrial.
Both methods identify features at multi-scales and use shape, context and proximity information. The great benefit of eCognition is that once the user finds the appropriate parameters for a satisfactory segmentation and classification then these can instantly be applied in other areas with similar land cover. Consequently, the automated analysis is objective and quick in contrary to the subjective and very time consuming API.
eCognition’s main disadvantage is that it cannot interpret an image as intelligently as a manual interpreter would, mainly because it does not rec-ognise real objects, but identifies image objects, which can be spectrally confused. This can be overcome to an extent by applying fuzzy rules dur-ing the classification stage.
The ability to work flexibly on specific parts of the image, allows the user to analyse the image in a way that replicates API. The benefits of the automated approach in conjunction with the high agreement that the quan-titative analysis showed, led to the conclusion that eCognition can replace the manual method of on-screen digitisation of aerial photography.
This research study will continue by exploring eCognition’s automated classification using the ‘membership function’ approach. This will prove whether API can be replaced by a completely automated method. In the fu-ture automated classification, shadow will be reclassified and assigned to a specific land cover class. This procedure has already been done manually during API but has not been used as only segmentation (and not classifica-tion) was compared in this paper. If the work was to be repeated again, the most complicated sample area should be used first in order to find the ap-propriate values of the segmentation’s parameters. In this way, fewer ‘mixed areas’ will need to be manually classified in order to run the seg-mentation again in a smaller level by using object domains (applicable in eCognition Professional v5).
Opportunities and limitations of object-based image analysis
568 M. Kampouraki, G. A. Wood, T. R. Brewer
References
Baatz M, Schape A (2000) Multiresolution Segmentation – an optimization ap-proach for high quality multi-scale image segmentation. AGIT-Symposium Salzburg 2000, 12–23. http://www.definiens.com/documents/publications_earth2000.php
Benz UC, Hofmann P, Willhauk G, Lingenfelder I, Heyen M (2004) Multi-resolution, object-oriented fuzzy analysis of remote sensing data for GIS-ready information. ISPRS Journal of Photogrammetry & Remote Sensing, 58, 239-258.
Blaschke T, Strobl J (2001) What's wrong with pixels? Some recent developments interfacing remote sensing and GIS. GeoBIT/GIS, 6, 12-17. http://www.definiens.com/documents/publications_earth2001.php
Blaschke T, Lang S, Moller M (2005) Object-based analysis of remote sensing data for landscape monitoring: Recent developments. Anais XII Simpósio Brasileiro de Sensoriamento Remoto, Goiania, Brasil, 16-21 April 2005, http://www.definiens-imaging.com/documents/reference.htm:2879-2885.
Burghardt W, the Working Group Urban Soils of the German Soil Science Society (2004) Soil Monitoring Instruction on Sealed Areas in the European Union, Contribution to the EU Soil Thematic Strategy. http://www.uni-essen.de/bodenkunde/links/eusoil/sealingmonitoring2703.pdf
Burghardt W, Banko G, Hoeke S, Hursthouse A, de L’ Escaille T, Ledin S, Mar-san FA, Sauer D, Stahr K (2004) TG 5 –SOIL SEALING, SOILS in URBAN AREAS, LAND USE and LAND USE PLANNING. http://www.uni-essen.de/bodenkunde/links/eusoil/EUUrbansoilsapr04.pdf
Caprioli M, Tarantino E (2003) Urban features recognition form VHR satellite data with an object-oriented approach. International Symposium of Remote Sensing (ISPRS) Commission IV Joint Workshop "Challenges in Geospa-tial Analysis, Integration and Visualization II" http://www.igf.uni-osnabrueck.de/mitarbeiter/schiewe/papers/24.pdf
Cothren J, Gorham B (2005) Automated Feature-Extraction: Software Advances Extract Impervious Surfaces from Satellite Imagery. Earth Imaging Journal, 2, 32-34.
Definiens Professional 5 User Guide (2006) Definiens AG European Environment Agency (EEA) glossary web-site (2006)
http://glossary.eea.europa.eu/EEAGlossary/S/soil_sealing Frauman E, Wolf E (2005) Segmentation of very high spatial resolution satellite
images in urban areas for segments-based classification. In: Anon., ISPRS WG VII/1 "Human Settlements and Impact Analysis" 3rd Interna-tional Symposium Remote Sensing and Data Fusion Over Urban Areas (URBAN 2005) and 5th International Symposium Remote Sensing of Ur-ban Areas (URS 2005), Tempe, AZ, USA, 14-16 March 2005, http://www.definiens-imaging.com/documents/reference.htm:
Grenzdorffer GJ (2005) Land use change in Rostock, Germany since the reunifica-tion - a combined approach with satellite data and high resolution aerial im-

569
ages. In: Anon., ISPRS WG VII/1 "Human Settlements and Impact Analy-sis" 3rd International Symposium Remote Sensing and Data Fusion Over Urban Areas (URBAN 2005) and 5th International Symposium Remote Sensing of Urban Areas (URS 2005), Tempe, AZ, USA, 14-16 March 2005, http://www.definiens-imaging.com/documents/reference.htm:
Herold M, Guenther K, Clarke C (2003) Mapping urban areas in the Santa Bar-bara South Coast using IKONOS data and eCognition. http://www.definiens-imaging.com/documents/an/sb.pdf.
Hodgson ME, Jensen JR, Tullis JA, Riordan KD, Archer CM (2003) Synergistic use of Lidar and color aerial photography for mapping urban parcel imper-viousness. Photogrammetric Engineering and Remote Sensing, 69, 973-980.
Hofmann P (2001) Detecting urban features from IKONOS data using an object-oriented approach. Fist Annual Conference of the Remote Sensing & Pho-togrammetry Society, 12-14 September 2001, 28-33. http://www.definiens.com/documents/publications_earth2001.php
Meinel G, Hernig A (2005) Survey of soil sealing on the basis of the ATKIS basic DLM − feasibilities and limits. 10th International Conference on Informa-tion & Communication Technologies (ICT) in Urban Planning and Spatial Development and Impacts of ICT on Physical Space, 22-25 February 2005. http://www.schrenk.at/corp/archiv/papers/2005/CORP2005_MEINEL_HERNIG.pdf
Mittelbeg B (2002) PIXEL VERSUS OBJECT: A method comparison for analys-ing urban areas with VHR data. http://www.definiens-imagining.com
Wang Z, Wei W, Zhao S, Chen X (2004) Object-oriented Classification and Ap-plication in Land Use Classification Using SPOT-5 PAN imagery. IEEE, 3158-3160.
Wood GA, Kampouraki M, Braganza S, Brewer TR, Harris JA, Hannam J, Burton RJ (2006) The application of remote sensing to identify and measure changes in the area of soil prevented from carrying out functions of sealing. Technical report of GIFTSS project BNSC/ITT/54. A report prepared for the Department of the Environment, Food and Rural Affairs.
Yan F, Bauer M (2006) Mapping impervious surface are using high resolution im-agery: a comparison of object-based and pixel classification. American So-ciety of Photogrammetry and Remote Sensing (ASPRS) Annual Confer-ence, Reno, Nevada, 1-5 May 2006. http://www.definiens.com/documents/publications_earth.php
Zhou Y, Wang YQ (2006) Extraction of impervious surface area using orthopho-tos in Rhode island. American Society of Photogrammetry and Remote Sensing (ASPRS) Annual Conference, Reno, Nevada, 1-5 May 2006. http://www.definiens-imaging.com/documents/reference.htm:
Opportunities and limitations of object-based image analysis