chapter 6 theoretical models for flexure, deflection and...
TRANSCRIPT

155
CHAPTER 6
THEORETICAL MODELS FOR FLEXURE,
DEFLECTION AND DUCTILITY
6.1 GENERAL
Experimental investigation on Prefabricated Cage Reinforced
Concrete beams has been reported in Chapter 5. The behaviour of these
beams under increasing loads upto failure, modes of failure, load –
deformation response and ductile characteristics were discussed in
detail. In this chapter, an attempt is made to derive theoretical models
using the test results of previous chapter.
6.2 MATERIAL PROPERTIES
PCRC beams consist of two construction materials, each with
its own unique constitutive and strength properties and relationships.
Those considered herein are the concrete and perforated cold-formed
steel sheeting. The properties assumed for each are outlined in the
following sections.
6.2.1 Constitutive Behaviour of Concrete
Since the tensile strength of concrete is very low, its
contribution in the tension zone is neglected. The stress distribution of

156
concrete in the compression zone and the maximum strain were found
from the tests on concrete cylinders confined with prefabricated cage.
In compression, the uniaxial behaviour of concrete is found
experimentally for both confined and unconfined concrete cylinders.
Usually, the result obtained from the prediction equation is then
multiplied by a capacity reduction factor or factor of safety to reduce the
probability of failure within acceptable levels. In this investigation, it is
found from test results of confined cylinders (Chapter 3) that, the
strength of concrete due to Prefabricated Cage confinement is enhanced
by 1.2 to 1.8 times. This enhancement due to partial confinement is
taken in the following chapters as a partial safety factor. Hence, a factor
of safety is not added in the analysis.
For ultimate strength analysis that deals with the material
failure of concrete, the stress-strain relationship is assumed to have an
idealised stress distribution as shown in Figure 6.1, where the tensile
strength of the concrete is assumed to be zero.
6.2.2 Constitutive Behaviour of Cold-Formed Steel
The primary purpose of the sheet element in a composite beam
is to carry tensile stresses. Cold formed steel is elastic for a certain
region, and then its stress strain relationship becomes nonlinear as the
onset of plasticity is developed. The idealized stress-strain
representation, which was used to develop the model, is shown in
Figure 6.1.

157
Figure 6.1 Stress Strain Behaviour of Steel and Concrete
6.3 DEVELOPMENT OF MODEL FOR FLEXURAL
STRENGTH
6.3.1 Design Methodology
It has been shown that linear elastic analysis can be applied at
working or service loads to control both serviceability limit states such
as deflection and crack widths and the ultimate limit state of fatigue.
Linear elastic analysis can also be applied at ultimate loads to determine
the onset of buckling, or when the yield first occurs. However, in order
to determine the maximum possible strength of a composite beam, the
nonlinear techniques such as rigid plastic analysis (Deric Oehlers 1993,
Deric Oehlers and Mark Bradford 1995) is used.
The rigid plastic strength is, therefore, an upper bound to the
strength of the composite beam and requires that all other modes of
failure do not occur prior to this strength being achieved. It is, therefore,
fy or fck
STRESS
STRAIN

158
necessary here to ensure that premature failure through the following
modes does not occur:
a) Local buckling of steel elements
b) Failure of concrete due to concentrated dowel loads
imposed in it by the shear connectors
Furthermore, it is also necessary to ensure that the composite
beam has a sufficient rotational capacity to attain ultimate strength.
6.3.2 Assumptions Made in Developing the Analytical Model
In deriving expressions for flexural strength of a Prefabricated
Cage Reinforced Concrete beam using rigid plastic analysis, the
following five major assumptions are made.
1. Plane sections remain plane even after bending.
2. The stress-strain curve for cold formed sheet is the same
both in tension and compression.
3. Tensile strength of concrete is neglected.
4. Compressive stress distribution is represented by a
rectangular stress block.
5. The steel in the compression zone is neglected in the
moment of resistance.
The analysis and design of structures in flexure are based on
the satisfaction of the three basic sets of relationships, which must be
159
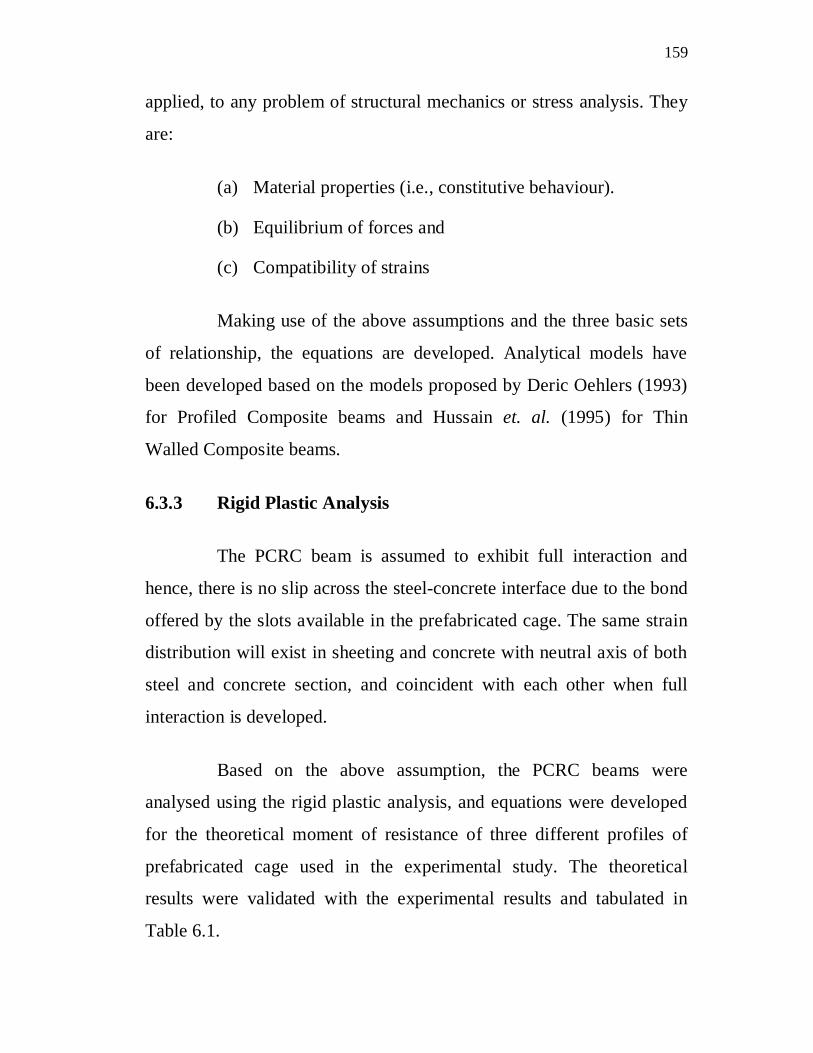
applied, to any problem of structural mechanics or stress analysis. They
are:
(a) Material properties (i.e., constitutive behaviour).
(b) Equilibrium of forces and
(c) Compatibility of strains
Making use of the above assumptions and the three basic sets
of relationship, the equations are developed. Analytical models have
been developed based on the models proposed by Deric Oehlers (1993)
for Profiled Composite beams and Hussain et. al. (1995) for Thin
Walled Composite beams.
6.3.3 Rigid Plastic Analysis
The PCRC beam is assumed to exhibit full interaction and
hence, there is no slip across the steel-concrete interface due to the bond
offered by the slots available in the prefabricated cage. The same strain
distribution will exist in sheeting and concrete with neutral axis of both
steel and concrete section, and coincident with each other when full
interaction is developed.
Based on the above assumption, the PCRC beams were
analysed using the rigid plastic analysis, and equations were developed
for the theoretical moment of resistance of three different profiles of
prefabricated cage used in the experimental study. The theoretical
results were validated with the experimental results and tabulated in
Table 6.1.

160
6.3.3.1 Theoretical Moment of Resistance of PCRC Beams with
Profile I
The stress diagram of concrete and sheet are given in
Figure 6.2.
Figure 6.2 Rigid Plastic Analysis of PCRC Beam with Profile I
Fundamental Equations
(a) Axial Strengths
Axial strengths of the various components were calculated
using the following expressions:
Axial Tensile force of steel sheet T= T1 + T2
T =2fyts(bt+dt) (6.1)
Axial compressive force of concrete C = f ckB Nc (6.2)

161
(b) Neutral Axis
Considering the steel sheets that are at yield, the equation for
Nc can be derived as:
Depth of Neutral axis in concrete componentBf
TNck
c . (6.3)
(c) Ultimate Moment
Taking moment of all the forces about the top fibre of the
beam, the moment capacity (Mth) of the PCRC beams can be determined
from the expression:
2)(
)(22
21cck
ttsythBNfdddbtfM (6.4)
6.3.3.2 Theoretical Moment of Resistance of PCRC Beams with
Profile II
The stress diagram of concrete and sheet are given in Figure 6.3.
Figure 6.3 Rigid Plastic Analysis of PCRC Beam with Profile II

162
Fundamental Equations
(a) Axial Strengths
Axial strengths of the various components were calculated
using the following expressions:
Axial Tensile force of steel sheet T =fyts(2bt1+bt2+2dt) (6.5)
Axial compressive force of concrete C = f ckB Nc (6.6)
(b) Neutral Axis
Considering the steel sheets that are at yield, the equation for
Nc can be derived as:
Depth of Neutral axis in concrete componentBf
TNck
c . (6.7)
(c) Ultimate Moment
Taking moment of all the forces about the top fibre of the
beam, the moment capacity (Mth) of the PCRC beams can be determined
from the expression:
2)(
2)2(2
2121cck
tttsythBNfdddbbtfM (6.8)
6.3.3.3 Theoretical Moment of Resistance of PCRC Beams with
Profile III
The stress diagram of concrete and sheet are given in Figure 6.4.

163
Figure 6.4 Rigid Plastic Analysis of PCRC Beam with Profile III
Fundamental Equations
(a) Axial Strengths
Axial strengths of the various components were calculated
using the following expressions:
Axial Tensile force of steel sheet T=T1+T2+T3
T = 2fyts(bt1+bt2+dt) (6.9)
Axial compressive force of concrete C= f ckB Nc (6.10)
(b) Neutral Axis
Considering the steel sheets that are at yield, the equation for
Nc can be derived as:
Depth of Neutral axis in concrete componentBf
TNck
c . (6.11)
164
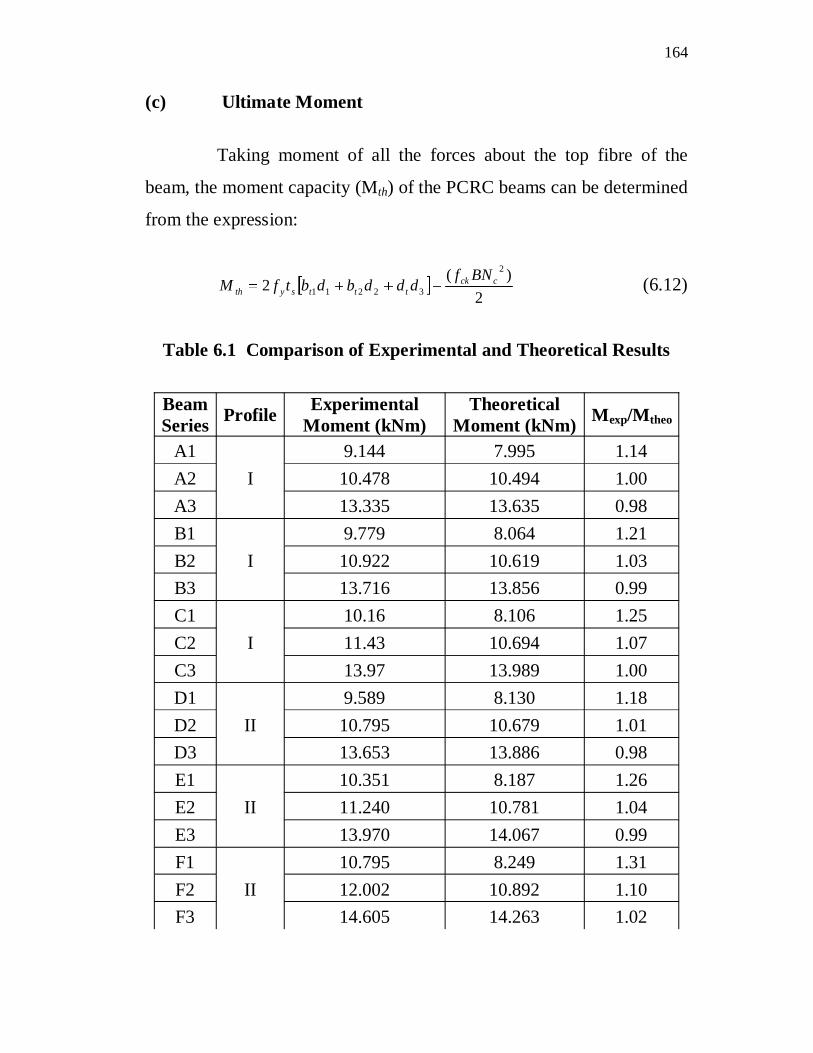
(c) Ultimate Moment
Taking moment of all the forces about the top fibre of the
beam, the moment capacity (Mth) of the PCRC beams can be determined
from the expression:
2)(
22
32211cck
tttsythBNfdddbdbtfM (6.12)
Table 6.1 Comparison of Experimental and Theoretical Results
BeamSeries Profile Experimental
Moment (kNm)Theoretical
Moment (kNm) Mexp/Mtheo
A1I
9.144 7.995 1.14A2 10.478 10.494 1.00A3 13.335 13.635 0.98B1
I9.779 8.064 1.21
B2 10.922 10.619 1.03B3 13.716 13.856 0.99C1
I10.16 8.106 1.25
C2 11.43 10.694 1.07C3 13.97 13.989 1.00D1
II9.589 8.130 1.18
D2 10.795 10.679 1.01D3 13.653 13.886 0.98E1
II10.351 8.187 1.26
E2 11.240 10.781 1.04E3 13.970 14.067 0.99F1
II10.795 8.249 1.31
F2 12.002 10.892 1.10F3 14.605 14.263 1.02

165
Table 6.1 (Continued)
BeamSeries Profile Experimental
Moment (kNm)Theoretical
Moment (kNm) Mexp/Mtheo
G1III
20.574 16.398 1.25G2 21.908 18.323 1.20G3 20.193 17.77 1.14H1
III21.717 16.694 1.30
H2 21.717 18.555 1.17H3 22.860 17.99 1.27I1
III23.813 16.880 1.41
I2 25.146 18.746 1.34I3 20.955 18.17 1.15J1
I18.860 16.635 1.13
J2 19.050 17.080 1.12J3 18.860 17.359 1.09K1
I18.288 16.793 1.09
K2 20.955 17.240 1.22K3 18.479 17.523 1.05L1
I18.479 16.919 1.09
L2 18.479 17.367 1.06L3 17.526 17.654 0.99
6.4 DEVELOPMENT OF MODEL FOR DEFLECTION
6.4.1 General
Composite beam is usually designed first for ultimate limit
states. Its behaviour in service must then be checked. For a simply
supported beam, the most critical serviceability limit state is usually
excessive deflection, which can govern the design when unpropped
construction is used.
166
For a composite beam with complete shear interaction between
the steel and the concrete components, there is no relative slip at the
steel/concrete interface. In practice, complete shear interaction is
assumed to coincide with the full shear connection. It may not always
be possible or necessary to have full shear connection.
While under-estimated deflection may result in serviceability
problem, an over estimated deflection would result in a rejection of a
design, which would have adverse financial effects on the project.
Therefore, accurate prediction of deflection in a reasonable effort
becomes increasingly important in a building design.
6.4.2 Assumptions
The following assumptions are made for analysis of deflection.
1. The behaviour of the beam is linearly elastic.
2. The curvature and vertical deflection of both the sheet and
concrete components are the same as those of the beam.
3. Deflections are small and shear deformation in the sheet,
and concrete components are neglected.
4. Provision of slots in the Prefabricated Cage provides
composite action between the sheet and concrete
components along with chemical bond.
5. Slip is negligible at the steel – concrete interface when the
loading is at service stage.

167
Figure 6.5 Transformed Section
6.4.3 Development of Model
The midspan deflection ( ) for the two point loading is
expressed as
)43(48
22 aLEI
Pa (6.13)
As shear span, a = L/4 in this study, Equation (6.13) can be
rewritten as
EIPL
76811 3
(6.14)

168
To determine the effective moment of inertia, transformed area
method is adopted. Figure 6.5 shows the transformed section.
cpptppgT AmAmAA )1()1( (6.15)
)2d
tD(Dd)2t
D(Db
)2dt(Dd)
2t(Db[1)tp2(m
2DBD.c.yTA
tsct
sct
cscc
sccs
(6.16)
Solving the above equation yields cy .
ty is found from ct yDy
Then the transformed moment of inertia is calculated as
follows:
])d
tty(tddt
)t
Dty(tbtb
)d
tcy(tdcdt)
tDcy(tb
tb)[pm(tBycBy
uI
tsst
tsscst
st
cssc
sscsc
sc
23
23
223
212212
212
3
21212
3
3
3
3
(6.17)
GtensionGcomp IIpmtycyBuI )1()33(
3 (6.18)
where modular ratio of steel sheet (mp) is,
cEpE
pm

169
The moment of inertia thus calculated is for an uncracked
transformed section. In the same way, the moment of inertia for cracked
transformed section is calculated as
33 tybII uc (6.19)
From the literature (Max Porter 1984) it is understood that the
effective moment of inertia for composite steel deck slabs can be used
as,
2uIcI
effI (6.20)
This recommendation for composite deck slabs is adopted
here. Hence, the effective moment of inertia for PCRC beam is given
by
)(1uIcIeffI (6.21)
Where, is a reduction factor.
The values of were calculated from experimental results and
are tabulated in Table 6.2. Using the regression analysis of experimental
results, the factor can be expressed in terms of percentage of steel ( )
and yield strength of steel (fy). The derived expression for is given
below,
= 5.646 0.735 (6.22)

170
Using this effective moment of inertia, the final deflection
becomes
effEIWl
eff3
.76811 (6.23)
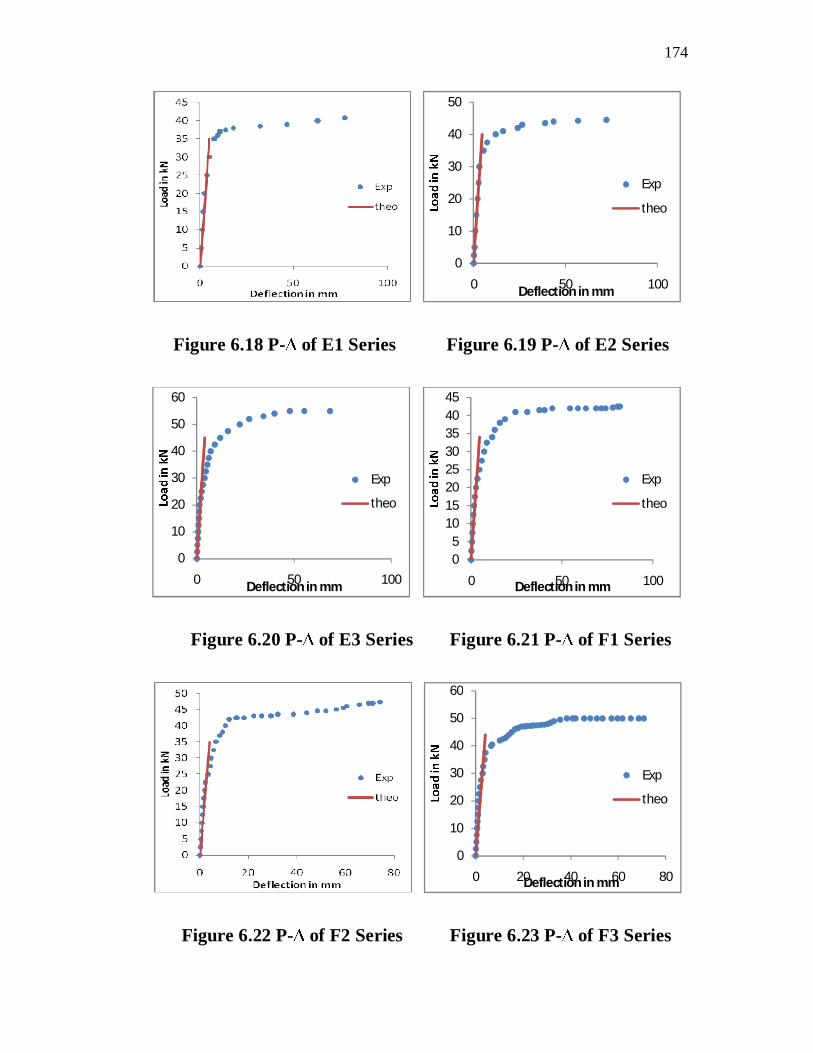
6.4.4 Application to Simply Supported PCRC Beams
The analysis for deflection considers the effect of loading on
the serviceability aspects of the composite beam. Therefore, for the
purpose of comparison between the measured data and the theoretical
models, only measured data upto the onset of observable nonlinear
behaviour is included. The onset of observable nonlinear behaviour is
based upon change in the slope of the measured load – deflection plots.
The aforementioned procedure is applied in order to carry out a
parametric study about deflection of simply supported beams. Using the
proposed equation, the behaviour of PCRC beam in deflection was
arrived and shown in Figure 6.6 - 6.41. The test results from the
Chapter 5 were used to compare the theoretical predictions. The results
are in good agreement under service load.
Sectional properties used for this investigation is presented in
Table 6.2. Using the reduction factor deflection at various load levels
were calculated and plotted in Figure 6.6 through 6.41. The theoretical
deflection at service load (Pu/1.5) is tabulated against corresponding
experimental deflection in Table 6.2.

171
Table 6.2 Comparison of Experimental and Theoretical deflectionof PCRC Beam Series
Sl.No
BeamSeries
Ps(kN)
fck(N/mm2)
fy(N/mm2) exp theo
exp @Ps (mm)
the @ Ps(mm)
1 A1 24.0 22.75 245 4.12 4.13 2.75 2.622 A2 27.5 22.75 262 3.83 3.60 3.60 2.743 A3 35.0 22.75 279 2.93 2.94 3.18 2.564 B1 25.7 27.86 245 4.19 4.13 3.70 3.425 B2 28.7 27.86 262 3.51 3.60 3.35 2.616 B3 36.0 27.86 279 2.76 2.94 4.21 3.627 C1 26.7 32.23 245 4.18 4.13 3.06 3.118 C2 30.0 32.23 262 3.51 3.60 3.70 3.239 C3 36.7 32.23 279 2.75 2.94 3.60 3.0010 D1 25.2 23.05 245 4.2 4.13 3.07 3.3411 D2 28.3 23.05 262 3.6 3.60 3.86 3.3812 D3 35.8 23.05 279 2.88 2.94 3.94 3.0613 E1 27.2 27.21 245 4.11 4.13 3.60 3.4014 E2 29.5 27.21 262 3.76 3.60 3.20 3.4515 E3 36.7 27.21 279 2.7 2.94 4.20 3.3716 F1 28.3 33.78 245 4.17 4.13 4.53 3.8317 F2 31.5 33.78 262 3.64 3.60 4.12 3.5518 F3 38.3 33.78 279 2.96 2.94 3.25 3.5019 G1 54.0 33.10 245 2.85 2.57 4.37 3.4320 G2 57.5 33.10 262 2.56 2.39 2.93 3.1621 G3 53.0 33.10 279 1.92 1.79 3.00 2.1622 H1 57.0 38.80 245 2.69 2.57 3.90 3.5323 H2 57.0 38.80 262 2.53 2.39 3.34 2.9624 H3 60.0 38.80 279 1.88 1.79 3.17 2.3525 I1 62.5 45.20 245 2.53 2.57 3.78 3.2726 I2 66.0 45.20 262 2.35 2.39 3.60 3.2927 I3 55.0 45.20 279 1.75 1.79 2.51 2.1328 J1 49.5 32.80 397 2.54 2.67 3.30 3.8129 J2 50.0 32.80 402 2.68 2.72 4.10 3.8230 J3 49.5 32.80 404 2.52 2.71 2.90 3.4231 K1 48.0 38.30 397 2.71 2.67 4.28 3.9732 K2 55.0 38.30 402 2.78 2.72 5.20 4.8033 K3 48.5 38.30 404 2.57 2.71 4.20 3.8934 L1 48.5 44.20 397 2.32 2.67 2.80 3.0535 L2 48.5 44.20 402 2.84 2.72 3.80 3.8736 L3 46.0 44.20 404 2.81 2.71 4.20 3.94
Ps = Assumed Service load taken as ultimate load/1.5

172
Figure 6.6 P- of A1 Series Figure 6.7 P- of A2 Series
Figure 6.8 P- of A3 Series Figure 6.9 P- of B1 Series
Figure 6.10 P- of B2 Series Figure 6.11 P- of B3 Series
0
10
20
30
40
50
60
0 50 100Deflection in mm
Exp
theo
0
5
10
15
20
25
30
35
40
0 20 40 60 80Deflection in mm
Exp
theo
05
1015202530354045
0 20 40 60 80Deflection in mm
Exp
theo

173
Figure 6.12 P- of C1 Series Figure 6.13 P- of C2 Series
Figure 6.14 P- of C3 Series Figure 6.15 P- of D1 Series
Figure 6.16 P- of D2 Series Figure 6.17 P- of D3 Series
05
1015202530354045
0 20 40 60Deflection in mm
Exptheo
0
10
20
30
40
50
0 50 100Deflection in mm
Exp
theo
0
10
20
30
40
50
60
0 50 100Deflection in mm
Exp
theo
174
Figure 6.18 P- of E1 Series Figure 6.19 P- of E2 Series
Figure 6.20 P- of E3 Series Figure 6.21 P- of F1 Series
Figure 6.22 P- of F2 Series Figure 6.23 P- of F3 Series
0
10
20
30
40
50
0 50 100Deflection in mm
Exp
theo
0
10
20
30
40
50
60
0 50 100Deflection in mm
Exp
theo
05
1015202530354045
0 50 100Deflection in mm
Exp
theo
0
10
20
30
40
50
60
0 20 40 60 80Deflection in mm
Exp
theo
175
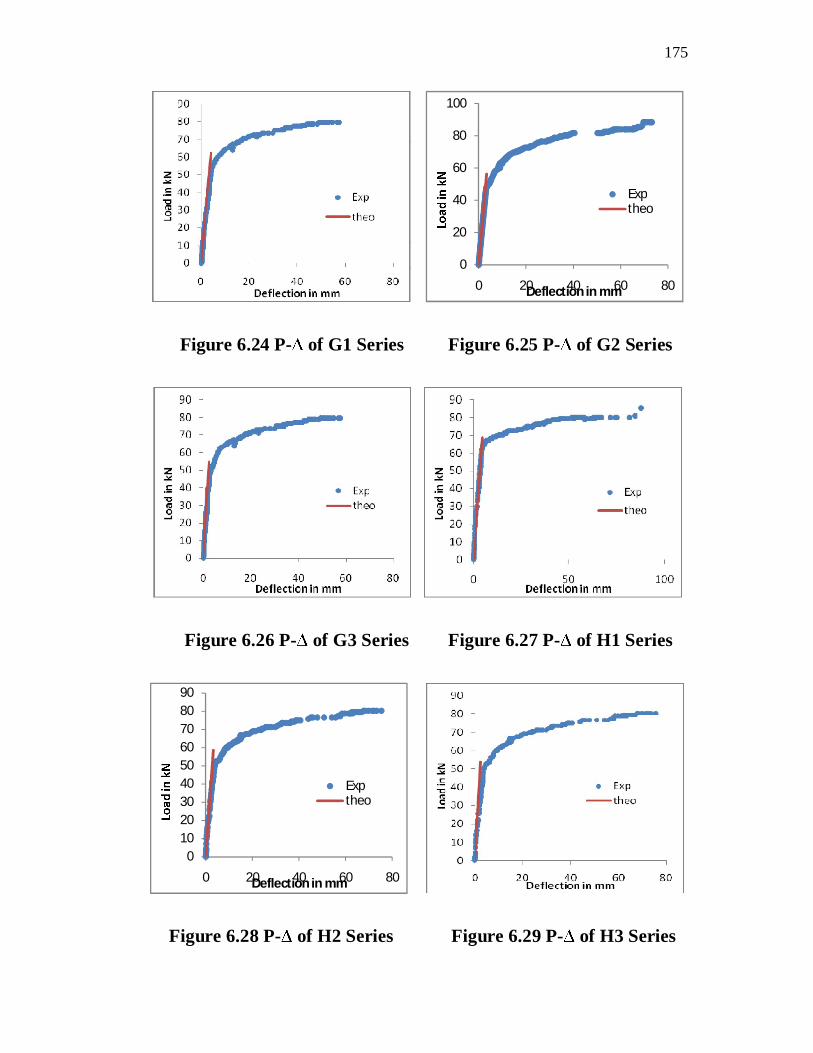
Figure 6.24 P- of G1 Series Figure 6.25 P- of G2 Series
Figure 6.26 P- of G3 Series Figure 6.27 P- of H1 Series
Figure 6.28 P- of H2 Series Figure 6.29 P- of H3 Series
0
20
40
60
80
100
0 20 40 60 80Deflection in mm
Exptheo
0102030405060708090
0 20 40 60 80Deflection in mm
Exptheo

176
Figure 6.30 P- of I1 Series Figure 6.31 P- of I2 Series
Figure 6.32 P- of I3 Series Figure 6.33 P- of J1 Series
Figure 6.34 P- of J2 Series Figure 6.35 P- of J3 Series
0102030405060708090
0 20 40 60 80Deflection in mm
ExpTheo
0
10
20
30
40
50
60
70
80
0 50 100Deflection in mm
Exp
Theo

177
Figure 6.36 P- of K1 Series Figure 6.37 P- of K2 Series
Figure 6.38 P- of K3 Series Figure 6.39 P- of L1 Series
Figure 6.40 P- of L2 Series Figure 6.41 P- of L3 Series
0
10
20
30
40
50
60
70
80
0 50 100Deflection in mm
Exp
Theo
0
10
20
30
40
50
60
70
80
0 20 40 60Deflection in mm
Exp
Theo

178
6.5 DEVELOPMENT OF MODEL FOR DUCTILITY
6.5.1 General
A structural member is to be designed with sufficient ductility
capacity to avoid brittle failure in flexure and ensure a ductile behaviour,
especially for seismic design. The current philosophy of seismic design
of moment-resisting reinforced concrete frames is based on the
formation of plastic hinges at the critical sections of the frame under the
effect of substantial load reversals in the inelastic range. The ability of
the plastic hinges to undergo several cycles of inelastic deformations
without significant loss in its strength capacity is usually assessed in
terms of the available ductility of the particular section.
The ductility capacity of a section can be expressed in the form
of curvature ductility factor ( ). The moment-curvature analysis
performed under monotonically increasing load represents only the first
quarter-cycle of the actual hysteretic behaviour of the plastic hinge on
rotation under the earthquake loading. Therefore, of a section
calculated under such an assumption is considered a theoretical estimate
of the actual ductility that can be supplied by the section when subjected
to an actual earthquake loading.
However, the theoretical estimation of under monotonic
loading is widely used as an appropriate indicator of the adequacy of the
earthquake resistant design of RC members. It is even used for
prediction of the damage level in frames under earthquake loading.
Although, the actual response of the frame subjected to severe
earthquakes is complex and involves large uncertainties, prediction of

179
damage is usually made in terms of ductility demand on individual
members.
Improving the ductility of the materials generally leads to an
improvement in the ductility of the section. Based on a closer
examination of published literature, ductility of concrete is being
improved at present by confining it using steel binders, as ties in
compression members and as closely spaced stirrups in beams. The
ductility of structures can be improved by adding compression steel in
the concrete section or by confining the compression zone which leads
to an improvement in the ductility of the material. The concrete confined
in such a way is called confined concrete or ductile concrete (Park and
Dai Tuitong 1988, Park and Paulay 1975).
In PCRC beams, compression zone is partially confined by the
perforated steel sheet. This aids in confinement, which helps to increase
ductility factor.
6.5.2 Methods of Defining Ductility
The term ductility is generally quantitatively described by a
parameter called “ductility factor” or “ductility ratio”.
The most common measures of ductility are:
The inelastic deformation u y.
Cross sectional ductility in terms of Ductility factor

180
Two types of ductility factors were employed in this study:
a) Displacement ductility factor (µ = u / y).
where,
uis the displacement at ultimate load and
y is the displacement at which tension steel yields.
b) Curvature ductility factor (µØ = Øu / Øy)
where,
Øuis the curvature corresponding to u, and
Øy is the curvature at which tension steel yields.
The energy absorbed by the element or structure as given
by the area under the force deformation diagram.
Rotation capacity
Limiting value of neutral axis depth.
6.5.2.1 Method: 1 Inelastic Deformation
The length of an inelastic zone formed in the load – deflection
response is usually defined as inelastic deformation. The idealized
inelastic zone in a beam is shown in Figure 6.42. This is calculated from
experimental results and is presented in Table 5.5.

181
Figure 6.42 Idealized load – Deformation Curve
6.5.2.2 Method:2 Cross Sectional Ductility of PCRC Beam
The ductility of beams may be defined in terms of the
behaviour of individual cross-sections or the behaviour of entire beams.
The cross sectional ductility is widely used as a measure of beam
ductility represented as the ductility factor.
6.5.2.3 Calculation of Yield and Ultimate Curvatures
A typical PCRC beam section with its corresponding strain
distribution at the yield and ultimate stages are shown in Figures 6.43
and 6.44.
As all the beams exhibit nearly full shear connection at
ultimate, for the calculation of the ductility factor, slip in these beams is
ignored. The curvature calculations are given by the following
equations:

182
a) At yield stage
Figure 6.43 Stress-strain Diagram at Yield Stage
Yield Curvaturey
yy N
(6.24)
where Ny can be determined by assuming the linear stress distribution
and satisfying the equilibrium condition of forces. This leads to:
The neutral axis (Ny) at the yield state is obtained from the
equilibrium condition which is given in Equation (6.25).
TC
For Profile I,
ttsyyck bdtfBNf 2
ck
ttysy Bf
bdftN
)(2 (6.25)

183
For Profile II,
fckBNy= fyts(2bt1+bt2+2dt)
ck
tttysy Bf
bbdftN
)22( 21 (6.26)
For Profile III,
fckBNy= 2fyts(bt1+bt2+dt)
ck
tttysy Bf
bbdftN
)(2 21 (6.27)
where,
ckf - cube compression strength at 28th day in MPa
yf - yield stress of steel sheet in MPa
At ultimate stage
Ultimate Curvatureu
uu N
(6.28)
where,
u = Concrete compressive strain at crushing of concrete or
at ultimate moment
Nu = Depth of compression zone at ultimate, can be
determined by satisfying equilibrium equation of forces.

184
For Profile I,
)
= 2 ) (6.29)
For Profile II,
[ ]
[2( ) ] (6.30)
For Profile III,
)[ ]
= 2 ( ) (6.31)
where,
d= Effective depth
Ast= Area of tension reinforcement

185
Figure 6.44 Stress – Strain Diagram at Ultimate Stage
From strain compatibility conditions,
)( u
s
u
cu
NdN (6.32)
=
=
(6.33)
From equilibrium conditions,
21 TTC
styuck AfBNf
(6.34)

186
= 0 (6.35)
; ;
02 cbNaN uu (6.36)
Solving Equation (6.36), Nu can be obtained as
= ±
The addition of compression reinforcement in the form of
continuous sheet to a beam will shift the neutral axis upwards and
increase the ultimate curvature substantially, although it has a little
effect on its yield strength or yield curvature. Hence, the curvature
ductility factor is defined as,
y
u (6.37)
ssy
y
u
cu Ef
NdN
)( (6.38)
Using Equation (6.38), curvature ductility factor (CDF) for the
sections tested in Chapter 5 was evaluated and are presented in
Table 6.3. The ratio between the experimental and theoretical ductility
factor shows the accuracy of the equation.

187
Table 6.3 Theoretical and Experimental Ductility Factor
Sl.No BeamID
Neutral axis Curvature ductilityfactor
Ratio
THE
EXP
,
,Nu
(mm)Ny
(mm)Theory( T, )
Expt.( E, )
1 A1 37.03 14.93 12.19 12.93 1.062 A2 40.49 19.96 9.91 10.88 1.103 A3 44.72 26.57 8.12 8.65 1.074 B1 35.42 12.19 12.98 13.93 1.075 B2 38.76 16.30 10.61 11.03 1.046 B3 42.84 21.70 8.78 8.97 1.027 C1 34.30 10.54 13.55 14.34 1.068 C2 37.55 14.09 11.11 11.28 1.029 C3 41.53 18.76 9.24 9.58 1.04
10 D1 37.23 14.74 12.34 13.12 1.0611 D2 40.71 19.70 10.03 10.21 1.0212 D3 44.97 26.23 8.24 8.91 1.0813 E1 35.90 12.49 12.93 14.10 1.0914 E2 39.28 16.69 10.61 11.85 1.1215 E3 43.42 22.22 8.77 9.06 1.0316 F1 34.23 10.06 13.83 14.05 1.0217 F2 37.47 13.44 11.36 11.18 0.9818 F3 41.45 17.90 9.46 9.54 1.0119 G1 49.01 18.66 8.37 8.37 0.9720 G2 49.20 17.35 8.33 8.33 0.9721 G3 52.38 18.70 8.50 8.13 0.9622 H1 47.41 13.27 9.23 9.23 1.0023 H2 47.60 14.80 9.04 9.04 1.0024 H3 50.69 15.95 8.93 8.93 1.0025 I1 45.92 11.39 9.83 9.83 1.0226 I2 46.09 12.70 9.34 9.34 1.0027 I3 49.11 13.70 9.37 9.10 0.9728 J1 38.61 21.17 7.20 9.41 1.3129 J2 38.67 21.24 7.17 8.58 1.1930 J3 39.11 21.55 7.15 8.16 1.1431 K1 37.32 18.13 7.60 9.07 1.1932 K2 37.37 18.19 7.56 8.66 1.1533 K3 37.80 18.46 7.55 8.24 1.0934 L1 36.16 15.71 7.971 8.70 1.0935 L2 36.21 15.76 7.93 8.27 1.0436 L3 36.63 15.99 7.91 8.08 1.02

188
6.6 KEY FINDINGS
From the analytical investigations carried out in the present
study, the following major findings can be arrived at.
The theoretical models have been developed for flexural
strength using rigid plastic analysis. The proposed model
incorporates the enhanced compressive strength of
concrete due to confinement, and full shear connection is
assumed between perforated sheet and concrete.
The analytical expressions developed are in close
agreement with experimental results in predicting the
ultimate strength in bending.
The deflection equation is developed considering
uncracked and cracked transformed moment of inertia. A
reduction factor ( ) is introduced in the deflection
equation. An equation is also derived for in terms of
percentage of steel and yield strength of steel using
regression analysis.
Beyond service load level, theoretical deflection is started
to vary from the actual deflection.
From equilibrium forces and strain compatibility
conditions at yield stage and at ultimate stage, the
equation for curvature ductility factor is arrived. The
experimental and theoretical ductility factors are in good
agreement.