chapter 6 stavudine - shodhgangashodhganga.inflibnet.ac.in/bitstream/10603/8225/13/13_chapter...
TRANSCRIPT
CHAPTER 6
STAVUDINE

148
6.1. DRUG PROFILE
Stavudine is a synthetic thymidine nucleoside analogue, active against the human
immunodeficiency virus type 1 (HIV-1) approved by the FDA in June, 1994. Stavudine is
sold with the brand name ZERIT. It is in a class of drugs called reverse transcriptase
inhibitors which also includes zalcitabine (Hivid), zidovudine (Retrovir), didanosine
(Videx), and lamivudine (Epivir). Stavudine is an analog of thymidine. Stavudine does
not kill existing HIV virus and it is not a cure for HIV. But it is phosphorylated by
cellular kinases into active triphosphate. Stavudine triphosphate inhibits the HIV reverse
transcriptase by competing with natural substrate, thymidine triphosphate. It also causes
termination of DNA synthesis by incorporating into it.
Figure 6.A: Structure of Stavudine
IUPAC NAME : 1-((2R, 5S)-5-(hydroxymethyl)-2, 5-dihydrofuran-2-yl)-
5-methylpyrimidine-2, 4(1H, 3H)- Dione
FORMULA : C10H12N2O4
MOLECULAR WEIGH
: 224.2
The chemical name for Stavudine is 2', 3'-didehydro-3'-deoxythymidine.
Stavudine is a white to off-white crystalline solid. Stavudine, when used alone or in
combination with other antiviral medications, may cause serious and possibly deadly
damage to the liver and pancreas and a life-threatening condition called lactic acidosis.
Molecular Structure of Stavudine is shown in Figure: 6.A. The most severe side effects
149
with Stavudine are a decrease in blood cells, muscle pain (myopathy), pancreatitis, liver
failure and metabolic disturbance (lactic acidosis). Stavudine damages nerves and can
cause a severe peripheral neuropathy.
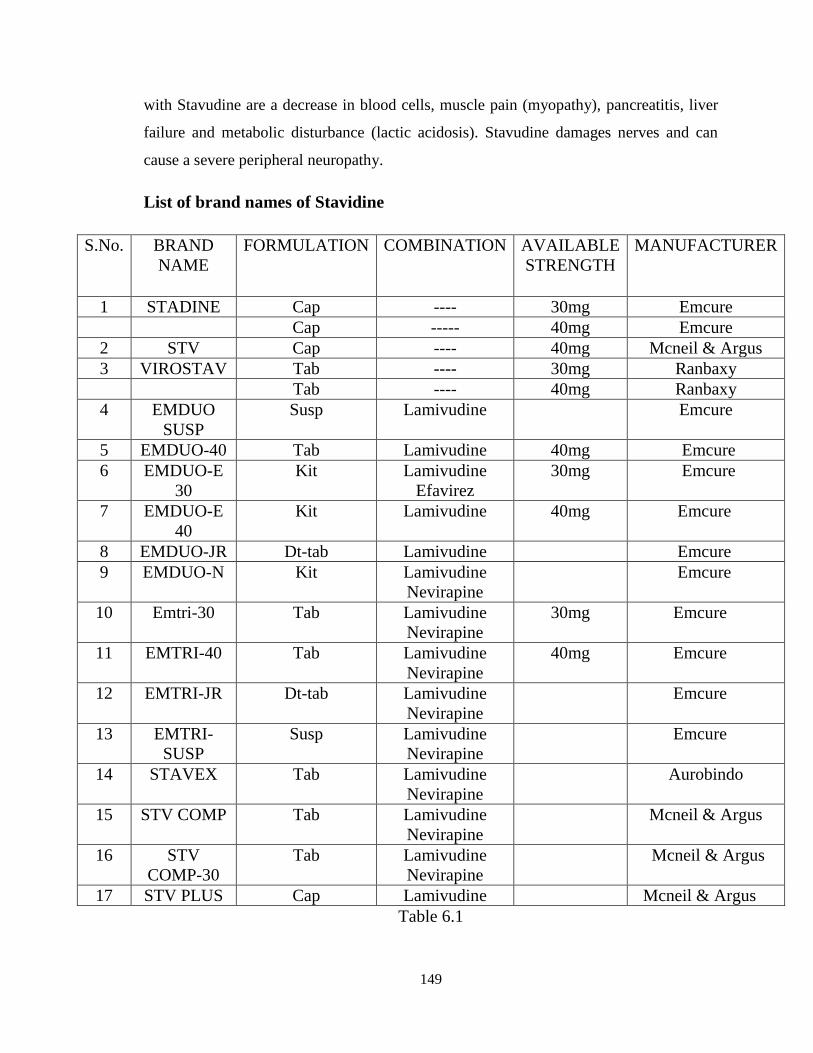
List of brand names of Stavidine
S.No. BRAND
NAME
FORMULATION COMBINATION AVAILABLE
STRENGTH
MANUFACTURER
1 STADINE Cap ---- 30mg Emcure
Cap ----- 40mg Emcure
2 STV Cap ---- 40mg Mcneil & Argus
3 VIROSTAV Tab ---- 30mg Ranbaxy
Tab ---- 40mg Ranbaxy
4 EMDUO
SUSP
Susp Lamivudine Emcure
5 EMDUO-40 Tab Lamivudine 40mg Emcure
6 EMDUO-E
30
Kit Lamivudine
Efavirez
30mg Emcure
7 EMDUO-E
40
Kit Lamivudine 40mg Emcure
8 EMDUO-JR Dt-tab Lamivudine Emcure
9 EMDUO-N Kit Lamivudine
Nevirapine
Emcure
10 Emtri-30 Tab Lamivudine
Nevirapine
30mg Emcure
11 EMTRI-40 Tab Lamivudine
Nevirapine
40mg Emcure
12 EMTRI-JR Dt-tab Lamivudine
Nevirapine
Emcure
13 EMTRI-
SUSP
Susp Lamivudine
Nevirapine
Emcure
14 STAVEX Tab Lamivudine
Nevirapine
Aurobindo
15 STV COMP Tab Lamivudine
Nevirapine
Mcneil & Argus
16 STV
COMP-30
Tab Lamivudine
Nevirapine
Mcneil & Argus
17 STV PLUS Cap Lamivudine Mcneil & Argus
Table 6.1

150
6.2 . LITREATURE SURVEY
Several analytical methods have been reported for the determination of Stavudine in
pure drug, pharmaceutical dosage forms and in biological samples using
spcetrophotometry liquid chromatography, electro kinetic chromatography high
performance thin layer chromatography either in single or in combined forms.
Pawan K Saini et al [1]
has described a simple, fast, precise and accurate reverse
phase high performance liquid chromatographic method for the simultaneous
determination and validation of lamivudine (3TC) and Stavudine (d4T) in tablets. A
sunfire C18, 250 × 4.6 mm, 5 mm particle size column in isocratic mode was used with
mobile phase comprising of methanol: 0.1 % w/v of ammonium acetate, adjusted to pH
3.8 with glacial acetic acid in the ratio of 15:85, v/v. The flow rate was set at 1.2 ml per
minute with UV detection at 266 nm. The retention time of 3TC, d4T was found 5.6 and
8.9 minute respectively. Linearity for lamivudine and Stavudine were found in the range
of 75-225mg/ml and 20-60mg/ml respectively. Percentage recoveries were obtained in
the range of 98.97 % to 99.71 % for lamivudine and 99.22 % to 99.59 % for Stavudine.
The proposed method is precise, accurate, selective, reproducible, and rapid for the
simultaneous estimation of lamivudine and Stavudine in tablet dosage forms.
Anbazhagan S et al [2]
has developed methods for simultaneous quantification of
Stavudine (SV), lamivudine (LV) and nevirapine (NV) in tablets by UV spectroscopy,
reverse phase HPLC (RP-HPLC) and HPTLC. In the UV multi-component spectral
method, SV, LV and NV was quantified at 266, 271 and 315 nm, respectively. In the RP-
HPLC method, the drugs were resolved using a mobile phase of 20 mM sodium
phosphate buffer (containing 8 mM 1-octanesulphonicacid sodium salt): acetonitrile (4:1,
v/v) with pH adjusted to 3.5 using phosphoric acid on a C18-ODS-Hypersil (5 micron,
250 mm x 4.6 mm) column in isocratic mode. The retention time of SV, LV and NV was
2.85, 4.33 and 8.39 min, respectively. In the HPTLC method, the chromatograms were
developed using a mobile phase of chloroform: methanol (9:1, v/v) on precoated plate of
silica gel 60 F254 and quantified by densitometric absorbance mode at 265 nm. The Rf of
SV, LV and NV were 0.21-0.27, 0.62-0.72 and 0.82-0.93, respectively. Recovery values
of 99.16-101.89%, percentage relative standard deviation of <0.7 and correlation
151
coefficient (linear dynamic range) of 0.9843-0.9999 shows that the developed methods
were accurate and precise. These methods can be employed for the routine analysis of
tablets containing SV, LV and NV.
Namita Kapoor et al [3]
were described two methods for the simultaneous
determination of lamivudine (3TC) and Stavudine (d4T) in combined pharmaceutical
tablets. The first method depends on first derivative UV-spectrophotometry with zero-
crossing measurement technique. The first derivative absorbance at 280 and 300 nm were
selected for the determination of Stavudine and lamivudine, respectively. The second
method is based on the separation of both drugs by high performance liquid
chromatography using methanol: water (20:80) as the mobile phase at 0.6 ml/min on a
reverse phase column with detection at 270 nm. Both the methods showed good linearity,
reproducibility and precision. No spectral or chromatographic interferences from the
tablet excipients were found. The proposed methods were suitably applied to the assay of
commercial formulations. The procedures were rapid, simple and suitable for routine
quality control application.
M. Sarasa et al [4]
has developed a Sensitive HPLC assays for the quantification
of Stavudine (2', 3'-didehydro-3'-deoxythymidine) in human plasma and urine. The
methods are linear over the concentration range 0.025-25 and 2-150 µg/ml in plasma and
urine, respectively. An aliquot of 0.2 ml of plasma was extracted by SPE using Oasis
cartridges, while urine samples were simply diluted 1 + 99 with HPLC water. The
analytical column, mobile phase, instrumentation and chromatographic conditions are the
same for both methods. The methods have been validated separately and stability tests
under various conditions have been performed. The detection limit is 12 ng/ml in plasma
for a sample size of 0.2 ml. The bioanalytical assay has been used in a pharmacokinetic
study of pregnant women and their newborns.
Marc Schuman et al [5]
were developed and validated a reversed phase HPLC
method using photo diode array detection for the simultaneous quantification of
lamivudine, Stavudine, nevirapine, zidovudine, methyl paraben and propyl paraben in
solid and liquid drug formulations. The separation was achieved using a Waters
152
Symmetry C8 column, using a mobile phase gradient comprising 50 mM NaH2 PO4 (pH
3.8) and acetonitrile (95:5 to 45:55, v/v) and a flow gradient (0.5 to 1.0 ml/min). The
limits of detection and quantification were below 19 ng/ml and 55 ng/ml respectively. The
intra- and inter-day assay precisions were within 4.4% relative standard deviations. The
developed method was applied to 12 different generic antiretroviral medications, consisting
of tablets, capsules and solutions, produced by two Indian manufacturers and purchased by
the Central Agency of Essential Drug Procurement of Rwanda for the ESTHER project in
Rwanda. The average content of the antiretroviral agent(s) compared to the labeled
amount(s) was 101.4%. Methyl paraben and propyl paraben, added to solutions as
preservatives, were within the FDA recommended limits.
CH.Balasekharareddy et al [6]
has developed and validated a simple, rapid,
precise and accurate isocratic reverse phase stability indicating RP-HPLC method for the
simultaneous estimation of Lamivudine and Stavudine in commercial tablets. The method
has shown adequate separation for Lamivudine (RT-3.087) and Stavudine (RT-6.09)
respectively. Separation was achieved on an YMC pack, C8, 150mmX4.6mm, 5µ column
using a mobile phase consisting of buffer pH 3.5 and methanol in the ratio of 90:10v/v at
a flow rate of 1.0ml/min. the detection was carried out by PDA detector at the
wavelength maximum of 265 nm. The drugs were subjected to acid degradation, base
degradation, peroxide degradation, thermal degradation, photolytic degradation and
humidity degradation. The linearity of proposed method was investigated in the range of
5-50 µg/ml (r= 0.99989) for Stavudine and 20-220µg/ml (r= 0.99997) for Lamivudine,
respectively.
Triporn Wattananat et al [7]
has developed and validated a high performance
liquid chromatographic method with UV detection for simultaneous determination of
Stavudine and lamivudine in human plasma using solid-phase extraction for sample
clean-up. Zidovudine was used as an internal standard. Separation was performed on a
C18 column by gradient elution with a mobile phase of 10 mM acetate buffer pH 6.5 and
acetonitrile. The UV detection was set at 265 nm. The method proved to be specific,
accurate, precise and linear over the concentration ranges of 50-3,000 ng/ml for
Stavudine and 50-5,000 ng/ml for lamivudine with correlation coefficients always >0.996
for both drugs. The intra-day and inter-day precision and accuracy were less than 9.2%

153
for both analytes. The absolute recoveries of both compounds ranged from 93.3 to 97.5%.
The method was successfully applied to a bioavailability study of a combined tablet
formulation containing 30 mg of Stavudine and 150 mg of lamivudine compared with
each reference formulation concurrently administered in 26 healthy Thai male volunteers.
A. Tarinas et al [8]
has described and validated a Simple methods for the
determination of zidovudine (AZT), Stavudine (d4T), lamivudine (3TC) and indinavir
(INV) in human plasma by reversed-phase liquid chromatography (HPLC) with UV
detection. Solid-liquid extraction procedures were applied to the samples prior to
analysis. Chromatography was performed on a C-18 analytical columns and the retention
time ranged from 6.8 to 8.0 min for Stavudine, 7.5 to 9.0 min for lamivudine, 11.2 to 11.9
min for zidovudine and indinavir. Four methods were validated for specificity, inter-and
intra-assay precision and accuracy, absolute recovery and stability. Analytical curve
ranged from 10-1600 ng/ml for Stavudine, 50-3200 ng/ml for lamivudine, 0.05-5.0 µg/ml
for zidovudine and 0.1-10.0 µg/ml for indinavir. Analytes stability during sampling
processing and storage were established. Extraction recoveries are higher than 89% for
all formulations. These methods proved to be simples, accurate and precise, and are
currently in use in our laboratory for the quantitative analysis of antiretroviral products in
plasma, and for further pharmacokinetics and bioequivalence studies.
Lian Zhou et al [9]
has investigated the disposition of Stavudine, a potent and
orally active nucleoside reverse transcriptase inhibitor in six healthy human subjects.
Before dosing humans with [1-14C] Stavudine, a tissue distribution study was performed
in Long-Evans rats. Results from this study showed no accumulation of radioactivity in
any of the tissues studied, indicating that the position of the C-14 label on the molecule
was appropriate for the human study. After a single 80-mg (100 _Ci) oral dose of [1-14C]
Stavudine, approximately 95% of the radioactive dose was excreted in urine with an
elimination half-life of 2.35 h. Fecal excretion was limited, accounting for only 3% of the
dose. Unchanged Stavudine was the major drug-related component in plasma (61% of
area under the plasma concentration-time curve from time zero extrapolated to infinite
time of the total plasma radioactivity) and urine (67% of dose). The remaining
radioactivity was associated with minor metabolites, including mono- and bis-oxidized
154
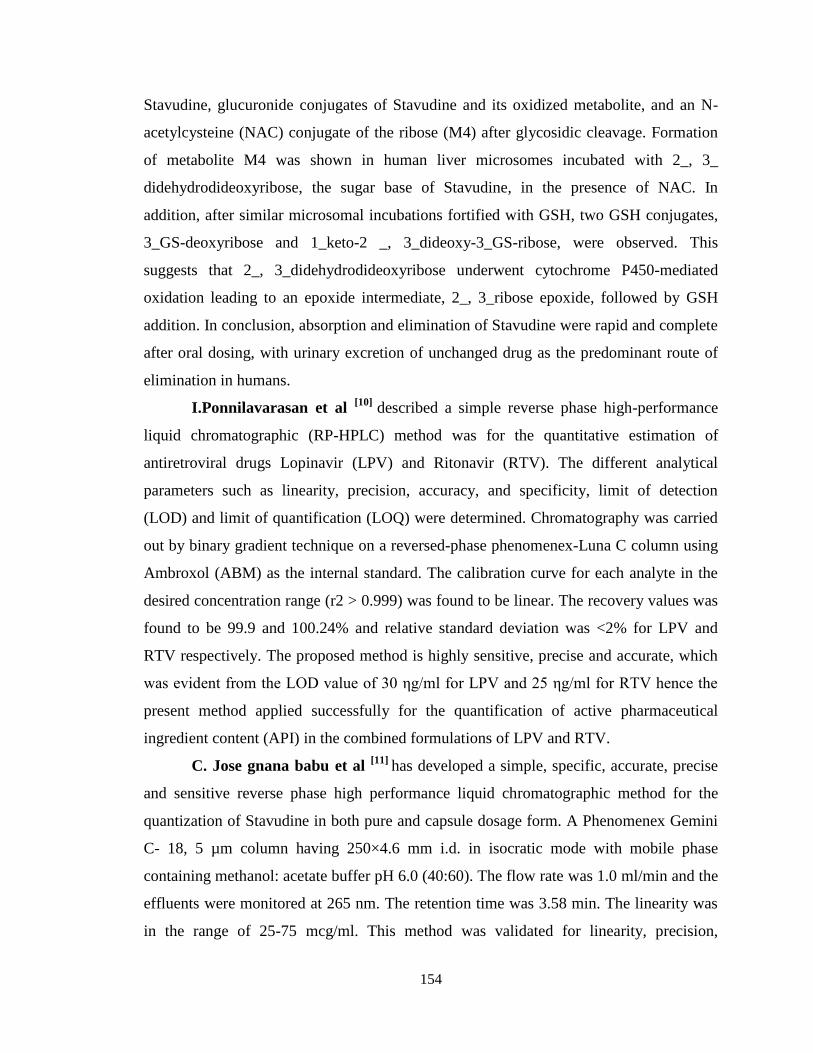
Stavudine, glucuronide conjugates of Stavudine and its oxidized metabolite, and an N-
acetylcysteine (NAC) conjugate of the ribose (M4) after glycosidic cleavage. Formation
of metabolite M4 was shown in human liver microsomes incubated with 2_, 3_
didehydrodideoxyribose, the sugar base of Stavudine, in the presence of NAC. In
addition, after similar microsomal incubations fortified with GSH, two GSH conjugates,
3_GS-deoxyribose and 1_keto-2 _, 3_dideoxy-3_GS-ribose, were observed. This
suggests that 2_, 3_didehydrodideoxyribose underwent cytochrome P450-mediated
oxidation leading to an epoxide intermediate, 2_, 3_ribose epoxide, followed by GSH
addition. In conclusion, absorption and elimination of Stavudine were rapid and complete
after oral dosing, with urinary excretion of unchanged drug as the predominant route of
elimination in humans.
I.Ponnilavarasan et al [10]
described a simple reverse phase high-performance
liquid chromatographic (RP-HPLC) method was for the quantitative estimation of
antiretroviral drugs Lopinavir (LPV) and Ritonavir (RTV). The different analytical
parameters such as linearity, precision, accuracy, and specificity, limit of detection
(LOD) and limit of quantification (LOQ) were determined. Chromatography was carried
out by binary gradient technique on a reversed-phase phenomenex-Luna C column using
Ambroxol (ABM) as the internal standard. The calibration curve for each analyte in the
desired concentration range (r2 > 0.999) was found to be linear. The recovery values was
found to be 99.9 and 100.24% and relative standard deviation was <2% for LPV and
RTV respectively. The proposed method is highly sensitive, precise and accurate, which
was evident from the LOD value of 30 ηg/ml for LPV and 25 ηg/ml for RTV hence the
present method applied successfully for the quantification of active pharmaceutical
ingredient content (API) in the combined formulations of LPV and RTV.
C. Jose gnana babu et al [11]
has developed a simple, specific, accurate, precise
and sensitive reverse phase high performance liquid chromatographic method for the
quantization of Stavudine in both pure and capsule dosage form. A Phenomenex Gemini
C- 18, 5 µm column having 250×4.6 mm i.d. in isocratic mode with mobile phase
containing methanol: acetate buffer pH 6.0 (40:60). The flow rate was 1.0 ml/min and the
effluents were monitored at 265 nm. The retention time was 3.58 min. The linearity was
in the range of 25-75 mcg/ml. This method was validated for linearity, precision,

155
specificity, and limit of detection, limit of quantization, accuracy, ruggedness and
robustness. Statistical analysis proves that the method is reproducible and selective for
the estimation of the said drug.
V Reddy Panditi et al [12]
had developed a simple, accurate, precise and sensitive
First order derivative Spectrophotometric method for the estimation of Stavudine in bulk
and pharmaceutical dosage forms. The estimation of Stavudine was carried out at
maximum absorbance of 250 nm. The method was found to be linear and obeys Beer’s
law in the concentration range of 2-20 mcg / ml. The developed method was validated
according to ICH guidelines and was found to be accurate and precise. Thus the proposed
method can be successfully applied for the estimation of Stavudine in bulk and
pharmaceutical dosage forms.
S.Jayaseelan et al [13]
has developed and validated a simple, accurate, precise and
sensitive HPLC method with UV detection to separate and detect lamivudine in human
plasma using Stavudine as an internal standard. Lamivudine (3-TC) and Stavudine
(internal standard) were extracted from human plasma using
methanol protein
precipitation and were chromatographed on a Phenomenex C18 (250X4.6mm.,5mµ
particle size) column using 20µl injection volume and detection at 270nm.An isocratic
mobile phase consisting of Methanol: Water (85:15%v/v) was used to separate these
drugs. The retention times of lamivudine and I.S were 4.6 and 6.2 respectively. The
method was validated over the range of 406.10-4020.05ng/ml. The
limit
of
detection
was
200 ng/ml and
the
limit
of
quantification
was
400 ng/ml
for
3TC.
Within
and
between-
day
precisions are less than 6.5%
for
all
quality
control
samples.
The
absolute
recoveries
of
3-
TC was greater
than 90%
were
achieved.
The
described
method
can be
readily
utilized
for
analysis of
pharmaceutical
products.
Weerasak Samee et al [14]
has developed and validated a rapid and reliable
reverse-phase high performance liquid chromatographic for simultaneous determination
of lamivudine, Stavudine and nevirapine in presence of their acid-induced degradation
products. Gradient chromatography using Thermo Hypersil Gold C18 column (150 mm x
4.6 mm, 5 µm) eluted with two mobile phase components: mobile phase A comprising of
20 mM sodium phosphate buffer with pH adjusted to 3.5 with phosphoric acid and mobile
phase B (methanol) with a flow rate of 1.0 mL/min and a detection wavelength at 265
156
nm. The retention times for lamivudine, Stavudine and nevirapine were 4.6, 7.8, and 14.8
min, respectively. The calibration curves were linear (r18 > 0.9997 for all three
compounds). The R.S.D. values for intra- and inter-day precision studies were < 1.10%
and < 1.60%, respectively. The recovery of three drugs determined from a spiked sample
ranged from 98.02% to 101.56%. The method was also effective in quantitative analyses
of the marketed tablet formulations.
157
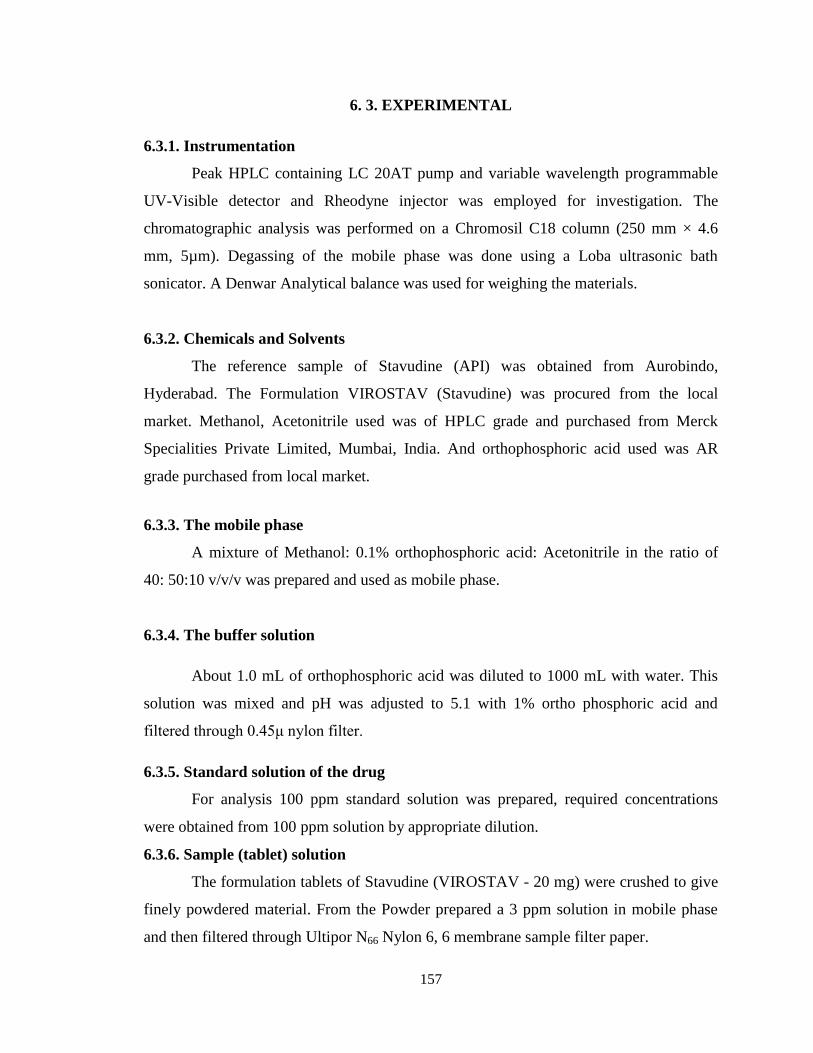
6. 3. EXPERIMENTAL
6.3.1. Instrumentation
Peak HPLC containing LC 20AT pump and variable wavelength programmable
UV-Visible detector and Rheodyne injector was employed for investigation. The
chromatographic analysis was performed on a Chromosil C18 column (250 mm × 4.6
mm, 5µm). Degassing of the mobile phase was done using a Loba ultrasonic bath
sonicator. A Denwar Analytical balance was used for weighing the materials.
6.3.2. Chemicals and Solvents
The reference sample of Stavudine (API) was obtained from Aurobindo,
Hyderabad. The Formulation VIROSTAV (Stavudine) was procured from the local
market. Methanol, Acetonitrile used was of HPLC grade and purchased from Merck
Specialities Private Limited, Mumbai, India. And orthophosphoric acid used was AR
grade purchased from local market.
6.3.3. The mobile phase
A mixture of Methanol: 0.1% orthophosphoric acid: Acetonitrile in the ratio of
40: 50:10 v/v/v was prepared and used as mobile phase.
6.3.4. The buffer solution
About 1.0 mL of orthophosphoric acid was diluted to 1000 mL with water. This
solution was mixed and pH was adjusted to 5.1 with 1% ortho phosphoric acid and
filtered through 0.45μ nylon filter.
6.3.5. Standard solution of the drug
For analysis 100 ppm standard solution was prepared, required concentrations
were obtained from 100 ppm solution by appropriate dilution.
6.3.6. Sample (tablet) solution
The formulation tablets of Stavudine (VIROSTAV - 20 mg) were crushed to give
finely powdered material. From the Powder prepared a 3 ppm solution in mobile phase
and then filtered through Ultipor N66 Nylon 6, 6 membrane sample filter paper.
158
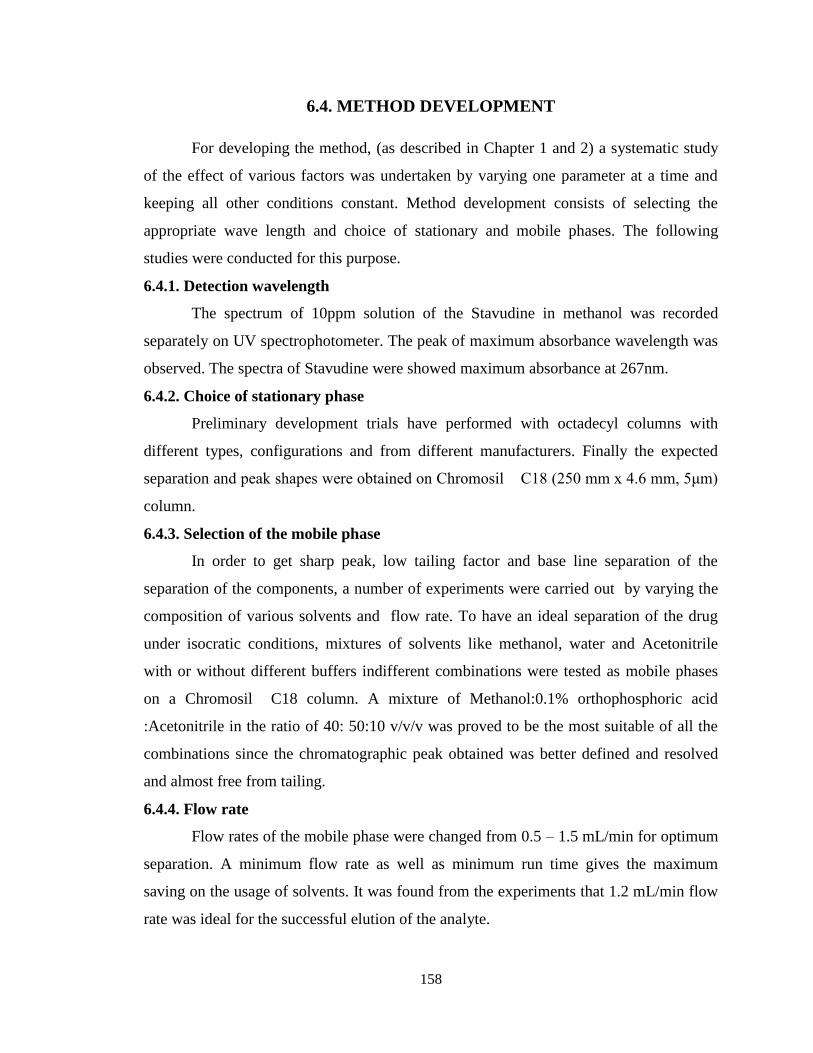
6.4. METHOD DEVELOPMENT
For developing the method, (as described in Chapter 1 and 2) a systematic study
of the effect of various factors was undertaken by varying one parameter at a time and
keeping all other conditions constant. Method development consists of selecting the
appropriate wave length and choice of stationary and mobile phases. The following
studies were conducted for this purpose.
6.4.1. Detection wavelength
The spectrum of 10ppm solution of the Stavudine in methanol was recorded
separately on UV spectrophotometer. The peak of maximum absorbance wavelength was
observed. The spectra of Stavudine were showed maximum absorbance at 267nm.
6.4.2. Choice of stationary phase
Preliminary development trials have performed with octadecyl columns with
different types, configurations and from different manufacturers. Finally the expected
separation and peak shapes were obtained on Chromosil C18 (250 mm x 4.6 mm, 5μm)
column.
6.4.3. Selection of the mobile phase
In order to get sharp peak, low tailing factor and base line separation of the
separation of the components, a number of experiments were carried out by varying the
composition of various solvents and flow rate. To have an ideal separation of the drug
under isocratic conditions, mixtures of solvents like methanol, water and Acetonitrile
with or without different buffers indifferent combinations were tested as mobile phases
on a Chromosil C18 column. A mixture of Methanol:0.1% orthophosphoric acid
:Acetonitrile in the ratio of 40: 50:10 v/v/v was proved to be the most suitable of all the
combinations since the chromatographic peak obtained was better defined and resolved
and almost free from tailing.
6.4.4. Flow rate
Flow rates of the mobile phase were changed from 0.5 – 1.5 mL/min for optimum
separation. A minimum flow rate as well as minimum run time gives the maximum
saving on the usage of solvents. It was found from the experiments that 1.2 mL/min flow
rate was ideal for the successful elution of the analyte.
159
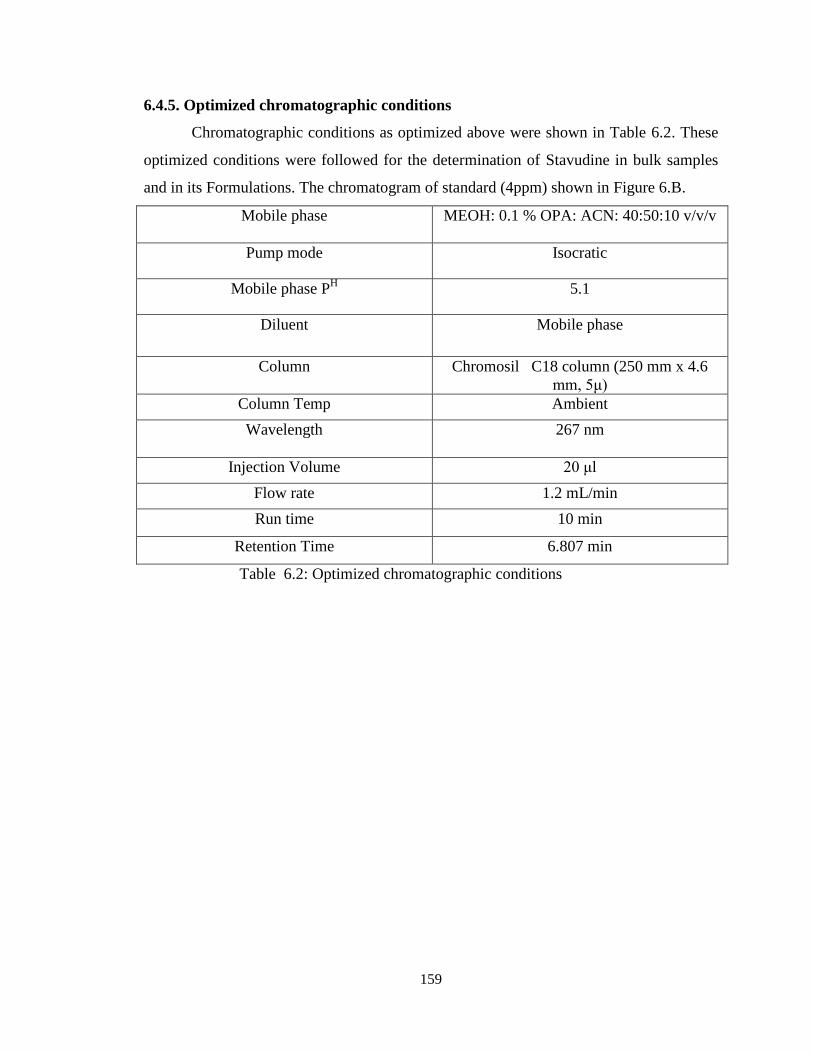
6.4.5. Optimized chromatographic conditions
Chromatographic conditions as optimized above were shown in Table 6.2. These
optimized conditions were followed for the determination of Stavudine in bulk samples
and in its Formulations. The chromatogram of standard (4ppm) shown in Figure 6.B.
Mobile phase MEOH: 0.1 % OPA: ACN: 40:50:10 v/v/v
Pump mode Isocratic
Mobile phase PH 5.1
Diluent Mobile phase
Column Chromosil C18 column (250 mm x 4.6
mm, 5μ)
Column Temp Ambient
Wavelength
267 nm
Injection Volume 20 μl
Flow rate 1.2 mL/min
Run time 10 min
Retention Time 6.807 min
Table 6.2: Optimized chromatographic conditions
160
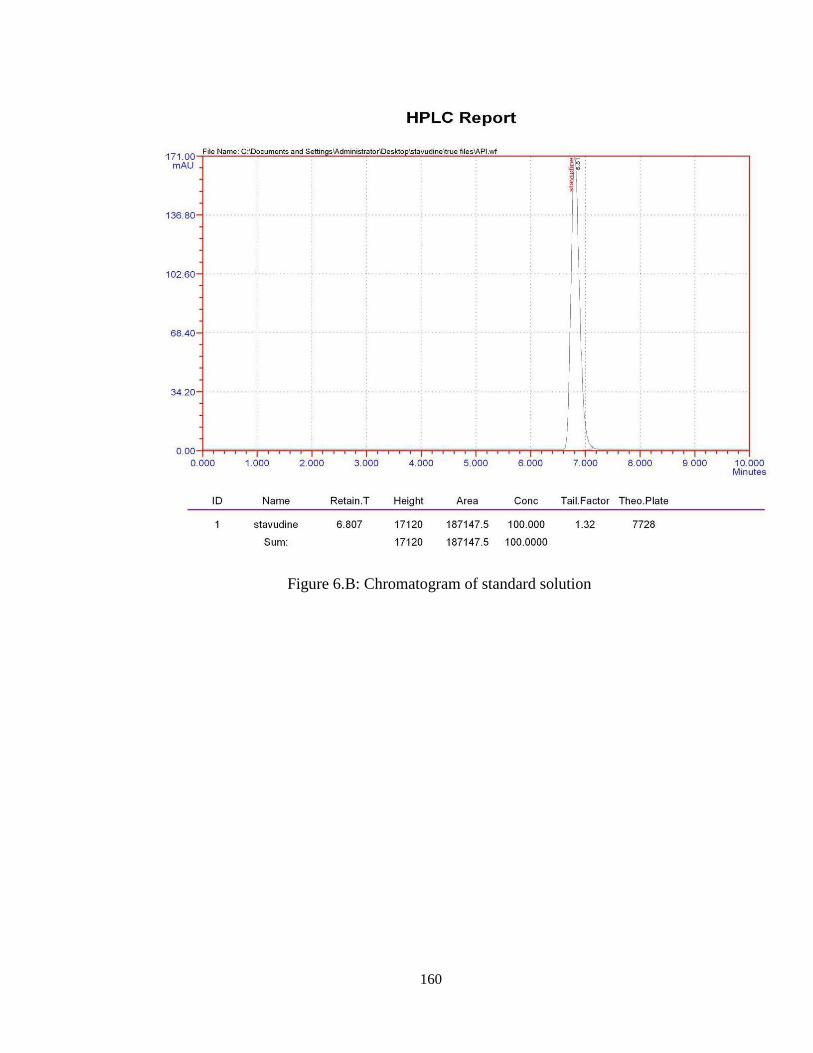
Figure 6.B: Chromatogram of standard solution

161
6.5. VALIDATION OF THE PROPOSED METHOD
The proposed method was validated as per ICH guidelines (as described in
Chapter 1 and 2). The parameters studied for validation were specificity, linearity,
precision, accuracy, robustness, system suitability, limit of detection, limit of
quantification, and solution stability.
6.5.1. Specificity
The specificity of method was performed by comparing the chromatograms of
blank, standard and sample (Prepared from Formulation). It was found that there is no
interference due to excipients in the tablet formulation and also found good correlation
between the retention times of standard and sample. The specificity results are shown in
Table 6.3.
NAME OF THE SOLUTION Retention Time in Min
Blank NO PEAKS
Stavudine 6.807
Table 6.3: Specificity study
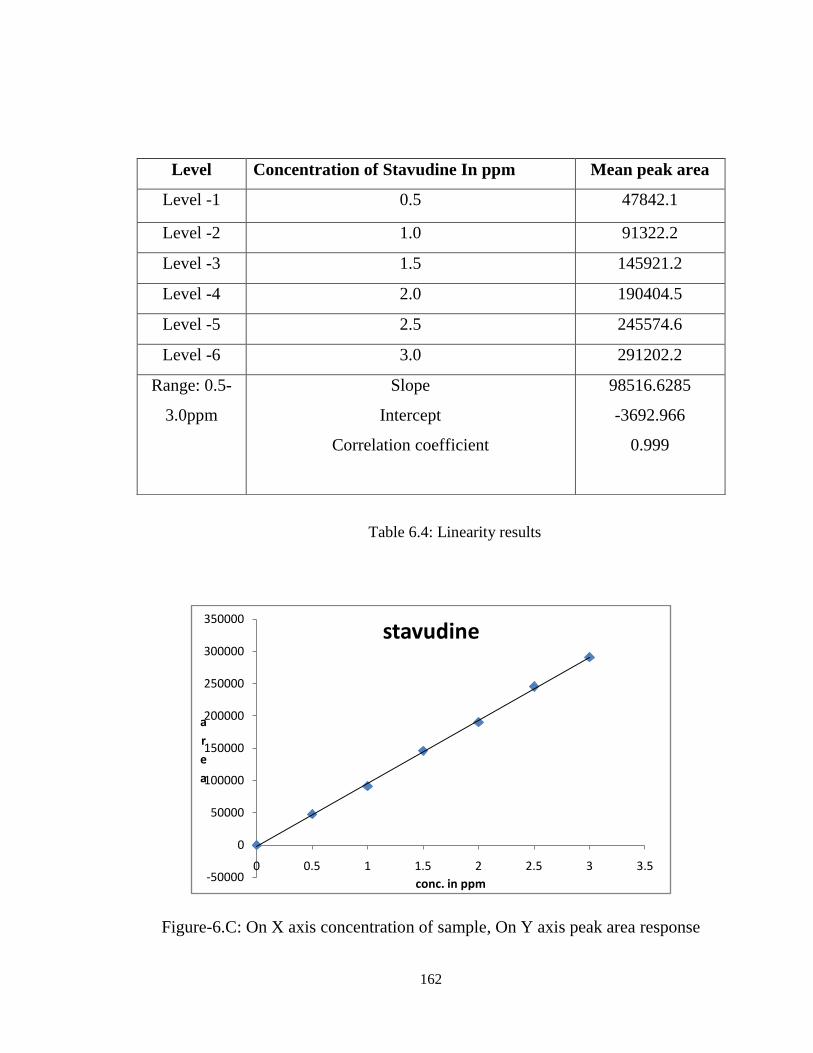
6.5.2 Linearity
Linearity was performed by preparing mixed standard solutions of Stavudine at
different concentration levels including working concentration mentioned in experimental
condition i.e. 3 ppm. Twenty micro liters of each concentration was injected in duplicate
into the HPLC system. The response was read at 267 nm and the corresponding
chromatograms were recorded. From these chromatograms, the mean peak areas were
calculated and linearity plots of concentration over the mean peak areas were constructed
individually. The regressions of the plots were computed by least square regression
method. Linearity results were presented in Table 6.4.
162
Table 6.4: Linearity results
Figure-6.C: On X axis concentration of sample, On Y axis peak area response
-50000
0
50000
100000
150000
200000
250000
300000
350000
0 0.5 1 1.5 2 2.5 3 3.5
a
r
e
a
conc. in ppm
stavudine
Level Concentration of Stavudine In ppm Mean peak area
Level -1 0.5 47842.1
Level -2 1.0 91322.2
Level -3 1.5 145921.2
Level -4 2.0 190404.5
Level -5 2.5 245574.6
Level -6 3.0 291202.2
Range: 0.5-
3.0ppm
Slope
Intercept
Correlation coefficient
98516.6285
-3692.966
0.999
163
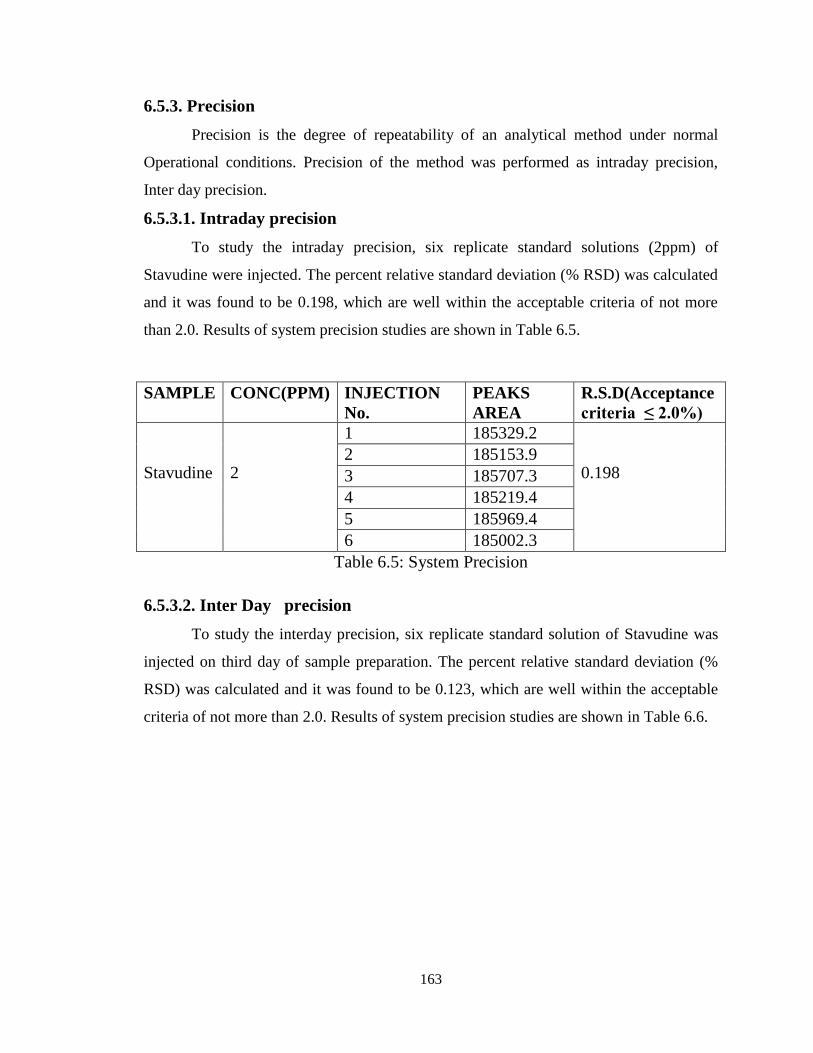
6.5.3. Precision
Precision is the degree of repeatability of an analytical method under normal
Operational conditions. Precision of the method was performed as intraday precision,
Inter day precision.
6.5.3.1. Intraday precision
To study the intraday precision, six replicate standard solutions (2ppm) of
Stavudine were injected. The percent relative standard deviation (% RSD) was calculated
and it was found to be 0.198, which are well within the acceptable criteria of not more
than 2.0. Results of system precision studies are shown in Table 6.5.
SAMPLE CONC(PPM) INJECTION
No.
PEAKS
AREA
R.S.D(Acceptance
criteria ≤ 2.0%)
Stavudine
2
1 185329.2
0.198
2 185153.9
3 185707.3
4 185219.4
5 185969.4
6 185002.3
Table 6.5: System Precision
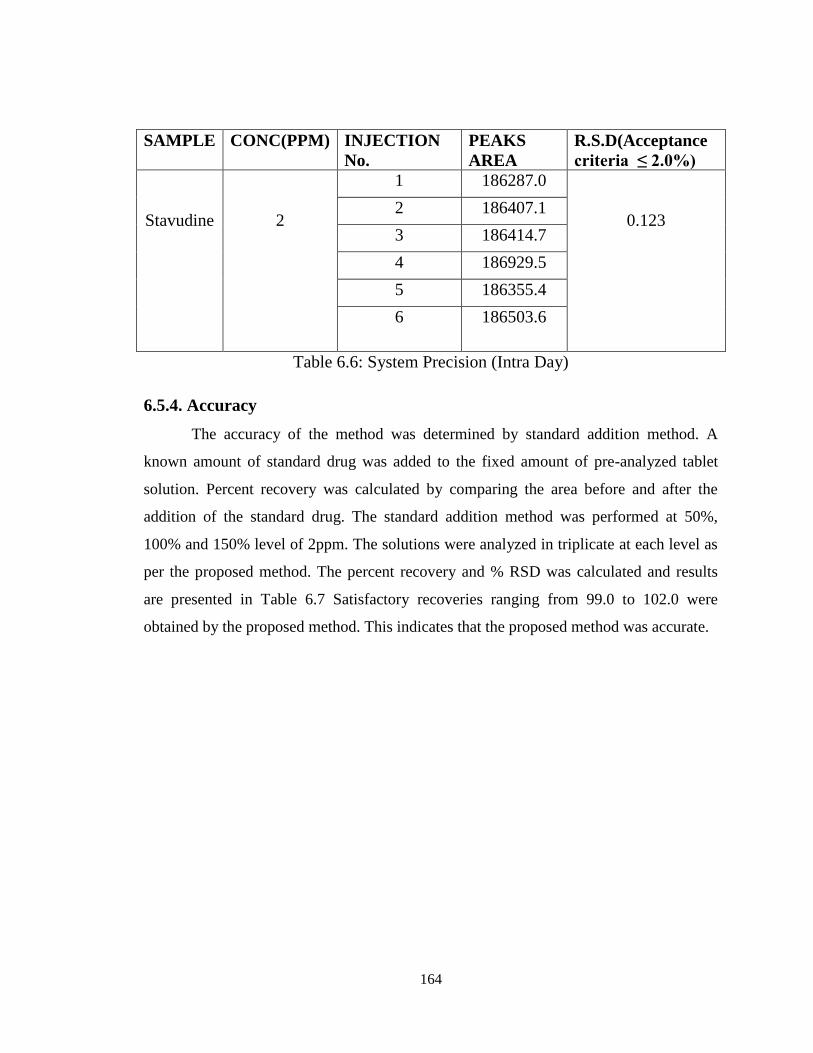
6.5.3.2. Inter Day precision
To study the interday precision, six replicate standard solution of Stavudine was
injected on third day of sample preparation. The percent relative standard deviation (%
RSD) was calculated and it was found to be 0.123, which are well within the acceptable
criteria of not more than 2.0. Results of system precision studies are shown in Table 6.6.
164
SAMPLE CONC(PPM) INJECTION
No.
PEAKS
AREA
R.S.D(Acceptance
criteria ≤ 2.0%)
Stavudine
2
1 186287.0
0.123 2 186407.1
3 186414.7
4 186929.5
5 186355.4
6 186503.6
Table 6.6: System Precision (Intra Day)
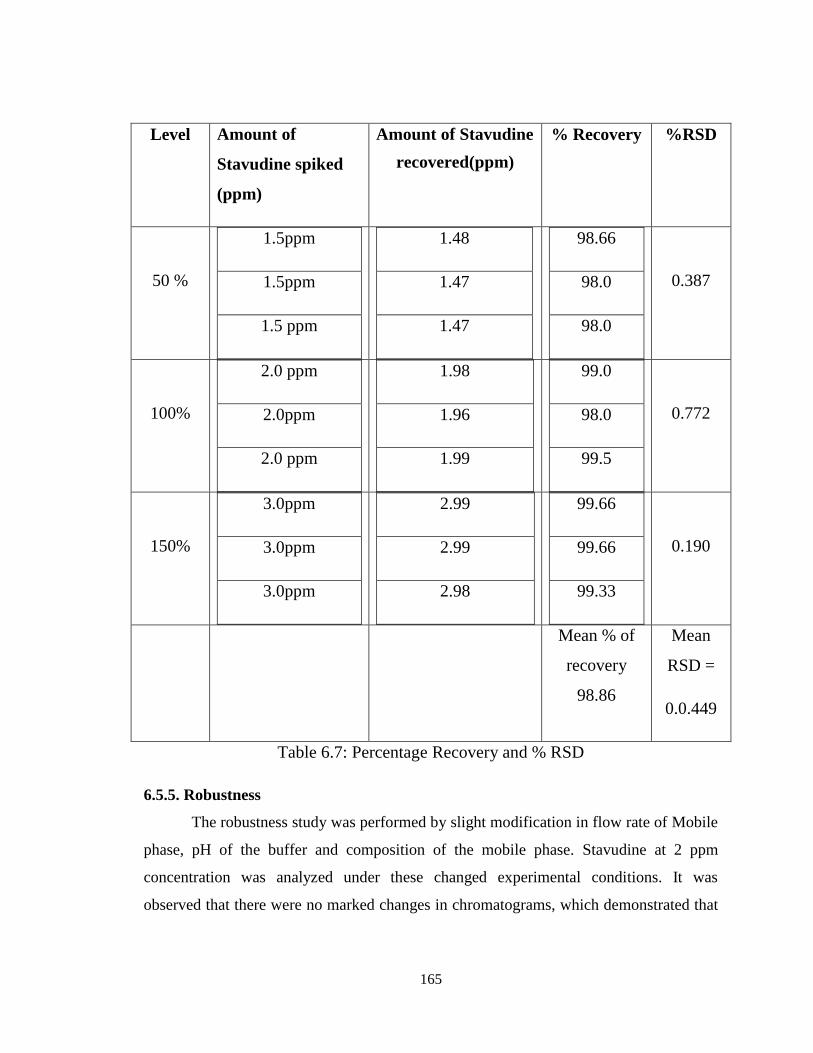
6.5.4. Accuracy
The accuracy of the method was determined by standard addition method. A
known amount of standard drug was added to the fixed amount of pre-analyzed tablet
solution. Percent recovery was calculated by comparing the area before and after the
addition of the standard drug. The standard addition method was performed at 50%,
100% and 150% level of 2ppm. The solutions were analyzed in triplicate at each level as
per the proposed method. The percent recovery and % RSD was calculated and results
are presented in Table 6.7 Satisfactory recoveries ranging from 99.0 to 102.0 were
obtained by the proposed method. This indicates that the proposed method was accurate.
165
Level Amount of
Stavudine spiked
(ppm)
Amount of Stavudine
recovered(ppm)
% Recovery
%RSD
50 %
1.5ppm
1.5ppm
1.5 ppm
1.48
1.47
1.47
98.66
98.0
98.0
0.387
100%
2.0 ppm
2.0ppm
2.0 ppm
1.98
1.96
1.99
99.0
98.0
99.5
0.772
150%
3.0ppm
3.0ppm
3.0ppm
2.99
2.99
2.98
99.66
99.66
99.33
0.190
Mean % of
recovery
98.86
Mean
RSD =
0.0.449
Table 6.7: Percentage Recovery and % RSD
6.5.5. Robustness
The robustness study was performed by slight modification in flow rate of Mobile
phase, pH of the buffer and composition of the mobile phase. Stavudine at 2 ppm
concentration was analyzed under these changed experimental conditions. It was
observed that there were no marked changes in chromatograms, which demonstrated that

166
the developed method was robust in nature. The results of robustness study are shown in
Table 6.8.
Condition Mean area % assay % difference
Unaltered 187147.5 100.0 0.0
Flow rate at 1.0 mL/min
Flow rate at 1.4mL/min
186885.2
186102.2
99.85
99.44
0.15
0.54
Mobile phase:
MEOH: ACN: 0.1 % OPA
45% 45% 10%
35% 55% 10%
187385.1
186920.8
100.1
99.87
0.1
0.13
pH of mobile phase at 4.9 187445.3 100.1 0.1
pH of mobile phase at 5.3 186583.0 99.69 0.31
Table 6.8: Robustness
5.6. System suitability
System suitability was studied under each validation parameters by injecting six
replicates of the standard solution 2 ppm). The results obtained were within acceptable
limits (Tailing factor ≤2 and Theoretical plate’s ≥2000) and are represented in Table 6.9.
Thus, the system meets suitable criteria.
Parameter Tailing factor Theoretical plates
Specificity study 1.32 7728
Linearity study 0.96 4809
Precision study 1.38 7831
Table 6.9: System Suitability

167
6.5.7. Limit of detection and Limit of quantification
Limit of detection (LOD) is defined as the lowest concentration of analyte
that gives a detectable response. Limit of quantification (LOQ) is defined as the
lowest Concentration that can be quantified reliably with a specified level of
accuracy and Precision. For this sample was dissolved by using Mobile Phase and
injected until peak was disappeared. After 15ng/ml dilution, Peak was not clearly
observed. So it confirms that 15ng is limit of Detection and 50ng dilution is
Limit of Quantification. For this study six replicates of the analyte at lowest
concentration were Measured and quantified. The LOD and LOQ of Stavudine are
given in Table 6.10.
Table 6.10: LOQ and LOD
parameter Measured volume
Limit of Quantification 50ng
Limit of Detection 15ng
168
6.6. RESULTS AND DISCUSSION
To develop a precise, accurate and suitable RP- HPLC method for the
simultaneous estimation of Stavudine different mobile phases were tried and the
proposed chromatographic conditions were found to be appropriate for the quantitative
determination. Proper selection of the stationary phase depends up on the nature of the
sample, and molecule Physico- chemical properties. The UV spectra of Stavidine showed
that the drug absorbs appreciably at 267nm was selected as the detection wave length in
liquid chromatography. Optimization of mobile phase was performed based on
asymmetric factor and peak area obtained. Different mobile phases were tried but
satisfactory separation, well resolved and good symmetrical peaks were obtained with the
mobile phase Methanol: Acetonitrile: 0.1 %OPA (40:50:10, v/v/v). The retention time of
Stavudine was found to be 6.8 min, which indicates a good base line.
The calibration curve for Stavudine was obtained by plotting the peak area ratio
versus the concentration of Stavudine over the range of 0.5-3.0 ppm, and it was found to
be linear with r2=0.999. The regression equation of Stavudine concentration over its peak
area ratio was found to be y = (-3692.966 + 98516.62 x), where x is the concentration of
Stavudine (ppm) and Y is the respective peak area. The results obtained were within
acceptable limits where capacity factor >2.0, tailing factor ≤2.0 and theoretical plates
>2000. In all cases, the relative standard deviation (R.S.D) for the analytic peak area for
two consecutive injections was < 2.0%. The data of regression analysis of the calibration
curve was shown in table 6.4.
Precision was evaluated by carrying out six independent sample preparation of a
single lot of formulation. Sample was analyzed for five times after extracting the drug as
mentioned in assay sample preparation of the experimental section. Low values of
standard deviation denoted very good repeatability of the measurement. Thus it was
showing that the equipment used for the study was correct and hence the developed
analytical method is highly repetitive. RSD of intraday precision was found to 0.198. For
the interday precision a study carried out on consecutive days indicated a RSD of 0.123.
This indicates good method precision. Results are shown in Table 6.5 and 6.6.
169
The stability studies were evaluated by storing the solutions at ambient
temperature (20±100C) and checked in triplicate after three successive days of storage
and the data were compared with freshly prepared samples. In each case, it could be
noticed that solutions were stable for 48 hrs, as during this time the results did not
decrease below 98%. This denotes that Stavudine is stable and standard and sample
solutions for at least 2 days at ambient temperature.
The accuracy of the method was evaluated by determination of the recovery of
Stavudine with standard addition method at 50%, 100% and 150% to the proposed HPLC
method. The results showed good recoveries ranging from 99.00 to 101.45%. The mean
recovery data obtained for each level as well as for all levels combined (Table 6.7) were
within 2.0% of the label claim for the active substance with an R.S.D. < 2.0%, which
satisfied the acceptance criteria set for the study.
The system suitability parameter (Table 6.9) like capacity factor, asymmetry
factor, tailing factor and number of theoretical plates were also calculated. It was
observed that all the values are within the limits (tailing factor ≤ 2and number of
theoretical plate’s ≥ 2000). The limit of detection (table 6.10) and limit of quantization
for Stavudine was found to be 15ng and 50ng, indicates the sensitivity of the method.
The statistical evaluation of the proposed method was revealed its good linearity,
reproducibility and its validation for different parameters and let us to the conclusion that
it could be used for the rapid and reliable determination of Stavudine in tablet
formulation.

170
6.7. BIBILOGRAPHY
1. “A sensitive and selective RP-HPLC method for the determination of lamivudine
and Stavudine in tablets”; Journal of Pharmacy Research; 2009; 2(10): 1598-
1600.
2. “Simultaneous quantification of Stavudine, lamivudine and nevirapine by UV
spectroscopy, reverse phase HPLC and HPTLC in tablets”; J Pharm Biomed
Anal; 2005; 39(3-4): 801-804.
3. “Simultaneous determination of lamivudine and Stavudine in antiretroviral fixed
dose combinations by first derivative spectrophotometry and high performance
liquid chromatography”; Journal of Pharmaceutical and Biomedical Analysis;
2006; 41(3-7): 761-765.
4. “Determination of Stavudine in human plasma and urine by high-performance
liquid chromatography using a reduced sample”; J. Chromatogr., B: Biomed.
Appl; 2000; 746(2), 183-189.
5. “HPLC analysis of generic antiretroviral drugs purchased in Rwandap”; Bull.
Soc. Sci. Med; 2005; 3: 317-325.
6. “Validated HPLC method for determination of Lamividine and Stavudine in their
formulations”; Pharmanest ; 2010; 1(1): 22-28.
7. “Simultaneous determination of Stavudine and lamivudine in human plasma by
high performance liquid chromatography and its application to a bioavailability
study”; South East Asian J trop Med Public Health; 2010; 41(2).
8. “Validation of high-performance liquid chromatography methods for
determination of zidovudine, Stavudine, lamivudine and indinavir in human
plasma”; FARM HO; 2007; 31(4): 243-247.
9. “Stavudine after Oral Administration to Humans”; DRUG METABOLISM AND
DISPOSITION; 2010; 38(4): 655–666.
10. “RP – HPLC method for simultaneous estimation of antiretroviral drugs lopinavir
and ritonavir in tablet”; Digest Journal of Nanomaterials and Biostructures; 2010;
5(3): 771-778.
171
11. “Validated RP- HPLC Method for the Quantitation of Stavudine in Bulk and
Capsule Dosage Forms”; Journal of Pharmacy Research; 2011; 4(2): 335-337.
12. “Validated First Order Derivative Spectroscopic Method for the determination of
Stavudine in Bulk and Pharmaceutical Dosage Forms”; International Journal of
ChemTech Research; 2011; 3(1): 18-22.
13. “Bioanalytical method development and validation of lamivudine by RP-HPLC
method”; International Journal of Chem Tech Research; 2010; 2(1): 163-167.
14. “Simultaneous Determination of Lamivudine, Stavudine and Nevirapine in the
Presence of Their Acid-Induced Degradation Products by HPLC”; Thai Pharm
Health Sci J; 2007; 2(1): 39-45.