chapter 6 sectoral measures by kecamatan
TRANSCRIPT

A2-18
CHAPTER 6 SECTORAL MEASURES BY KECAMATAN
(1) Characteristics of Kecamatans
The boundary of the kecamatans on IKONOS image is shown in Figure 6.1.
Source: ARRIS: JICA Study Team
Figure 6.1 Location of Kecamatans in Banda Aceh City
The urban area and characteristics by kecamatan is shown in Table 6.1. They are characterized into
three grouping, that is, inland area, central area and coastal area.
Table 6.1 Urban Area and Characteristics by Kecamatan
Are
a
Kecamatan
Present
built-up
area (ha)
Total urban
area in 2009
(ha)
Ratio of
urban area Characteristics
ULEE KARENG 255.6 530.4 86.2%
No tsunami damage, Low density residential
area, roads not sufficient, agricultural land in
south
BANDA RAYA 237.5 457.5 95.5%
No tsunami damage, Low density residential
area, South: plan of urban development
(Satellite City) Inla
nd
LUENG BATA 191.9 414.7 77.6%
No tsunami damage, Low density residential
area, roads not sufficient, agricultural land
included

A2-19
Are
a Kecamatan
Present
built-up
area (ha)
Total urban
area in 2009
(ha)
Ratio of
urban area Characteristics
SYIAH KUALA 394.1 432.2 30.5%
North: serious damage, land submergence,
swamp and fishery ponds, coastal forest;
South: residential area; South-east:
Darussalam (Syiah Kuala University)
BAITURRAHMAN 280.5 280.5 65.4%
City center (commercial and
cultural/administration), Damage of
commercial area, residential area
Cen
tral
KUTA ALAM 356.0 356.0 97.4% North: serious damage; Central-south: Partial
damage of commercial and residential area
JAYA BARU 111 248.00 56.1% Serious damage, land submergence, large
swamp in the center, flooding
MEURAXA 0 71.00 7.9% Serious damage, land submergence, large
swamp, flooding, ferry port Coas
tal
KUTA RAJA 0 82.00 22.4% Serious damage, land submergence, flooding
Source: ARRIS: JICA Study Team
(2) Measures in Urban Sanitation and Drainage Sector by Kecamatan
Table 6.2 shows measures in Urban Sanitation and Drainage Sector in accordance with the
characteristics by Kecamatan.
Table 6.2 Measures in Urban Sanitation and Drainage Sector by Kecamatan
Sanitation / Drainage
Are
a
Kecamatan Wastewater Treatment Solid Waste Management Urban Drainage
ULEE KARENG
100% of sludge collection
and treatment at
IPLT(desludge treatment
plant) in inhabitant area is
planned in Rehabilitation
Stage (-2007)
Regular collection is served
at least 2 times/week. All
area is included in relocated
landfill system (-2007)
Less significant damage has
been observed, but some
part of primary channel is
recovered in Urgent
Recovery Stage (-2006),
remaining are in
Rehabilitation Stage (-2009)
BANDA RAYA
100% of sludge collection
and treatment at
IPLT(desludge treatment
plant) in inhabitant area is
planned in Rehabilitation
Stage (-2007)
Regular collection is served
at least 2 times/week. All
area is included in relocated
landfill system (-2007)
Less significant damage has
been observed, but
malfunctioned channels are
renovated in Rehabilitation
Stage (-2009)
Inla
nd
LUENG BATA
100% of sludge collection
and treatment at
IPLT(desludge treatment
plant) in inhabitant area is
planned in Rehabilitation
Stage (-2007)
Regular collection is served
at least 2 times/week. All
area is included in relocated
landfill system (-2007)
Less significant damage has
been observed, but
malfunctioned channels are
renovated in Rehabilitation
Stage (-2009)

A2-20
Sanitation / Drainage A
rea
Kecamatan Wastewater Treatment Solid Waste Management Urban Drainage
SYIAH KUALA
100% of sludge collection and treatment at IPLT(desludge treatment plant) in inhabitant area is planned in Rehabilitation Stage (-2007)
Regular collection is served at least 2 times/week. All area is included in relocated landfill system (-2007)
Less significant damage has been observed, but some part of primary channel is recovered in Urgent Recovery Stage (-2006), remaining are in Rehabilitation Stage (-2009)
BAITURRAHMAN
100% of sludge collection and treatment at IPLT (-2007), Sukaramai, Neusu Jaya, Peniti and Kampong Baro are included in Sewage Treatment Area in Reconstruction Stage (-2015)
Regular collection is served at least 2 times/week. All area is included in relocated landfill system (-2007)
No direct damage observed, but to avoid flooding 1 pump and its primary channels are renovated in Urgent Recovery (-2006), remaining are Rehabilitation Stage (-2009) C
entra
l
KUTA ALAM
100% of sludge collection and treatment at IPLT (-2007), Peunayong, Laksana, Keuramat and Mulia (part) are included in Sewage Treatment Area in Reconstruction Stage (-2015)
Regular collection is served at least 2 times/week. All area is included in relocated landfill system (-2007)
3 major pumps are blown by tsunami hit, 1 pump and its primary channels are recovered in Urgent Recovery (-2006), 2 pump are treated in Rehabilitation (-2009). Primary channels covered in northern area are designed in Reconstruction (-2015)
JAYA BARU
100% of sludge collection and treatment at IPLT(desludge treatment plant) in inhabitant area is planned in Rehabilitation Stage (-2007)
Regular collection is served at least 2 times/week. All area is included in relocated landfill system (-2007)
Less significant damage has been observed, but malfunctioned channels are renovated in Rehabilitation Stage (-2009)
MEURAXA
100% of sludge collection and treatment at IPLT(desludge treatment plant) in inhabitant area is planned in Rehabilitation Stage (-2007)
Regular collection is served at least 2 times/week. All area is included in relocated landfill system (-2007)
Serious damage needs a huge recovery works, reconstruction is designed in Reconstruction Stage in this area (-2015)
Coa
stal
KUTA RAJA
100% of sludge collection and treatment at IPLT(desludge treatment plant) in inhabitant area is planned in Rehabilitation Stage (-2007), IPLT and Sewage Treatment Plant will be located in this area
Regular collection is served at least 2 times/week. All area is included in relocated landfill system (-2007)
Pumping systems have been seriously damaged, 1 pump is treated in Urgent Recovery (-2006) and 1 pump is in Rehabilitation (-2009). Primary channels are devastated, recovery is designed in Reconstruction Stage (-2015)
(3) Measures on Road and Transport Sector by Kecamatan Table 6.3 shows measures in Road and Transport Sector in accordance with the characteristics by Kecamatan.

A2-21
Table 6.3 Measures in Road and Transport by Kecamatan
Area Kecamatan Measures in Road and Transport Sector by Kecamatan ULEE KARENG Road rehabilitation for Jl.Tengku Iskandar etc., Improvement
of Ulee kareng crossing, Access road development BANDA RAYA
Road rehabilitation for Jl.Wedana etc., Improvement of crossings along Jl. Soekarno Hatta, Access road development, Reconstruction of bus terminal
Inla
nd
LUENG BATA
Preparation and improvement of the relief road, (Construction of vehicle inspection center) Road rehabilitation, Extension of Jl. Syiah Kuala, Access road
development SYIAH KUALA
North area: Road rehabilitation, Reconstruction of sub-arterial road, Construction of coastal road, Access road reconstruction
BAITURRAHMAN
Road rehabilitation, Traffic management improvement (crossing, traffic lights, traffic signs), Reconstruction of bus terminal C
entra
l
KUTA ALAM
Preparation and improvement of the relief road
Road rehabilitation, Traffic management improvement (crossing, traffic lights, traffic signs), Construction of coastal road
JAYA BARU Road rehabilitation, embankment and relocation if necessary KUTA RAJA Road rehabilitation, embankment and relocation if necessary
Coa
stal
MEURAXA
Improvement of the escape road, Construction of escape/relief road (coastal road)
Road rehabilitation, embankment and relocation if necessary; Reconstruction of ferry terminal
(4) Measures on Health Sector by Kecamatan Table 6.4 shows measures in Health Sector in accordance with the characteristics by Kecamatan.
Table 6.4 Measures in Health Sector by Kecamatan Area Kecamatan Primary care service facilities
ULEE KARENG BANDA RAYA
Inla
nd
LUENG BATA
No major rehabilitation and reconstruction is required as damage by the disaster was not serious and existing facilities could cover the projected population in 2009. District hospital (Meuraxa Hospital) is relocated to Banda Raya as core hospital in western area of the city.
SYIAH KUALA Health center in Komplema and sub health center in Langugop should be rehabilitated. One sub health center should be relocated to one of villages projected to be high population density in 2009.
BAITURRAHMAN A health center should be newly established as population is projected to increase because of new business district. C
entra
l
KUTA ALAM A health center and a sub health center should be newly established and 2 existing sub health centers should be rehabilitated as population is projected to increase because of new business district.
JAYA BARU KUTA RAJA
Coa
stal
MEURAXA
No health center is reconstructed as projected population in 2009 in the area is small and those areas are located nearby the new central business district where are Meuraxa hospital is to be relocated to inland area, where is to be new business district. Sub health centers should be relocated to villages projected to be high population density in 2009.
(5) Measures on Education Sector by Kecamatan Table 6.5 shows measures in Education Sector in accordance with the characteristics by Kecamatan.

A2-22
Area Kecamatans Before the
tsunami After the tsunami
Direction of reconstruction and development of elementary
schools
Ulee Kareng 8 SD/MI, 2
SMP/MT
All the schools was
in normal.
There are no damaged schools. 3 new SD and 1 SMP will
be established due to the population increase.
Lueng Bata 6 SD/MI, 2
SMP/MT
All the schools was
in normal.
There are no damaged schools. 5 new SD and 1 SMP will
be established due to the population increase and many
desas not covered by the existing schools.
Southeastern
Baiturrahman
15 SD/MI,
4 SMP
All the schools was
in normal.
There are no damaged schools. New school construction is
not necessary.
Inla
nd
Eastern
Banda Raya
6 SD/MI,
1SMP
All the schools was
in normal.
There are no damaged schools. 3 new SD and 1 SMP will
be established due to the population increase.
Southern
Syiah Kuala
3 SD/MI,
3SMP/MT
2 SD/MI were
damaged.
Rehabilitation or reconstruction of the damaged schools
will be carried out and a new school construction will be
done due to the population increase.
Southern
Kuta Alam
4 SD, 4
SMP
All the schools were
in normal.
There are no damaged schools. A new SMP will be
established
Northwestern
Baiturrahman
11 SD, 4
SMP/MT
7 SD were
damaged.
Rehabilitation or reconstruction of the damaged schools
will be carried out.
Cen
tral
Western
Banda Raya
2 SD,
1SMP
All the schools were
damaged partially.
Rehabilitation or reconstruction of the damaged schools
will be carried out.
Meuraxa 18 SD/MI,
4 SMP/MT
All the schools were
damaged severely.
Relocation of heavily damaged 16 SD/MI and 1 MT will
be carried out due to the decrease of population. The
remaining damaged schools will be reconstructed.
Kuta Raja 14 SD/MI,
2 SMP
Almost all the
schools were
damaged severely.
Relocation of heavily damaged 4 SD and 1 SMP will be
carried out due to the decrease of population. The
remaining damaged schools will be reconstructed.
Northern
Kuta Alam
20 SD/MI,
8 SMP/MT
All the schools were
damaged.
Reconstruction of the damaged schools will be carried out.
Northern
Syiah Kuala
11 SD/MI,
3 SMP/MT
9 SD/MI were
damaged severely.
Reconstruction of the damaged schools will be carried out .
Coas
tal
Jaya Baru 9 SD/MI, 2
SMP
All the schools was
damaged severely
or partially.
Rehabilitation or reconstruction of the damaged schools
will be carried out.
(6) Measures on Disaster Preparedness by Kecamatan
Table 6.6 shows measures in Disaster Preparedness in accordance with the characteristics by
Kecamatan.
Table 6.6 Measures in Disaster Preparedness by Kecamatan
Area Kecamatan Measures in Disaster Preparedness by Kecamatan
ULEE KARENG
BANDA RAYA
Inla
nd
LUENG BATA
Preparation and improvement of the relief roads and emergency bases
SYIAH KUALA
BAITURRAHMAN
Cen
tral
KUTA ALAM
Preparation and improvement of the relief roads and emergency bases, Preparation of Escape Buildings, Preparation of detached breakwater, seawalls and coastal forests (Syiah Kuala), Preparation of Escape Towers (Syiah Kuala)
JAYA BARU
KUTA RAJA
Coas
tal
MEURAXA
Preparation and improvement of the escape roads and relief roads, Preparation of Escape Buildings, Preparation of detached breakwater, seawalls and coastal forests

APPENDIX 3
WATER SUPPLY

i
APPENDIX 3 WATER SUPPLY
TABLE OF CONTENTS Page
CHAPTER 1 CHAPTER 1 WATER SUPPLY BEFORE DISASTER....................................... 1 1.1 PUBLIC WATER SUPPLY IN KOTA BANDA ACEH.......................................A3-1 1.2 PDAM’S WATER SUPPLY SYSTEM..................................................................A3-1 1.3 PAST WATER SUPPLY........................................................................................A3-6
1.3.1 Connection Ratio ....................................................................................................A3-6 1.3.2 Quality of Water Supply .........................................................................................A3-6
CHAPTER 2 DAMAGES ON WATER SUPPLY FACILITIES..........................................A3-7 2.1 DAMAGES ON HUMAN RESOURCES AND EQUIPMENT ............................A3-7 2.2 DAMAGES ON WATER SUPPLY SYSTEM ......................................................A3-7
2.2.1 Lambro Water Supply System................................................................................A3-7 2.2.2 Siron Water Supply System..................................................................................A3-10
2.3 BILLING AND COLLECTION OF TARIFF......................................................A3-10 2.4 EMERGENCY RELEIF ON WATER SUPPLY SECTOR.................................A3-10
CHAPTER 3 APPROACH FOR REHABILITATION AND RECONSTRUCTION PLANNING ...................................................................................................A3-12
3.1 MISSION, STARATEGIES AND GOALS .........................................................A3-12 3.2 AVAILABLE DATA AND INFORMATION ON REHABILITATION
AND RECONSTRUCTION PLANNING ...........................................................A3-12 3.2.1 The Master Plan for Rehabilitation and Reconstruction of Aceh Region and
Nias ......................................................................................................................A3-12 3.2.2 Revised Plan of Regional Space Layout, Banda Aceh City, Year 2001-2010 ......A3-13 3.2.3 Anticipated International Assistance during Rehabilitation and
Reconstruction Period..........................................................................................A3-15 CHAPTER 4 URGENT REHABILITATION AND RECONSTRUCTION PLAN...........A3-16
4.1 PLANNING CRITERIA.......................................................................................A3-16 4.1.1 Water Demand Forecast and Supply.....................................................................A3-16
4.2 PRELIMINARY DESIGN OF WATER SUPPLY SYSTEM..............................A3-17 4.2.1 Urgent Rehabilitation of Lambaro Water Treatment Plant (WTP).......................A3-17 4.2.2 Water Supply Distribution Network .....................................................................A3-18
4.3 PRELIMINARY PROPOSAL FOR EXPANSION OF WATER SUPPLY SYSTEM...............................................................................................................A3-20
CHAPTER 5 PRELIMINARY PROJECT COST ESTIMATE AND TENTATIVE IMPLEMENTATION SCHEDULE ..............................................................A3-20
5.1 PRELIMINARY PROJECT COST ESTIMATE .................................................A3-21 5.2 TENTATIVE IMPLEMENTATION SCHEDULE..............................................A3-22 5.3 ANNUAL FUND REQUIREMENT ....................................................................A3-22

ii
List of Tables Page
Table 1.1 PDAM Staff Composition as August 2004............................................................... A3-1 Table 1.2 Features of Water Supply Systems ........................................................................... A3-3 Table 1.3 Connection to PDAM Service.................................................................................. A3-6 Table 1.4 Quantity of Water Supply by PDAM ....................................................................... A3-6 Table 2.1 Assistance on Water Supply Sector during Emergency Relief Period..................... A3-10 Table 3.1 Mission, Strategies and Goals for Urgent Rehabilitation and Reconstruction
Plan of Water Supply System ................................................................................. A3-12 Table 3.2 Ongoing Project and Donors Intentions ................................................................. A3-15 Table 4.1 Planning Criteria .................................................................................................... A3-16 Table 4.2 Water Demand Forecast and Supply Capability..................................................... A3-17 Table 4.3 Project Feature of Quick Impact Project for Distribution Network ....................... A3-18 Table 5.1 Preliminary Total Project Cost ............................................................................... A3-21 Table 5.2 Annual Fund Requirement for Water Supply Sector (unit: million Rp)................. A3-22
List of Figures
Page Figure 1.1 Schematic Layout of Lambaro System and Siron System ...............................A3-2 Figure 1.2 Water Distribution Network before Disaster ......................................................A3-5 Figure 2.1 Damages in Lambro Water Treatment Plant and Primary Pipe at
River-Crossing....................................................................................................A3-7 Figure 2.2 Completed Emergency Repair Works of Distribution Network .........................A3-9 Figure 2.3 Mobile Water Treatment Equipment and Temporary Public Tap......................A3-11 Figure 3.1 Distribution Network Plan (2001-2010) ...........................................................A3-14 Figure 4.1 Alignment of New Distribution Network .........................................................A3-19 Figure 5.1 Tentative Implementation Schedule of Water Supply Sector ...........................A3-22

A3-1
CHAPTER 1 WATER SUPPLY BEFORE DISASTER
1.1 PUBLIC WATER SUPPLY IN KOTA BANDA ACEH
The water supply in Kota Banda Aceh is under management of PDAM (Water Supply Authority) Tirta Daroy-Banda Aceh (called as PDAM). It treats and distributes pipe water and collection of water tariff. It is in principle independent autonomous organization but is financially subsidized by the city council.
Its service area extends over the entire administrative area of Kota Banda Aceh and includes part of Aceh Besar.
Before disaster, PDAM had 173 staff as shown in Table 1.1.
Table 1.1 PDAM Staff Composition as August 2004 Staff
15345823493
173
Division of Customer RelationDivision of Internal Audit
TOTAL Staff
Position
Chief of DivisionDivision of Administration and FinanceDivision of TechnicalKecamatan/District Unit
Director
1.2 PDAM’s WATER SUPPLY SYSTEM
A schematic layout of water supply in Kota Banda Aceh is as shown in Figure 1.1 and 1.2. There are basically two (2) different water supply systems for potable water supply in Kota Banda Aceh. One is Lambaro system and the other is Siron system. Both the systems comprise a raw water pumping station on the Aceh River, water treatment plant, treated water transmission pump station and distribution network. There is no service reservoir, excepting clear water reservoir in the water treatment plant, and thus the treated water is directly distributed to the consumers by means of pump pressure flow.
A3-2
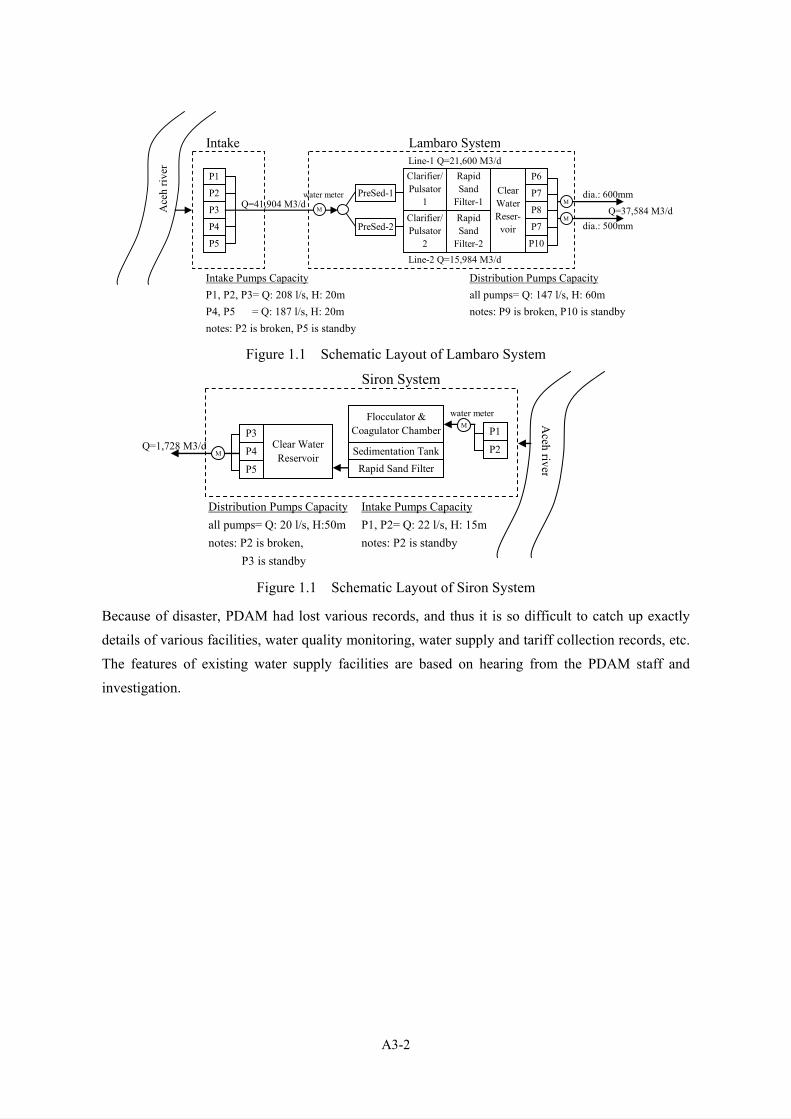
Figure 1.1 Schematic Layout of Lambaro System
Figure 1.1 Schematic Layout of Siron System
Because of disaster, PDAM had lost various records, and thus it is so difficult to catch up exactly details of various facilities, water quality monitoring, water supply and tariff collection records, etc. The features of existing water supply facilities are based on hearing from the PDAM staff and investigation.
Siron System
water meter
Distribution Pumps Capacity Intake Pumps Capacityall pumps= Q: 20 l/s, H:50m P1, P2= Q: 22 l/s, H: 15mnotes: P2 is broken, notes: P2 is standby P3 is standby
Aceh river
P1
P2Clear WaterReservoir
Flocculator &Coagulator Chamber
Sedimentation TankRapid Sand Filter
P3
P4
P5
M
MQ=1,728 M3/d
Intake Lambaro SystemLine-1 Q=21,600 M3/d
water meter
Q=37,584 M3/d
Line-2 Q=15,984 M3/d
Intake Pumps Capacity Distribution Pumps CapacityP1, P2, P3= Q: 208 l/s, H: 20m all pumps= Q: 147 l/s, H: 60mP4, P5 = Q: 187 l/s, H: 20m notes: P9 is broken, P10 is standbynotes: P2 is broken, P5 is standby
dia.: 500mm
dia.: 600mm
P1
P2
P3
P4
P5
PreSed-1
Clarifier/Pulsator
1
RapidSand
Filter-1Clarifier/Pulsator
2
RapidSand
Filter-2
ClearWaterReser-voir
P6
P7
P8
P9
P10
PreSed-2
Ace
h riv
er
Q=41,904 M3/d
P7
M
MM

A3-3
Table 1.2 Features of Water Supply Systems Main Facilities Lambro System Siron System Raw water pumping station Number:
Capacity of each 5 [Q;208 l/s, h;20m] x3[Q;147 l/s, h;20m] x2
2 [Q;22 l/s, h;15m] x2
Production capacity 37,584 m3/d 1,728 m3/d Treatment process Rapid sand filtration Rapid sand filter Number of treatment line 2 1
Water treatment plant
Main treatment component Pre-sedimentation, clarifier, rapid sand filter, clear water reservoir
Flocculator and Coagulator chamber, sedimentation tank, rapid sand filter, clear water reservoir
Treated water pump station Number of pump Capacity of each
5 [Q:147 l/s, h:60m] x5
3 [Q:20 l/s, h:50m] x3
Pipe materials Steel pipe (SP) for D300 – 600 Polyvinyl chloride (PVC) for D100 - 250
Distribution pipelines
Pipe length D600; 7,566m D500; 6,053m D400; 1,451m D300; 754m D250; 6,389 D200; 4,090m D150; 31,789m D100; 29,255m
Water meter Number 24,411 Source: PDAM
(1) Raw water pumping station
The pumping stations of Lambaro and Siron systems are located on the right and left banks of the Aceh River, respectively. In both pumping station one pump was always kept as stand-by.
(2) Water treatment plant
The Lambaro and Siron treatment plants were initially commissioned into service in 1974 and 1994 respectively. It is supposed that there was no substantial maintenance and/or improvement works since their commissioning. According to PDAM, both the plants had been operated at their full capacity in order to meet increasing water demand. The quality of the treated water was said to be slightly inferior compared to the Indonesian standards, probably owing to less use of chemicals and deterioration of treatment facilities.
Both the plants provided with clear water reservoir; 2,500 m3 in Lambaro and 200 m3 in Siron. This reservoir absorbs daily and maximum water demands.
(3) Treated water pumping station
There are two (2) primary distribution pipelines from the water treatment plant in each system. The treated water transmission pump station is located immediately after the clear water reservoir and equipped with distribution water meter on each pipe.

A3-4
(4) Distribution network
Distribution network covered almost the whole area of Kota Banda Aceh. The distribution system is classified into three (3) categories according to PDAM;
- Primary pipelines with D300 – 600mm - Secondary pipelines with D150 – 250mm - Tertiary pipelines with D25 – 120mm
As shown in Figure 1.2, distribution network was so complicated, mainly owing to expansion of network with less regards to its efficiency. This resulted in uneven distribution of water and residual pressure from place to place.
(5) House connection and public taps
As of August 2004, there were 24,411 house connections and 100 public taps within water service area of PDAM.

A
3-5
Figure 1.2 Water Distribution Network before Disaster

A3-6
1.3 PAST WATER SUPPLY
1.3.1 Connection Ratio
The PDAM annual audit report describes the water service ratio by PDAM over the period from 2000 to 2004 was made available. It is summarized as given in Table 1.3.
Table 1.3 Connection to PDAM Service
2000 2001 2002 2003 2004220,737 223,223 225,996 235,532 243,41920,646 20,918 21,907 23,907 24,411
116,578 120,270 127,308 133,692 138,9845.6 5.7 5.8 5.6 5.7
52.8% 53.9% 56.3% 56.8% 57.1%Source: Laporan Audit BPK Nopember 2004 (PDAM)
Assumed Average Family SizeService Ratio (%)
DescriptionTotal PopulationNumber of House ConnectionServed Population
As show in the table above, connection rate was only 57% in 2004. It is not known exactly how rest of population depended for their water supply. As reported in the succeeding sub-section 1.3.2 unaccounted-for-water was relatively high. It is supposed that among the unconnected people some were illegally connected to the pipe water service and some people were resorted to other water resources such as dug well and deep well.
1.3.2 Quality of Water Supply
From the same source as connection rate, the quantity of water supply was obtained as presented in Table 1.4.
Table 1.4 Quantity of Water Supply by PDAM
Description 2000 2001 2002 2003Quantity of Treated Water Production (m3) 9,730,630 9,297,579 11,545,261 12,947,638Revenued Quantity (m3) 6,598,255 6,052,973 6,601,681 6,647,017UFW (%) 32.2% 34.9% 42.8% 48.7%Served Population 116,578 120,270 127,308 133,692Per Capita Consumption (lpcd) 154.6 137.9 142.1 136.2Source: Laporan Audit BPK Nopember 2004 (PDAM)
It should be noted that the unpaid billing is not includes in the UFW figures above. It is supposed that the actual UFW rate including both physical and non-physical aspect will be more higher.
The water consumption was relatively high, 136 liter per capita per day on average in 2003.

A3-7
CHAPTER 2 DAMAGES ON WATER SUPPLY FACILITIES
2.1 DAMAGES ON HUMAN RESOURCES AND EQUIPMENT
The 2004 disaster (earthquake and tsunami) resulted in damaging various water supply facilities and also in loosing human resources, equipment and various documents necessary for operation.
According to PDAM, out of 173 PDAM staff, 29 staff were lost their life and/or missing, causing hampering operation of water supply system, billing and collecting tariff. Also out of three (3) operation and maintenance vehicles, two (2) were lost.
2.2 DAMAGES ON WATER SUPPLY SYSTEM
2.2.1 Lambro Water Supply System
In general there was no serious damage in the system, excepting for distribution pipelines especially in area along the coast. Damages observed in the respective component are as described below. This system is now supplying the treated water at a rate of 31,536 m3/day, slightly less than its full production capacity.
(1) Raw water pumping station
Of 5 intakes pumps existed on the bank of the Aceh River, one pump was washed away. There is no serious matter in the present situation but there is no stand-by pump now.
(2) Water treatment plant
Fortunately, there is no serious structural mechanical damage, so that the plant has started its production soon after disaster. Some structure suffered physical damage (Figure 2.1). Installment in auto-desludging equipment in pre-sedimentation and clarifier was out of order after disaster. For operation of the plant various international and domestic organizations concerned are supplying chemicals required.
Figure 2.1 Damages in Lambro Water Treatment Plant and Primary Pipe at River-Crossing

A3-8
(3) Treated water pumping station
No damage is observed.
(4) Distribution pipelines
The distribution pipelines were destroyed in many locations and areas. Though the water treatment plant was operational, it was not possible to distribute the treated water to the service area owing to deterioration of distribution pipelines and also break of primary pipeline especially at river-crossing. An emergency measure was taken immediately after disaster to restore the distribution network through cooperation of international organization and the government organizations/agency such as DPU (Dinas Pekerjaan Umum: Department of Public Works) and PDAM from other regions of the country. Figure 2.2 shows emergency repair works so far completed.

A
3-9
Figure 2.2 Completed Emergency Repair Works of Distribution Network

A3-10
2.2.2 Siron Water Supply System
This system was not damaged at all. Unfortunately, the system suspended its operation temporarily due to lack of chemicals for operation of the water treatment plant.
2.3 BILLING AND COLLECTION OF TARIFF
Immediately after disaster, billing system was unusable due to broken computer. It is, however, already re-functioning now. At present there is no problem in billing and collection of tariff.
2.4 EMERGENCY RELEIF ON WATER SUPPLY SECTOR
As described above, there were lots of assistance from international and domestic donors, and some of such assistance are still continuing. Table 2.1 summarizes such assistance according to PDAM.
Table 2.1 Assistance on Water Supply Sector during Emergency Relief Period Aid Item Donors Aid Contents
/CapacityNotes
Australia 480 m3/day With staff
LAPI-ITB&Kodam III 199.2 m3/day With staff
Ministry of Public Works 48 ton Aluminium-sulphateUNICEF 200 ton Aluminium-sulphate, etc.ICRC 52 ton Various kinds
Installation of public tap DPU 46 units GrantRe-installation of pipes DPU Provision of contractor
DPU 6 units GrantPDAM-Medan 2 units RentalPALYJA 2 units RentalPT Nidya Karya 4 units RentalNGOs 12 units RentalPDAM-Medan operatorsPDAM-Kabupaten Bogor engineersIATPI engineersPALYJA operators
mechanicsengineers
PDAM-Padang engineersCash fund Dana Pensiun PERPAMSI Rp.45millionVehicle Swis Red Cross One pick-up
Mobile Water TreatmentEquipment
Chemicals forwaterworks
Water tankers
Human assistance
Source: PDAM

A3-11
Figure 2.3 Mobile Water Treatment Equipment and Temporary Public Tap

A3-12
CHAPTER 3 APPROACH FOR REHABILITATION AND RECONSTRUCTION PLANNING
3.1 MISSION, STARATEGIES AND GOALS
As stated in Chapter 2 of this report, there are some damages on Lambaro water treatment plant and huge damage on supply distribution pipeline. The distribution pipelines were tentatively repaired in order to sustain lifeline of the human-beings. However, it is pre-requisite to install a complete water supply system aiming at earliest recover from disaster and enhancing economic development in the city. Such system development, on the other hand, should be planned and implemented in a harmony with the new urban development plan including city road development.
Table 3.1 Mission, Strategies and Goals for Urgent Rehabilitation and Reconstruction Plan of Water Supply System
Mission To provide the safe and sufficient water to the people as many as possible
To strength institutional and financial capability of PDAM Banda Aceh To develop the water supply system strong against disaster
Strategies To expand water distribution network in conformity with new urban development plan
To reduce conduct leakage survey to contribute reduction of UFW To conduct corporate development planning To re-train PDAM staff
Goals To re-install the distribution network until 2006 To rehabilitate Lambaro and Siron water treatment plants until 2006 To achieve connection ratio of 80% by 2009 To achieve rate of UFW at 30 % by 2009
3.2 AVAILABLE DATA AND INFORMATION ON REHABILITATION AND RECONSTRUCTION PLANNING
3.2.1 The Master Plan for Rehabilitation and Reconstruction of Aceh Region and Nias
The Government of Indonesia published the Master Plan for Rehabilitation and Reconstruction of Aceh Region and Nias (called as Blueprint) on March 2005. It establishes overall and sector rehabilitation and reconstruction policy and strategy. As far as water supply sector is concerned, the Blueprint sets forth the following strategies and targets.

A3-13
(1) Strategies
System development plan should be harmonized with other development plans, such as city plan, housing development plan and resettlement plan.
Water supply should be given higher priority among urban infrastructure.
System development plan should be community-oriented.
(2) Target during Rehabilitation Period (2005-2006)
Unit water consumption: 150 lpcd or same as before disaster in urban area and 90 lpcd, for rural area.
Water supply system: pipe water for urban and well / communal system for rural.
(3) Target during Reconstruction Period (2007-2009)
Connection rate: 100% rate of 200 lpcd for piped supply and 90 lpcd for non-piped supply.
Supply hour: 24 hours with minimum head of 10m for piped supply.
To be subsidized by the local administration to sustain the operation and maintenance.
3.2.2 Revised Plan of Regional Space Layout, Banda Aceh City, Year 2001-2010
Revised Plan of Regional Space Layout, Banda Aceh City, Year 2001-2010 (called as the City Master Plan) was published in 2001 by the city council and sets forth the following targets for the water supply sector. Those development targets are not in consistent with those of the Blueprint.
(1) Development Target for Year 2010
Pipe water connection ratio: 80%
UFW: 20%
Meter connection: 49,231
Estimated total water requirement: 52,600m3/day
(2) Water supply development program
Construction of distribution reservoir
Expansion of distribution network (refer to Figure 3.1)
Increase of house connection meter
Installation of public taps at low income residence area
Socialization of water sanitary education
Study on water resources potential
New water resources development to cope with increasing water demand

A
3-14
Figure 3.1 Distribution Network Plan (2001-2010)

A3-15
3.2.3 Anticipated International Assistance during Rehabilitation and Reconstruction Period
According to PDAM, the following international assistance is anticipated for the water supply sector.
Table 3.2 Ongoing Projects and Donors Intentions Assistance Donor Notes
France Not know yet.Switzerland Rehabilitating pumps, buildings and office equipment as
stated in MOU.DistributionPipeline
Japan Prepare Corporate Plan and urgent rehabilitation ofdistribution network.
PDAM OfficeBuilding
Switzerland Building rehabilitation and office equipment supply.
CapacityDevelopment
USA Needs assessment to the peoples.Prepare capacity building program.
Others The Netherlands Under consideration.
Lambaro WaterTreatment Plant

A3-16
CHAPTER 4 URGENT REHABILITATION AND RECONSTRUCTION
PLAN
4.1 PLANNING CRITERIA
One of the most important fundamentals in water supply planning, population projection and its distribution is based on Baseline Data in Appendix 2 of this Study report. For the planning of distribution network rehabilitation, roads development plan is also referred to herein. The roads development plan is compiled in Appendix 5 of this Study report.
In order to achieve the missions and goals, the planning criteria are set forth as shown in Table 4.1 below.
Table 4.1 Planning Criteria unit 2005 2006 2007 2008 2009 PU guideline
Connection Served population % 58 60 65 70 80Average family size 1:(5-6)House connection % 80-90Public tap % 10-20
Unit consumption House connection lpcd 150Public tap lpcd 30-50Non-Domestic % 15-30
UFW % 50 45 40 35 30 30-501.1-1.251.5-2.0
note: PU guideline for house connection per capita consumption applied figure for the city with 100,000-500,000 population.
Description
Maximum Daily Demand FactorPeak Hourly Demand Factor
20
1.11.5
1:59010
15040
4.1.1 Water Demand Forecast and Supply
The water demand during the planning horizon is forecast as presented in Table 4.2. In order to facilitate establishing a long-term development plan (say to the year 2015), the demand is also forecast assuming that population increases at a rate of 6% per annum, the same rate as that during the planning horizon.

A3-17
Table 4.2 Water Demand Forecast and Supply Capability
unit 2005 2006 2007 2008 2009 2015
person 200,843 212,893 225,767 239,206 254,000 360,304Total person 116,489 127,736 146,749 167,444 203,200 288,243House Conn. person 104,840 114,962 132,074 150,700 182,880 259,419Public Tap person 11,649 12,774 14,675 16,744 20,320 28,824House Conn. m3/day 15,726 17,244 19,811 22,605 27,432 38,913Public Tap m3/day 466 511 587 670 813 1,153Non-Domestic m3/day 3,238 3,551 4,080 4,655 5,649 8,013
TOTAL m3/day 19,430 21,306 24,478 27,930 33,894 48,079UFW Rate 50% 45% 40% 35% 30% 30%
Amount m3/day 9,715 9,588 9,791 9,775 10,168 14,424
m3/day 29,146 30,894 34,269 37,705 44,062 62,503Lambaro m3/day 37,584 37,584 37,584 37,584 37,584 37,584Siron m3/day 1,728 1,728 1,728 1,728 1,728 1,728
Total m3/day 39,312 39,312 39,312 39,312 39,312 39,312
m3/day 10,166 8,418 5,043 1,607 -4,750 -23,191Balance
DescriptionPopulation
Gross Demand
Served Population
Net Demand
Supply Capacity
As shown in table above, the water demand amounts to 44,062 m3/day in 2009, whereas aggregate production capacity of the Lambaro and Siron water treatment plants are 39,312m3/day only. It is evident that there is a shortage of water in 2009, amounting to 4,750 m3/day. On the other hand, water demand in 2015 is preliminarily estimated at 62,503 m3/day, which is almost 140 % of the water demand in 2009. It is advisable to conduct the feasibility study as soon as possible, so that expanded water supply system could be commission into service by 2010 at latest.
4.2 PRELIMINARY DESIGN OF WATER SUPPLY SYSTEM
4.2.1 Urgent Rehabilitation of Lambaro Water Treatment Plant (WTP)
The Lambaro water treatment plant has suffered minor damages as noted in Chapter 2 of this report, and is resumed its production already. However, as also reported in Chapter 3 of this report, it is reported by PDAM that the French and Swiss Governments have offered rehabilitation of this treatment plant for better operation and production of higher quality of treated water. At the time of preparation of this report, details of the proposed rehabilitation works are not known.
According to PDAM, the following works, at least, should be executed as a part of rehabilitation works.

A3-18
(1) To replace two (2) intake pumps, each with a capacity of 208 L/s and one (1) distribution pump with capacity of 147 L/s.
(2) To replace 600 mm diameter distribution water meter.
(3) To calibrate a raw water meter and 500 mm diameter distribution water meter.
(4) To repair installment of automatic de-sludging systems on pre-sedimentation tank and clarifier.
(5) To replace filter media.
4.2.2 Water Supply Distribution Network
As noted in Chapter 3 of this report, the Government of Japan has committed to rehabilitate distribution network as one of 13 “Quick Impact Projects” and its design is in progress at the time of preparation of this report. The rehabilitation design targets to distribute the forecast water demand of 2009 throughout the city with minimum residual head of 5m.
The alignment of new primary and secondary distribution pipelines is as shown in Figure 4.1 and breakdown of distribution pipes are as given in Table 4.3 below. It is reported that Ductile Iron Pipe (DIP) and Polyethylene Pipe (PE) are selected as pipe materials.
There is an item “house connection recovery” in Table 4.3. This means a set of tertiary pipe (PVC: Polyvinyl chloride) and water meter for individual connection. It is reported that 8,000 sets will be provided to PDAM.
Table 4.3 Project Feature of Quick Impact Project for Distribution Network
Components Pipe Material Diameter Quantity
Primary pipe DIP 600 mm 378 mPrimary pipe DIP 500 mm 303 mPrimary pipe PE 400 mm 73 mPrimary pipe PE 300 mm 250 mSecondary pipe PE 250 mm 319 mSecondary pipe PE 200 mm 3,660 mSecondary pipe PE 150 mm 6,116 mTertiary pipe PE 100 mm 1,463 mTertiary pipe PE 75 mm 1,200 mWater pipe bridge (steel) - - 5 unitsPublic tap - - 20 unitsFire hydrant - - 10 unitsHouse connection recovery - - 7,860 unitsOthers connection recovery - - 140 units
Distribution pipe PE (10bar) 300 mm 6,500 m
1. Replacement Works
2. Extension Works

A3-19
Figure 4.1 Alignment of New Distribution Network

A3-20
4.3 PRELIMINARY PROPOSAL FOR EXPANSION OF WATER SUPPLY SYSTEM
It is necessary to implement an expansion of water supply system as assessed in Section 4.2 herein. Otherwise, Kota Banda Aceh would face a shortage of water supply from 2009 onward.
The water demand in 2015 is forecasted on a basis of rough population projection. The required additional supply is estimated at 23,191 m3/day to meet the whole demand in 2015.
It is presumed that the Aceh River has enough unregulated discharge to meet such increased water demand and there is an ample land available in the vicinity of existing Lambaro water treatment plant. This is one of feasible alternatives for consideration of PDAM.

A3-21
CHAPTER 5 PRELIMINARY PROJECT COST ESTIMATE AND
TENTATIVE IMPLEMENTATION SCHEDULE
5.1 PRELIMINARY PROJECT COST ESTIMATE
Preliminary project cost for the urgent rehabilitation and reconstruction works proposed in this study is estimated making reference to actual costs of similar types of the project in Indonesia, and based on the preliminary design as well as the following conditions and assumptions, however, these are subject to change due to finalization of the Indonesian authorities.
Conditions and Assumptions for Preliminary Cost Estimate
(1) Physical contingency and price escalation are assumed to be 10 % each of the direct construction cost.
(2) Engineering service is assumed to be 10% of the direct construction cost for detailed study & design and construction supervision.
(3) If project is purely program type and/or procurement, only price contingency is considered. (4) VAT is included in the cost, however, import duties are not included in the cost. (5) Land acquisition and compensation costs are not included in the Project cost due to difficulty of
estimation at this time
As shown in Table 5.1, the estimated project cost is of indicative natures and subject to change when more in-depth study is completed. The preliminary project cost is estimated at Rp. 145.7 billion, of which Rp. 21.7 billion is attributable to expansion of water supply system after 2009.
Table 5.1 Preliminary Total Project Cost Amount(Mil Rp.)
Banda Aceh Water Supply Master Plan 2007-2020 2,850PDAM Corporate Plan 2005-2009 300Capacity Building Program 5,180
8,330833
9,163
PDAM Administrative Facilities 9,840Rehabilitation of Lambaro Water Treatment Plant 11,090Rehabilitation of Water Distribution System 67,420
Reconstruction Expansion of Lambaro Water Treatment Plant 16,670105,02010,50210,50210,502
136,526145,689
Project Description
B. CONSTRUCTION WORKS
A. PROGRAMS
TOTAL AMOUNT
Sub-Total
Price Escalation
Rehabilitation
Rehabilitation
Total
Sub-TotalPrice Escalation
Total
Physical Contingency
Engineering Services

A3-22
5.2 TENTATIVE IMPLEMENTATION SCHEDULE
Tentative implementation schedule is shown in Figure 5.1. This schedule takes into account of the following;
(1) The urgent rehabilitation works such as rehabilitation of water treatment plant and distribution network shall be completed before 2006.
(2) The capacity building of PDAM could also be given priority to reinforce water supply services in general and to be financially autonomous in a long run.
(3) Expansion of water treatment plant differed beyond 2009.
2005 2006 2007 2008 2009A. PROGRAMSBanda Aceh Water Supply Master Plan 2007-2020PDAM Corporate Plan 2005-2009Capacity Building ProgramB. CONSTRUCTION WORKSPDAM Administrative FacilitiesRehabilitation of Lambaro Water Treatment PlantRehabilitation of Water Distribution SystemExpansion of Lambaro Water Treatment Plant
Project Description
beyond 2009
Implementation Schedule Rehabilitation Reconstruction Stage
Figure 5.1 Tentative Implementation Schedule of Water Supply Sector
5.3 ANNUAL FUND REQUIREMENT
The annual fund requirement is prepared on the basis of the preliminary project cost estimate and tentative project implementation schedule. It is shown in Table 5.2.
Table 5.2 Annual Fund Requirement for Water Supply Sector (unit: million Rp)
2005 2006 2007 2008 2009A. PROGRAMSBanda Aceh Water Supply Master Plan 2007-2020 3,135 3,135PDAM Corporate Plan 2005-2009 330 330Capacity Building Program 1,331 1,925 924 759 759 5,698B. CONSTRUCTION WORKSPDAM Administrative Facilities 7,865 247 4,680 12,792Rehabilitation of Lambaro Water Treatment Plant 4,147 10,270 14,417Rehabilitation of Water Distribution System 14,317 72,289 1,040 87,646Expansion of Lambaro Water Treatment Plant 21,671 21,671
Sub-Total 27,990 87,866 6,644 759 759TOTAL
Project Description Long Term2010-2015 TOTAL
115,856 8,16221,671 145,689
Rehabilitation Reconstruction Stage