chapter 6 redesign of warehouse layout: key piece in the
TRANSCRIPT

114
Chapter 6 Redesign of warehouse layout: Key piece in the supply chain
Capítulo 6 Rediseño de ubicaciones en el almacén: Pieza clave en la cadena de
suministro
CANO-OLIVOS, Patricia1 & PAREDES-PÉREZ, Nayeli2
1Universidad Popular Autónoma del Estado de Puebla (UPAEP)1, Calle 17 Sur 711, Barrio de Santiago,
CP: 72410 Puebla, Puebla. 2Instituto Tecnológico Superior de San Martín Texmelucan (ITSSMT)2, Camino a la Barranca de Pesos,
s/n, San Lucas Atoyatenco, CP: 74120 San Martín Texmelucan de Labastida, Puebla.
ID 1er Author: Patricia, Cano-Olivos / ORC ID: 0000-0003-1754-6619, Researcher ID Thomson: Q-
6274-2018, CVU CONACYT ID: 382605
ID 1er CoAuthor: Nayeli, Paredes-Pérez / ORC ID: 0000-0003-3859-9330, Researcher ID Thomson:
Q-9834-2018
P. Cano, N. Paredes
J. Tolamatl, D. Gallardo, J. Varela y J. Méndez. (Dir.) Strategies and successful practices of innovation in the automotive
industry, Science of technology and innovation. Handbooks-©ECORFAN-Mexico, Tlaxcala, 2018.

115
Abstract
The automotive sector has become one of the most important industries, its importance lies in the social
and economic effect it causes in the regions it operates. The challenge is to maintain a sufficiently flexible
and coordinated supply chain among the various participants, so that changing demands, delivery times
and increasingly short life cycles can be met. Hence, warehouses are vital in the supply chain and have
ceased to be only the facilities that are dedicated to store materials or products, now they have become
centers of service and support of the organization. An efficient warehouse has an impact on the overall
performance of the supply chain, for this it must be located in the optimum place, be designed according
to the necessary operations, use the appropriate equipment for handling materials, and have an
information system that support inventory control. The main objectives of the design of the warehouses
is to facilitate the speed and precision in the preparation of orders, as well as the efficient placement of
stocks, all this to enhance the competitive advantages of the organization. Through the Systematic Layout
Planning (SLP) methodology, warehouses can be configured to achieve the aforementioned objectives.
In this case of study, the poor location of the materials inside the warehouse generated excessive time in
the preparation of orders (picking) of materials, which clearly affected the productivity of the supply
chain, so it was decided to redesign the locations of materials within the warehouse through the SLP
methodology, the results that were obtained from the implementation were significant, since it was
possible to reduce the picking time of materials of 67 and 69 minutes of the front and rear products to 33
and 34 minutes respectively, and as a result, online stoppages, overtime hours, costs, among others, are
reduced.
Automotive industry, Supply Chain, Logistics, Warehouses, SLP
1. Introduction
The automotive industry is the most relevant sector for many economies in the world and has been a
source of innovation in the design of products and manufacturing technologies. In Mexico it is one of the
most competitive and dynamic economic activities since it contributes with more than 3% of gross
domestic product and generates around 900,000 jobs in the country (Mexican Association of Automotive
Distributors [AMDA], 2016). For this reason, many organizations that are part of the Supply Chain (CS)
of the automotive industry, have adopted different methodologies to improve logistics performance. It
should be noted that the supply of automotive parts in many cases is through a Just in Sequence (JIS) or
Just in Time (JIT) scheme, hence the interrelation and coordination of all members of the supply chain
must be the basis for generating strategic procurement (Chiang et al., 2012) and competitive advantages
that contribute to achieving the objectives and achieve the success of the organization.
In particular, logistics is what manages the flow of products between points of origin and points of
consumption, this involves integrating information flows, handling of materials, production, packaging
and packaging, inventories, transportation, storage, among others; while the administration of the supply
chain is the one that strategically coordinates the functions and activities among the companies that make
up a supply chain (Li, 2014).
The objective of this case study was to redesign the locations of materials within the warehouse of
one of the suppliers of the automotive industry, in order to reduce picking times and consequently
minimize overtime hours. In the first part of this chapter is the literature review, which addresses the
importance of the distribution of warehouses, as it is considered vital in the supply of materials, since
poor distribution can increase logistics costs, delivery times and decrease the level of customer service;
In the second part, the three phases of the Systematic Layout Planning (SLP) methodology are described;
in the third part, the development of the case study is described, starting by analyzing the problem, finding
solutions and making decisions; in the last part the results obtained and the conclusions of the work are
shown.
116
2. Theoretical review
The automotive industry is one of the most competitive sectors in the market, but demand, flexibility,
quality and agility are the critical success factors (Caridade et al., 2017), that is, supply chains change
every day, change of size and configuration (MacCarthyet al., 2016), and even more coordination, control
and management also become dynamic. For this reason, the supply chain of the automotive industry has
been the most studied (Xie, 2014), and in general the administration of the supply chain has received
special attention from academics (Ou et al., 2010).
For the importance of the coordination and integration of the supply chain is essential to compete
in the globalized world, however this has been characterized by the high degree of difficulty and
complexity of the multiple relationships and interactions between the members (Kamariah & Mohamed,
2009), these interactions are not only complicated by their volume and variation in processes, but also
by the complexity inherent in the existing dependency between the parties in time and space (Power,
2006). Therefore, it is necessary for the organization to have strategic collaboration with all members of
the supply chain, both internal and external, in order to achieve effective and efficient flows of products
and services, information, money and decisions, with the objective of maximizing the value to the
customers at the lowest cost and faster (Zhao et al., 2008).
Logistics plays a very important role in any company, as it is responsible for managing, managing
and controlling the inventory of materials, and is also responsible for providing materials to the
production processes, however there are two important factors that have to be considered in the supply
system, these are the time of collection of materials and location of raw materials in the warehouse.
Currently successful organizations are increasingly characterized by the ability to abandon inadequate
work configurations (Raguseo et al., 2016), for this case the proper distribution of the store can mark the
success (or failure) of the business (Huertas et al., 2007; Frazelle, 2002).
It should be noted that warehouses are considered a vital part (Faber et al., 2013), since they are
the intermediate and critical point of the members of the supply chain (Kiefer & Novack, 1999), since
they can affect several aspects of the supply chain warehouse performance such as the cost of material
handling, space cost and storage capacity (Rakesh & Adil, 2015). The main functions that warehouses
must fulfill are: a) Maintain the flow of materials along the supply chain, b) Consolidate products from
multiple suppliers and, c) add value to the activities of collection, labeling and personalization of the
product (Horta, 2016).
While it is true that the most appropriate warehouse design depends on its operational conditions
and characteristics such as modularity, adaptability, movement, accessibility and flexibility (Hassan,
2002), the design of the warehouse layout is a dependent problem, since there is no better design, due to
the diversity of factors that influence the operation such as access, types of racks, racks levels, among
others. (Tompkins et al., 2003; Carranza et al., 2004; Bartholdi & Hackman, 2005). The layout of the
warehouses must consider a dynamic flow of materials, to minimize the cost, handling, transport of stored
products (Gopalakrishnan et al., 2004), to improve the use of space (De Koster et al., 2007; Gu et al.,
2007); and also must provide better working conditions (Richards, 2011).
Since years ago, the problems of designing the layout have been an active field of research, Vis &
Roodbergen (2011) proposed three different concepts and procedures that can be used to design the
layout of the warehouse; the first as a fixed layout, which is designed for a considerable period of time;
the second layout based on categories, seeks to incorporate greater flexibility in such a way that it allows
to categorize the materials according to the daily information; and the third as a flexible layout, this must
allow daily changes.
There is also literature that divides the problems of layout design, algorithmic and procedural into
two main categories. The algorithmic approach uses numerical calculations to optimize the system
design, that is, it only implies quantitative data; whereas the procedural approach can incorporate
quantitative and qualitative data (Liu, 2016).
117
Yang (2000) believed that the procedural approach was not enough to handle the problems of
multi-objective layout planning, but through some evaluation functions these problems can be solved
more effectively. The systematic layout planning (SLP) proposed by Muther (1976) is a relatively simple
and procedural approach tool that has been proven in several organizations.
The SLP method is used to determine an efficient layout that:
1. It is based on the analysis of a logistic relationship between blocks and operating units.
2. Use a method of factor evaluation to evaluate the proposals.
3. Obtain the optimal layout (zhou et al., 2010). The main objective of the slp is to find a layout that
minimizes the transport costs of the goods, in other words locate the departments as close as
possible (Van Donk & Gaalman, 2004).
Although the relationship between the characteristics of the warehouse and the cost of maintenance
is understood, little work has been done to evaluate the connection that the service level has with the
distribution of the warehouse (De Marco & Mangano, 2011), as the interior distribution of the warehouse
is to treat a very complex logistic process, since it has to be considered from the reception of the materials,
handling of loads and storage, control and management of stocks, preparation of orders and delivery of
material.
A well-managed and distributed warehouse gives balance to the company, because it is able to
stabilize production with demand, since it tries to synchronize manufacturing and demand and also
assumes a permanent supply. Therefore, the warehouse is considered a key element in the logistics
network as it serves as a regulator of the flow of materials, and also must function and fit seamlessly
throughout the supply chain to achieve excellence.
3. Methodology
The objective of redesigning the locations of materials within the warehouse is to optimize the flow of
materials, people and information (Monks, 1987). The SLP is a method widely used in companies due
to accessibility (Gilbert, 2004), since it facilitates decision making in the redesign of facilities (Silva y
Moreira, 2009). However, to initiate the application of this methodology it is important to identify the
flows, procedures, activities and limitations of the distribution of the facilities (Trein & Amaral, 2001).
According to Tortorella & Flogliato (2008), the SLP is divided into three major steps:
1. Analysis, is the collection of company data, flow and activities related to the process, resulting in
the map of relationships.
2. Research, several alternatives are constructed considering the diverse characteristics and
limitations.
3. Selection, the performance of the various arrangements is evaluated and the best one is chosen.
This case study was developed with the methodology of the systematic layout planning (figure
6.1), it should be noted that the objective of this work is to minimize the picking time, because the
excessive times have generated high labor costs extra.

118
Figure 6.1 Systematic Layout Planning (SLP)
Source: Self Made
3.1 Analysis of the problem
To begin the analysis, information on the current system is needed to determine the relationship between
departments, as well as the space required for these and the space available. The tools that are used in
this stage are described below.
a. Flow of materials: The flow of materials includes all movements of raw material, product in process
and finished product. To facilitate the analysis, the process flow diagram is used, which specifies
the material route along the process and a diagram from-to, to know the distance between processes.
b. Relationship of activities: Consists of preparing a table of relationship of activities, developed by
Muther (1976), this measures the importance of proximity between departments or processes. For
this, all the departments in the table are listed, the importance of the relationship between them is
determined, a criterion is defined to assign the importance of closeness, and the relationship value
is established and the reason for which said value was assigned. The relationship value is usually
expressed as follows:
Input data and
activities
1. Material flow 2. List of
activities
3. Relationship
diagram
4. Space
requirement 5. Available
space
6. Diagram of
space relations
7. Modification
considerations 8. Practical
limitations
9. Development of
layout alternatives
10. Evaluation

119
A: Absolutely necessary
E: Especially necessary
I: Important
O: Ordinary proximity
U: Not important
X: Undesirable
XX: Highly undesirable
All those involved in the development of the table are allowed to have an opportunity to evaluate
and discuss possible changes. In the table you can see which departments have to be close to each other
so that material handling is efficient (Acevedo, 2001). With the flow of materials and the table of
relationship of activities a relationship diagram is drawn up. This diagram shows if there is a flow of
materials between each department as well as the relationship between these.
a. Space requirements: The space required for each department or process is determined, taking into
account the dimensions of the machinery, the space necessary for the operators, for the inventory
in queue and the inventory in process.
b. Available space: It is important that the space available is equal to or greater than the space
required, in order to continue with the development of the SLP.
3.2 Search
In this stage the locations are redesigned taking into account restrictions and modifications, through:
a. Diagram of relationship - space: In the relationship diagram, the spaces required for each
department or process as well as the location are added.
b. Modifications flexibility.
c. Practical limitations They can be of space and / or resources.
3.3 Evaluation
In this last stage the proposals are evaluated, for the evaluation criteria can be taken as the adjacency
compliance between departments, the form of the departments, the cost of material handling, the total
distance between departments, among others.
Proximity of departments: Consists in verifying the type of adjacency that is desired and in case
of fulfilling said type of adjacency in the proposal a value is assigned. For this evaluation you have to
consult the activity relationship diagram where the type of adjacency appears. Once the adjacency
between all the departments is verified, the score is added, the highest being a better grade. Below is the
value that is applied to each type of adjacency that is met.
A = 20
E = 15
I = 10
O = 5
U = 0
X = 15
XX = 20
Geometric space: The shape of the departments determines a better functionality of the
departments. The desirable form of a department is the one that most resembles the perfect square, or if
it is a rectangle that is not thin. For this evaluation, the area and perimeter of each department must be
calculated. Once you have these data the following formula is developed:
𝑭 =p
4√A (1)

120
Where:
p = perimeter
A = area
F = department shape coefficient
If 1 ≤ F ≤ 1.4, The shape of the department is acceptable
Costs: The total cost for material handling and is calculated with the following formula.
𝑪 = ∑ ∑ 𝑐𝑖𝑗𝑓𝑖𝑗𝑑𝑖𝑗𝑚𝑗=1
𝑚𝑖=1 (2)
Where:
C = total cost
cij = cost of material handling between department i and department j.
fij = flow of materials between department i to department j.
dij = distance between department i and department j.
m = number of departments.
The desired alternative in this evaluation is the one with the lowest total cost for handling materials
Simulation: According to Kelton (2004), simulation refers to a wide collection of methods and
applications to mimic the behavior of real systems, usually on a computer with the appropriate software.
5. Development
5.1 Analysis of the problem
This study was carried out in a company that manufactures components for the automotive industry, and
specifically analyzed the physical distribution of the raw material warehouse locations of the front and
rear products, which has an approximate area of 3000 m2; in this space there are 7 ramps, 15 racks of 3
levels, area of order preparation and a quality release zone (figure 6.2).
Figure 6.2 Current layout of the materials warehouse
Source: self made
Although the physical facilities of the warehouse currently meet the basic needs in terms of space
for the dimensions of inventory that are handled for the short and medium term, the distribution of the
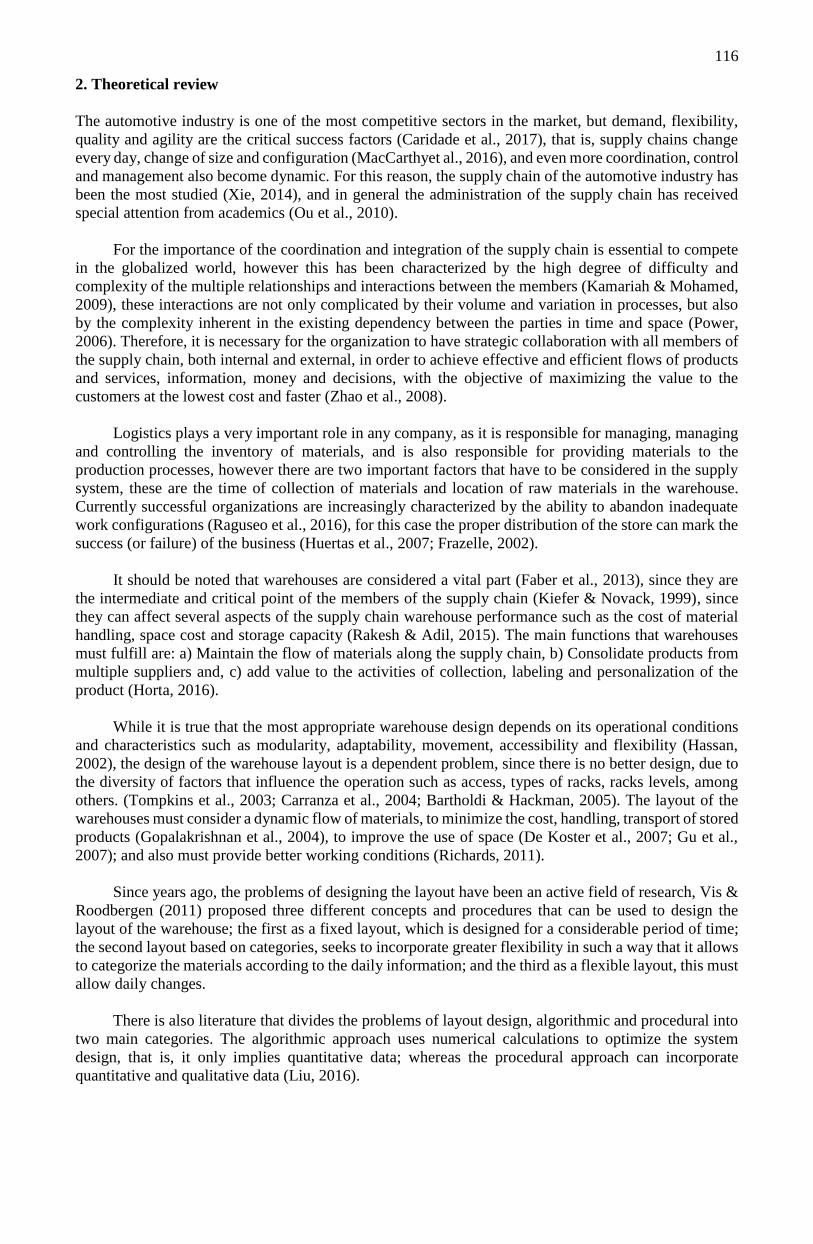
warehouse has led to the times of the total flow of the picking exceeding 20 minutes of time customer's
touch (graphic 6.1), which has generated that the preparation of orders for the materials to be used for
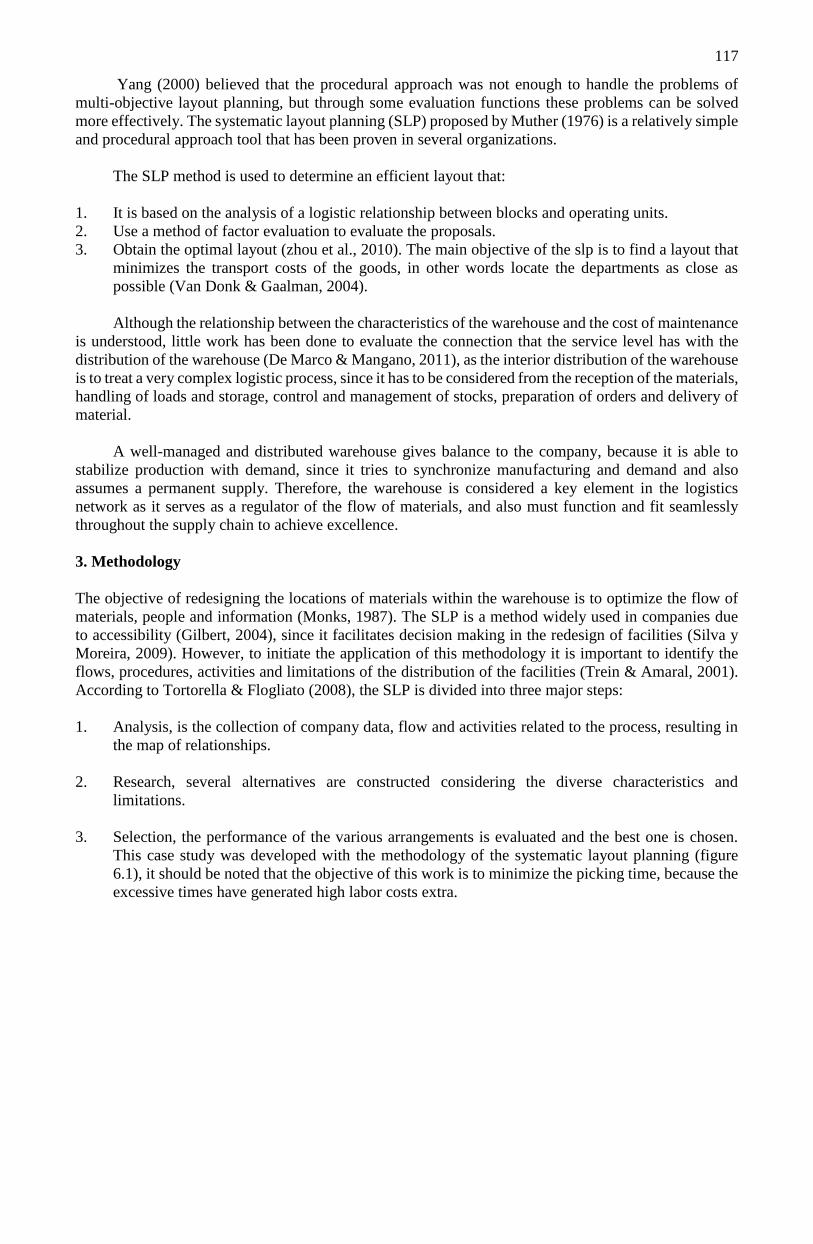
the production of front and rear products, are made in advance through extraordinary work days (Graphic
6.2) to satisfy 100% of customer requirements.
PREKITING PREPARATION
RAW MATERIAL RACKS
48 m
62 m
121
Graphic 6.1 Average picking time / week
Source: Self Made
Graphic 6.2 Extra time per pick / week
Source: Self Made
This increase in hours represents a high economic impact within the company, since it is allocating
non-budgeted resources for the payment of payroll for the concept of extra time (Graphic 6.3).
Graphic 6.3 Cost of extra time / week
Source: Self Made
70 7067 68 69 68 67
6067 68 66 65
6965 66 67
72 68 7165
71 7265 72
65 67 69 6572 71 69 70
0
10
20
30
40
50
60
70
80
1 2 3 4 5 6 7 8 9 10 11 12 13 14 15 16
Pic
kin
g m
inute
s
Weeks
Objective
Frontal
Back
100.5
244.5
207
159
208.5
238.5
91.5
34.5
258
63
244.5
294
13.5 6
112.5
7.5
0
50
100
150
200
250
300
350
1 2 3 4 5 6 7 8 9 10 11 12 13 14 15 16
Ho
urs
of
extr
a ti
me
Weeks
$8,844.00
$21,516.00
$18,216.00
$13,992.00
$18,348.00
$20,988.00
$8,052.00
$3,036.00
$22,704.00
$5,544.00
$21,516.00
$25,872.00
$1,188.00
$528.00
$9,900.00
$660.00
$0.00
$5,000.00
$10,000.00
$15,000.00
$20,000.00
$25,000.00
$30,000.00
1 2 3 4 5 6 7 8 9 10 11 12 13 14 15 16
Co
st o
f ex
tra
tim
e
Weeks
122
From this problematic was made the analysis of the picking process times to be able to satisfy the
customer demand, it was as well as it was detected that the times and movements were very high, that is,
the route of the operators are a bottleneck in the operation, for this reason it is necessary to re-configure
the locations of the materials of the front and front products within the warehouse through Strategic
Layout Planning (SLP), in such a way that the distances traveled from the picking, take advantage of the
spaces, save energy, and identify areas of opportunity that allow the organization to be channeled towards
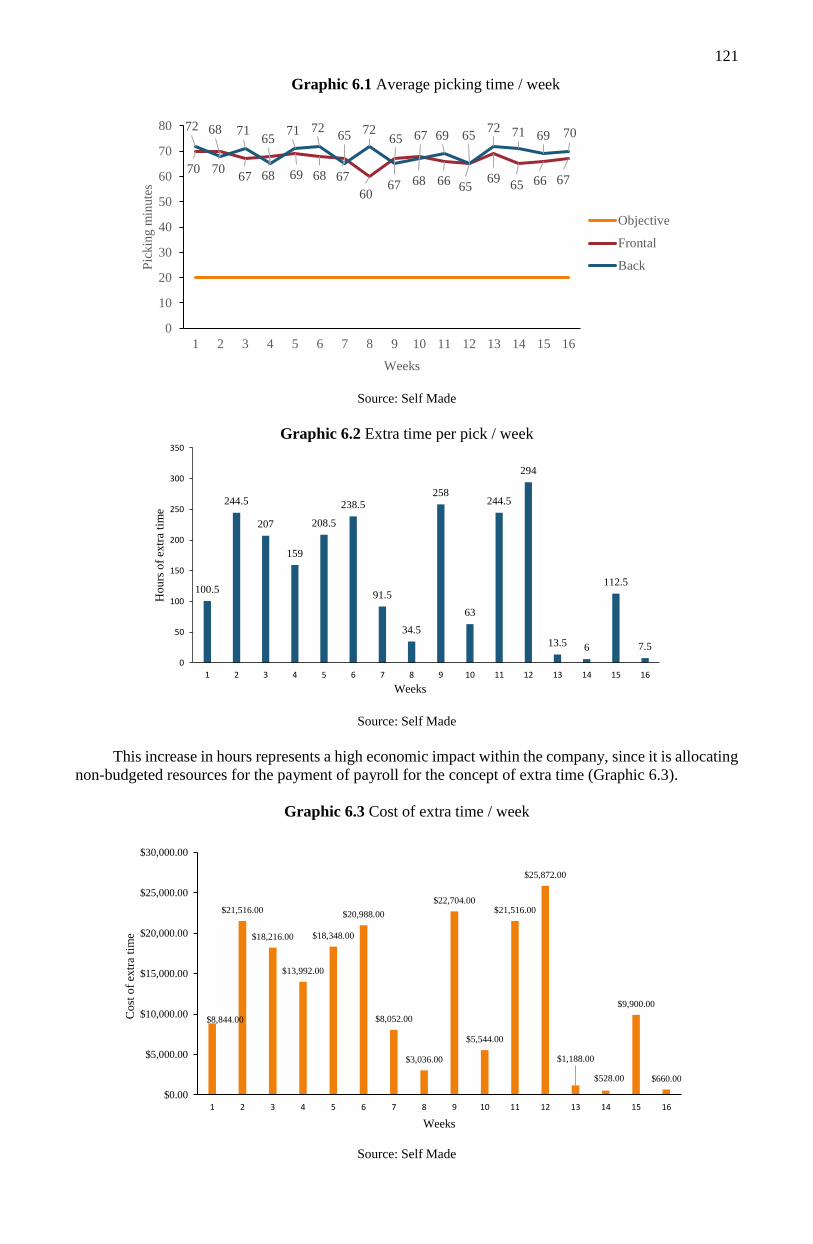
competitiveness. One of the important aspects for the sizing of a warehouse is the volume needed to
protect the materials, since the total production volume of the last periods has been increasing (graph
6.4), which is why it is necessary to plan the resources for the Following periods, for this reason and
under the JIT scheme, the locations of the raw materials warehouse have to be adjusted to reduce picking
times, operating costs and optimize labor.
Graphic 6.4 Total production volume
Source: Self Made
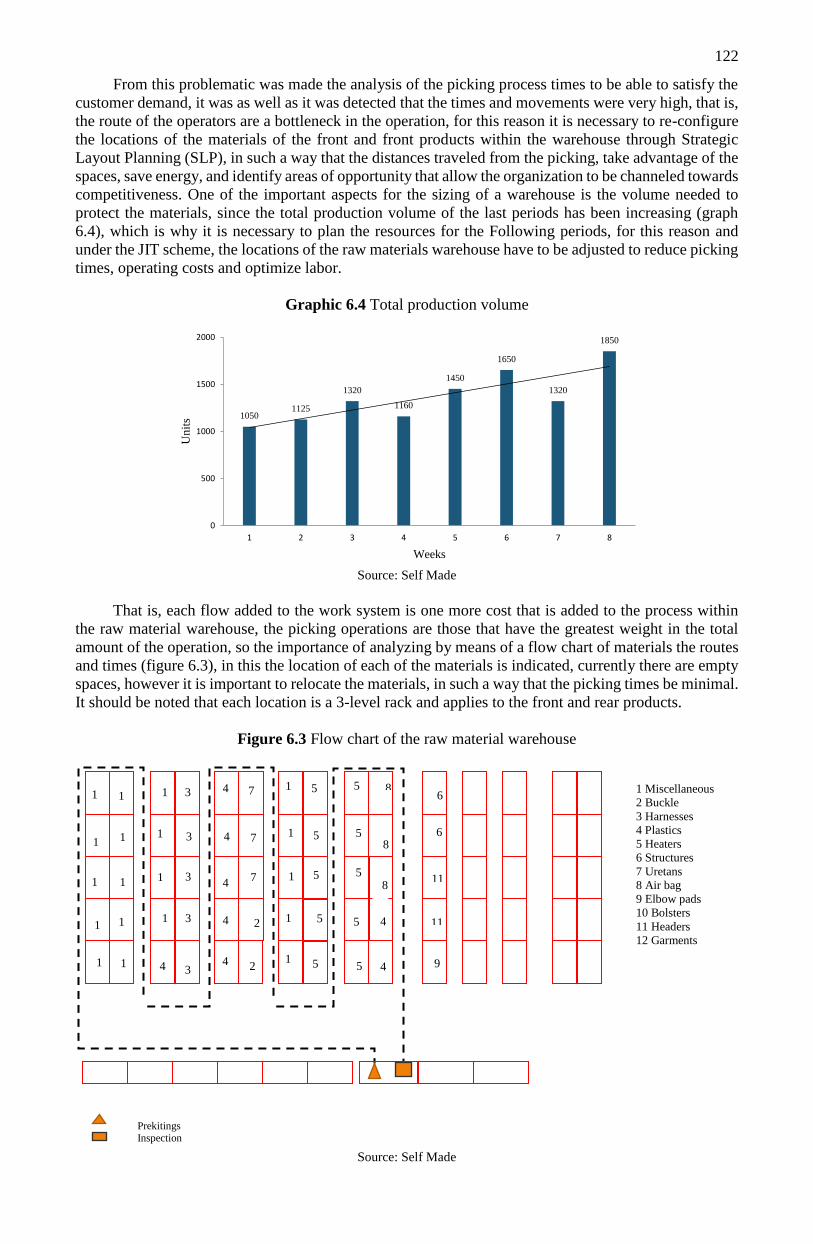
That is, each flow added to the work system is one more cost that is added to the process within
the raw material warehouse, the picking operations are those that have the greatest weight in the total
amount of the operation, so the importance of analyzing by means of a flow chart of materials the routes
and times (figure 6.3), in this the location of each of the materials is indicated, currently there are empty
spaces, however it is important to relocate the materials, in such a way that the picking times be minimal.
It should be noted that each location is a 3-level rack and applies to the front and rear products.
Figure 6.3 Flow chart of the raw material warehouse
Source: Self Made
10501125
1320
1160
1450
1650
1320
1850
0
500
1000
1500
2000
1 2 3 4 5 6 7 8
Un
its
Weeks
11
4
5
5
5
5
5
7
7
2
5
5
5
1
1
1
1
5
4
4
4
4
1
0
1
0
1
0
1
0
3
3
3
3
1
2
1
2
1
1
0
1
0
1
0
1
0 9
4
11
8
5 2
1
7
4
3 4
1
0
1
1
2
6 1 Miscellaneous
2 Buckle
3 Harnesses
4 Plastics
5 Heaters
6 Structures
7 Uretans
8 Air bag
9 Elbow pads
10 Bolsters
11 Headers
12 Garments
Prekitings Inspection
8
8
6
123
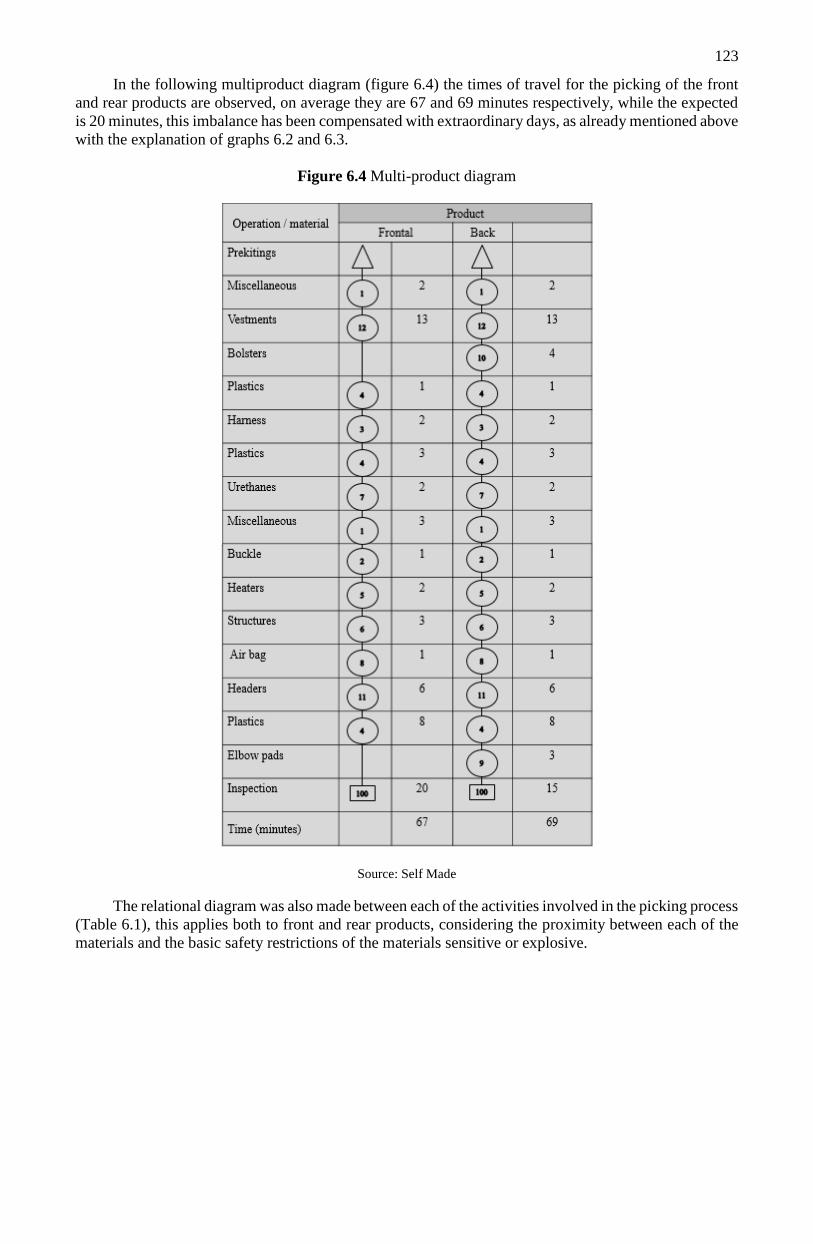
In the following multiproduct diagram (figure 6.4) the times of travel for the picking of the front
and rear products are observed, on average they are 67 and 69 minutes respectively, while the expected
is 20 minutes, this imbalance has been compensated with extraordinary days, as already mentioned above
with the explanation of graphs 6.2 and 6.3.
Figure 6.4 Multi-product diagram
Source: Self Made
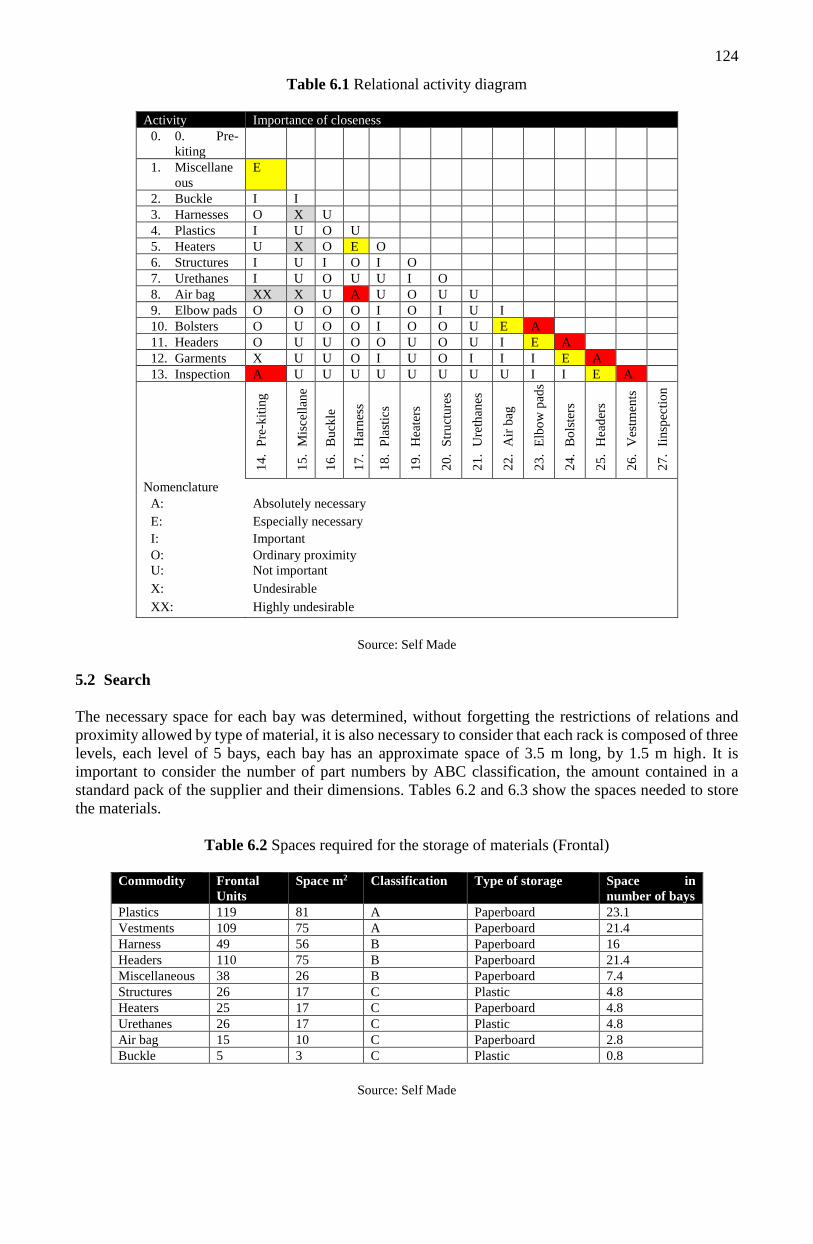
The relational diagram was also made between each of the activities involved in the picking process
(Table 6.1), this applies both to front and rear products, considering the proximity between each of the
materials and the basic safety restrictions of the materials sensitive or explosive.
124
Table 6.1 Relational activity diagram
Activity Importance of closeness
0. 0. Pre-
kiting
1. Miscellane
ous
E
2. Buckle I I
3. Harnesses O X U
4. Plastics I U O U
5. Heaters U X O E O
6. Structures I U I O I O
7. Urethanes I U O U U I O
8. Air bag XX X U A U O U U
9. Elbow pads O O O O I O I U I
10. Bolsters O U O O I O O U E A
11. Headers O U U O O U O U I E A
12. Garments X U U O I U O I I I E A
13. Inspection A U U U U U U U U I I E A
14
. P
re-k
itin
g
15
. M
isce
llan
e
ou
ss
16
. B
uck
le
17
. H
arn
ess
18
. P
last
ics
19
. H
eate
rs
20
. S
tru
ctu
res
21
. U
reth
anes
22
. A
ir b
ag
23
. E
lbo
w p
ads
24
. B
ols
ters
25
. H
ead
ers
26
. V
estm
ents
27
. Ii
nsp
ecti
on
Nomenclature
A: Absolutely necessary
E: Especially necessary
I: Important
O: Ordinary proximity
U: Not important
X: Undesirable
XX: Highly undesirable
Source: Self Made
5.2 Search
The necessary space for each bay was determined, without forgetting the restrictions of relations and
proximity allowed by type of material, it is also necessary to consider that each rack is composed of three
levels, each level of 5 bays, each bay has an approximate space of 3.5 m long, by 1.5 m high. It is
important to consider the number of part numbers by ABC classification, the amount contained in a
standard pack of the supplier and their dimensions. Tables 6.2 and 6.3 show the spaces needed to store
the materials.
Table 6.2 Spaces required for the storage of materials (Frontal)
Commodity Frontal
Units
Space m2 Classification Type of storage Space in
number of bays
Plastics 119 81 A Paperboard 23.1
Vestments 109 75 A Paperboard 21.4
Harness 49 56 B Paperboard 16
Headers 110 75 B Paperboard 21.4
Miscellaneous 38 26 B Paperboard 7.4
Structures 26 17 C Plastic 4.8
Heaters 25 17 C Paperboard 4.8
Urethanes 26 17 C Plastic 4.8
Air bag 15 10 C Paperboard 2.8
Buckle 5 3 C Plastic 0.8
Source: Self Made
125
Table 6.3 Spaces required for storage of materials (Rear).
Commodity Back
Units
Space m2 Classification Type of storage Space in number of
bays
Vestments 102 70 A Paperboard 20
Plastics 30 20 A Paperboard 5.7
Bolsters 102 70 B Paperboard 20
Elbow pads 102 70 B Plastic 20
Headers 102 70 B Paperboard 20
Urethanes 50 34 B Plastic 9.7
Buckle 13 8 C Plastic 2.2
Heaters 15 10 C Paperboard 2.8
Structures 30 20 C Plastic 5.7
Air bag 10 60 C Paperboard 1.7
Harness 5 3 C Paperboard 0.8
Miscellaneous 50 34 C Paperboard 9.7
Source: Self Made
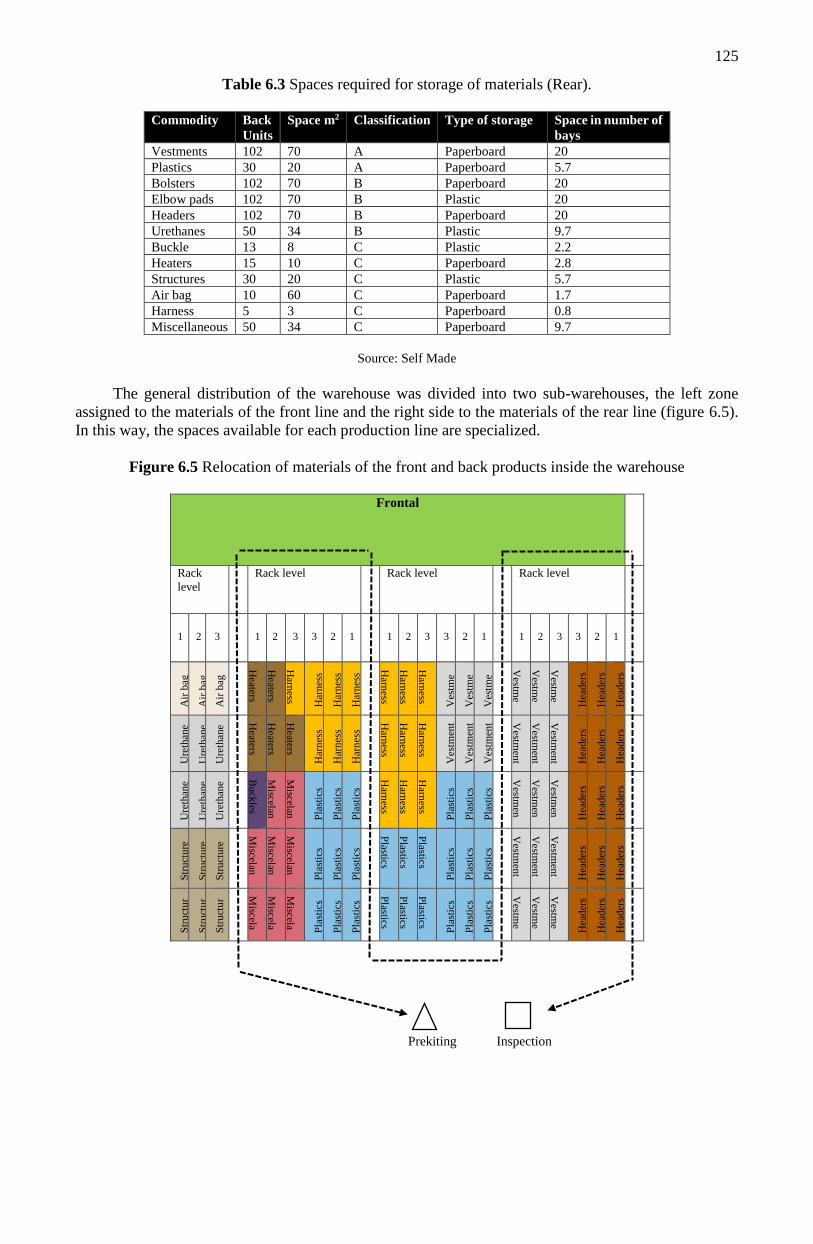
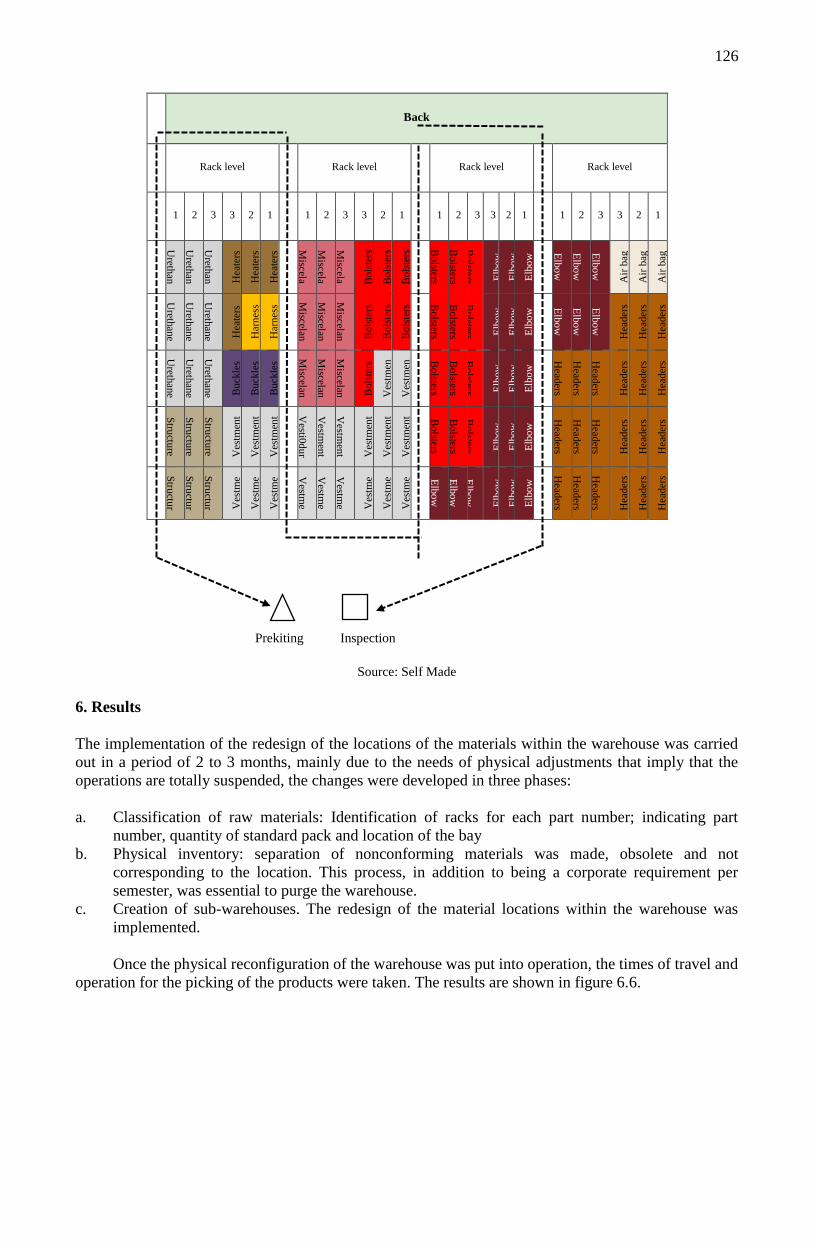
The general distribution of the warehouse was divided into two sub-warehouses, the left zone
assigned to the materials of the front line and the right side to the materials of the rear line (figure 6.5).
In this way, the spaces available for each production line are specialized.
Figure 6.5 Relocation of materials of the front and back products inside the warehouse
Frontal
Rack
level
Rack level Rack level Rack level
1 2 3 1 2 3 3 2 1 1 2 3 3 2 1 1 2 3 3 2 1
Air
bag
Air
bag
Air
bag
Heaters
Heaters
Harn
ess Har
nes
s
Har
nes
s
Har
nes
s
Harn
ess
Harn
ess
Harn
ess Ves
tme
nts
V
estm
e
nts
V
estm
e
nts
Vestm
e
nts
Vestm
e
nts
Vestm
e
nts
Hea
der
s
Hea
der
s
Hea
der
s
Ure
than
e
s Ure
than
e
s Ure
than
e
s
Heaters
Heaters
Heaters
Har
nes
s
Har
nes
s
Har
nes
s
Harn
ess
Harn
ess
Harn
ess
Ves
tmen
t
s Ves
tmen
t
s Ves
tmen
t
s
Vestm
ent
s Vestm
ent
s Vestm
ent
s
Hea
der
s
Hea
der
s
Hea
der
s
Ure
than
e
s Ure
than
e
s Ure
than
e
s
Buck
les
Miscelan
Miscelan
Pla
stic
s
Pla
stic
s
Pla
stic
s
Harn
ess
Harn
ess
Harn
ess
Pla
stic
s
Pla
stic
s
Pla
stic
s
Vestm
en
ts
Vestm
en
ts
Vestm
en
ts
Hea
der
s
Hea
der
s
Hea
der
s
Str
uct
ure
Str
uct
ure
Str
uct
ure
Miscelan
Miscelan
Miscelan
Pla
stic
s
Pla
stic
s
Pla
stic
s
Plastics
Plastics
Plastics
Pla
stic
s
Pla
stic
s
Pla
stic
s
Vestm
ent
s Vestm
ent
s Vestm
ent
s
Hea
der
s
Hea
der
s
Hea
der
s
Str
uct
ur
e Str
uct
ur
e Str
uct
ur
e
Miscela
n
Miscela
n
Miscela
n
Pla
stic
s
Pla
stic
s
Pla
stic
s
Plastics
Plastics
Plastics P
last
ics
Pla
stic
s
Pla
stic
s
Vestm
e
nts
Vestm
e
nts
Vestm
e
nts
Hea
der
s
Hea
der
s
Hea
der
s
Prekiting Inspection
126
Back
Rack level Rack level Rack level Rack level
1 2 3 3 2 1 1 2 3 3 2 1 1 2 3 3 2 1 1 2 3 3 2 1
Ureth
an
es
Ureth
an
es
Ureth
an
es
Hea
ters
Hea
ters
Hea
ters
Miscela
n
Miscela
n
Miscela
n
Bols
ters
Bols
ters
Bols
ters
Bolsters
Bolsters
Bolsters E
lbo
w
pad
s
Elb
ow
pad
s
Elb
ow
pad
s
Elb
ow
pad
s
Elb
ow
pad
s
Elb
ow
pad
s Air
bag
Air
bag
Air
bag
Ureth
ane
s
Ureth
ane
s
Ureth
ane
s
Hea
ters
Har
nes
s
Har
nes
s
Miscelan
Miscelan
Miscelan
Bols
ters
Bols
ters
Bols
ters
Bolsters
Bolsters
Bolsters E
lbo
w
pad
s
Elb
ow
pad
s
Elb
ow
pad
s
Elb
ow
pad
s
Elb
ow
pad
s
Elb
ow
pad
s
Hea
der
s
Hea
der
s
Hea
der
s
Ureth
ane
s
Ureth
ane
s
Ureth
ane
s
Buck
les
Buck
les
Buck
les
Miscelan
Miscelan
Miscelan
Bols
ters
Ves
tmen
ts
Ves
tmen
ts
Bolsters
Bolsters
Bolsters E
lbo
w
pad
s
Elb
ow
pad
s
Elb
ow
pad
s
Head
ers
Head
ers
Head
ers Hea
der
s
Hea
der
s
Hea
der
s
Stru
cture
Stru
cture
Stru
cture V
estm
ent
s V
estm
ent
s V
estm
ent
s
Vesti0
du
r
as
Vestm
ent
s
Vestm
ent
s
Ves
tmen
t
s V
estm
ent
s V
estm
ent
s
Bolsters
Bolsters
Bolsters E
lbo
w
pad
s
Elb
ow
pad
s
Elb
ow
pad
s
Head
ers
Head
ers
Head
ers Hea
der
s
Hea
der
s
Hea
der
s
Stru
ctur
e
Stru
ctur
e
Stru
ctur
e
Ves
tme
nts
V
estm
e
nts
V
estm
e
nts
Vestm
e
nts
Vestm
e
nts
Vestm
e
nts
Ves
tme
nts
V
estm
e
nts
V
estm
e
nts
Elb
ow
pad
s
Elb
ow
pad
s
Elb
ow
pad
s Elb
ow
pad
s
Elb
ow
pad
s
Elb
ow
pad
s
Head
ers
Head
ers
Head
ers Hea
der
s
Hea
der
s
Hea
der
s
Prekiting Inspection
Source: Self Made
6. Results
The implementation of the redesign of the locations of the materials within the warehouse was carried
out in a period of 2 to 3 months, mainly due to the needs of physical adjustments that imply that the
operations are totally suspended, the changes were developed in three phases:
a. Classification of raw materials: Identification of racks for each part number; indicating part
number, quantity of standard pack and location of the bay
b. Physical inventory: separation of nonconforming materials was made, obsolete and not
corresponding to the location. This process, in addition to being a corporate requirement per
semester, was essential to purge the warehouse.
c. Creation of sub-warehouses. The redesign of the material locations within the warehouse was
implemented.
Once the physical reconfiguration of the warehouse was put into operation, the times of travel and
operation for the picking of the products were taken. The results are shown in figure 6.6.
127
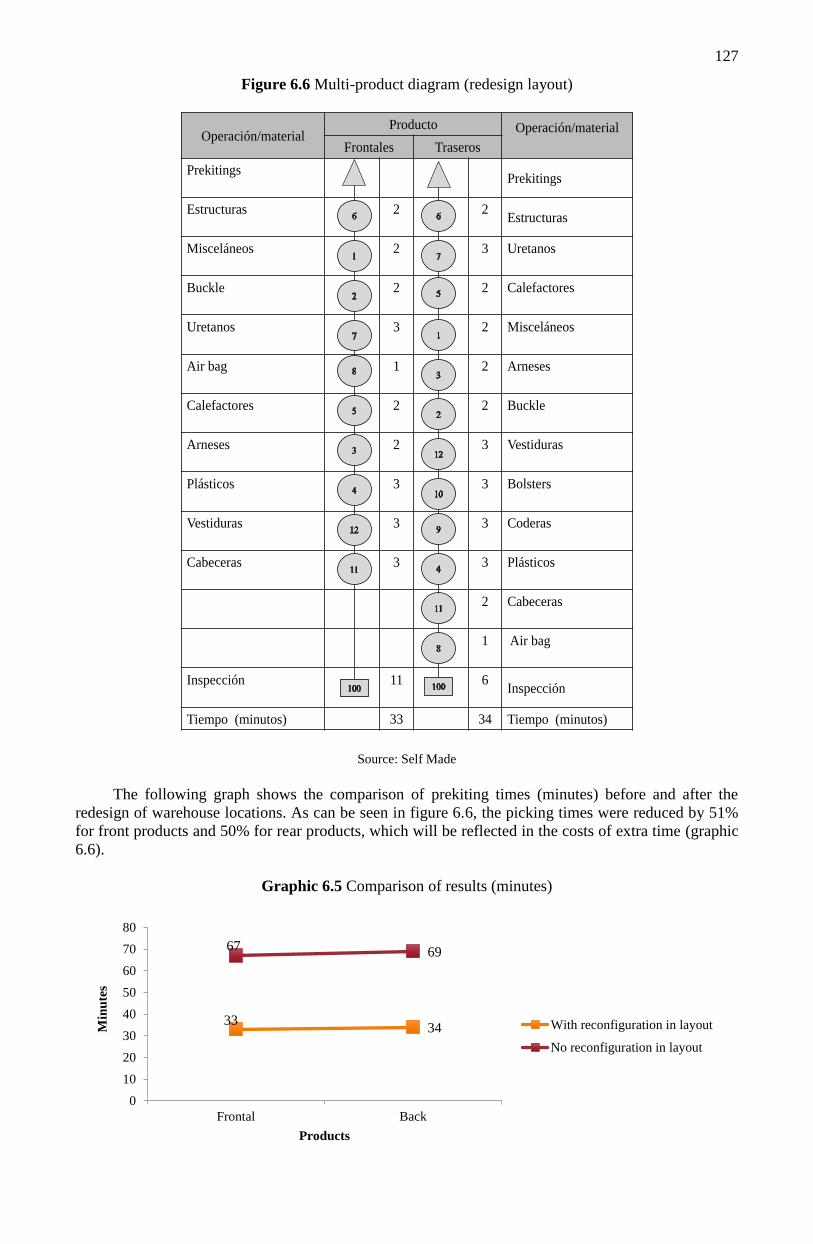
Figure 6.6 Multi-product diagram (redesign layout)
Source: Self Made
The following graph shows the comparison of prekiting times (minutes) before and after the
redesign of warehouse locations. As can be seen in figure 6.6, the picking times were reduced by 51%
for front products and 50% for rear products, which will be reflected in the costs of extra time (graphic
6.6).
Graphic 6.5 Comparison of results (minutes)
Operación/materialProducto Operación/material
Frontales Traseros
PrekitingsPrekitings
Estructuras 2 2Estructuras
Misceláneos 2 3 Uretanos
Buckle 2 2 Calefactores
Uretanos 3 2 Misceláneos
Air bag 1 2 Arneses
Calefactores 2 2 Buckle
Arneses 2 3 Vestiduras
Plásticos 3 3 Bolsters
Vestiduras 3 3 Coderas
Cabeceras 3 3 Plásticos
2 Cabeceras
1 Air bag
Inspección 11 6Inspección
Tiempo (minutos) 33 34 Tiempo (minutos)
3334
67 69
0
10
20
30
40
50
60
70
80
Frontal Back
Min
ute
s
Products
With reconfiguration in layout
No reconfiguration in layout

128
Graphic 6.6 Comparison of results (Costs of extra time)
Source: Self Made
8. Conclusions
The daily competitiveness in which companies are immersed leads them commonly to the idea of
investing in new resources, whether human, technical, physical, etc., however, it is important to know
that there are tools and methods that allow facing the problems of orderly and measurable way. The
benefits of the practical integration of different tools in the analysis of data, decision making, and
proposals of alternatives lead to achieving important objectives in the company, such as: increase
productivity, efficiently use resources, maximize profitability, eliminate waste, among others.
One of the key pieces to plan the supply chain is to redesign the locations of the materials within
the warehouses, as it optimizes the activities and generates a greater guarantee in the logistic services
that the company can offer the client, for this it must be taken into account. account the strategy of inputs
and outputs of the merchandise, the type of storage, the internal transport system, the frequency of
rotation of the products, the level of the inventory, the guidelines of packaging and preparation of orders,
among others. By taking into account these elements the operations of the warehouse will be more
efficient as they will achieve faster order preparation and a decrease in errors. This translates into a better
flow of materials, lower cost and greater customer service, in addition to offering workers a suitable and
safe work environment.
In this case the reconfiguration of the material warehouse distribution in an automotive JIT plant
through the SLP, provides the flexibility to adapt the tools to very specific and specific processes, to
improve the process flows that allow to satisfy the client's demands in the agreed times, which generates
competitive advantage by reducing time, distance, energy, labor, material handling and also contributes
to the traceability of materials.
9. References
Acevedo, J. A., GÓMEZ M. I. (2001). Diseño del servicio al cliente, Habana, Cuba: ISPJAE.
Asociación mexicana de distribuidores de automotores A.C. (AMDA) (2016), Diálogos con la industria
automotriz 2012-2018. https://www.amda.mx/wp-content/uploads/2018/02/Dialogos01-12-16.pdf
Bartholdi, J.J. & Hackman, S.T. (2005). Warehouse and Distribution Science. The Supply Chain and
Logistics Institute. Atlanta, GA.

129
Caridade, R., Pereira, T., Pinto L. & Silva, F.G. A. (2017). Analysis and optimisation of a logistic
warehouse in the automotive industry. Procedia Manufacturing. Vol. 13, pp. 1096-1103.
Carranza, O., Sabria, F., Resende, P. and & Maltz, A. (2004) Logística: Mejores prácticas en
Lationamérica, Thomson, Mexico City.
Chiang, C.Y., Kocabasoglu-Hillmer, C. & Suresh, N. (2012). An empirical investigation of the impact
of strategic sourcing and flexibility on firm’s supply chain agility. International Journal of Operations
& Production Management, Vol. 32 No. 1, pp. 49-78.
De Koster, R., Le-Duc, T. & Roodbergen, K.J. (2007). Design and control of warehouse order picking:
a literature review. European Journal of Operational Research. Vol. 182, pp. 481-501.
De Marco, A. & Mangano, G. (2011). Relationship between logistic service and maintenance costs of
warehouses. Facilities. Vol. 29 No. 9/10, pp.411-421.
Faber, N., De Koster, M. B.. M & Smidts, A. (2013). Organizing warehouse management. International
Journal of Operations & Production Management, Vol. 33 No. 9, pp.1230-1256
Frazelle, E.H. (2002), World-Class Warehousing and Material Handling, McGraw-Hill, New York, NY.
Gilbert, J. (2004). Construction office design with systematic layout planning. 15th Annual Conference
on POM. Cancun, May 15-18
Gopalakrishnan, B., Turuvekere, R., & Gupta, D.P. (2004). Computer integrated facilities planning and
design. Facilities, Vol. 22 No. 7/8, pp. 199 – 209.
Gu, J., Goetschalckx, M. & McGinnis, L.F. (2007). Research on warehouse operation: A comprehensive
review. European Journal of Operational Research. Vol. 177, pp. 1-21.
Hassan, M.M.D. (2002). A framework for the design of warehouse layout. Facilities, Vol. 20 No. 13/14,
pp. 432-40.
Horta, M., Coelho, F. & Relvas, S. (2016). Layout design modelling for a real world just-in-time
warehouse. Computers & Industrial Engineering. Vol. 101, pp. 1-9.
Huertas, J. I., Díaz, J. & Trigos F. (2007). Layout evaluation of large capacity warehouses. Facilities,
Vol. 25 No. 7/8, pp.259-270.
Li, X. (2014), Operations management of logistics and supply chain: issues and directions. Discrete
Dynamics in Nature and Society, Vol. 2014, pp. 1-7.
Kamariah, N. & Mohamed, Z. (2009). Supply chain technology adoption in Malaysian automotive
suppliers. Journal of Manufacturing Technology Management, Vol. 20 No. 3, pp. 385 – 403.
Kelton, W., Sadowski, R. & Sturrock, D. (2004). Simulation with Arena. 3rd ed., McGraw-Hill, Boston.
Kiefer, A.W. & Novack, R.A. (1999). An empirical analysis of warehouse measurement systems in the
context of supply chain implementation. Transportation Journal, Vol. 38 No. 3, pp. 18-27.
Liu, K. H., Hwang, S. L., Hsieh, M. H., Liang, S. F. M & Chuang, C.F. (2016). Systematic layout
planning in human–system interface: An evaluation of alarm displays with spatial proximity for
accidents diagnosis of advanced boiling water reactor. Industrial Ergonomics. Vol. 51, pp 30-42.
MacCarthy, B. L., Blome, C., Olhager, J., Singh J. & Zhao, X. (2016). Supply chain evolution – theory,
concepts and science. International Journal of Operations & Production Management. Vol. 36 No. 12,
pp.1696-1718.
Monks, J. (1987). Administração da Produção. McGraw-Hill, São Paulo.
Muther, R. (1976). Systematic Layout Planning. Cahners Publishing, Boston, MA.

130
Ou, C. S., Liu, F. C., Hung, Y. C. & Yen, D. C. (2010). A structural model of supply chain management
on firm performance. International Journal of Operations & Production Management. Vol. 30 No. 5.
pp. 526 – 545.
Power, D. (2006). Adoption of supply chain management-enabling technologies in SMEs: the view from
the top vs the view from middle. International Journal Value Chain Management, Vol. 1 No.1.
Raguseo, E., Gastaldi, L. & Neirotti, P. (2016). Smart work: Supporting employees’ flexibility through
ICT, HR practices and office layout. Evidence-based HRM: a Global Forum for Empirical Scholarship,
Vol. 4 No. 3, pp.240-256.
Rakesh, V. & Adil, G. K. (2015). Layout Optimization of a Three Dimensional Order Picking
Warehouse. International Journal of Industrial Ergonomic. Vol. 51, pp. 30-42.
Richards, W. (2011). Warehouse management: A complete guide to improving efficiency and
minimizing costs in the modern warehouse. Kogan Page.
Silva, M. & Moreira, B. (2009). Aplicação da Metodologia SLP na Reformulação do Layout de uma
micro empresa do Setor Moveleiro. XXIX Encontro Nacional de Engenharia de Produção. Salvador,
October 7-10.
Tompkins, J.A., White, J.A., Bozer, Y.A. & Tanchoco, J.M.A. (2003). Facilities Planning. Wiley,
Hoboken, NJ.
Tortorella, G. & Fogliatto, F. (2008). Planejamento sistemático de layout com apoio de análise de
decisão multicritério. Produção. Vol. 18 No. 3, pp. 609-624.
Trein, F. & Amaral, F. (2001). Aplicação de Técnicas Sistemáticas para a Análise e Melhoria de Layout
de Processo na Indústria de Beneficiamento de Couro”. Encontro Nacional de Engenharia de Produção.
Porto Alegre, October 10-14.
Van Donk, D.P & Gaalman, G. (2004). Food Safety and Hygiene: Systematic Layout Planning of Food
Processes. Chemical Engineering Research and Design. Vol. 82 No. 11, pp. 1485-1493
Vis, I. F. A., & Roodbergen, K. J. (2011). Layout and control policies for cross docking operations.
Computers & Industrial Engineering. Vol. 61 No. (4), 911–919.
Xie, Z., & Miyazaki, K. (2014). Heterogeneity and typology of product innovation in embedded
software: The case of Japanese automotive software. Asian Journal of Technology Innovation. Vol. 22
No. 1, pp. 33-53.
Yang, T., Su, C.T. & Hsu, Y.R. (2000). Systematic layout planning: a study on semiconductor wafer
fabrication facilities. International Journal Operations Production Management. Vol. 20 No. 11, pp.
1359-1371.
Zhou, K.Q., Zhang, R.J., Wang, Y.D. & Wang, B.J. (2010). Study on Workshop Layout of a Motorcycle
Company Based on Systematic Layout Planning (SLP). Conference on Image Processing and Pattern
Recognition in Engineering, Available: http://proceedings.spiedigitallibrary.
org/proceeding.aspx?articleid¼724158
Zhao, X., Huo, B., Flynn B. B. & Yeung. J. H. Y. (2008). The impact of power and relationship
commitment on the integration between manufacturers and customers in a supply chain. Journal of
Operations Management. Vol. 26, pp. 368–388.