chapter 6 party loyalties i: theories of partisan ... · chapter 6 party loyalties chapter 4...
TRANSCRIPT

ELECTORAL ENGINEERING ~ CHAPTER 6 3/10/2003 6:35 PM
1
Chapter 6
Party loyalties
Chapter 4 demonstrated the mechanical effects of the electoral rules upon party systems, but we know far less about their indirect psychological impact upon patterns of party loyalties. Part I briefly reviews both cultural modernization and rational choice accounts to establish the theoretical framework. Part II compares the strength of partisan identification, the social and political characteristics of partisans, and also how far these attachments vary under different electoral systems. Part III goes on to consider how far these partisan bonds, in conjunction with social identities, help to explain voting behavior in the countries under comparison.
I: Theories of Partisan Identification Cultural modernization and partisan identification
Classic ‘Michigan’ theories of electoral behavior by Campbell et al., dominating the field of voting behavior in the United States for many decades, focused on individual-level voting choices rather than their broader institutional context. The model, derived from social psychology, suggested that most voters in the United States were anchored over successive elections, and sometimes for their lifetimes, by persistent loyalties to a particular party.1 ‘Partisan identification’ was understood in the original theory as an affective orientation or ‘habit of the heart’, where American voters came to see themselves as habitual Democrats or Republicans, as part of their core self-identity, rather as they came to see themselves as Southerners or New Englanders, Catholics or Protestants, and fans of the Yankees or Red Sox. Partisan identification has two main components: its direction (in support for particular parties across the left-right spectrum) and its strength (whether people feel lasting bonds or whether they only lean towards a particular party). These attachments, acquired through the socialization process in early childhood and adolescence, were believed to provide citizens with a long-standing orientation towards electoral choices and their place within the political system. Partisan identification has been regarded as a stable anchor providing a cognitive short-cut that guided voting decisions and reduced the costs of participation, even where people lacked detailed information about the particular candidates standing for office, or if they had little understanding of complex policy issues and party programs2. Because people saw themselves as Democrats or Republicans, they were thought to adopt political attitudes congruent with these identities, for example reflecting core beliefs about the need to reduce taxation in the GOP or the importance of preserving Medicare and Medicaid in the Democrats. Social structure remained an important component in this theory, as partisan identification was believed to be the product of a cohesive socialization process that reinforced the acquisition of early political values within the family, school, work group, and social milieu, so that attachments reflect long-standing structural cleavages of class, religion, gender, and race dividing the American electorate. Cultural accounts stress that habitual loyalties should be strengthen with age, as it takes time for people to acquire stable ties with parties3. The theory emphasized that the existence of habitual partisan identities in the mass electorate had important consequences, not just for how voters decide, but also for the behavior of political actors and for processes of stable governance. According to this view, in most US elections each party sought to mobilize and get-out-the-vote for its 'normal base' of support. This concept requires splitting the actual vote cast for a party into two parts: a 'normal' or baseline vote to be expected from a group, based on their habitual behaviour over successive elections in the past, and the current deviation from that norm, due to the immediate circumstances of the specific election, such as particular leaders, events, and issues. The outcome of elections, and therefore American government, rested upon stable and predictable processes. For the traditional 'Michigan' model, therefore, most American voters were anchored psychologically to a particular party for long periods of time, perhaps for their lifetime, through unwavering attachments that are, in turn, rooted in social structure.
When the Michigan model was applied to other established democracies in Western Europe, including Britain, France and Norway, early electoral surveys confirmed that most voters

ELECTORAL ENGINEERING ~ CHAPTER 6 3/10/2003 6:35 PM
2
expressed a party identification and that this sense of attachment was strongly associated with voting behavior in these nations as well4. In 1964, for example, 96% of British citizens identified with one of the three main parties, and 44% were ‘strong’ identifiers. Nevertheless even in the 1960s Butler and Stokes observed that vote switching was more often accompanied by a parallel shift of party identification in Britain than in the United States5. A voluminous literature in voting behavior developed around the topic and from the mid-1970s onwards the Michigan school came under increasing challenge. Panel studies monitoring the behavior of the same voters over successive elections in various countries, including in Canada, the Netherlands, Sweden, Japan, and Britain, commonly reported that party identification switched over successive elections in tandem with voting, as well as responding to short-term changes in material conditions and other preferences, rather than proving a stable, enduring anchor for electoral choices and political orientations6. If party identification and voting choices essentially co-varied as two sides of the same coin in Western Europe, representing the expression of current political preferences, then models explaining voting decisions which include party identification as an independent variable could prove circular, artificially inflating the impact of party identification on vote choice7. Others argued that the concept of party identification needed to be reinterpreted as it represented a running tally of party performance, and therefore a more rational orientation, rather than a simple affective sense of loyalty.8
But the most sustained and fundamental critique of the Michigan school came from accounts of societal modernization suggesting that, even if we accept the traditional concepts and measures, there is substantial evidence that traditional party loyalties - particularly strong attachments – have been gradually fraying in many advanced industrialized societies from the 1970s onwards, including in the United States. Social psychological theories of partisan dealignment make three major claims: (i) in postindustrial societies, many citizens no longer have a strong and stable affective identities anchoring them to political parties; (ii) as a result many voters have become more volatile in their electoral behavior and increasingly willing to desert the major parties, thereby producing erratic waves of support for minor parties; and also (iii) short-term factors have become more influential components in voting choice, including the impact of the outgoing government's policy record, party programs on the major issues of the day, the personal qualities and experience of political leaders and candidates, and the role of the mass media and campaigns. Dealignment theories suggest that in established democracies this development could have significant consequences for many aspects of voting behavior, by potentially boosting electoral volatility, the proportion of late-deciders and non-voters, split-ticket voting, as well as possibly reducing turnout and weakening beliefs about the legitimacy of the political process and trust in government9. At systemic level, with less ballast, a fall in partisanship could generate more unpredictable outcomes, strengthen the prospects for minor parties, further fractionalize party systems, and therefore complicate coalition building and the government formation process.
Considerable survey evidence has now accumulated that party attachments have eroded in many established democracies during the late twentieth century10, although heated debate continues about the causes and the consequences of this phenomenon. Less systematic research is available to make reliable comparisons with the strength of voter-party attachments in elections held in a wide range of newer transitional and consolidating democracies, although most studies suggest that stable party loyalties will take years or even decades to develop11. Schmitt and Holmberg developed one of the most comprehensive analyses of trends in the United States and Western Europe, based on national elections studies and the Eurobarometer from the mid-1960s until the early 1990s12. The authors were fairly cautious about drawing any sweeping conclusions from the data but they noted that a general decline of partisanship had occurred in many places, although they emphasized that the depth and spread of any partisan dealignment differed across countries and time. More recently, Dalton analyzed trends in national election studies conducted in nineteen advanced industrialized democracies from the mid-sixties to the late-nineties, excluding the ‘newer’ (third-wave) democracies of Spain, Portugal and Greece13. The study concluded that the proportion of party identifiers dropped across all advanced industrialized democracies under comparison, with a fall that was statistically robust in two-thirds of the nations. The significant erosion in the proportion of strong identifiers occurred in

ELECTORAL ENGINEERING ~ CHAPTER 6 3/10/2003 6:35 PM
3
all but three nations (Finland, the Netherlands, and Denmark). The similarity of trends across postindustrial democracies led Dalton to conclude that similar processes of modernization within these countries, particularly the effects of generational change and rising cognitive mobilization, had caused these developments: “In short, the process of cognitive mobilization has increased voter’s political sophistication and their ability to deal with the complexities of politics – and this may have decreased the functional need for partisanship among many better educated and politically involved citizens.” This assumes that partisan attachments function as an organizing device or perceptual prism for political evaluations, facilitating judgments about unfamiliar candidates and cueing attitudes towards new issues, a process thought particularly important for voting choice among less informed citizens. Cultural explanations of the strength of partisan identification typically focus at individual-level upon the social characteristics of voters, including levels of education and age, as well as stressing the linkages between partisanship and subsequent political attitudes and behavior, such as feelings of political efficacy, satisfaction with democracy, and propensity to vote.
Rational-choice institutionalism
The social psychological perspective emphasizes long-term processes of societal modernization affecting decision-making processes in the mass electorate. If there has been a weakening of party bonds, then the primary cause is believed to lie in secular trends such as growing levels of cognitive skills, the rise of the mass media, or generational shifts in post-material values and issue concerns. Yet ever since Downs, a substantial literature has provided an alternative understanding of the notion of partisan identification, where the role of political actors is regarded as critical, in particular how parties place themselves strategically when competing along the left-right ideological spectrum14. Schmitt and Holmberg exemplify this claim when they argue that the strength of partisanship lies in the hands of political actors more than in society15. If so, then we might expect to find considerable cross-national variations in the vitality of voter-party bonds, both within postindustrial societies, and also within the broader universe of electoral democracies, based on systematic features of electoral institutions and party systems. In this perspective, the strength of partisan attachments in different countries vary according to factors such as the extent of party competition and the degree of ideological polarization around divisive issues; the historical legacy of party systems including the continuity of older parties and the mobilization of new contestants; the performance of parties in government when serving the needs of their core supporters; the structure of party organizations and the strength of their linkages with affiliated associations like unions and churches; systematic organizational and ideological differences among party families such as the Greens, Communists and Social Democrats; the primary face-to-face and mediated channels of campaign communications; the basic type of electoral rules; and the overarching constitutional arrangements such as differences between presidential and parliamentary systems, as well as federal or unitary states.
Many of these explanations would take us far beyond the scope of this limited study but nevertheless we can examine some of the characteristics of parties and electoral systems that could plausibly be associated with strong partisanship. Rational choice institutionalism accounts suggest that political actors such as party leaders, campaign managers and parliamentary candidates respond to the electoral incentives present in their broader context, particularly to the logic of electoral rules and party competition. Strong party-voter linkages and affective loyalties are commonly regarded as an electoral advantage for parties, by helping to mobilize support and to provide a cushion of true believers in good times and bad. Yet under majoritarian rules parties have a strong incentive to develop bridging appeals in order to meet higher electoral thresholds to office. In this context they may decide to advocate broad and diffuse ideological positions, to adopt consensual issue stances, and to stress their competence at managing government, in the attempt to maximize their support across all groups in the electorate even if they calculate that this strategy comes at the cost of some erosion of their core party identifiers. By contrast, under proportional rules parties can get elected to office with a lower share of the vote and in this context they have a stronger incentive to adopt bonding appeals based on their core issues and party image, as an economical way of mobilizing their own party identifiers. Where political actors
ELECTORAL ENGINEERING ~ CHAPTER 6 3/10/2003 6:35 PM
4
focus upon partisan appeals this process, in turn, is thought to have an indirect influence upon the enduring potency of party-voter attachments among the mass public16.
II: The Strength of Partisan Identification Comparing voting behavior in many countries allows us to test these theories although
we immediately encounter debates about the best measurement of partisan identities17. The standard question on partisanship, carried since 1952 in the American National Election Study and in many subsequent election studies elsewhere, has traditionally asked: "Generally speaking, do you usually think of yourself as a Republican, a Democrat, an Independent, or what?" The follow-up items then probe for the strength of any partisanship18. The phrase ‘usually’ is thought to prompt respondents to consider long-term orientations beyond voting in the particular election. By contrast, the core concept of partisan identification that we can compare from the CSES survey was measured by the following questions:
(i) [Party identification] “Do you usually think of yourself as close to any particular political party?” (A3004)
(ii) [Direction] If ‘yes’, “Which party is that?” [A3005_1]
(iii) [Strength] “Do you feel very close to this [party/party block], somewhat close, or not very close?” (A3012)
The key difference is that the first question in the CSES battery does not carry any cues referring to specific parties, unlike the standard items carried in the NES and many other national election studies. The choice of wording could be important, as direct comparison across items in the NES and BES suggests that the CSES version generates significantly lower numbers of partisans than the ‘cued’ question. Nevertheless the essential point for cross-national analysis is the consistency of the item used across different election studies, to generate reliable comparisons. The first part of the battery was carried in all the national election studies contained in the dataset.
[Figure 6.1 about here]
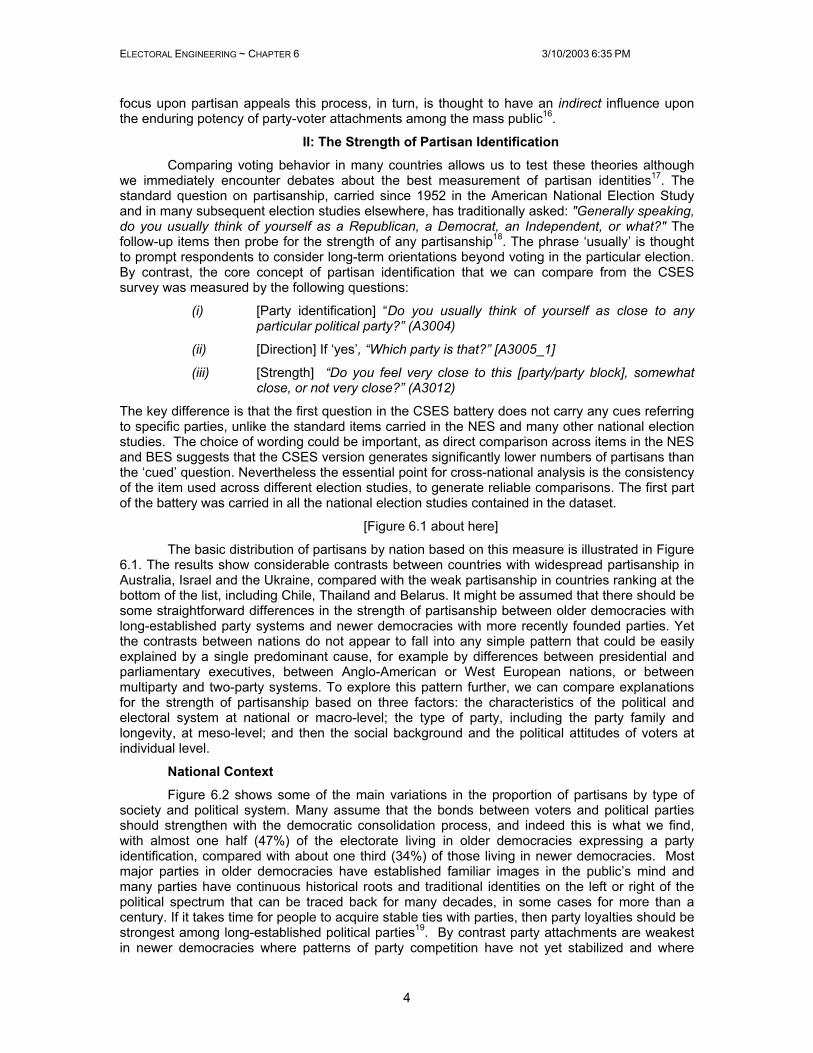
The basic distribution of partisans by nation based on this measure is illustrated in Figure 6.1. The results show considerable contrasts between countries with widespread partisanship in Australia, Israel and the Ukraine, compared with the weak partisanship in countries ranking at the bottom of the list, including Chile, Thailand and Belarus. It might be assumed that there should be some straightforward differences in the strength of partisanship between older democracies with long-established party systems and newer democracies with more recently founded parties. Yet the contrasts between nations do not appear to fall into any simple pattern that could be easily explained by a single predominant cause, for example by differences between presidential and parliamentary executives, between Anglo-American or West European nations, or between multiparty and two-party systems. To explore this pattern further, we can compare explanations for the strength of partisanship based on three factors: the characteristics of the political and electoral system at national or macro-level; the type of party, including the party family and longevity, at meso-level; and then the social background and the political attitudes of voters at individual level.
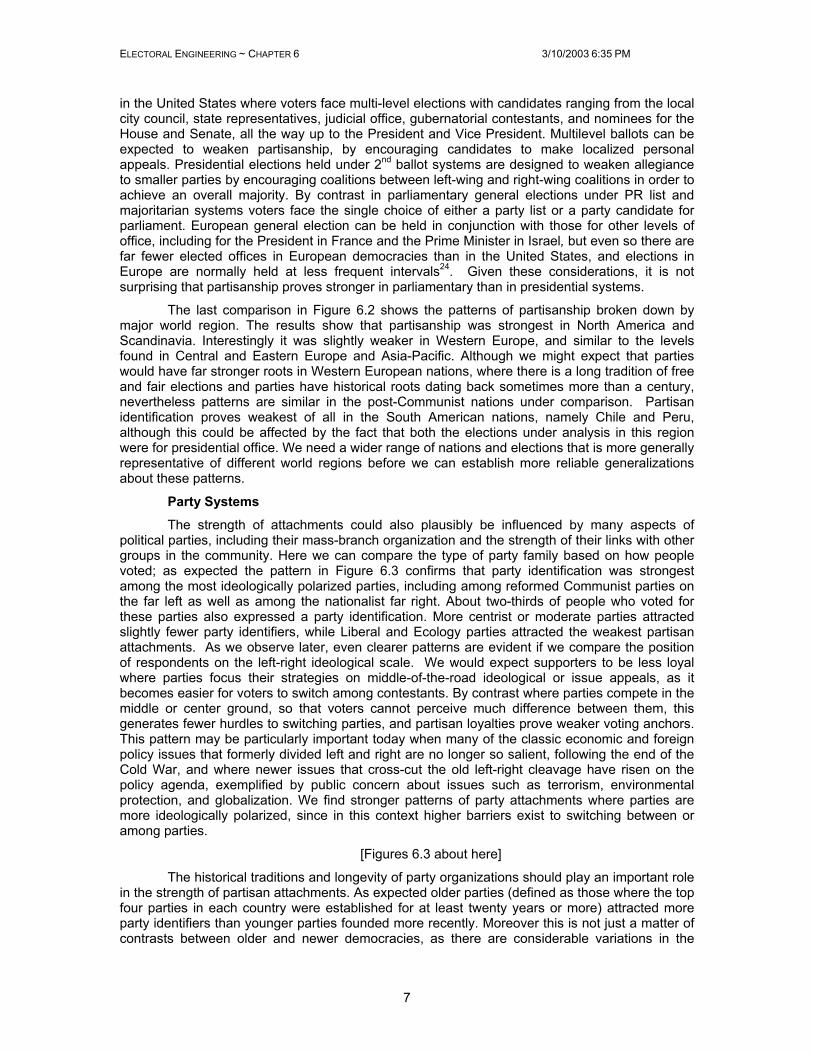
National Context Figure 6.2 shows some of the main variations in the proportion of partisans by type of
society and political system. Many assume that the bonds between voters and political parties should strengthen with the democratic consolidation process, and indeed this is what we find, with almost one half (47%) of the electorate living in older democracies expressing a party identification, compared with about one third (34%) of those living in newer democracies. Most major parties in older democracies have established familiar images in the public’s mind and many parties have continuous historical roots and traditional identities on the left or right of the political spectrum that can be traced back for many decades, in some cases for more than a century. If it takes time for people to acquire stable ties with parties, then party loyalties should be strongest among long-established political parties19. By contrast party attachments are weakest in newer democracies where patterns of party competition have not yet stabilized and where

ELECTORAL ENGINEERING ~ CHAPTER 6 3/10/2003 6:35 PM
5
party discipline in parliament remains loose, where party images are fluid, where mass-branch party organizations are under-developed, where parties remain personalistic rather than based on programmatic differences in policy manifestos, and where voters have not yet acquired a lifetime’s habit of party support reinforced over successive elections20. Party systems have often failed to institutionalize in many newer electoral democracies in Latin America and Asia. Given the strong link between socioeconomic and political development in the countries under comparison in the CSES data, not surprisingly similar patterns of partisanship were evident in the gap between postindustrial and industrial societies.
[Figure 6.2 about here]
The electoral system may also have an important influence upon patterns of partisanship. As discussed in detail in chapter 8, in election campaigns, candidates can choose to focus on personal appeals, including their record in the delivery of public services to their local district, as well individual leadership qualities such as their background and experience, to become well known and to develop a personal reputation. Alternatively they can decide to stress party appeals such as the collective party record, policy program and leadership team. If electoral prospects depend upon winning votes cast for the individual politician instead of, or in addition to, votes cast for the party, then politicians face a trade-off between the value of personal and party reputation. In extremely candidate-centered systems, the personal appeal of particular local politicians can be expected to influence the calculus of voters’ decisions more strongly than general party labels. In legislative elections, we theorize that the electoral incentive for candidates to emphasize party labels or to emphasize personalistic appeals varies according to the ballot structure:21
(i) The highest incentives to stress personal appeals comes from candidate-ballots: used in single-member districts with plurality elections such as those used for the US Congress and UK House of Commons.
(ii) A moderate incentive to stress personal appeals comes from preferential ballots: used in open party list PR systems allowing preferential voting where voters can rank their ballot choices from among candidates within the same party, such as that used in Brazil and Belgium. Preferential ballots are also used in multimember constituencies with low district magnitude where candidates compete for popular votes with others from within their own party, exemplified by the Single Transferable Vote in Ireland and the Single Non-Transferable Vote used for some districts in Taiwan.
(iii) Under dual-ballots, there are mixed incentives, as used in combined systems where electors can express their preferences through some mix of candidate and preferential or party ballots.
(iv) Lastly politicians have the greatest incentive to emphasize their collective record in the context of party-ballots, used in proportional electoral systems with closed party lists, such as in Norway, the Netherlands and Romania. In these contests, all parliamentary candidates on the ticket win or fail together, as votes are pooled, and voters are unable to determine which particular members are elected from the party list.
This argument assumes that campaigns reflect the type of electoral rewards facing vote-seeking politicians, and also that the public will recognize and respond to the type of electoral appeals made by political actors.
The type of candidate selection process is also believed to be important to the type of strategies that candidate will emphasize, since this process determines which applicants succeed in becoming adopted as official parliamentary candidates for each party. Parties can be classified according to the degree of centralization of the selection process, ranging from the most open systems determined mainly by voters, such as the Canadian Conservatives or the US Democrats, to the most closed systems determined mainly by party leaders, exemplified until recently by the Mexican PRI or by Berlosconi’s Forza Italia. Between these poles, a range of political actors may

ELECTORAL ENGINEERING ~ CHAPTER 6 3/10/2003 6:35 PM
6
play a role: including party members, local delegates, factions, and affiliated groups, and regional party leaders, as well as external gatekeepers such as financial donors, local notables, and journalists22. Extremely party-centered systems combine closed PR lists, so that voters can only choose from among parties, with nomination processes where party candidates are determined by the party leadership. In such circumstances, parliamentary candidates have no incentive to engage in any real campaigning beyond lending their name to the party list. At the opposite pole, extremely candidate-centered system combine open voter primaries determining party nominees with open-list PR. Most systems fall somewhere between these polar extremes. In all these regards, electoral systems, nomination processes and parties can be expected to influence whether elections foster strong or weak party-voter linkages in the mass electorate. According to this account, therefore, party-voter bonds should prove strongest within closed list PR systems while they should prove weakest within open list PR systems.
We cannot compare all aspects of this theory, since there is no way of classifying the process of candidate selection used by each party in the countries under comparison on any systematic basis. This process can vary substantially among parties even within a country, and in most cases it remains a ‘black box’ where we have more information about the formal rules than the informal procedures and norms guiding the outcome23. Nevertheless we can compare the strength of partisanship among the basic types of electoral system and ballot structures that we have already classified.
The results of the comparison in Figure 6.2 shows some modest support for this proposition: 46% of those voting in party-ballots had a partisan identification compared with 42% of those voting with preferential-ballots. Nevertheless it must be stressed that this difference, while statistically significant, remains extremely modest. Moreover, contrary to the theory, those voting with candidate-ballots displayed by far the strongest partisanship, as 57% expressed a party identification. Further analysis with a much wider range of countries would be necessary to explore this relationship further, including classifying the degree of centralization of the party recruitment process, but the initial evidence presented here provides limited or indeed contradictory support for claim that the strength of partisan identification varies systematically according to the ballot structure. Later chapters explore how far the ballot structure influences other characteristics of the electorate, such as their knowledge of candidates and their contact with elected members.
Presidential v. parliamentary executives
The basic type of parliamentary or presidential executive is another factor that could influence the strength of party-voter attachments. The results confirm that partisanship is strongest in legislative general elections, where 43% expressed a partisan identity, partisanship is slightly weaker in elections combining legislative and executive contests, and it is weakest of all in presidential elections, where only one third expressed a party identity. In parliamentary systems, where the legislature determines the executive, and maintains the prime minister in office, then we would expect party cohesion to be important as all members win or lose together. If the prime minister fails to win a vote of confidence in parliament, then the government falls, and either the leader of the opposition attempts to form an administration with a working majority, or parliament is dissolved and all representatives have to fight an election campaign. All elected politicians in the governing party or parties have a high incentive to maintain party unity in parliamentary systems or they face the threat of potential electoral defeat. In presidential systems with strong party discipline, where the party leader can play an important role in the selection of parliamentary candidates, the presidential nominee can campaign with a unified platform and coherent set of policies. In presidential systems with weaker party discipline, however, legislative candidates may distance themselves from an unpopular incumbent at the head of the ticket, and indeed from others within their own party or from incumbent politicians as a class, by focusing strategic campaigns upon local issues and their personal record of constituency service.
More detailed aspects of the ballot structure may also play an important direct role by influencing voters’ decision-making processes. In presidential systems electors have the option of splitting their vote for different levels of office. This complexity of choices is illustrated most clearly
ELECTORAL ENGINEERING ~ CHAPTER 6 3/10/2003 6:35 PM
7
in the United States where voters face multi-level elections with candidates ranging from the local city council, state representatives, judicial office, gubernatorial contestants, and nominees for the House and Senate, all the way up to the President and Vice President. Multilevel ballots can be expected to weaken partisanship, by encouraging candidates to make localized personal appeals. Presidential elections held under 2nd ballot systems are designed to weaken allegiance to smaller parties by encouraging coalitions between left-wing and right-wing coalitions in order to achieve an overall majority. By contrast in parliamentary general elections under PR list and majoritarian systems voters face the single choice of either a party list or a party candidate for parliament. European general election can be held in conjunction with those for other levels of office, including for the President in France and the Prime Minister in Israel, but even so there are far fewer elected offices in European democracies than in the United States, and elections in Europe are normally held at less frequent intervals24. Given these considerations, it is not surprising that partisanship proves stronger in parliamentary than in presidential systems.
The last comparison in Figure 6.2 shows the patterns of partisanship broken down by major world region. The results show that partisanship was strongest in North America and Scandinavia. Interestingly it was slightly weaker in Western Europe, and similar to the levels found in Central and Eastern Europe and Asia-Pacific. Although we might expect that parties would have far stronger roots in Western European nations, where there is a long tradition of free and fair elections and parties have historical roots dating back sometimes more than a century, nevertheless patterns are similar in the post-Communist nations under comparison. Partisan identification proves weakest of all in the South American nations, namely Chile and Peru, although this could be affected by the fact that both the elections under analysis in this region were for presidential office. We need a wider range of nations and elections that is more generally representative of different world regions before we can establish more reliable generalizations about these patterns.
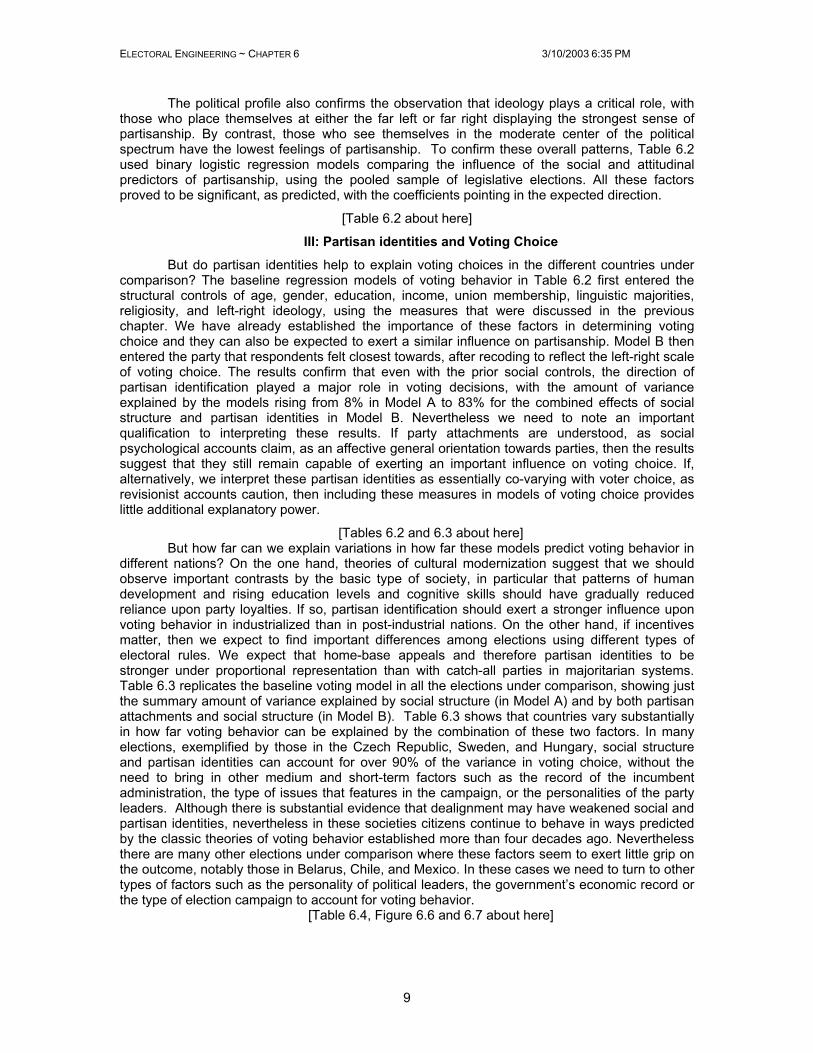
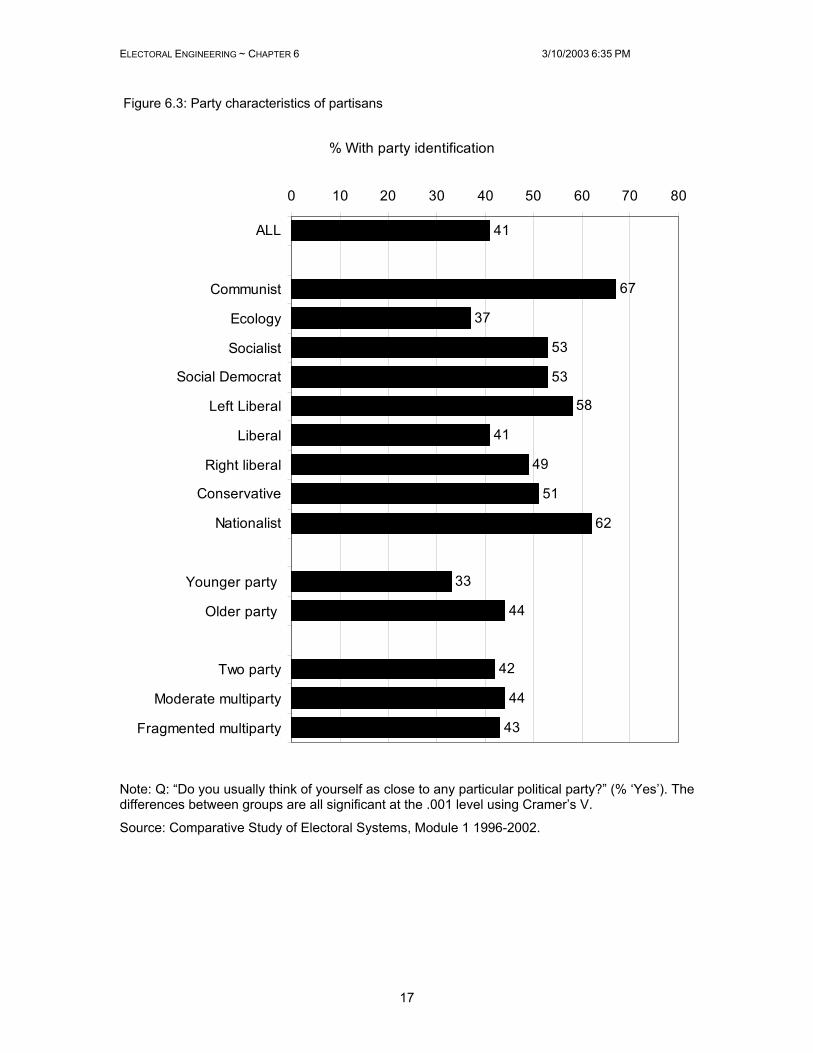
Party Systems The strength of attachments could also plausibly be influenced by many aspects of
political parties, including their mass-branch organization and the strength of their links with other groups in the community. Here we can compare the type of party family based on how people voted; as expected the pattern in Figure 6.3 confirms that party identification was strongest among the most ideologically polarized parties, including among reformed Communist parties on the far left as well as among the nationalist far right. About two-thirds of people who voted for these parties also expressed a party identification. More centrist or moderate parties attracted slightly fewer party identifiers, while Liberal and Ecology parties attracted the weakest partisan attachments. As we observe later, even clearer patterns are evident if we compare the position of respondents on the left-right ideological scale. We would expect supporters to be less loyal where parties focus their strategies on middle-of-the-road ideological or issue appeals, as it becomes easier for voters to switch among contestants. By contrast where parties compete in the middle or center ground, so that voters cannot perceive much difference between them, this generates fewer hurdles to switching parties, and partisan loyalties prove weaker voting anchors. This pattern may be particularly important today when many of the classic economic and foreign policy issues that formerly divided left and right are no longer so salient, following the end of the Cold War, and where newer issues that cross-cut the old left-right cleavage have risen on the policy agenda, exemplified by public concern about issues such as terrorism, environmental protection, and globalization. We find stronger patterns of party attachments where parties are more ideologically polarized, since in this context higher barriers exist to switching between or among parties.
[Figures 6.3 about here]
The historical traditions and longevity of party organizations should play an important role in the strength of partisan attachments. As expected older parties (defined as those where the top four parties in each country were established for at least twenty years or more) attracted more party identifiers than younger parties founded more recently. Moreover this is not just a matter of contrasts between older and newer democracies, as there are considerable variations in the

ELECTORAL ENGINEERING ~ CHAPTER 6 3/10/2003 6:35 PM
8
longevity of parties, even within Western Europe and North America. Although there have been major changes in the composition of American parties, their basic identities and labels remain some of the oldest in the world. Elsewhere party systems have usually seen far greater innovations, exemplified by developments in the Netherlands, Belgium, or Canada, with older parties occasionally fading away or splitting into different factions, and newer parties emerging into prominence.
Party competition could also play a role and, as discussed earlier in chapter 4, the effective number of parliamentary parties varies substantially in the countries under comparisons. Yet the pattern in Figure 6.3 shows that by itself the type of party system did now show a substantial difference in the strength of partisan attachments.
Social Structure and Partisanship Social psychological accounts suggest many reasons why the strength of partisanship
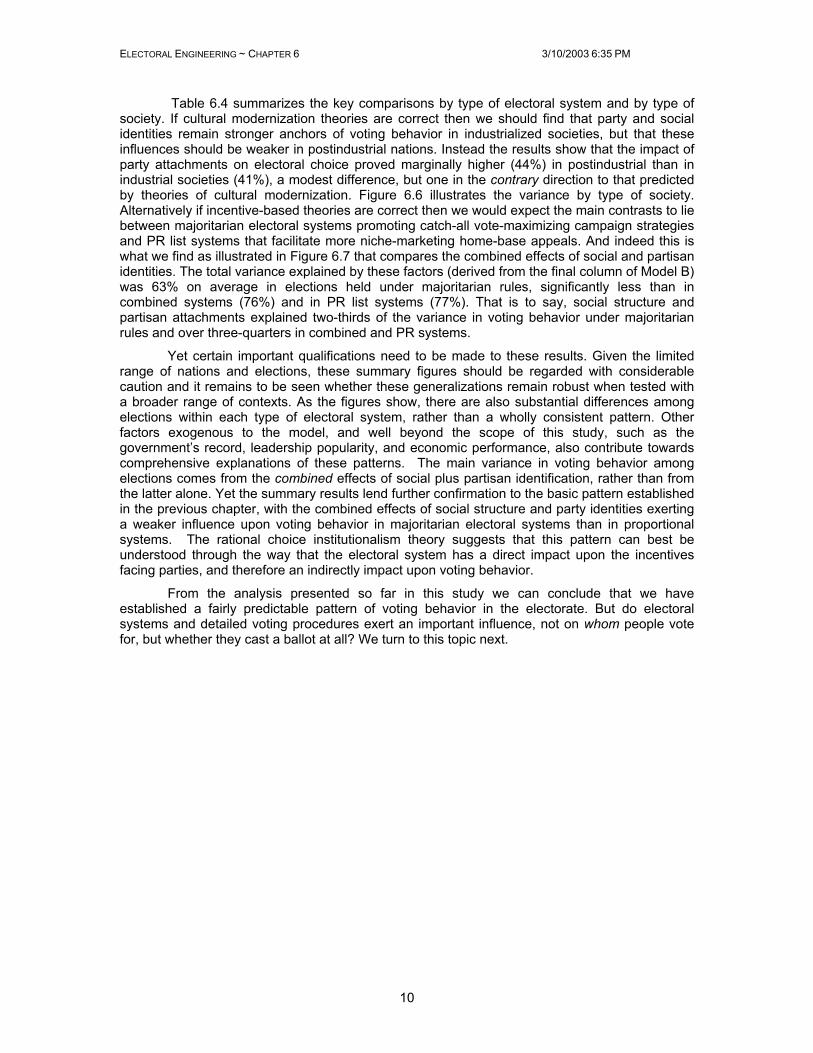
should vary according to the social and political characteristics of citizens. In particular, Dalton argues that we would expect partisanship to play the strongest role in voting decisions among the least educated and politically informed groups, who lack cognitive skills and therefore have most need to rely upon partisan shortcuts25. Since education is closely related to other indicators of socioeconomic status, partisanship should also be associated with patterns of social class and household income. If habits develop over time, we would also expect that partisanship should be least developed among the younger generation of citizens, and these attachments are expected to strengthen with age, as many previous studies have found26. Voter-party bonds are also expected to be stronger among those who belong to voluntary organizations and community associations, such as trade unions and churches, if social networks and membership of these organizations functions to reinforce political attitudes among like-minded groups. Identification with a particular party should also be stronger among those who hold positive orientations towards parties in general.
[Figure 6.4 about here]
The patterns evident in Figure 6.4 show that partisanship was indeed stronger by age group, as expected, with a substantial 15-point gap between the youngest cohort and those over sixty. Partisanship was also more advanced among those with ties to affiliated organizations such as unions and churches. But contrary to Dalton’s suggestions, partisan attachments were stronger among the well-educated, as well as among the highest income and class groups, and among those who scored highest on political knowledge tests (although this latter association could be interpreted as the product of partisanship, if party ties generate greater interest in public affairs, as much as its cause). Partisan ties were also slightly stronger among men than women. What this social profile suggests is that general party loyalties tend to reflect the type of characteristics that also predict more active engagement in parties as members or as activists27. In this regard, it might be more appropriate to understand partisanship as an orientation similar to political participation, so that a similar range of factors predict whether someone is close to a party and whether they will vote.
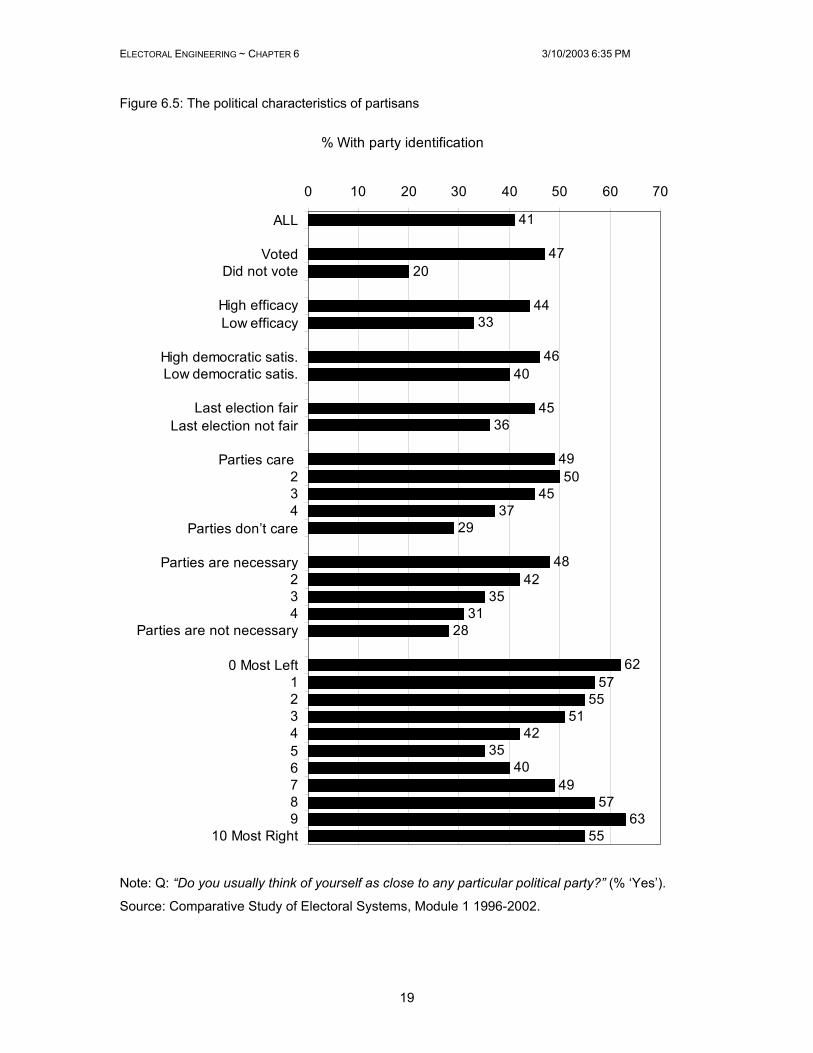
Political Attitudes and Partisanship The political characteristics in Figure 6.5 confirm the patterns that many others have noted, with partisanship associated with many indicators of system support, although here the question of the direction of causality is open to interpretation. A sense of closeness to a particular party could lead people to be more likely to participate, to have a sense of efficacy and the belief they can influence the political process, and to display greater satisfaction both with democracy in general and with the fairness of the electoral process. Alternatively those who display these characteristics are also more likely to feel close to one of the parties, as this is another form of positive engagement with the political process. Probably a reciprocal process is at work here that cannot be disentangled without either time-series panel surveys or careful experimental designs.
[Figure 6.5 about here]
ELECTORAL ENGINEERING ~ CHAPTER 6 3/10/2003 6:35 PM
9
The political profile also confirms the observation that ideology plays a critical role, with those who place themselves at either the far left or far right displaying the strongest sense of partisanship. By contrast, those who see themselves in the moderate center of the political spectrum have the lowest feelings of partisanship. To confirm these overall patterns, Table 6.2 used binary logistic regression models comparing the influence of the social and attitudinal predictors of partisanship, using the pooled sample of legislative elections. All these factors proved to be significant, as predicted, with the coefficients pointing in the expected direction.
[Table 6.2 about here]
III: Partisan identities and Voting Choice But do partisan identities help to explain voting choices in the different countries under
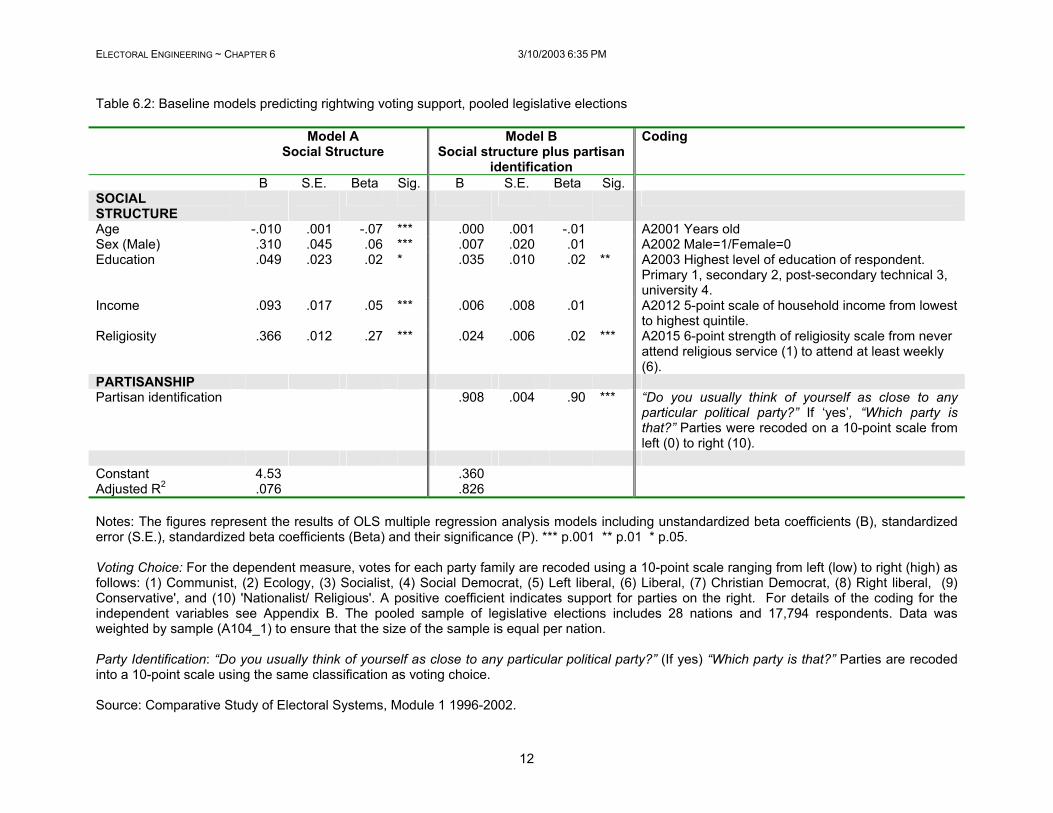
comparison? The baseline regression models of voting behavior in Table 6.2 first entered the structural controls of age, gender, education, income, union membership, linguistic majorities, religiosity, and left-right ideology, using the measures that were discussed in the previous chapter. We have already established the importance of these factors in determining voting choice and they can also be expected to exert a similar influence on partisanship. Model B then entered the party that respondents felt closest towards, after recoding to reflect the left-right scale of voting choice. The results confirm that even with the prior social controls, the direction of partisan identification played a major role in voting decisions, with the amount of variance explained by the models rising from 8% in Model A to 83% for the combined effects of social structure and partisan identities in Model B. Nevertheless we need to note an important qualification to interpreting these results. If party attachments are understood, as social psychological accounts claim, as an affective general orientation towards parties, then the results suggest that they still remain capable of exerting an important influence on voting choice. If, alternatively, we interpret these partisan identities as essentially co-varying with voter choice, as revisionist accounts caution, then including these measures in models of voting choice provides little additional explanatory power.
[Tables 6.2 and 6.3 about here] But how far can we explain variations in how far these models predict voting behavior in
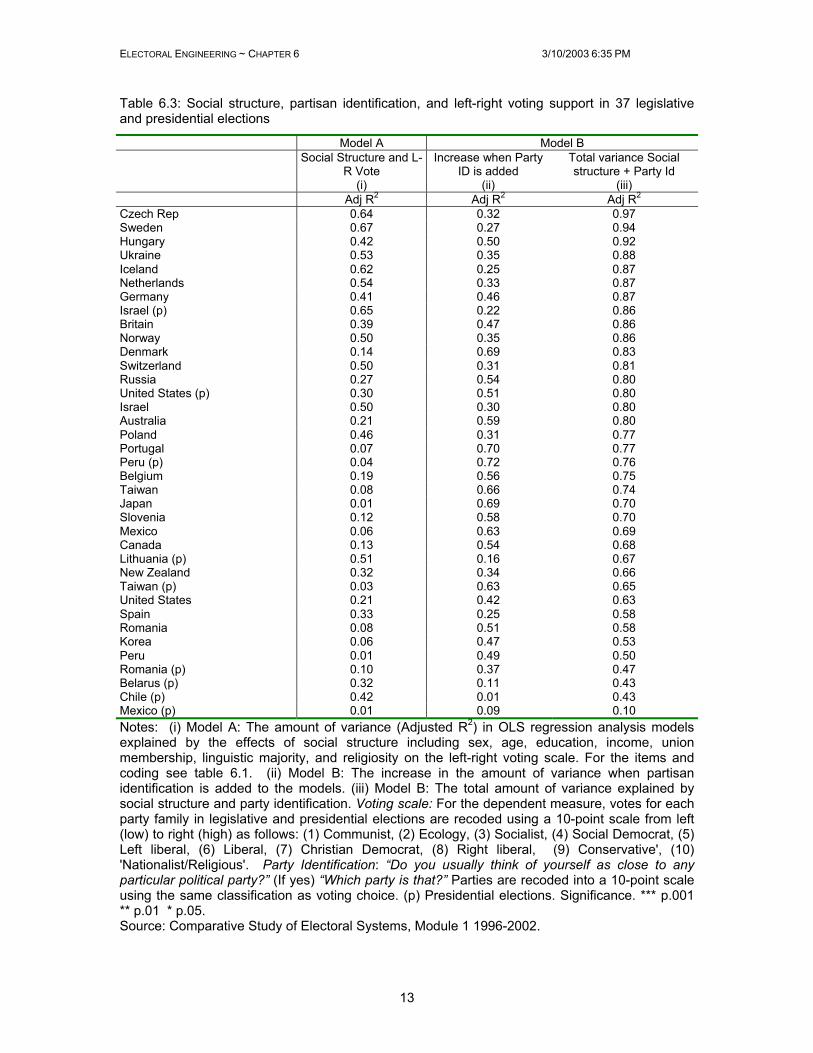
different nations? On the one hand, theories of cultural modernization suggest that we should observe important contrasts by the basic type of society, in particular that patterns of human development and rising education levels and cognitive skills should have gradually reduced reliance upon party loyalties. If so, partisan identification should exert a stronger influence upon voting behavior in industrialized than in post-industrial nations. On the other hand, if incentives matter, then we expect to find important differences among elections using different types of electoral rules. We expect that home-base appeals and therefore partisan identities to be stronger under proportional representation than with catch-all parties in majoritarian systems. Table 6.3 replicates the baseline voting model in all the elections under comparison, showing just the summary amount of variance explained by social structure (in Model A) and by both partisan attachments and social structure (in Model B). Table 6.3 shows that countries vary substantially in how far voting behavior can be explained by the combination of these two factors. In many elections, exemplified by those in the Czech Republic, Sweden, and Hungary, social structure and partisan identities can account for over 90% of the variance in voting choice, without the need to bring in other medium and short-term factors such as the record of the incumbent administration, the type of issues that features in the campaign, or the personalities of the party leaders. Although there is substantial evidence that dealignment may have weakened social and partisan identities, nevertheless in these societies citizens continue to behave in ways predicted by the classic theories of voting behavior established more than four decades ago. Nevertheless there are many other elections under comparison where these factors seem to exert little grip on the outcome, notably those in Belarus, Chile, and Mexico. In these cases we need to turn to other types of factors such as the personality of political leaders, the government’s economic record or the type of election campaign to account for voting behavior.
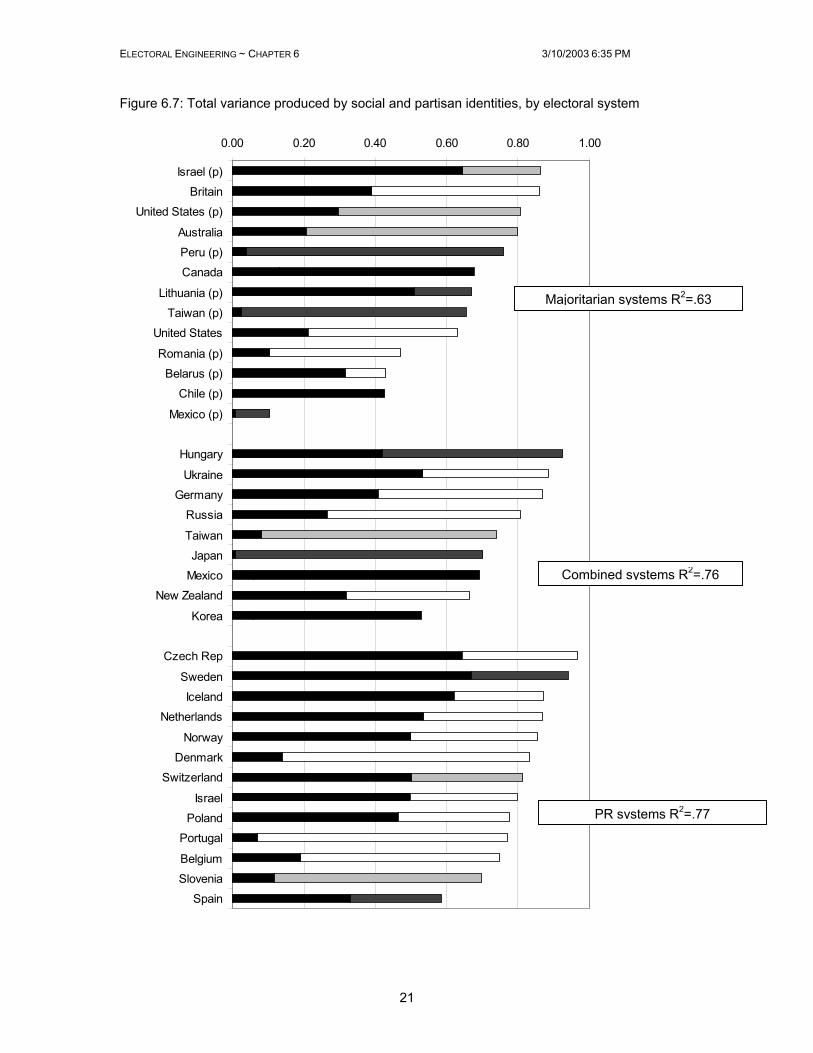
[Table 6.4, Figure 6.6 and 6.7 about here]
ELECTORAL ENGINEERING ~ CHAPTER 6 3/10/2003 6:35 PM
10
Table 6.4 summarizes the key comparisons by type of electoral system and by type of society. If cultural modernization theories are correct then we should find that party and social identities remain stronger anchors of voting behavior in industrialized societies, but that these influences should be weaker in postindustrial nations. Instead the results show that the impact of party attachments on electoral choice proved marginally higher (44%) in postindustrial than in industrial societies (41%), a modest difference, but one in the contrary direction to that predicted by theories of cultural modernization. Figure 6.6 illustrates the variance by type of society. Alternatively if incentive-based theories are correct then we would expect the main contrasts to lie between majoritarian electoral systems promoting catch-all vote-maximizing campaign strategies and PR list systems that facilitate more niche-marketing home-base appeals. And indeed this is what we find as illustrated in Figure 6.7 that compares the combined effects of social and partisan identities. The total variance explained by these factors (derived from the final column of Model B) was 63% on average in elections held under majoritarian rules, significantly less than in combined systems (76%) and in PR list systems (77%). That is to say, social structure and partisan attachments explained two-thirds of the variance in voting behavior under majoritarian rules and over three-quarters in combined and PR systems.
Yet certain important qualifications need to be made to these results. Given the limited range of nations and elections, these summary figures should be regarded with considerable caution and it remains to be seen whether these generalizations remain robust when tested with a broader range of contexts. As the figures show, there are also substantial differences among elections within each type of electoral system, rather than a wholly consistent pattern. Other factors exogenous to the model, and well beyond the scope of this study, such as the government’s record, leadership popularity, and economic performance, also contribute towards comprehensive explanations of these patterns. The main variance in voting behavior among elections comes from the combined effects of social plus partisan identification, rather than from the latter alone. Yet the summary results lend further confirmation to the basic pattern established in the previous chapter, with the combined effects of social structure and party identities exerting a weaker influence upon voting behavior in majoritarian electoral systems than in proportional systems. The rational choice institutionalism theory suggests that this pattern can best be understood through the way that the electoral system has a direct impact upon the incentives facing parties, and therefore an indirectly impact upon voting behavior.
From the analysis presented so far in this study we can conclude that we have established a fairly predictable pattern of voting behavior in the electorate. But do electoral systems and detailed voting procedures exert an important influence, not on whom people vote for, but whether they cast a ballot at all? We turn to this topic next.

ELECTORAL ENGINEERING ~ CHAPTER 6 3/10/2003 6:35 PM
11
Table 6.1: Baseline models predicting partisanship, pooled legislative elections Model A
Social structure Model C
Plus political attitudes
Coding
B S.E. Sig. B SE Sig SOCIAL STRUCTURE Age .01 .001 *** .01 .001 *** A2001 Years old Sex (Male) .11 .025 *** .11 .026 *** A2002 Male=1/Female=0 Education .17 .013 *** .17 .013 *** A2003 Highest level of education of respondent. Primary 1, secondary
2, post-secondary technical 3, university 4. Income .05 .010 *** .06 .010 *** A2012 5-point scale of household income from lowest to highest
quintile. Union member .15 .028 *** .14 .026 *** A2005 Respondent is union member 1, else 0 Linguistic majority .56 .025 *** .58 .007 *** A2018 Language usually spoken at home. Linguistic majority 1, else 0 Religiosity .10 .007 *** .09 .011 *** A2015 6-point strength of religiosity scale from never attend religious
service (1) to attend at least weekly (6). PARTISAN ATTITUDES Parties care .17 .012 *** “Political parties in [country] care what ordinary people think.” % Agree Parties necessary .13 .009 *** “Political parties are necessary to make our political system work in
[country].” % Agree Ideological extremism .27 .091 *** A3031 Position respondents placed themselves on the 10-point left-
right scale, recoded from moderate center (1) to extreme (5). Constant -2.0 -3.7 % Correctly predicted 59% 63% Proportion of cases correctly predicted by the model Nagelkerke R2 .06 .13 Overall variance explained by the model Notes: The figures represent the results of binary logistic regression models including unstandardized beta coefficients (B), standardized error (S.E.), and their significance (Sig). *** p.001 ** p.01 * p.05. Partisan identity: The dependent variable is coded from the following item: “Do you usually think of yourself as close to any particular political party?” For details of the coding for the independent variables see Appendix B. The pooled sample of legislative elections includes 28 nations and 31124 respondents. Data was weighted by sample (A104_1) to ensure that the size of the sample is equal per nation. Source: Comparative Study of Electoral Systems, Module 1 1996-2002.
ELECTORAL ENGINEERING ~ CHAPTER 6 3/10/2003 6:35 PM
12
Table 6.2: Baseline models predicting rightwing voting support, pooled legislative elections Model A
Social Structure Model B
Social structure plus partisan identification
Coding
B S.E. Beta Sig. B S.E. Beta Sig. SOCIAL STRUCTURE
Age -.010 .001 -.07 *** .000 .001 -.01 A2001 Years old Sex (Male) .310 .045 .06 *** .007 .020 .01 A2002 Male=1/Female=0 Education .049 .023 .02 * .035 .010 .02 ** A2003 Highest level of education of respondent.
Primary 1, secondary 2, post-secondary technical 3, university 4.
Income .093 .017 .05 *** .006 .008 .01 A2012 5-point scale of household income from lowest to highest quintile.
Religiosity .366 .012 .27 *** .024 .006 .02 *** A2015 6-point strength of religiosity scale from never attend religious service (1) to attend at least weekly (6).
PARTISANSHIP Partisan identification .908 .004 .90 *** “Do you usually think of yourself as close to any
particular political party?” If ‘yes’, “Which party is that?” Parties were recoded on a 10-point scale from left (0) to right (10).
Constant 4.53 .360 Adjusted R2 .076 .826 Notes: The figures represent the results of OLS multiple regression analysis models including unstandardized beta coefficients (B), standardized error (S.E.), standardized beta coefficients (Beta) and their significance (P). *** p.001 ** p.01 * p.05. Voting Choice: For the dependent measure, votes for each party family are recoded using a 10-point scale ranging from left (low) to right (high) as follows: (1) Communist, (2) Ecology, (3) Socialist, (4) Social Democrat, (5) Left liberal, (6) Liberal, (7) Christian Democrat, (8) Right liberal, (9) Conservative', and (10) 'Nationalist/ Religious'. A positive coefficient indicates support for parties on the right. For details of the coding for the independent variables see Appendix B. The pooled sample of legislative elections includes 28 nations and 17,794 respondents. Data was weighted by sample (A104_1) to ensure that the size of the sample is equal per nation. Party Identification: “Do you usually think of yourself as close to any particular political party?” (If yes) “Which party is that?” Parties are recoded into a 10-point scale using the same classification as voting choice. Source: Comparative Study of Electoral Systems, Module 1 1996-2002.
ELECTORAL ENGINEERING ~ CHAPTER 6 3/10/2003 6:35 PM
13
Table 6.3: Social structure, partisan identification, and left-right voting support in 37 legislative and presidential elections
Model A Model B Social Structure and L-
R Vote (i)
Increase when Party ID is added
(ii)
Total variance Social structure + Party Id
(iii) Adj R2 Adj R2 Adj R2 Czech Rep 0.64 0.32 0.97 Sweden 0.67 0.27 0.94 Hungary 0.42 0.50 0.92 Ukraine 0.53 0.35 0.88 Iceland 0.62 0.25 0.87 Netherlands 0.54 0.33 0.87 Germany 0.41 0.46 0.87 Israel (p) 0.65 0.22 0.86 Britain 0.39 0.47 0.86 Norway 0.50 0.35 0.86 Denmark 0.14 0.69 0.83 Switzerland 0.50 0.31 0.81 Russia 0.27 0.54 0.80 United States (p) 0.30 0.51 0.80 Israel 0.50 0.30 0.80 Australia 0.21 0.59 0.80 Poland 0.46 0.31 0.77 Portugal 0.07 0.70 0.77 Peru (p) 0.04 0.72 0.76 Belgium 0.19 0.56 0.75 Taiwan 0.08 0.66 0.74 Japan 0.01 0.69 0.70 Slovenia 0.12 0.58 0.70 Mexico 0.06 0.63 0.69 Canada 0.13 0.54 0.68 Lithuania (p) 0.51 0.16 0.67 New Zealand 0.32 0.34 0.66 Taiwan (p) 0.03 0.63 0.65 United States 0.21 0.42 0.63 Spain 0.33 0.25 0.58 Romania 0.08 0.51 0.58 Korea 0.06 0.47 0.53 Peru 0.01 0.49 0.50 Romania (p) 0.10 0.37 0.47 Belarus (p) 0.32 0.11 0.43 Chile (p) 0.42 0.01 0.43 Mexico (p) 0.01 0.09 0.10 Notes: (i) Model A: The amount of variance (Adjusted R2) in OLS regression analysis models explained by the effects of social structure including sex, age, education, income, union membership, linguistic majority, and religiosity on the left-right voting scale. For the items and coding see table 6.1. (ii) Model B: The increase in the amount of variance when partisan identification is added to the models. (iii) Model B: The total amount of variance explained by social structure and party identification. Voting scale: For the dependent measure, votes for each party family in legislative and presidential elections are recoded using a 10-point scale from left (low) to right (high) as follows: (1) Communist, (2) Ecology, (3) Socialist, (4) Social Democrat, (5) Left liberal, (6) Liberal, (7) Christian Democrat, (8) Right liberal, (9) Conservative', (10) 'Nationalist/Religious'. Party Identification: “Do you usually think of yourself as close to any particular political party?” (If yes) “Which party is that?” Parties are recoded into a 10-point scale using the same classification as voting choice. (p) Presidential elections. Significance. *** p.001 ** p.01 * p.05. Source: Comparative Study of Electoral Systems, Module 1 1996-2002.

ELECTORAL ENGINEERING ~ CHAPTER 6 3/10/2003 6:35 PM
14
Table 6.4: Mean variance in voting behavior explained by social structure and party identities
Model A Model B Social Structure
(%) (i)
Party identification (%)
(ii)
Total combined social structure
and party (%) (iii)
Number of elections
(N)
Cultural Modernization Postindustrial 33 44 77 20 Industrial 24 41 65 17 Electoral System Majoritarian 25 37 63 13 Combined 24 52 76 9 PR 36 41 77 15 Note: Calculated from Tables 5.2 and 6.3 in 37 legislative and presidential elections. (i) Model A: The amount of variance on the left-right voting scale (Adjusted R2) in OLS regression analysis models explained by the effects of social structure including sex, age, education, income, union membership, linguistic majority, and religiosity. (ii) Model B: The increase in the amount of variance in voting behavior when partisan identification is added to the models. (iii) Model B: The total amount of variance in voting behavior explained by the combined effects of social structure and party identification. Source: Comparative Study of Electoral Systems, Module 1 1996-2002.

ELECTORAL ENGINEERING ~ CHAPTER 6 3/10/2003 6:35 PM
15
Figure 6.1: Proportion of partisans by nation
814
2020
2223
2831
3235363737
4243
4445464747484849495151525354
5963
81
0 10 20 30 40 50 60 70 80 90
BelarusThailand
ChileSlovenia
PeruKorea Rep
NetherlandsLithuania
TaiwanHungary
GermanySwitzerland
JapanSpain
BelgiumRomania
Czech RepBritain
SwedenPortugal
MexicoPoland
DenmarkCanadaIceland
New ZealandNorwayRussia
United StatesUkraine
IsraelAustralia
Note: Q: “Do you usually think of yourself as close to any particular political party?” (%‘Yes’). Source: Comparative Study of Electoral Systems, Module 1 1996-2002.

ELECTORAL ENGINEERING ~ CHAPTER 6 3/10/2003 6:35 PM
16
Figure 6.2: National context of partisanship
% With party identification
41
47
34
4637
57
42
4146
33
37
43
50
50
4040
40
22
0 10 20 30 40 50 60
All
Older democracy
Newer democracy
Postindustrial
Industrial
Candidate-ballotPreference ballot
Dual-ballot
Party ballot
Executive onlyLegislative and executive
Legislative only
North AmericaScandinavia
Western Europe
C. & E. Europe
Asia-Pacific
South America
Note: Q: “Do you usually think of yourself as close to any particular political party?” (%‘Yes’). Source: Comparative Study of Electoral Systems, Module 1 1996-2002.
ELECTORAL ENGINEERING ~ CHAPTER 6 3/10/2003 6:35 PM
17
Figure 6.3: Party characteristics of partisans
% With party identification
41
67
37
53
53
58
41
49
51
62
33
44
42
44
43
0 10 20 30 40 50 60 70 80
ALL
Communist
Ecology
Socialist
Social Democrat
Left Liberal
Liberal
Right liberal
Conservative
Nationalist
Younger party
Older party
Two party
Moderate multiparty
Fragmented multiparty
Note: Q: “Do you usually think of yourself as close to any particular political party?” (% ‘Yes’). The differences between groups are all significant at the .001 level using Cramer’s V.
Source: Comparative Study of Electoral Systems, Module 1 1996-2002.

ELECTORAL ENGINEERING ~ CHAPTER 6 3/10/2003 6:35 PM
18
Figure 6.4: Social characteristics of partisans
41
4339
4847
4339
33
4640
4237
5452
4032
4842
413939
5450
4444
42
5346
4138
4343
4839
4836
0 10 20 30 40 50 60
ALL
MenWomen
Sixties or olderFifties
FortiesThirties
Twenties
UniversityTechnical
SecondaryPrimary
Highest knowledgeHighLow
Lowest knowledge
Income HighestHigh
ModerateLow
Income Lowest
Managerial &Lower ProfessionsSkilled white collar
Skilled manualManual
Most religious5432
Least religious
Union memberNot union member
Linguistic majorityLinguistic minority
Note: Q: “Do you usually think of yourself as close to any particular political party?” (% ‘Yes’). The differences between groups are all significant at the .001 level using Cramer’s V.
Source: Comparative Study of Electoral Systems, Module 1 1996-2002.
ELECTORAL ENGINEERING ~ CHAPTER 6 3/10/2003 6:35 PM
19
Figure 6.5: The political characteristics of partisans
% With party identification
41
4720
4433
4640
4536
4950
4537
29
4842
3531
28
6257
5551
4235
4049
5763
55
0 10 20 30 40 50 60 70
ALL
VotedDid not vote
High efficacyLow efficacy
High democratic satis.Low democratic satis.
Last election fairLast election not fair
Parties care 234
Parties don’t care
Parties are necessary234
Parties are not necessary
0 Most Left123456789
10 Most Right
Note: Q: “Do you usually think of yourself as close to any particular political party?” (% ‘Yes’).
Source: Comparative Study of Electoral Systems, Module 1 1996-2002.

ELECTORAL ENGINEERING ~ CHAPTER 6 3/10/2003 6:35 PM
20
Figure 6.6: Total variance produced by social and partisan identities, by type of society
0.00 0.20 0.40 0.60 0.80 1.00 1.20
Sweden
Iceland
Netherlands
Germany
Israel (p)
Britain
Norway
Denmark
Switzerland
United States (p)
Israel
Australia
Portugal
Belgium
Japan
Canada
New Zealand
United States
Spain
Czech Rep
Hungary
Ukraine
Russia
Poland
Peru (p)
Taiwan
Slovenia
Mexico
Lithuania (p)
Taiwan (p)
Romania
Korea
Romania (p)
Belarus (p)
Chile (p)
Mexico (p)
Postindustrial R2=.72
Industrial R2=.65
ELECTORAL ENGINEERING ~ CHAPTER 6 3/10/2003 6:35 PM
21
Figure 6.7: Total variance produced by social and partisan identities, by electoral system
0.00 0.20 0.40 0.60 0.80 1.00
Israel (p)Britain
United States (p)
AustraliaPeru (p)Canada
Lithuania (p)Taiwan (p)
United States
Romania (p)Belarus (p)
Chile (p)
Mexico (p)
Hungary
UkraineGermany
Russia
TaiwanJapan
MexicoNew Zealand
Korea
Czech Rep
SwedenIceland
Netherlands
NorwayDenmark
Switzerland
IsraelPoland
Portugal
BelgiumSlovenia
Spain
Majoritarian systems R2=.63
Combined systems R2=.76
PR systems R2=.77

ELECTORAL ENGINEERING ~ CHAPTER 6 3/10/2003 6:35 PM
22
1 Angus Campbell, Philip Converse, Warren E. Miller and Donald E. Stokes. 1960. The American
Voter. New York: John Wiley & Sons, Inc. For the latest work from the Michigan school see
Warren Miller and J. Merrill Shanks. 1996. The New American Voter. Cambridge: Harvard
University Press.
2 Philip Converse. 1969. ‘Of time and partisan stability.’ Comparative Political Studies. 2: 139-71.
3 Philip Converse. 1969. ‘Of time and partisan stability.’ Comparative Political Studies. 2: 139-71.
4 For Britain see David Butler and Donald Stokes. 1974. Political Change in Britain. Revised
edition. London: Macmillan. For Norway see Angus Campbell and Henry Valen. 1961. ‘Party
Identification in Norway and the United States.’ Public Opinion Quarterly 22:505-525. For France
see Philip E. Converse and Georges Dupeux. 1962. ‘Politicization of the Electorate in France and
the United States.’ Public Opinion Quarterly 26:1-23; Philip E. Converse and Roy Pierce. 1986.
Political Representation in France. Cambridge Harvard University Press.
5 David Butler and Donald Stokes. 1974. Political Change in Britain. Revised edition. London:
Macmillan.
6 Jacques Thomassen. 1976. 'Party identification as a cross-national concept: its meaning in the
Netherlands'. In Party Identification and Beyond, Eds. Ian Budge, Ivor Crewe and Dennis Farlie.
London: John Wiley; Lawrence LeDuc. 1979. ‘The Dynamic Properties of Party Identification: A
Four Nation Comparison.’ European Journal of Political Research 9:257-68; Richard A. Brody
and Lawrence S. Rothenberg. 1988. ‘The Instability of Party Identification: An Analysis of the
1980 Presidential Election.’ British Journal of Political Science 18:445-65; Sören Holmberg. 1994.
‘Party identification compared across the Atlantic.’ In Elections at Home and Abroad Ed. M. Kent
Jennings and Thomas Mann. Ann Arbor: University of Michigan Press; I. Kabashima and Y. Ishio.
1998. ‘The instability of party identification among eligible Japanese voters - A seven-wave panel
study, 1993-6.’ Party Politics 4 (2): 151-176; E. Schickler and D.P. Green. 1997. ‘The stability of
party identification in western democracies - Results from eight panel surveys.’ Comparative
Political Studies 30 (4): 450-483; M. Brynin and David Sanders. 1997. ‘Party identification,
political preferences, and material conditions - Evidence from the British Household Panel
Survey, 1991-2.’ Party Politics 3 (1): 53-77.
7 Morris Fiorina. 1981. Retrospective Voting in American National Elections. New Haven, CN:
Yale University Press; Christopher Achen. 1992. ‘Social psychology, demographic variables and
linear Regression: Breaking the iron triangles in voting research.’ Political Behavior 14: 195-211;
John Bartle. 2001. ‘The measurement of party identification in Britain: Where do we stand now?’

ELECTORAL ENGINEERING ~ CHAPTER 6 3/10/2003 6:35 PM
23
In British Elections and Parties Review: 11. Eds. Jonathan Tonge, Lynn Bennie, David Denver
and Lisa Harrison. London: Frank Cass.
8 Morris Fiorina. 1981. Retrospective Voting in American National Elections. New Haven: Yale
University Press.
9 Russell J. Dalton and Martin Wattenberg. Eds. 2001. Parties without Partisans. New York:
Oxford University Press.
10 Ivor Crewe and David Denver. Eds. 1985. Electoral Change in Western Democracies: Patterns
and Sources of Electoral Volatility. New York: St. Martin's Press; Russell J. Dalton, Scott C.
Flanagan, Paul A. Beck, and James E. Alt. Eds. 1984. Electoral Change in Advanced Industrial
Democracies: Realignment or Dealignment? Princeton: Princeton University Press.
11 See, Herbert Kitschelt , Zdenka Mansfeldova, Radoslaw Markowski and Gabor Toka. 1999.
Post-Communist Party Systems. Cambridge: Cambridge University Press; Stephen White,
Richard Rose and Ian McAllister. 1996. How Russia Votes. New Jersey, Chatham House; Arthur
H. Miller. 2000. ‘The development of party identification in post-soviet societies.’ American
Journal of Political Science. 44 (4): 667-686; Richard Rose, and Neil Munro. 2002. Elections
without Order: Russia’s Challenge to Vladimir Putin. New York: Cambridge University Press.
12 Herman Schmitt and Sören Holmberg. 1995. ‘Political Parties in Decline?’ In Citizens and the
State, Eds. Hans-Dieter Klingemann and Dieter Fuchs. Oxford: Oxford University Press.
13 Russell J. Dalton. 2001. ‘The Decline of Party Identification.’ In Parties without Partisans. Eds.
Russell J. Dalton and Martin Wattenberg. New York: Oxford University Press.
14 This school arises from Anthony Downs. 1957. An Economic Theory of Democracy. New York:
Harper. See Morris P. Fiorina. 1981. Retrospective Voting in American National Elections. New
Haven: Yale University Press.
15 Herman Schmitt and Sören Holmberg. 1995. ‘Political Parties in Decline?’ In Citizens and the
State, Eds. Hans-Dieter Klingemann and Dieter Fuchs. Oxford: Oxford University Press.
16 John M. Carey and Matthew S. Shugart. 1995. ‘Incentives to Cultivate a Personal Vote: A Rank
Ordering of Electoral Formulas.’ Electoral Studies 14:417-40.
17 Philip E.Converse and Roy Pierce. 1985. ‘Measuring Partisanship.’ Political Methodology
11:143-66; Anthony Heath and Roy Pierce. 1992. ‘It Was Party Identification All Along - Question
Order Effects on Reports of Party Identification in Britain.’ Electoral Studies 11 (2): 93-105; Ron J.
Johnston and Charles J. Pattie. 1996. ‘The strength of party identification among the British
electorate: An exploration.’ Electoral Studies 15 (3): 295-309; Ian McAllister and Martin
Wattenberg. 1995. ‘Measuring Levels Of Party Identification - Does Question Order Matter?’

ELECTORAL ENGINEERING ~ CHAPTER 6 3/10/2003 6:35 PM
24
Public Opinion Quarterly 59 (2): 259-268; André Blais, Elizabeth Gidengil, Richard Nadeau, and
Neil Nevitte. 2001. ‘Measuring party identification: Britain, Canada, and the United States.’
Political Behavior 23 (1): 5-22.
18 By contrast, the standard question on the direction and strength of partisanship carried since
1952 in the American National Election Study asks: "Generally speaking, do you usually think of
yourself as a Republican, a Democrat, an Independent, or what?" (IF REPUBLICAN OR
DEMOCRAT) "Would you call yourself a strong (REPUBLICAN/DEMOCRAT) or a not very
strong (REPUBLICAN/DEMOCRAT)?" (IF INDEPENDENT, OTHER [1966 and later: OR NO
PREFERENCE]:) "Do you think of yourself as closer to the Republican or Democratic party?" The
same item, with the inclusion of cues for the Conservative, Labour and Liberal Democratic
parties, has been carried in the series of British Election Studies since 1964. The inclusion of the
standard cued item in the Australian and the Belgian election survey in the CSES dataset
generated far higher levels of partisanship and as a result these elections were dropped from the
analysis in this chapter.
19 Philip Converse. 1969. ‘Of time and partisan stability.’ Comparative Political Studies. 2: 139-71.
20 See Herbert Kitschelt, Zdenka Mansfeldova, Radoslaw Markowski and Gabor Toka. 1999.
Post-Communist Party Systems. Cambridge: Cambridge University Press; Sten Berglund and
Jan A. Dellenbrant. 1994. The New Democracies in Eastern Europe: Party Systems and Political
Cleavages. Aldershot: Edward Elgar.
21 See, for example, Bernard Grofman, Sung-Chull Lee, Edwin A. Winckler and Brian Woodall.
Eds. 1997. Elections in Japan, Korea and Taiwan under the Single Non-Transferable Vote: The
Comparative Study of an Embedded Institution. Ann Arbor: University of Michigan Press.
22 See Moshe M. Czudnowski, 1975. ‘Political Recruitment.’ In Handbook of Political
Science Vol 2: Micro-Political Theory Reading, MA: Addison-Wesley; Donald R. Matthews. 1985.
‘Legislative Recruitment and Legislative Careers.’ In Handbook of Legislative Research, ed.
Gerhard Loewenberg, Samuel C. Patterson and Malcolm E. Jewell. Cambridge, MA: Harvard
University Press,(17-55); Gerhard Loewenberg and Samuel C. Patterson. 1979. Comparing
Legislatures. Boston: Little, Brown and Company; Michael Gallagher and Michael Marsh, eds.
1988. Candidate Selection in Comparative Perspective. London: Sage; Norris, Pippa and Joni
Lovenduski. 1995. Political Recruitment: Gender, Race and Class in British Parliament.
Cambridge: Cambridge University Press; Pippa Norris. Ed. 1997. Passages To Power:
Legislative Recruitment in Advanced Democracies. Cambridge: Cambridge University Press;
Reuvan Hazan. 2002. ‘Candidate Selection.’ In Comparing Democracies 2 Eds. Lawrence LeDuc,
Richard G. Neimi and Pippa Norris. London: Sage.

ELECTORAL ENGINEERING ~ CHAPTER 6 3/10/2003 6:35 PM
25
23 Pippa Norris. Ed. 1997. Passages To Power: Legislative Recruitment in Advanced
Democracies. Cambridge: Cambridge University Press.
24 For a discussion see Anthony King. 1999. Running Scared: Why America's Politicians
Campaign Too Much and Govern Too Little. New York: Free Press.
25 Russell J. Dalton. 2001. ‘The Decline of Party Identification.’ In Parties without Partisans. Eds.
Russell J. Dalton and Martin Wattenberg. New York: Oxford University Press.
26 Warren Miller and J. Merrill Shanks. 1996. The New American Voter. Cambridge: Harvard
University Press.
27 Pippa Norris. 2002. Democratic Phoenix. New York: Cambridge University Press. Chapter 6.