chapter 6 connect to the big idea humans in the biosphere
TRANSCRIPT

NATIONAL SCIENCE EDUCATION STANDARDS
UNIFYING CONCEPTS AND PROCESSES
I, II, III, IV
CONTENT
C.4.a, C.4.b, C.4.c, C.4.d, C.4.e, C.5.e, C.6.b, F.2, F.3, F.4, F.5, F.6, G.1, G.2
INQUIRY
A.1.b, A.1.c, A.2.a, A.2.d
Chapter 6 • Flash Cards
Humans in the BiosphereInterdependence in NatureQ: How have human activities shaped local
and global ecology?
Viewed from space, the lights of human settlement are obvious. The brightest areas are the most developed but not necessarily the most populated. Development is one way in which humans, who today number over 6.5 billion, have affected the biosphere.
152
0001_Bio10_se_Ch06_CO.indd 1 6/2/09 6:23:54 PM 0001_Bio10_se_Ch06_CO.indd 153 6/9/09 1:32:55 PM
152 Chapter 6
Understanding by DesignIn Chapter 6, students examine the wise use of resources, the importance of bio-diversity, and the need to meet ecological challenges. The graphic organizer at the right shows how the Big Idea, Essential Question, and Guiding Questions help frame students’ exploration of the Unit 2 Enduring Understanding that the existence of life on Earth depends on interactions among organisms and between organisms and their environment.
PERFORMANCE GOALS
In Chapter 6, students will interpret information in maps, graphs, and diagrams. They will also analyze a day’s worth of trash to see which items can be reused, recycled, or composted. At the end of the chapter, students will apply their knowledge by writing a magazine article about an environmental activist.
Connect to the Big IdeaHave students examine the photograph of Earth from space showing the pattern of lights on the planet. Ask students what a
comparison of North and South America tells them about the human activities on the two continents. (Sample answer: Lights are much more prevalent in North America, which indicates greater development than in South America.) Ask students what the dif-ference tells them about energy use on the two con-tinents. (Sample answer: More lights suggest humans are using much more energy in North Amer-ica than in South America.) Ask where else the photo suggests humans are using a large amount of energy. (throughout Europe, in India, in eastern China, and in Japan) Discuss with students how energy use might affect the ecology of a region. Then, have students anticipate the answer to the question, How have human activities shaped local and global ecology?
Have students read over the intro-duction to the Chapter Mystery and predict what happened to the
trees on Easter Island. Use their predictions to help them start connecting the Chapter Mystery to the Big Idea of Interdependence in Nature.
Have students preview the chapter vocabulary terms using the Flash Cards.
CH
APTE
R 6
0152_mlbio10_Ch06.indd 10152_mlbio10_Ch06.indd 1 6/29/09 5:10:21 PM6/29/09 5:10:21 PM

0001_Bio10_se_Ch06_CO.indd 1 6/2/09 6:23:54 PM
• Untamed Science Video • Chapter Mystery
MOVING THE MOAIEaster Island is a tiny speck of land in the vast Pacifi c Ocean off the coast of Chile with a harsh tropical climate. The original islanders, who called themselves Rapa Nui, came from Polynesia. They carved hundreds of huge stone statues called moai (moh eye). Starting around 1200 A.D., the Rapa Nui somehow moved these mysterious statues, each of which weighed between 10 and 14 tons, from quarries to locations around the island. Nearly all theories about this process suggest that strong, large logs were necessary to move the moai. Yet by the time Europeans landed on the island in 1722, there was no sign of any trees large enough to provide such logs. What had happened? As you read this chapter, look for clues about the interactions of the Rapa Nui with their island environment. Then, solve the mystery.
Never Stop Exploring Your World.The mystery of the moving Moais is just the beginning. Take a video fi eld trip with the ecogeeks of Untamed Science to see where this mystery leads.
Humans in the Biosphere 153
INSIDE:• 6.1 A Changing Landscape
• 6.2 Using Resources Wisely
• 6.3 Biodiversity
• 6.4 Meeting Ecological Challenges
0001_Bio10_se_Ch06_CO.indd 153 6/9/09 1:32:55 PM
Chapter 6 Big Idea: Interdependence in Nature 6.1 GQ: How does human activity affect the
environment?
6.2 GQ: How can we use our natural resources wisely?
6.4 GQ: How can we change our behaviors to help protect our planet?
6.3 GQ: Why is it important to protect and conserve biodiversity?
Chapter 6 EQ: How have human activities shaped local and global ecology?
Humans in the Biosphere 153
What’s Online
Extend your reach by using these and other digital assets offered at Biology.com.
CHAPTER MYSTERYStudents go online and look into the disappearance of large trees on Easter Island.
UNTAMED SCIENCE VIDEOThe Untamed Science crew go behind the scenes to uncover critical research and conservation programs in progress at the Houston Zoo.
ART IN MOTIONStudents watch an animation of biological magnifi cation.
DATA ANALYSISStudents collect virtual biodiversity data from two sites and use this data to calculate a biodiversity index for the sites.
ART REVIEWStudents review threats to biodiversity in this drag-and-drop activity.
VISUAL ANALOGYExplore ecological footprints through this visual analogy.
CH
APTE
R 6
0152_mlbio10_Ch06.indd 20152_mlbio10_Ch06.indd 2 6/29/09 5:10:33 PM6/29/09 5:10:33 PM

NATIONAL SCIENCE EDUCATION STANDARDS
UNIFYING CONCEPTS AND PROCESSES
I, III
CONTENT
C.4.d, C.4.e, C.5.e, F.3, F.4, F.5, F.6
INQUIRY
A.1.b, A.2.a
The Effect of Human Activity How do our daily activities affect the environment?
Beginning in the late 1700s, new waves of settlers arrived in Hawaii. These people did not seem to understand the limits of island ecosys-tems. They imported dozens more plants and animals that became invasive pests. They cleared vast tracts of forest to grow sugar cane, pineapples, and other crops that required lots of water. And as the island’s human population grew, they converted untouched land for other uses, including housing and tourism, as shown in Figure 6–1. The effect of these activities on Hawaii’s ecosystems and its human inhabitants offers a window onto a globally important question: What happens when a growing human population does not adequately manage natural resources that are both vital and limited?
A Changing Landscape
Key Questions How do our daily activities
affect the environment?
What is the relationship between resource use and sustainable development?
Vocabularymonoculturerenewable resourcenonrenewable resourcesustainable development
Taking NotesOutline As you read, create an outline using the green and blue heads in this lesson. As you read, fi ll in key words, phrases, and ideas about each heading.
FIGURE 6–1 The Lesson of HawaiiKalalau Valley along the Na Palicoast of Kauai looks almost untouched by humans. In contrast, Waikiki Beach on the island of Oahu is surrounded by built-up areas that support tourism.
Easter Island’s fi rst colonists brought with them banana trees, taro root, and chickens—and possibly some small mammalian “stowaways.” What impact might these new organisms have had on the island’s ecosystems?
154 • Lesson Overview • Lesson NotesLesson 6.1
THINK ABOUT IT The fi rst humans to settle Hawaii came from Polynesia about 1600 years ago. These island people had customs that protected the natural resources of their new home. For example, they were prohibited from catching certain fi sh during spawning season and, for every coconut palm tree cut down, they had to plant two palms in its place. But Hawaiians did not treat their islands entirely like nature reserves. They cut trees to plant farms, and they intro-duced nonnative plants, pigs, chickens, dogs, and rats. This combina-tion drove many native plant and animal species to extinction. Yet for centuries Hawaii’s ecosystems provided enough fresh water, fertile soil, fi sh, and other resources to keep the society self-suffi cient. What hap-pened next is a lesson on managing limited resources—a lesson that is as important today as it was over 1000 years ago.
0001_Bio10_se_Ch06_S1.indd 1 6/2/09 6:24:51 PM
Monoculture,
monoculture
0001_Bio10_se_Ch06_S1.indd 2 6/2/09 6:25:00 PM
LESSO
N 6
.1
Getting Started
Objectives6.1.1 Describe human activities that can affect the biosphere.
6.1.2 Describe the relationship between resource use and sustainable development.
Student ResourcesStudy Workbooks A and B, 6.1 Worksheets
Spanish Study Workbook, 6.1 Worksheets
Lesson Overview • Lesson Notes • Assessment: Self-Test, Lesson Assessment
For corresponding lesson in the Foundation Edition, see pages 128–131.
Activate Prior Knowledge Describe a well-known natural area, such as a forest preserve or wetlands, in or near the students’ com-munity. Have students imagine that a new housing development will be built there. Have them identify positive and negative impacts of such a project. (pos-itives: new jobs, new houses; negatives: loss of trees, displaced animals)
Discuss with students which “mamma-lian stowaways” likely came to the island on ships. Then, discuss how intro-
ducing new organisms to the island ecosystem may have affected the native species. Students can go online to Biology.com to gather their evidence.
Teach for UnderstandingENDURING UNDERSTANDING The existence of life on Earth depends on interactions among organisms and between organisms and their environment.
GUIDING QUESTION How does human activity affect the environment?
EVIDENCE OF UNDERSTANDING After completing this lesson, give students the following assessment to show their understanding of the difference between renewable and nonrenewable resources. Ask students to each make a list of all the renewable resources and nonrenewable resources they use in a typical day. Have volunteers share their lists with the class.
154 Chapter 6 • Lesson 1
0152_mlbio10_Ch06.indd 30152_mlbio10_Ch06.indd 3 6/29/09 5:10:39 PM6/29/09 5:10:39 PM
0001_Bio10_se_Ch06_S1.indd 1 6/2/09 6:24:51 PM
Living on Island Earth Humans, like all forms of life, rely on Earth’s life-support systems. And like all other organisms, we affect our envi-ronment when we obtain food, eliminate waste products, and build places to live. The effects of these activities can be most obvious on islands such as Hawaii because of their small size. Living on an island also can make people aware of limited resources and of an area’s car-rying capacity for humans because anything not available locally must be brought in from far away.
Most of us who live on large continents, however, probably don’t think of land, food, and water as limited resources. In the past, envi-ronmental problems were local. There was always new land to settle and new sources of food and water. But today human activity has used or altered roughly half of all the land that’s not covered with ice and snow. Some people suggest that as the global population reaches 7 billion people, we may be approaching the carrying capacity of the biosphere for humans. Humans affect regional and global environments through agriculture, development, and industry in ways that have an impact on the quality of Earth’s natural resources, including soil, water, and the atmosphere.
In Your Notebook Explain how Earth is like an island.
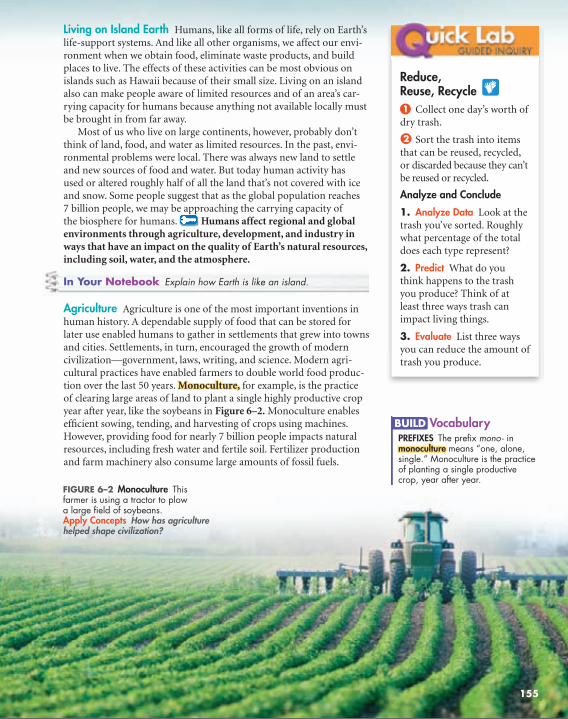
Agriculture Agriculture is one of the most important inventions in human history. A dependable supply of food that can be stored for later use enabled humans to gather in settlements that grew into towns and cities. Settlements, in turn, encouraged the growth of modern civilization—government, laws, writing, and science. Modern agri-cultural practices have enabled farmers to double world food produc-tion over the last 50 years. Monoculture, Monoculture, for example, is the practice of clearing large areas of land to plant a single highly productive crop year after year, like the soybeans in Figure 6–2. Monoculture enables effi cient sowing, tending, and harvesting of crops using machines. However, providing food for nearly 7 billion people impacts natural resources, including fresh water and fertile soil. Fertilizer production and farm machinery also consume large amounts of fossil fuels.
FIGURE 6–2 Monoculture This farmer is using a tractor to plow a large fi eld of soybeans. Apply Concepts How has agriculture helped shape civilization?
Reduce, Reuse, Recycle 1 Collect one day’s worth of
dry trash.
2 Sort the trash into items that can be reused, recycled, or discarded because they can’t be reused or recycled.
Analyze and Conclude
1. Analyze Data Look at the trash you’ve sorted. Roughly what percentage of the total does each type represent?
2. Predict What do you think happens to the trash you produce? Think of at least three ways trash can impact living things.
3. Evaluate List three ways you can reduce the amount of trash you produce.
BUILD VocabularyPREFIXES The prefi x mono - in monoculturemonoculture means “one, alone, single.” Monoculture is the practice of planting a single productive crop, year after year.
155
0001_Bio10_se_Ch06_S1.indd 2 6/2/09 6:25:00 PM
LESSO
N 6
.1
Humans in the Biosphere 155
Lead a DiscussionCall on a student to defi ne carrying capacity, a con-cept students learned about in Chapter 5. Then, read aloud the sentence in the text that suggests we may be approaching the carrying capacity for humans in the biosphere. Talk about whether students think that number is being reached or not. Encourage them to their express their opinions, though chal-lenge any statements that aren’t backed by evidence.
DIFFERENTIATED INSTRUCTION
LPR Less Profi cient Readers Before discussing the biosphere’s carrying capacity for humans, make sure students understand the three main ways humans affect regional and global environments. Read the bolded Key Concept statement aloud, and then write the three categories on the board: Agriculture, Development, Industry. Call on students to describe how specifi c examples of each can impact the qual-ity of Earth’s natural resources. Make sure students know that the ways these human activities affect environments are not always bad.
PURPOSE Students will analyze the types of dry trash generated during a normal day and evaluate how the amount of trash produced could have been reduced.
MATERIALS gloves; large trash bags, boxes, or bins
SAFETY Make sure students wear gloves when sorting trash. Caution them to be careful when handling glass or metal items.
PLANNING Provide trash bags to students the day before they complete the lab. Encourage
AnswersFIGURE 6–2 Agriculture enabled humans to gather in settlements that grew into towns and cities. Settlements, in turn, encouraged the growth of modern civilization.
IN YOUR NOTEBOOK Sample answer: Earth is like an island because the resources here are finite—we can’t get water or soil from anywhere else. It’s also like an island because humans can’t leave to live anywhere else.
them to start collecting their own trash as soon as they start their day. Reinforce that they are collecting only their own trash. Discuss the types of dry trash students should collect, including bottles, cans, plastic containers, pack-aging, and various types of paper.
ANALYZE AND CONCLUDE
Answers will vary. 1.
Sample answer: Most of the trash goes to 2. a landfill. Some items are recycled. Landfills
take space from natural habitats for living things. Chemicals that leak from landfills can contaminate water, and if burned, trash releases greenhouse gases. Animals mistak-ing trash for food may eat it and become ill.
Sample answer: I can recycle more items, 3. reuse some materials instead of throwing them away, and stop buying items that are heavily packaged.
0152_mlbio10_Ch06.indd 40152_mlbio10_Ch06.indd 4 6/29/09 5:10:52 PM6/29/09 5:10:52 PM

Development As modern society developed, many people chose to live in cities. In the United States, as urban centers became crowded, people moved to, and built up, suburbs. The growth of cities and suburbs is tied to the high standard of living that Americans enjoy. Yet this development has environmental effects. Dense human communities produce lots of wastes. If these wastes are not disposed of properly, they affect air, water, and soil resources. In addition, development consumes farmland and divides natural habitats into fragments.
Industrial Growth Human society was transformed by the Industrial Revolution of the 1800s. Today, industry and scientifi c know-how provide us with the conveniences of modern life—from comfortable homes and clothes to electronic devices for work and play. Of course these conveniences require a lot of energy to produce and power. We obtain most of this energy by burning fossil fuels—coal, oil, and natural gas—and that affects the environment. In addition, industries have traditionally discarded wastes from manufacturing and energy production directly into the air, water, and soil.
Sustainable Development What is the relationship between resource use
and sustainable development?In the language of economics, goods are things that can be bought and sold, that have value in terms of dollars and cents. Services are pro-cesses or actions that produce goods. Ecosystem goods and services are the goods and services produced by ecosystems that benefi t the human economy.
Ecosystem Goods and Services Some ecosystem goods and services—like breathable air and drinkable water—are so basic that we often take them for granted. Healthy ecosystems provide many goods and services naturally and largely free of charge. But, if the environment can’t provide these goods and services, society must spend money to produce them. In many places, for example, drinkable water is provided naturally by streams, rivers, and lakes, and fi ltered by wetlands like the one in Figure 6–3. But if water sources or wetlands are polluted or damaged, water quality may fall. In such cases, cities and towns must pay for mechanical or chemical treatment to provide safe drinking water.
In Your Notebook Describe three ecosystem goods and services you’ve used today.
FIGURE 6–3 Ecosystem Services Hopper Marsh is one of the wetlands controlled by The Wetlands Initiative—an organization dedicated to protecting and restoring Illinois’s wetlands. The area, originally drained for farming in 1900, is shown in the inset before its 2003 restoration. Apply Concepts What ecological services do wetlands provide?
156 Chapter 6 • Lesson 1
0001_Bio10_se_Ch06_S1.indd 3 6/2/09 6:25:07 PM
renewable resource
nonrenewable resources
0001_Bio10_se_Ch06_S1.indd 4 6/2/09 6:25:12 PM
LESSO
N 6
.1
156 Chapter 6 • Lesson 1
Teach continued
Use VisualsHave students compare the photo of the wetlands in Figure 6–3 with the inset photo of the same area as farmland.
Ask Why do you think The Wetlands Initiative would restore this area as wetlands? (Restoring it as wet-lands provides wildlife habitat and a natural filter for the area’s water.)
Ask How is this restoration an example of sustain-able development? (Sample answer: Sustainable development provides for human needs while preserving the ecosystem. Restoring the wetlands provides humans with clean drinking water while preserving the regional ecosystem.)
DIFFERENTIATED INSTRUCTION
L3 Advanced Students Have interested students research The Wetlands Initiative and report what they learn to the class. For example, what is the goal of the project? Who funds the project? What successes have they had? What challenges?
ELL Focus on ELL: Access Content
INTERMEDIATE AND ADVANCED SPEAKERS Ask students to create a Compare/Contrast Table with three columns and three rows. Have them label each row as follows: Agriculture, Development, and Industrial Growth. Then, have them label the second and third columns Positive Effects and Negative Effects. Ask them to fill in the table with a summary statement about the negative and positive effects of each activity. Students can use their charts when participating in discussion and for review.
Study Wkbks A/B, Appendix S20, Compare/Contrast Table. Transparencies, GO3.
Check for Understanding
ONE-MINUTE RESPONSE
Write the following question on the board, and give students about a minute to write a quick response.
Clear cutting is the process of removing the majority of trees from a forest for • human use. What might a sustainable alternative to clear cutting look like?
ADJUST INSTRUCTION
If student responses show a misunderstanding of sustainable development, remind them that their plan should provide for human needs (wood for building, paper, etc.) while protecting the forest ecosystem. Ask them to think about the question: How can you use trees for wood while still protecting forests? Have students volunteer their ideas.
AnswersFIGURE 6–3 Sample answer: Wetlands filter water, and provide a habitat for many kinds of organisms.
IN YOUR NOTEBOOK Sample answer: The air I breathe, the water I drink, and the oil used to make the gasoline burned in our car are three examples.
0152_mlbio10_Ch06.indd 50152_mlbio10_Ch06.indd 5 6/29/09 5:10:57 PM6/29/09 5:10:57 PM

0001_Bio10_se_Ch06_S1.indd 3 6/2/09 6:25:07 PM
Renewable and Nonrenewable Resources Ecosystem goods and services are classifi ed as either renewable or nonrenewable, as shown in Figure 6–4. A renewable resourcerenewable resource can be produced or replaced by a healthy ecosystem. A single southern white pine is an example of a renewable resource because a new tree can grow in place of an old tree that dies or is cut down. But some resources are nonrenewable nonrenewable resourcesresources because natural processes cannot replenish them within a reasonable amount of time. Fossil fuels like coal, oil, and natural gas are nonrenewable resources formed from buried organic materials over millions of years. When existing deposits are depleted, they are essentially gone forever.
Sustainable Resource Use Ecological science can teach us how to use natural resources to meet our needs without causing long-term envi-ronmental harm. Using resources in such an environmentally conscious way is called sustainable development. Sustainable development provides for human needs while preserving the ecosystems that produce natural resources.
What should sustainable development look like? It should cause no long-term harm to the soil, water, and climate on which it depends. It should consume as little energy and material as possible. Sustainable development must be fl exible enough to survive environmental stresses like droughts, fl oods, and heat waves or cold snaps. Finally, sustainable development must take into account human economic systems as well as ecosystem goods and services. It must do more than just enable people to survive. It must help them improve their situation.
FIGURE 6–4 Natural Resources Natural resources are classifi ed as renewable or nonrenewable. Wind and coal are both natural resources that can provide energy. But wind is renewable, while coal—like other fossil fuels—is not.
Review Key Concepts 1. a. Review List the three primary types of
human activities that have affected regional and global environments. For each, give one benefi t and one environmental cost.
b. Relate Cause and Effect How might more productive agricultural practices affect a devel-oping nation’s population? Its environmental health?
2. a. Review What is sustainable development?How can it help minimize the negative impacts of human activities?
b. Explain Explain why energy from the sun is a renewable resource but energy from oil is a nonrenewable resource.
c. Apply Concepts In addition to fi ltering water, wetlands provide fl ood control by absorbing excess water. Explain how society would provide these services (for a cost) if the ecosystem could not.
Description3. What signs of growth do you see in
your community? Write a paragraph telling how this growth might affect local ecosystems.
Lesson 6.1 • Self-Test • Lesson Assessment
Humans in the Biosphere 157
0001_Bio10_se_Ch06_S1.indd 4 6/2/09 6:25:12 PM
LESSO
N 6
.1
Humans in the Biosphere 157
1a. Sample answer: Agriculture: benefit, food production; cost, impacts on fresh water and fertile soil. Development: bene-fit, higher standard of living; cost, produc-tion of lots of wastes. Industrial growth: benefit, conveniences of modern life; cost, requires lots of energy to produce and power products.
1b. Sample answer: More productive agricul-tural practices would increase a nation’s population since there would be more food available. However, it would likely worsen the nation’s environmental health.
2a. Sustainable development means using resources in an environmentally conscious way. It provides for human needs while preserving ecosystems that produce natu-ral resources.
2b. Sample answer: Energy from the sun is renewable because it can be replaced (the sun will keep burning). However, natural processes cannot replenish oil supplies within a reasonable amount of time, so oil is a nonrenewable resource.
Assessment Answers
Assess and RemediateEVALUATE UNDERSTANDING
Have each student write a brief paragraph that describes, in their own words, how sustainable development can help reduce the negative impacts of agriculture, industry, and development. Then, have students complete the 6.1 Assessment.
REMEDIATION SUGGESTION
L1 Struggling Students If students have diffi -culty answering Question 2b, review the difference between renewable and nonrenewable resources. Then, call on students to help make lists of each on the board. Choose a resource from each list, and ask volunteers to explain why they are either renewable or nonrenewable resources.
Students can check their under-standing of lesson concepts with the Self-Test assessment. They can then take an online version of the Lesson Assessment.
2c. Sample answer: If there were no wetlands to provide flood control, societies would have to build more dams and barriers to prevent excess water from flooding cit-ies and agricultural land.
3. Answers will vary depending on the com-munity. Students might mention the spread of housing developments, the building of malls and other shopping areas, and the construction of highways and then explain how these affect their local ecosystem by necessitating new sources of power and materials.
0152_mlbio10_Ch06.indd 60152_mlbio10_Ch06.indd 6 6/29/09 5:11:04 PM6/29/09 5:11:04 PM

NATIONAL SCIENCE EDUCATION STANDARDS
UNIFYING CONCEPTS AND PROCESSES
I, II, III
CONTENT
C.4.b, C.4.d, C.4.e, C.5.e, F.3, F.4, F.5, F.6
INQUIRY
A.1.c, A.2.d
Using Resources Wisely
Key Questions Why is soil important,
and how do we protect it?
What are the primary sources of water pollution?
What are the major forms of air pollution?
Vocabularydesertifi cation deforestationpollutantbiological magnifi cationsmogacid rain
Taking NotesConcept Map As you read, cre-ate a concept map to organize the information in this lesson.
Soil Resources Why is soil important, and how do we protect it?
When you think of natural resources, soil may not be something that comes to mind. But many objects you come into contact with daily rely on soil—from the grain in your breakfast cereal, to the wood in your home, to the pages of this textbook. Healthy soil supports both agriculture and forestry. The mineral- and nutrient-rich por-tion of soil is called topsoil. Good topsoil absorbs and retains moisture yet allows water to drain. It is rich in organic matter and nutrients,
but low in salts. Good topsoil is produced by long-term interactions between soil and the plants growing in it.
Topsoil can be a renewable resource if it is managed properly, but it can be damaged or lost if it is misman-aged. Healthy soil can take centuries to form but can be lost very quickly. And the loss of fertile soil can have dire consequences. Years of poorly managed farming in addition to severe drought in the 1930s badly eroded the once-fertile soil of the Great Plains. Thousands upon thousands of people lost their jobs and homes. The area essentially turned to desert, or, as it came to be known, a “dust bowl,” as seen in Figure 6–5. What causes soil ero-sion, and how can we prevent it?
FIGURE 6–5 The Dust Bowl A ranch in Boise City, Idaho, is about to be hit by a cloud of dry soil on April 15, 1935.
158 Lesson 6.2 • Lesson Overview • Lesson Notes
THINK ABOUT IT Our economy is built on the use of natural resources, so leaving those resources untouched is not an option. Humans need to eat, for example, so we can’t just stop cultivating land for farming. But the goods and services provided by healthy ecosys-tems are essential to life. We can’t grow anything in soil that has lost its nutrients due to overfarming. If we don’t properly manage agriculture, then, we may one day lose the natural resource on which it depends. So how do we fi nd a balance? How do we obtain what we need from local and global environments without destroying those environments?
0001_Bio10_se_Ch06_S2.indd 1 6/2/09 6:25:41 PM
desertifi cation,
Deforestation,
0001_Bio10_se_Ch06_S2.indd 2 6/2/09 6:25:49 PM
LESSO
N 6
.2
Getting Started
Objectives6.2.1 Describe how human activities affect soil and land.
6.2.2 Describe how human activities affect water resources.
6.2.3 Describe how human activities affect air resources.
Student ResourcesStudy Workbooks A and B, 6.2 Worksheets
Spanish Study Workbook, 6.2 Worksheets
Lab Manual B, 6.2 Data Analysis Worksheet
Lesson Overview • Lesson Notes • Activity: Art in Motion • Assessment: Self-Test, Lesson Assessment
For corresponding lesson in the Foundation Edition, see pages 132–137.
Build Background From a library, obtain a recording of Woody Guthrie’s Dust Bowl Ballads, and play the song “The Great Dust Storm” for students. Lyrics for this song can be found online. Explain that Guthrie, one of America’s great folksingers, lived during the “dust bowl” that occurred in the Great Plains during the 1930s. Describe the huge dust storms that occurred during the dust bowl, and point out the photo of a dust storm in Figure 6–5.
Teach for UnderstandingENDURING UNDERSTANDING The existence of life on Earth depends on interactions among organisms and between organisms and their environment.
GUIDING QUESTION How can we use our natural resources wisely?
EVIDENCE OF UNDERSTANDING After completing this lesson, give students the following assessment to show their understanding of sustainable resource use. Have students work in pairs to make a Flowchart that shows one example of how the environment may be harmed through human activities. For example, they might make a flowchart showing the process of desertification, deforestation, the formation of a dead zone in a body of water, or the formation of smog. Then, have them make a second flowchart that shows how the negative effects can be lessened by sustainable resource use. Place well-made flowcharts on the classroom wall.
Study Wkbks A/B, Appendix S25, Flowchart. Transparencies, GO8.
158 Chapter 6 • Lesson 2
0152_mlbio10_Ch06.indd 70152_mlbio10_Ch06.indd 7 6/29/09 5:11:10 PM6/29/09 5:11:10 PM

0001_Bio10_se_Ch06_S2.indd 1 6/2/09 6:25:41 PM
PacificOcean
AtlanticOcean
AtlanticOcean
Very highHighModerateLow
Vulnerability
DryColdHumid/Not vulnerable
Other Regions
N
EW
S
0
1,000 miles0
1,000 km
Soil Erosion The dust bowl of the 1930s was caused, in part, by conversion of prairie land to cropland in ways that left soil vulnerable to erosion. Soil erosion is the removal of soil by water or wind. Soil ero-sion is often worse when land is plowed and left barren between plantings. When no roots are left to hold soil in place, it is easily washed away. And when soil is badly eroded, organic matter and minerals that make it fertile are often carried away with the soil. In parts of the world with dry climates, a com bination of farming, overgrazing, sea-sonal drought, and climate change can turn farmland into desert. This process is called desertifi cation,desertifi cation, and it is what happened to the Great Plains in the 1930s. Roughly 40 percent of Earth’s land is considered at risk for desertifi cation. Figure 6–6 shows vul-nerable areas in North and South America.
Deforestation,Deforestation, or loss of forests, can also have a negative effect on soil quality. Healthy forests not only provide wood, but also hold soil in place, protect the quality of fresh water supplies, absorb carbon dioxide, and help moderate local climate. Unfortu-nately, more than half of the world’s old-growth forests (forests that had never been cut) have already been lost to deforestation. In some temperate areas, such as the East-ern United States, forests can regrow after cutting. But it takes centuries for succession to produce mature, old-growth forests. In some places, such as in parts of the tropics, forests don’t grow back at all after logging. This is why old-growth forests are usually considered nonrenewable resources.
Deforestation can lead to severe erosion, especially on mountainsides. Grazing or plowing after deforestation can permanently change local soils and microclimates in ways that prevent the regrowth of trees. Tropical rain forests, for example, look lush and rich, so you might assume they would grow back after logging. Unfortunately, topsoil in these forests is generally thin, and organic matter decom-poses rapidly under high heat and humidity. When tropi-cal rain forests are cleared for timber or for agriculture, their soil is typically useful for just a few years. After that the areas become wastelands, the harsh conditions there preventing regrowth.
In Your Notebook Describe the relationship between agriculture and soil quality.
Forests of palm trees with strong, tall trunks and edible seeds once covered most of Easter Island. Why would the islanders have cut down these forests? What effect would deforestation have had?
FIGURE 6–6 Desertifi cation Risk The U.S. Department of Agriculture assigns desertifi cation risk categories based on soil type and climate. Interpret Visuals Find your approximate location on the map. What category of desertifi cation risk is your area in?
Humans in the Biosphere 159
0001_Bio10_se_Ch06_S2.indd 2 6/2/09 6:25:49 PM
LESSO
N 6
.2
Humans in the Biosphere 159
Teach
Use VisualsHave students examine the map in Figure 6–6. Call on a student to read aloud the defi nition of desertifi-cation, and then discuss why some regions are at risk and some are not.
Ask What factors put a region at risk for desertifi ca-tion? (a dry climate combined with farming, over-grazing, seasonal drought, or climate change)
Ask Why isn’t the eastern United States at risk for desertifi cation? (That region of the United States doesn’t have a dry climate.)
DIFFERENTIATED INSTRUCTION
L3 Advanced Students Have interested students research the causes and effects of deforestation in the Amazon region of South America. Ask students to fi nd out whether deforestation in the Amazon has resulted in areas becoming wastelands, as described in their text.
Have students review the introduction to the Chapter Mystery to fi nd one rea-son why islanders cut down trees. (for
use as logs on which to move the moai) Encourage them to think of other reasons why societies cut down trees. (to burn wood for cooking and heating, to use wood in building houses) Students can go online to Biology.com to gather their evidence.
Quick Facts
THE DUST BOWL
The dust bowl of the 1930s was one of the worst environmental disasters in U.S. his-tory. Here are some quick facts about the dust bowl.
The main causes were drought and poor farming practices as natural grasslands • were converted for growing wheat in the early twentieth century.
States primarily affected by the dust bowl were Texas, Oklahoma, Kansas, Colorado, • and New Mexico.
Visibility during huge dust storms was reduced to less than 1 mile (1.6 km).•
By the mid-1930s, over 1 million acres of farmland had lost all or most of their • topsoil.
AnswersFIGURE 6–6 Answers will vary depending on students’ location. Areas in the eastern United States are not vulnerable to desertification. Many areas in the West have very high vulnerability.
IN YOUR NOTEBOOK Sample answer: Agriculture depends on healthy soil. Without nutrient-rich topsoil, crops cannot grow, and without crops or other plants, soil is more likely to erode.
0152_mlbio10_Ch06.indd 80152_mlbio10_Ch06.indd 8 6/29/09 5:11:42 PM6/29/09 5:11:42 PM

Soil Use and Sustainability It is possible to minimize soil erosion through careful management of both agriculture and forestry. Soil is most vulnerable to erosion when it is com-pletely bare. Leaving stems and roots of the previous year’s crop in the soil can help hold soil in place between plantings. And because different plants take different nutrients from the soil, crop rotation—planting different crops at different seasons or in dif-ferent years—can help prevent both erosion and nutrient loss.
Altering the shape of the land is another way to limit erosion. The practice of contour plowing, shown in Figure 6–7, involves planting fi elds of crops across, instead of down, the slope of the land. This can reduce water runoff and therefore erosion. Simi-larly, terracing—shaping the land to create level “steps”—helps hold water and soil.
What are options for sustainable forestry? Selectively harvest-ing mature trees can promote the growth of younger trees and preserve the forest ecosystem, including its soil. In the southeast-ern United States, conditions enable foresters to plant, harvest, and replant tree farms. A well-managed tree farm both protects the soil and makes the trees themselves a renewable resource.
Freshwater Resources What are the primary sources of water pollution?
Humans depend on fresh water and freshwater ecosystems for goods and services, including drinking water, industry, transpor-tation, energy, and waste disposal. Some of the most productive American farmland relies heavily on irrigation, in which fresh water is brought in from other sources.
While fresh water is usually considered a renewable resource, some sources of fresh water are not renewable. The Ogallala aquifer, for example, spans eight states from South Dakota to Texas. The aquifer took more than a million years to collect and is not replenished by rainfall today. So much water is being pumped out of the Ogallala that it is expected to run dry in 20 to 40 years. In many places, freshwater supplies are limited. Only 3 percent of Earth’s water is fresh water—and most of that is locked in ice at the poles. Since we can’t infi nitely expand our use of a fi nite resource, we must protect the ecosystems that col-lect and purify fresh water.
Water Pollution Freshwater sources can be affected by differ-ent kinds of pollution. A pollutantpollutant is a harmful material that can enter the biosphere. Sometimes pollutants enter water sup-plies from a single source—a factory or an oil spill, for example. This is called point source pollution. Often, however, pollutants enter water supplies from many smaller sources—the grease and oil washed off streets by rain or the chemicals released into the air by factories and automobiles. These pollutants are called nonpoint sources.
FIGURE 6–7 Contour Plowing Planting crops parallel to the land’s natural contours can help reduce soil erosion.
160 Chapter 6 • Lesson 2
0001_Bio10_se_Ch06_S2.indd 3 6/2/09 6:26:02 PM
Biological magnifi cation
0001_Bio10_se_Ch06_S2.indd 4 6/2/09 6:26:04 PM
LESSO
N 6
.2
Teach continued
Lead a DiscussionHold up a gallon of bottled water and a glass of tap water. Ask students to compare the sources of the water. (Sample answer: Most tap water is pro-duced at a local water plant or comes from a well; sources vary, but about one fourth of bottled water comes from municipal water supplies.) Then, ask what happens to the bottle after the water is con-sumed. (Sample answer: It’s usually thrown away; sometimes it’s recycled.) Finally, have students assess which water—bottled or tap—uses more of Earth’s resources and judge which is a wiser use of those resources.
DIFFERENTIATED INSTRUCTION
LPR Less Profi cient Readers Display a map of the United States, and show students the extent of the Ogallala aquifer, from South Dakota to northern Texas. Explain that an aquifer is an underground sup-ply of water that can be tapped for wells and used as a source of agricultural irrigation. Ask why this water is not an example of a renewable resource. (It would take too long to replenish if all the water were pumped out.)
ELL Focus on ELL: Extend Language
BEGINNER AND INTERMEDIATE SPEAKERS Have students make a Word Wall to help them learn lesson vocabulary terms, as well as any other difficult terms they encounter. On the word wall, students should divide terms into word parts, collaborate on writing a definition, make a pronunciation guide for each term, and, if possible, write translations for each term. Students can also add drawings to help them remember each term’s meaning.
Study Wkbks A/B, Appendix S17, Word Wall.
Biology In-Depth
OGALLALA AQUIFER
The Ogallala aquifer underlies parts of eight states, including South Dakota, Wyoming, Nebraska, Kansas, Colorado, New Mexico, Oklahoma, and Texas. The Ogallala is the main source of water throughout the area for irrigation, as well as home and industrial water needs. Most of the discharge from the aquifer is for agricultural irrigation, and farmers began withdrawing the water in the 1930s. The aquifer is recharged—that is, water is added—mainly by precipitation. Because of the high withdrawal rate and the low rate of recharge, the water level has declined as much as 100 feet in some areas since the 1940s. State and local governments have developed plans to promote water conservation, including more effi cient irriga-tion practices.
160 Chapter 6 • Lesson 2
0152_mlbio10_Ch06.indd 90152_mlbio10_Ch06.indd 9 6/29/09 5:11:58 PM6/29/09 5:11:58 PM

pollutant
0001_Bio10_se_Ch06_S2.indd 3 6/2/09 6:26:02 PM
Water
Producers
Zooplankton
Small Fish
Large Fish
Fish-Eating Birds Magnification of DDT Concentration
1
1000
10,000
100,000
1,000,000
10,000,000
Pollutants may enter both surface water and underground water supplies that we access with wells. Once contaminants are present, they can be extremely diffi cult to get rid of. The primary sources of water pollution are industrial and agricultural chemicals, resi-dential sewage, and nonpoint sources.
� Industrial and Agricultural Chemicals One industrial pollutant is a class of organic chemicals called PCBs that were widely used in industry until the 1970s. After several large-scale contamination events, PCBs were banned. However, because PCBs often enter mud and sand beneath bodies of water, they can be diffi cult, if not impossible, to eliminate. Parts of the Great Lakes and some coastal areas, for example, are still polluted with PCBs. Other harmful industrial pollutants are heavy metals like cadmium, lead, mercury, and zinc.
Large-scale monoculture has increased the use of pesticides and insecticides. These chemicals can enter the water supply in the form of runoff after heavy rains, or they can seep directly into groundwater. Pesticides can be very dangerous pollutants. DDT, which is both cheap and long lasting, effectively controls agricultural pests and disease-carrying mosquitoes. But when DDT gets into a water supply, it has disastrous effects on the organisms that directly and indirectly rely on that water—a function of a phenomenon called biological magnifi cation.
Biological magnifi cationBiological magnifi cation occurs if a pollutant, such as DDT, mercury, or a PCB, is picked up by an organism and is not broken down or eliminated from its body. Instead, the pol-lutant collects in body tissues. Primary producers pick up a pollutant from the environment. Herbivores that eat those producers concentrate and store the compound. Pollutant concentrations in herbivores may be more than ten times the levels in producers. When carnivores eat the herbivores, the compound is still further concentrated. Thus, pollut-ant concentration increases at higher trophic levels. In the highest trophic levels, pollutant concentrations may reach 10 million times their original concentration in the envi-ronment, as shown in Figure 6–8.
These high concentrations can cause serious prob-lems for wildlife and humans. Widespread DDT use in the 1950s threatened fi sh-eating birds like pelicans, osprey, falcons, and bald eagles. It caused females to lay eggs with thin, fragile shells, reducing hatching rates and causing a drop in bird populations. Since DDT was banned in the 1970s, bird populations have recovered. Still a concern is mercury, which accu-mulates in the bodies of certain marine fi sh such as tuna and swordfi sh.
In Your Notebook In your own words, explain the process of biological magnifi cation.
FIGURE 6–8 Biological Magnifi cation In the process of biological magnifi cation, the concentration of a pollutant like DDT—represented by the orange dots—is multiplied as it passes up the food chain from producers to consumers. Calculate By what number is the concentration of DDT multiplied at each successive trophic level?
Lesson 6.2 • Art in Motion 161
0001_Bio10_se_Ch06_S2.indd 4 6/2/09 6:26:04 PM
LESSO
N 6
.2
Humans in the Biosphere 161
Use VisualsBegin a discussion of Figure 6–8 by pointing out that the fi gure represents a food chain, which stu-dents learned about in Chapter 3. Point out that the pyramid shows the concentration of DDT as orange dots in each trophic level. After students have exam-ined the fi gure, ask them to fi ll in the blanks of this statement using the words decreases or increases.
In a food chain, the concentration of a pollutant • _____ (increases) as the number of organisms at a trophic level _____ (decreases).
DIFFERENTIATED INSTRUCTION
L1 Struggling Students Explain that the fi gure shows relative numbers, not absolute numbers. In other words, the fi gure is a model for how the con-centration of the pollutant is magnifi ed from one trophic level to the next higher level.
Ask If the level of a pollutant were 2 parts per mil-lion at the fi rst trophic level, what would its concen-tration be at the second trophic level? (20 parts per million, or 2 × 10)
Students can watch an animation of biological magnifi cation by accessing Art in Motion: Biological Magnifi cation.
Address MisconceptionsPollutants in a Food Chain Some students may believe that pollutants such as DDT undergo no changes as they move through a food chain. Explain that chemicals may affect different kinds of animals dif-ferently, and chemicals may change in form as they move through a food chain. Point out that DDT was once widely used in the United States because it was effective in killing insects, mainly by affecting insect nervous systems. In fi sh-eating birds, though, the chemical affects the formation of eggshells, which was not foreseen by those who spread the chemical.
How Science Works
USES OF DDT
The pesticide DDT (dichloro-diphenyl-trichloroethane) was discovered in the 1940s, and was fi rst used during World War II to control body lice. In the 1950s, DDT was used extensively to combat diseases spread by insects and for insect control in gen-eral. In the United States, the use of DDT declined after the publication of Silent Spring by Rachel Carson in 1962. The book widely publicized the harmful effects of the pesticide. Since the 1970s, the use of DDT has been banned in many countries, including the United States and Canada. Because of its success in controlling disease-carrying insects, though, DDT has continued to be used in other parts of the world. In 2006, the World Health Organization (WHO) approved its use in Africa to fi ght malaria-carrying mosquitoes.
AnswersFIGURE 6–8 10
IN YOUR NOTEBOOK Sample answer: Biological magnification is the process by which a pollutant becomes more concentrated in the bodies of organisms at higher trophic levels.
0152_mlbio10_Ch06.indd 100152_mlbio10_Ch06.indd 10 6/29/09 5:12:12 PM6/29/09 5:12:12 PM

� Residential Sewage Have you ever stopped to think what happens after you fl ush your toilet? Those wastes don’t disappear! They become residential sewage. Sewage isn’t poisonous, but it does contain lots of nitrogen and phosphorus. Reasonable amounts of these nutrients can be processed by and absorbed into healthy ecosystems. But large amounts of sewage can stimulate blooms of bacteria and algae that rob water of oxygen. Oxygen-poor areas called “dead zones” can appear in both fresh and salt water. Raw sewage also contains microor-ganisms that can spread disease.
Water Quality and Sustainability One key to sustainable water use is to protect the natural systems involved in the water cycle. For example, as water fl ows slowly through a wetland, densely growing plants absorb some excess nutrients and fi lter out certain pollutants. Similarly, forests and other vegetation help purify water that seeps into the ground or runs off into rivers and lakes. Protecting these ecosys-tems is a critical part of watershed conservation. A watershed includes all the land whose groundwater, streams, and rivers drain into the same place—such as a large lake or river. The idea behind watershed conservation is simple: Cleaning up the pollution in a local area can’t do much good if the water running into it is polluted. You must con-sider the entire watershed to achieve long-lasting results.
Pollution control can have direct and positive effects on the water quality in a watershed. Sewage treatment can lower levels of sewage-associated bacteria and help prevent dead zones in bodies of water receiving the runoff. In some situations, agriculture can use integrated pest management (IPM) instead of pesticides. IPM techniques include biological control—using predators and parasites to regulate for pest insects—the use of less-poisonous sprays, and crop rotation.
Conserving water is, of course, also important. One example of water conservation in agriculture is drip irrigation, shown in Figure 6–9, which delivers water drop by drop directly to the roots of plants that need it.
BUILD VocabularyRELATED WORD FORMS The verb purify is related to the noun pure. To purify means “to make pure or clean.” Wetlands purify water by removing pollutants.
FIGURE 6–9 Drip Irrigation These cabbages are supplied water directly to their roots through drip irrigation. Tiny holes in water hoses (inset) allow farmers to deliver water only where it’s needed.
162 Chapter 6 • Lesson 2
0001_Bio10_se_Ch06_S2.indd 5 6/2/09 6:26:08 PM
smog,
0001_Bio10_se_Ch06_S2.indd 6 6/2/09 6:26:13 PM
162 Chapter 6
LESSO
N 6
.2
Teach continued
Connect to Earth ScienceMake sure students understand the idea behind watershed conservation—that cleaning up pollution in a local area does no good if nothing is done about water pollution elsewhere in the watershed. Show students a map of their state or their region. Have them identify a river that runs through or close to their community. Then, have them try to identify the watershed their river is part of. What body of water does their river run into? What river runs into their river? Suggest various places where the watershed might be polluted, and have students identify com-munities downstream from that source that would be affected by the pollution.
DIFFERENTIATED INSTRUCTION
L1 Special Needs To help students understand watersheds, use clay to create a tactile model of a branching river system. Explain to students that if a pollutant were added to one river branch, it would eventually fi nd its way into larger and larger riv-ers until it reached the ocean. Have students trace the path of a pollutant molecule from a site on one river branch through the waterways in their model watershed.
L3 Advanced Students Point out that water con-servation is important to the sustainable use of water resources. Ask students to brainstorm ideas about how they can conserve water in their own lives. Have them use their ideas to make a poster or pamphlet that could be used to inform the public about simple ways to conserve water.
Biology In-Depth
TURNING WASTE INTO ENERGY
Some companies have been developing technology that turns waste matter and industrial pollution into energy resources. For example, with the support of the U.S. Environmental Protection Agency (EPA), a Georgia company has developed a proc-ess that converts municipal sewage and other organic wastes into a high-energy liquid fuel. This fuel burns more cleanly than coal. In addition to the production of a new energy source, this process eliminates problems associated with waste disposal, including odor, the release of air pollutants, and the use of land for landfi lls.
162 Chapter 6 • Lesson 2
0152_mlbio10_Ch06.indd 110152_mlbio10_Ch06.indd 11 6/29/09 5:12:23 PM6/29/09 5:12:23 PM

0001_Bio10_se_Ch06_S2.indd 5 6/2/09 6:26:08 PM
Atmospheric Resources What are the major forms of air pollution?
The atmosphere is a common resource whose quality has direct effects on health. After all, the atmosphere provides the oxygen we breathe! In addition, ozone, a form of oxygen that is found naturally in the upper atmosphere, absorbs harmful ultraviolet radiation from sunlight before it reaches Earth’s surface. It is the ozone layer that protects our skin from damage that can cause cancer.
The atmosphere provides many other services. For example, the atmosphere’s greenhouse gases, including carbon dioxide, methane, and water vapor, regulate global temperature. As you’ve learned, without the greenhouse effect, Earth’s average temperature would be about 30° Celsius cooler than it is today.
The atmosphere is never “used up.” So, classify-ing it as a renewable or nonrenewable resource is not as important as understanding how human activi-ties affect the quality of the atmosphere. For most of Earth’s history, the quality of the atmosphere has been naturally maintained by biogeochemical cycles. How-ever, if we disrupt those cycles, or if we overload the atmosphere with pollutants, the effects on its quality can last a very long time.
Air Pollution What happens when the quality of Earth’s atmosphere is reduced? For one thing, respira-tory illnesses such as asthma are made worse and skin diseases tend to increase. Globally, climate patterns may be affected. What causes poor air quality? Industrial processes and the burning of fossil fuels can release pollutants of several kinds. Common forms of air pollution include smog, acid rain, greenhouse gases, and particulates.
� Smog If you live in a large city, you’ve probably seen smog,smog, a gray-brown haze formed by chemical reactions among pollutants released into the air by industrial processes and automobile exhaust. Ozone is one product of these reactions. While ozone high up in the atmosphere helps protect life on Earth from ultraviolet radiation, at ground level, ozone and other pollutants threaten the health of people, especially those with respiratory conditions. Many athletes participating in the 2008 Summer Olympics in Beijing, China, expressed concern over how the intense smog, seen in Figure 6–10, would affect their performance and health.
In Your Notebook Compare and contrast the atmosphere as a resource with fresh water as a resource.
FIGURE 6–10 Smog Despite closing factories and restricting vehicle access to the city, Beijing remained under a blanket of dense smog just days before the 2008 Summer Olympics. Apply Concepts What component of smog is benefi cial when part of the atmosphere, but harmful when at ground level?
Humans in the Biosphere 163
0001_Bio10_se_Ch06_S2.indd 6 6/2/09 6:26:13 PM
LESSO
N 6
.2
Humans in the Biosphere 163
Check for Understanding
INDEX CARD SUMMARIES
Give each student an index card, and ask them to write one concept they understand about using resources wisely on the front of the card. Then, have them write some-thing about using resources wisely that they do not understand on the back of the card in the form of a question.
ADJUST INSTRUCTION
Read over students’ cards to get a sense of which concepts they are having trouble with. If the question will be answered by reading the rest of the chapter, such as by reading the case studies in Lesson 6.4, use the card to emphasize a concept. If the answer to the question is necessary to move forward, review the topic as a class to allow students to hear the concept discussed in different ways.
Build Reading SkillsExplain that making an outline can help students understand the material and put it in a useful form for review. Have each student outline the subsec-tion Air Pollution. Begin the outline on the board by writing the title Air Pollution. Tell students the primary heads of the outline should be the four com-mon forms of air pollution described: Smog, Acid Rain, Greenhouse Gases, and Particulates. Under each primary head, they should add details about that form of air pollution. After they have fi nished their outlines, divide the class into small groups to compare outlines. Ask students to revise their out-lines as they talk with other group members about the details they included.
DIFFERENTIATED INSTRUCTION
ELL English Language Learners Point out to English language learners that the term smog may remind them of another English word, fog. Explain that the two words are related. The origins of smog come from a description of this form of pollution in the early twentieth century, when gray-brown haze was described as a “smoky fog.” Parts of the two words were put together to make the word smog.
AnswersFIGURE 6–10 ozone
IN YOUR NOTEBOOK Sample answer: Both the atmosphere and fresh water are needed for healthy ecosystems, and both can be contaminated with pollutants. Fresh water is usually considered a renewable resource, though some sources of fresh water are not renewable. Fresh water may be possible to treat if it’s polluted. The atmosphere is never used up, and so it is neither renewable nor nonrenewable—but to protect the atmosphere, we need to prevent pollutants from being released in the first place.
0152_mlbio10_Ch06.indd 120152_mlbio10_Ch06.indd 12 6/29/09 5:12:39 PM6/29/09 5:12:39 PM

� Acid Rain When we burn fossil fuels in our factories and homes, we release nitrogen and sulfur compounds. When those compounds combine with water vapor in the air, they form nitric and sulfuric acids. These airborne acids can drift for many kilometers before they fall as acid rain.acid rain. Acidic water vapor can also affect ecosystems as fog or snow. In some areas, acid rain kills plants by damaging their leaves and changing the chemistry of soils and surface water. Examples of its effects are shown in Figure 6–11. Acid precipitation also can dissolve and release mercury and other toxic elements from soil, free-ing those elements to enter other parts of the biosphere.
In Your Notebook Create a fl owchart that shows the steps in acid rain formation.
� Greenhouse Gases Burning fossil fuels and forests releases stored carbon into the atmosphere as carbon dioxide, a greenhouse gas. Agricultural prac-tices from raising cattle to farming rice release methane, another greenhouse gas. Although some greenhouse gases are necessary, when excess greenhouse gases accumulate in the atmosphere, they contribute to global warming and climate change.
� Particulates Particulates are micro-scopic particles of ash and dust released by certain industrial processes and cer-tain kinds of diesel engines. Very small particulates can pass through the nose and mouth and enter the lungs, where they can cause serious health problems.
American Air Pollution TrendsEach year, the U.S. Environmental Protection Agency (EPA) estimates emissions from a variety of sources. Look at the graph in Figure 6–12. The combined emissions of six common pollutants are plotted along with trends in energy consumption and automobile travel between 1980 and 2007. The values shown are the total percentage change. For example, in 1995, aggregate emissions had dropped about 30 percent from their level in 1980.
1. Interpret Data Describe the overall trend in emissions since 1980. Is this what you would expect given the trends in energy consumption and automobile travel? Explain your answer.
2. Interpret Data How does this graph differ from one that shows absolute values for emissions? Would that graph start at zero as this one does?
3. Infer What do you think has contributed to the trends you see in this graph? Why would the EPA be particularly interested in these data?
FIGURE 6–11 Acid Rain Acid rain results from the chemical transformation of nitrogen and sulfur products that come from human activities. These reactions can cause damage to stone statues and plant life.
164 Chapter 6 • Lesson 2
0001_Bio10_se_Ch06_S2.indd 7 6/2/09 6:26:16 PM 0001_Bio10_se_Ch06_S2.indd 8 6/2/09 6:26:19 PM
LESSO
N 6
.2
Teach continued
Use VisualsHave students examine the effects of acid rain in Figure 6–11.
Ask What human activities produce the nitrogen and sulfur compounds that result in acid rain? (the burn-ing of fossil fuels)
Point out that fossil fuels are burned in homes, in addition to factories.
Ask What do most Americans use in their homes that ultimately is derived from the burning of fossil fuels? (They use electricity, which is often produced in coal-fired or oil-fired power plants. Home heating is also usually generated by either oil or natural gas.)
DIFFERENTIATED INSTRUCTION
L3 Advanced Students Have students collect samples of rainwater from various outdoor loca-tions. Provide them with litmus paper for testing the pH of each sample. Have them also test tap water and compare the pH of the samples with the pH of tap water. Explain that all rainwater is slightly acidic (pH 6–7) because of carbon dioxide in the air. A pH of less than 5.5 qualifi es as acid rain. Have students report their fi ndings to the class.
ANSWERS
Sample answer:1. The overall trend is a decrease in emissions. This is unexpected, because the trend for vehicle miles traveled has risen sharply during the same period. The trend for energy consumption has also risen, though not as sharply.
Sample answer:2. That graph would not start at zero for emissions. Rather, the label on the vertical axis would be a measure of emissions, such as parts per million, and the
graph would start with the absolute value for emissions in 1980.
Sample answer:3. The trend in emissions is likely the result of improvements in technol-ogy such as more-efficient vehicle engines and less-polluting gasoline and other fuels. Part of the EPA’s job is to develop environ-mental regulations such as gas mileage man-dates. These data show that, at least in part, these regulations have been working.
AnswersIN YOUR NOTEBOOK Flowcharts may vary, but should include this basic information: (1) Burning fossil fuels releases nitrogen and sulfur compounds. (2) The compounds combine with water vapor in the air and form nitric and sulfuric acids. (3) The acids can drift for many kilometers before falling as acid rain.
PURPOSE Students will interpret data about air pollution trends in the United States and infer what contributed to those trends.
PLANNING Review with students how the burning of fossil fuels contributes to air pollution. Point out that the graph shows percent change, not absolute values. Make sure students understand what an absolute value for each of the three variables (vehicle miles traveled, energy consumption, and aggregate emissions) might be.
164 Chapter 6 • Lesson 2
0152_mlbio10_Ch06.indd 130152_mlbio10_Ch06.indd 13 6/29/09 5:12:50 PM6/29/09 5:12:50 PM

acid rain.
0001_Bio10_se_Ch06_S2.indd 7 6/2/09 6:26:16 PM
Emission and Growth Trends
Perc
ent C
hang
e
0
20
40
60
80
100
120
1980 1995 1998 2001 2004 2007Year
60
40
20
Energy consumption
Vehicle miles traveled
Aggregate emissions (six common pollutants)
Air Quality and Sustainability Improving air quality is diffi -cult. Air doesn’t stay in one place and doesn’t “belong” to anyone. Automobile emission standards and clean-air regulations have improved air quality in some regions, however, and seem to be hav-ing a net positive effect, as shown in Figure 6–12. Efforts like these also have improved the atmosphere globally. At one time, for example, all gasoline was enriched with lead. But as leaded gasoline burned, lead was released in exhaust fumes and ultimately washed onto land and into rivers and streams. U.S. efforts to phase out leaded gasoline started in 1973 and were completed in 1996 when the sale of leaded gasoline was banned. Now that unleaded gasoline is used widely across the United States, lead levels in soils, rivers, and streams around the country have dropped signifi cantly from earlier, higher levels.
Review Key Concepts 1. a. Review What causes soil erosion? Why is
soil erosion a problem? b. Apply Concepts What are three ways in
which the agriculture and forestry industries can improve the sustainability of soil?
2. a. Review How is fresh water both a renewable and a limited resource?
b. Explain Why are some pollutants more harmful to organisms at higher trophic levels?
c. Propose a Solution Pick one source of water pollution and describe a way in which we can reduce its effect.
3. a. Review What ecological goods and services does the atmosphere provide?
b. Relate Cause and Effect How does the use of fossil fuels negatively impact Earth’s atmosphere?
4. Look at Figure 6–8. If the concentration of DDT in zooplankton measures 0.04 parts per million, what is the approximate concentra-tion of DDT at each other trophic level shown?
Lesson 6.2 • Self-Test • Lesson Assessment
FIGURE 6–12 Air Pollution Trends This graph summarizes EPA fi ndings of the total percentage change from 1980 to 2007 in vehicle miles traveled, energy consumption, and the combined emissions of six common pollutants—carbon monoxide, lead, nitrogen oxides, organic compounds, particulates, and sulfur dioxide. Calculate In 1980, motorists in the Puget Sound region of Washington State traveled 36.4 million miles. Assuming that these motorists increased their miles traveled at the national rate, approximately how many miles did they travel in 2007?
Humans in the Biosphere 165
0001_Bio10_se_Ch06_S2.indd 8 6/2/09 6:26:19 PM
LESSO
N 6
.2
Humans in the Biosphere 165
Assess and RemediateEVALUATE UNDERSTANDING
Call on students at random to identify specifi c human activities that result in harm to soil resources, freshwater resources, and atmospheric resources. Then, have students complete the 6.2 Assessment.
REMEDIATION SUGGESTION
L1 Struggling Students If your students have diffi culty answering Question 4, make sure they fi rst understand by what number the pollutant is multiplied at each successive level. Then, make sure students understand that the concentration of 0.04 ppm is for the second trophic level. Finally, help them fi nd the concentration for the fi rst level by dividing by 10, and for levels above the second level by multi-plying by 10 at each successive level.
Students can check their under-standing of lesson concepts with the Self-Test assessment. They can then take an online version of the Lesson Assessment.
AnswersFIGURE 6–12 72.8 million miles
1a. Sample answer: Soil erosion is caused when no roots are left to hold soil in place. When soil is badly eroded, organic matter and minerals that make it fertile are often carried away with the soil.
1b. Sample answer: Leaving stems and roots of the previous year’s crop in the soil between plantings can help hold soil in place. Crop rotation can help prevent soil erosion. The practice of contour plowing can limit erosion.
Assessment Answers 3a. the oxygen we breathe, the ozone layer that absorbs harmful ultraviolet radiation, and the greenhouse gases that regulate global temperature
3b. The burning of fossil fuels releases pollu-tants of several kinds, including green-house gases, particulates, and the pollu-tants that produce smog and acid rain.
4. Producers, 0.004 ppm; small fish, 0.4 ppm; larger fish, 4 ppm; fish-eating birds, 40 ppm
2a. Sample answer: The water cycle naturally renews Earth’s fresh water. In some places, though, freshwater supplies are limited.
2b. Some pollutants are more harmful to organisms at higher trophic levels because they undergo biological magnification and become more concentrated in the bodies of organisms at these levels.
2c. Sample answer: Agricultural chemicals are one source of water pollutants. We could reduce their effects by using as little fertil-izer as possible.
0152_mlbio10_Ch06.indd 140152_mlbio10_Ch06.indd 14 6/29/09 5:13:02 PM6/29/09 5:13:02 PM

NATIONAL SCIENCE EDUCATION STANDARDS
UNIFYING CONCEPTS AND PROCESSES
I, II, III, IV
CONTENT
C.4.c, C.4.d, C.4.e, C.5.e, F.2, F.3, F.4, F.5, F.6
INQUIRY
A.1.c, A.2.a, A.2.d
The Value of Biodiversity Why is biodiversity important?
Biological diversity, or biodiversity,biodiversity, is the total of all the genet ically based variation in all organisms in the biosphere. To biologists, biodi-versity is precious, worth preserving for its own sake. But what kinds of biodiversity exist, and what value do they offer society?
Types of Biodiversity Biodiversity exists on three levels: ecosystem diversity, species diversity, and genetic diversity. Ecosystem diversityEcosystem diversity refers to the variety of habitats, communities, and ecological processes in the biosphere. The number of different species in the biosphere, or in a particular area, is called species diversity.species diversity. To date, biologists have identifi ed and named more than 1.8 million species, and they estimate that at least 30 million more are yet be discovered. Much of this diversity exists among single-celled organisms. But new species of vertebrates, like the snake in Figure 6–13, are still being found.
Genetic diversityGenetic diversity can refer to the sum total of all different forms of genetic information carried by a particular species, or by all organisms on Earth. Within each species, genetic diversity refers to the total of all different forms of genes present in that species. In many ways, genetic diversity is the most basic kind of biodiversity. It is also the hardest kind to see and appreciate. Yet, genetic diversity is vitally important to the survival and evolution of species in a changing world.
Biodiversity
Key Questions Why is biodiversity
important?
What are the most signifi cant threats to biodiversity?
How do we preserve biodiversity?
Vocabularybiodiversityecosystem diversityspecies diversitygenetic diversityhabitat fragmentationecological hot spot
Taking NotesPreview Visuals Before you read, look at Figure 6–20. Record three questions you have about the map. When you’ve fi nished reading, answer the questions.
FIGURE 6–13 A New Species This tiny snake, native to the island of Barbados, is one of many recently discovered species. Photos of the snake were released in 2008. Infer Why are you more likely to discover a new vertebrate species in a tropical area than in a desert?
166 • Lesson Overview • Lesson NotesLesson 6.3
THINK ABOUT IT Those of us who love nature are awed by the incredible variety of living things that share our planet. From mul-ticolored coral reefs to moss-draped forests, variety, is “the spice of life.” But variety in the biosphere gives us more than interesting things to look at. Our well-being is closely tied to the well-being of a great number of other organisms, including many that are neither majestic nor beautiful to our eyes.
0001_Bio10_se_Ch06_S3.indd 1 6/2/09 6:26:51 PM 0001_Bio10_se_Ch06_S3.indd 2 6/2/09 6:26:58 PM
LESSO
N 6
.3
Getting Started
Objectives6.3.1 Define biodiversity and explain its value.
6.3.2 Identify current threats to biodiversity.
6.3.3 Describe how biodiversity can be preserved.
Student ResourcesStudy Workbooks A and B, 6.3 Worksheets
Spanish Study Workbook, 6.3 Worksheets
Lab Manual B, 6.3 Data Analysis Worksheet
Lesson Overview • Lesson Notes • Activities: Data Analysis, Art Review • Assessment: Self-Test, Lesson Assessment
For corresponding lesson in the Foundation Edition, see pages 138–142.
Build BackgroundShow students photos of ivory products. Explain that the source of ivory is mostly of elephant tusks. Point out that there are laws against killing elephants to take their tusks, and trade in ivory products has been banned by international law, but a market for ivory still exists. Ask students to predict how this demand for ivory affects elephant populations and the biosphere.
Teach for UnderstandingENDURING UNDERSTANDING The existence of life on Earth depends on interactions among organisms and between organisms and their environment.
GUIDING QUESTION Why is it important to protect and conserve biodiversity?
EVIDENCE OF UNDERSTANDING After completing this lesson, give students the following assessment to show they understand the importance of conserving biodiversity. Have students work in pairs. Ask each pair to create a cartoon strip of six to eight panels that explains one way to conserve biodiversity. Ask volunteers to pass around their comic strips to other students in the class.
166 Chapter 6 • Lesson 3
AnswersFIGURE 6–13 Sample answer: There is much greater species diversity in a tropical area than in a desert. Ecosystem diversity is also greater in a tropical area.
0152_mlbio10_Ch06.indd 150152_mlbio10_Ch06.indd 15 6/29/09 5:13:13 PM6/29/09 5:13:13 PM

biodiversity,
Ecosystem diversity
species diversity.
Genetic diversity
0001_Bio10_se_Ch06_S3.indd 1 6/2/09 6:26:51 PM
Valuing Biodiversity You can’t touch, smell, or eat biodiversity, so many people don’t think of it as a natural resource. But biodiversity is one of Earth’s greatest natural resources. Biodiversity’s benefi ts to society include contributions to medicine and agriculture, and the provision of ecosystem goods and services. When bio-diversity is lost, signifi cant value to the biosphere and to humanity may be lost along with it.
� Biodiversity and Medicine Wild species are the origi-nal source of many medicines, including painkillers like aspirin and antibiotics like penicillin. The chemicals in wild species are used to treat diseases like depression and cancer. For example, the foxglove, shown in Figure 6–14, contains compounds called digitalins that are used to treat heart disease. These plant compounds are assembled according to instructions coded in genes. So the genetic information carried by diverse species is like a “natural library” from which we have a great deal to learn.
� Biodiversity and Agriculture Genetic diversity is also important in agriculture. Most crop plants have wild rela-tives, like the potatoes in Figure 6–15. These wild plants may carry genes we can use—through plant breeding or genetic engineering—to transfer disease or pest resistance, or other useful traits, to crop plants.
� Biodiversity and Ecosystem Services The number and variety of species in an ecosystem can infl uence that ecosystem’s stability, productivity, and value to humans. Sometimes the presence or absence of a single keystone species, like the sea otter in Figure 6–16, can completely change the nature of life in an ecosystem. Also, healthy and diverse ecosystems play a vital role in maintaining soil, water, and air quality.
FIGURE 6–14 Medicinal Plants Digoxin, a drug derived from digitalin compounds in the foxglove plant, is used to treat heart disease.
FIGURE 6–15 Potato Diversity The genetic diversity of wild potatoes in South America can be seen in the colorful varieties shown here. The International Potato Center, based in Peru, houses a “library” of more than 4500 tuber varieties.
FIGURE 6–16 Keystone Species The sea otter is a keystone species. When the otter population falls, the population of its favorite prey, sea urchins, goes up. Population increases in sea urchins, in turn, cause a dramatic decrease in the population of sea kelp, the sea urchin’s favorite food.kelp, the sea urchin s favo
Lesson 6.3 • Data Analysis 167
0001_Bio10_se_Ch06_S3.indd 2 6/2/09 6:26:58 PM
LESSO
N 6
.3
Humans in the Biosphere 167
Teach
Lead a DiscussionAs a class, discuss the value of biodiversity, including the types of biodiversity and biodiversity’s benefi ts to society. Make sure students understand that biodi-versity exists on three levels: ecosystem diversity, spe-cies diversity, and genetic diversity.
Ask If an ecologist were to describe the num-ber and variety of habitats in a biome, what level of biodiversity would he or she be referring to? (ecosystem diversity)
Ask What could happen that would cause farmers to turn to a wild relative of a crop plant? (Sample answer: A devastating disease could spread through a crop. If a wild relative were resistant to the disease, then farmers could turn to those plants to replace or modify the crop plants.)
DIFFERENTIATED INSTRUCTION
ELL English Language Learners Tell students that the term biodiversity is a shortened form of biologi-cal diversity. Explain that diversity means “a variety.” Talking about biodiversity, then, is a way of talking about the variety of organisms in an ecosystem or in the biosphere. Point out that they may have heard the term diversity used in describing the population of the United States, which includes a diversity of races and ethnic groups.
LPR Less Profi cient Readers Have students make bulleted lists under the headings Biodiversity and Medicine, Biodiversity and Agriculture, and Bio-diversity and Ecosystem Services. Each list should include details and examples about benefi ts of biodi-versity to society.
Students compare data from two sites and learn to quantify biodiversity in the activity Data Analysis: Measuring Biodiversity.
Biology In-Depth
A KEYSTONE SPECIES
When a keystone species is removed from an ecosystem, dramatic changes usually follow. The sea otter is an example of a keystone species in the intertidal zone. This mammal once was native to much of the Pacifi c Coast of the North America. Hunting sea otters for fur caused their decline in the nineteenth century. Now, sea otter popu-lations have been restored in some areas, such as California and southeastern Alaska. Where sea otters have returned, the population of sea urchins has declined, because otters hunt sea urchins. Kelp forests have grown, because sea urchins eat kelp. And, the population of bald eagles has increased, because bald eagles eat fi sh that thrive in kelp forests.
0152_mlbio10_Ch06.indd 160152_mlbio10_Ch06.indd 16 6/29/09 5:13:38 PM6/29/09 5:13:38 PM

Threats to Biodiversity What are the most signifi cant threats to biodiversity?
Species have been evolving, changing, and dying out since life began. In fact scientists estimate that over 99 percent of the species that have ever lived are now extinct. So extinction is not new. But human activ-ity today is causing the greatest wave of extinctions since dinosaurs disappeared. The current rate of species loss is approaching 1000 times the “typical” rate. And as species disappear, the potential contribution to human knowledge that is carried in their genes is lost.
Species diversity is related to genetic diversity. The more genetically diverse a species is, the greater its chances of surviving disturbances. So, as human activity reduces genetic diversity, species are put at a greater risk for extinction. Species diversity, in turn, is linked to eco-system diversity. Therefore, as ecosystems are damaged, the organisms that inhabit them become more vulnerable to extinction.
How are humans infl uencing biodiversity? Humans reduce biodiversity by altering habitats, hunting, introducing invasive species, releasing pollution into food webs, and contributing to climate change. Biologists compare loss of biodiversity to destroying a library before its books are ever read.
Altered Habitats When natural habitats are eliminated for agricul-ture or for urban development, the number of species in those habi-tats drops, and some species may become extinct. But, habitats don’t need to be completely destroyed to put species at risk. Development often splits ecosystems into pieces, a process called habitat fragmentation,habitat fragmentation, leaving habitat “islands.” You probably think of islands as bits of land surrounded by water, but a biological island can be any patch of habi-tat surrounded by a different habitat, as shown in Figure 6–17. The smaller a habitat island, the fewer the species that can live there and the smaller their populations. Both changes make habitats and species more vulnerablevulnerable to other disturbance.
BUILD VocabularyACADEMIC WORDS The adjective vulnerablevulnerable means “open to attack or damage.” Fragmented habitats are more vulnerable, or more apt to be damaged, than larger undisturbed habitats because they contain fewer species and smaller populations of organisms.
Easter Island probably never had the biological diversity of Hawaii and many other tropical islands. How would this affect its ability to rebound after a disturbance?
FIGURE 6–17 Habitat Fragmentation Deforestation for housing developments in Florida has led to the pattern of forest “islands” shown here. Habitat fragmentation limits biodiversity and the potential size of populations.
Lesson 6.3 • Art Review168
0001_Bio10_se_Ch06_S3.indd 3 6/2/09 6:27:07 PM 0001_Bio10_se_Ch06_S3.indd 4 6/2/09 6:27:11 PM
LESSO
N 6
.3
Teach continued
Connect to the Real WorldAfter students have read about habitat fragmen-tation, call on volunteers to name parks or other natural areas in their community. Make a list of these natural areas on the board. Then, have students esti-mate the size of each area on the list (or look up the areas ahead of time). Add the square areas of all the parks together, and circle the sum.
Ask What difference would it make to the area’s bio-diversity if there were one natural area equal in size to the sum of all the existing natural areas? (Sample answer: There would be greater biodiversity in the one big area, with more genetic diversity and likely more species diversity.)
DIFFERENTIATED INSTRUCTION
L1 Struggling Students To help students under-stand habitat fragmentation, have them think of a busy highway with forests on either side. What happens to animals when they try to cross the road to the other part of the forest—habitat that was once part of their geographic range? Often, they are injured or killed; this is a consequence of habitat fragmentation.
Discuss with students why a lack of bio-diversity can make organisms more vul-nerable to extinction and less able to
survive disturbances caused by human activities. Stu-dents can go online to Biology.com to gather their evidence.
Have students use Art Review: Threats to Biodiversity to drag and drop labels onto a photo showing a region that has been developed by humans.
Quick Facts
MAMMAL EXTINCTIONS
In 2008, the International Union for Conservation of Nature (IUCN) released the results of a study of mammals and extinction. The study involved more than 1700 scientists in 130 countries. The fi ndings included these:
Of the 5487 species of mammals they counted in the world, at least 1141, or about • 21 percent, face extinction.
The organization listed 188 mammal species as critically endangered and another • 29 mammal species as possibly already extinct.
In the last 500 years, 76 mammal species have become extinct.•
The loss or degradation of habitat is affecting 40 percent of the world’s mammal • species.
168 Chapter 6 • Lesson 3
0152_mlbio10_Ch06.indd 170152_mlbio10_Ch06.indd 17 6/29/09 5:13:51 PM6/29/09 5:13:51 PM

habitat fragmentation,
vulnerable
vulnerable
0001_Bio10_se_Ch06_S3.indd 3 6/2/09 6:27:07 PM
Hunting and the Demand for Wildlife Products Humans can push species to extinction by hunting. In the 1800s, hunting wiped out the Carolina parakeet and the passenger pigeon. Today endangered species in the United States are protected from hunting, but hunting still threatens rare animals in Africa, South America, and Southeast Asia. Some animals, like many birds, are hunted for meat. Others are hunted for their commercially valuable hides or skins or because people believe their body parts have medicinal properties. Still others, like the parrots in Figure 6–18, are hunted to be sold as pets. Hunted species are affected even more than other species by habitat fragmen-tation because fragmentation increases access for hunters and limits available hiding spaces for prey. The Convention on International Trade in Endangered Species (CITES) bans international trade in products from a list of endangered species. Unfortunately, it’s diffi cult to enforce laws in remote wilderness areas.
Introduced Species Recall that organisms introduced to new habi-tats can become invasive and threaten biodiversity. For example, more than 130 introduced species live in the Great Lakes, where they have been changing aquatic ecosystems and driving native species close to extinction. One European weed, leafy spurge, infests millions of hectares across the Northern Great Plains. On rangelands, leafy spurge displaces grasses and other food plants, and its milky latex can sicken or kill cattle and horses. Each year, ranchers and farmers suffer losses of more than $120 million because of this single pest.
Pollution Many of the pollutants described in the last lesson also threaten biodiversity. DDT, for example, prevents birds from laying healthy eggs. In the United States, brown pelican, peregrine falcon, and other bird populations plummeted with widespread use of the chemi-cal. Acid rain places stress on land and water organisms. Increased car-bon dioxide in the atmosphere is dissolving in oceans, making them more acidic, which threatens biodiversity on coral reefs and in other marine ecosystems.
In Your Notebook Why is acidic water harmful to coral?
Almost all the coconut shells found by researchers on Easter Island show signs of having been gnawed on by nonnative rats. Coconuts contain the seeds of the coconut palm. What effect do you think the rats had on the coconut palm population?
FIGURE 6–18 Hunted and Sold as Pets These caged green parrots were captured in the Amazon rainforest and brought to a market in Peru. Infer What impact do you think hunting has on the animals left behind?
Humans in the Biosphere 169
0001_Bio10_se_Ch06_S3.indd 4 6/2/09 6:27:11 PM
LESSO
N 6
.3
Humans in the Biosphere 169
Build Study SkillsDivide the class into small groups, and have each group discuss the fi ve signifi cant threats to biodi-versity. Encourage students to ask group members for help in clarifying any concept they do not under-stand. Then, ask each group to write ten questions, two for each threat. After groups have fi nished writ-ing their questions, pair up groups and have group members ask each other their questions.
DIFFERENTIATED INSTRUCTION
L3 Advanced Students Ask a small group of stu-dents to work together to access the Web site for the Convention on International Trade in Endangered Species (CITES) to fi nd out more about what the agreement is and how it works. Have the students prepare a brief presentation about the agreement.
Have students infer where the non-native rats came from. (The ships brought them to the island. The rats
were the mammalian “stowaways.”) Then, have stu-dents describe how they think the rats likely affected the coconut palm population. Students can go online to Biology.com to gather their evidence.
Quick Facts
CITES
The Convention on International Trade in Endangered Species of Wild Fauna and Flora (CITES) is an agreement between governments to make sure trade in wild ani-mals and plants does not threaten their survival. The agreement came into force in 1975. By 2008, there were 173 countries that had joined in the agreement, including the United States. At that time, about 5000 species of animals and 28,000 species of plants were protected against exploitation in international trade. CITES is a voluntary agreement among countries, and its rules do not take the place of each country’s laws, which vary around the world.
AnswersFIGURE 6–18 Sample answer: There are fewer individuals of the species left to reproduce, and therefore hunting decreases the genetic diversity of the species and lessens its chances of surviving ecological disturbances.
IN YOUR NOTEBOOK Sample answer: Corals, most of which have a “skeleton” of calcium carbonate, have evolved to thrive at a certain water pH. Acid rain makes the water more acidic, which can dis-solve coral.
0152_mlbio10_Ch06.indd 180152_mlbio10_Ch06.indd 18 6/29/09 5:14:06 PM6/29/09 5:14:06 PM

Climate Change Climate change (a topic in the next lesson) is a major threat to biodiversity. Remember that organisms are adapted to their environments and have specifi c tolerance ranges to tempera-ture and other abiotic conditions. If conditions change beyond an organism’s tolerance, the organism must move to a more suitable loca-tion or face extinction. Species in fragmented habitats are particularly vulnerable to climate change because if conditions change they may not be able to move easily to a suitable habitat. Estimates vary regard-ing the effects of climate change on biodiversity. If global temperatures increase 1.5°C–2.5°C over late twentieth-century temperatures, 30 percent of species studied are likely to face increased risk of extinction. If the global temperature increase goes beyond 3.5°C, it is likely that 40–70 percent of species studied will face extinction.
Conserving Biodiversity How do we preserve biodiversity?
What can we do to protect biodiversity? Should we focus on a particu-lar organism like the scarlet macaw? Or should we try to save an entire ecosystem like the Amazon rain forest? We must do both. At the same time, conservation efforts must take human interests into account.
To conserve biodiversity, we must protect individual species, preserve habitats and ecosystems, and make certain that human neighbors of protected areas benefi t from participating in conser-vation efforts.
Protecting Individual Species In the past, most conservation efforts focused on indi-vidual species, and some of this work continues today. The Association of Zoos and Aquariums (AZA), for example, oversees species survival plans (SSPs) designed to protect threatened and endangered species. A key part of those plans is a captive breeding program. Members of the AZA carefully select and manage mating pairs of animals to ensure maximum genetic diver-sity. The ultimate goal of an SSP is to reintro-duce individuals to the wild. Research, public education, and breeding programs all contrib-ute to that goal. More than 180 species, includ-ing the giant panda shown in Figure 6–19, are currently covered by SSPs.
Preserving Habitats and Ecosystems The main thrust of global conservation efforts today is to protect not just individual species but entire ecosystems. The goal is to preserve the natural interactions of many species at once. To that end, governments and conservation groups work to set aside land as parks and reserves. The United States has national parks, forests, and other protected areas. Marine sanctuar-ies are being created to protect coral reefs and marine mammals.
FIGURE 6–19 Saving an Individual Species Efforts to save the giant panda include a comprehensive captive breeding and reintroduction program. Here, a researcher examines an infant panda at China’s Wolong Nature Reserve. Apply Concepts How does captive breeding affect a population’s genetic diversity?
170 Chapter 6 • Lesson 3
0001_Bio10_se_Ch06_S3.indd 5 6/2/09 6:27:15 PM
ecological hot spot
0001_Bio10_se_Ch06_S3.indd 6 6/2/09 6:27:17 PM
LESSO
N 6
.3
Teach continued
Lead a DiscussionTalk about the two strategies for conserving biodi-versity (protecting individual species and preserving habitats and ecosystems). Make sure students under-stand why both are important.
Ask How does a national park such as Yellowstone National Park help in conserving biodiversity? (It conserves biodiversity by preserving habitats and ecosystems.)
Ask Why do you think human interests must be taken into account in conservation efforts? (Sample answer: If human interests are taken into account, populations around the world are more likely to sup-port conservation efforts.)
DIFFERENTIATED INSTRUCTION
LPR Less Profi cient Readers Before leading the discussion above, write the Key Concept statement for the section on the board, with important words deleted.
To conserve _________, we must protect indi-• vidual __________, preserve habitats and __________, and make certain that human neighbors of __________ areas benefit from participating in __________ efforts.
Ask students to fi ll in the blanks, using these words: biodiversity, conservation, ecosystems, protected, species. (Correct order should be biodiversity, species, ecosystems, protected, conservation.)L3 Advanced Students Have interested students fi nd out whether the local zoo or aquarium is a member of the Association of Zoos and Aquariums. Ask students to inquire specifi cally about whether the zoo or aquarium participates in the Species Sur-vival Plan Program. Have students report to the class on what they learned.
Quick Facts
COSTA RICA’S BIOLOGICAL RESERVES
The Central American nation of Costa Rica has become a world leader in the effort to protect biodiversity. In exchange for reduction in its international debt, the Costa Rican government established eight biological reserves—extensive regions that include one or more undisturbed areas surrounded by buffer zones that are used by people for economic gain. The buffer zones provide a steady, lasting supply of forest products, water, and hydroelectric power and also support sustainable agriculture and ecotourism. Destructive practices that are incompatible with long-term ecosystem stability are prohibited in these zones. Costa Rica expects its biological reserves system to maintain at least 80 percent of the country’s native species. In addition, its thriving ecotourism industry is a signifi cant source of income for the country.
170 Chapter 6 • Lesson 3
AnswersFIGURE 6–19 Sample answer: Captive breeding increases a population’s genetic diversity by mating only the most genetically dissimilar animals. Also, as the program succeeds, there will be more individuals contributing to the gene pool.
0152_mlbio10_Ch06.indd 190152_mlbio10_Ch06.indd 19 6/29/09 5:14:17 PM6/29/09 5:14:17 PM

0001_Bio10_se_Ch06_S3.indd 5 6/2/09 6:27:15 PM
Polynesia- Micronesia
Polynesia- Micronesia
California Floristic
Province
MadreanPine-Oak Woodlands
Mesoamerica
Caribbean Islands
Tumbes-Chocó-Magdalena
Tropical Andes
Cerrado
Atlantic Forest
CapeFloristicRegion
Succulent Karoo
Guinean Forests of West Africa
Maputaland-Pondoland-Albany
Madagascar and the Indian Ocean Islands
Coastal Forests of Eastern Africa
Horn ofAfrica
Mediterranean Basin
Irano-Anatolian Himalaya
Mountains of Central Asia Mountains of
SW China
WesternGhatsand Sri Lanka
WallaceaSundaland
Philippines
Japan
New Caledonia
New Zealand
New Zealand
EastMelanesian Islands
Southwest Australia
Indo-Burma
Chilean Winter Rainfall-Valdivian Forests
Caucasus
Eastern Afromontane
The challenge is protecting areas that are large enough and that contain the right resources to protect biodiversity. To make sure that conservation efforts are concentrated in the most important places, con-servation biologists have identifi ed ecological “hot spots,” shown in red in Figure 6–20. An ecological hot spotecological hot spot is a place where signifi cant numbers of species and habitats are in immediate danger of extinction. By iden-tifying these areas, ecologists hope that scientists and governments can better target their efforts to save as many species as possible.
Considering Local Interests Protecting biodiversity often demands that individuals change their habits or the way they earn their living. In these cases it is helpful to offer some reward or incentive to the people or communities involved. The United States government, for example, has offered tax credits to people who’ve installed solar panels or bought hybrid cars. Similarly, many communities in Africa, Central America, and Southeast Asia have set aside land for national parks and nature reserves, like the park shown in Figure 6–21, to attract tourist dollars. In some Australian communities, farmers were paid to plant trees along rivers and streams as part of wildlife corridors connecting forest frag-ments. Not only did the trees help improve local water quality; they also improved the health of the farmers’ cows, which were able to enjoy shade on hot days!
The use of carbon credits is one strategy aimed at encouraging industries to cut fossil fuels use. Companies are allowed to release a certain amount of carbon into the environment. Any unused carbon may be sold back at a set market value or traded to other companies. This strategy encourages industries to pay for lower- emission machinery and to adopt carbon-saving practices. In this way, pollution is capped or cut without adding a fi nancial burden to the industry involved. This helps protect the economy while reducing biodiversity loss due to pollution. These examples show that conservation efforts work best when they are both informed by solid scientifi c information and benefi t the communities affected by them.
FIGURE 6–20 Ecological Hot Spots Conservation International identifi es biodiversity hot spots using two criteria. The area (1) must contain at least 1500 species of native vascular plants, and (2) it must have lost at least 70 percent of its original habitat. The 34 hot spots seen here cover just 2.3 percent of Earth’s land surface, but they contain over 50 percent of the world’s plant species and 42 percent of its terrestrial vertebrates.
FIGURE 6–21 Ecotourism A tourist gets an elephant-size kiss from one of the over 30 rescued elephants at Thailand’s Elephant Nature Park.
Humans in the Biosphere 171
0001_Bio10_se_Ch06_S3.indd 6 6/2/09 6:27:17 PM
LESSO
N 6
.3
Humans in the Biosphere 171
Use VisualsHave students examine the map in Figure 6–20 and read the caption. Make sure they understand the purpose of identifying these areas.
Ask What does Conservation International hope will result from identifying these ecological hot spots around the world? (They hope scientists and countries will direct their efforts at conserving biodi-versity in these areas.)
Ask Which ecological hot spot includes part of the continental United States? (California Flo-ristic Province)
Explain that this ecological hot spot includes most of the California coast and some of inland California. Point out that one endangered species in this area is the California condor.
DIFFERENTIATED INSTRUCTION
L1 Struggling Students Have pairs of students work through Figure 6–20. Suggest they start by identifying the world’s continents. Then, have them describe where hot spots are on the map. Have pairs read aloud the fi gure caption and then discuss it. Then, suggest they discuss the strategy of preserv-ing habitats and ecosystems that are ecological hot spots.
ELL Focus on ELL: Build Background
ALL SPEAKERS Help students build their understanding of lesson concepts by setting up a Gallery Walk on biodiversity. Write the lesson vocabulary terms on separate pieces of chart paper and post them around the room. Have small groups rotate from term to term. At each term, group members should write what they know about it, using a particular color of pen. When the next group rotates to the term, its members should add to the previous group’s comments or correct mistakes and misunderstandings, using a different-colored pen. When groups return to the term they addressed first, have members summarize information about that term for the class.
Study Wkbks A/B, Appendix S6, Gallery Walk.
Check for Understanding
DEPTH OF UNDERSTANDING
To gauge students’ relative understanding of biodiversity, ask them to answer the fol-lowing question.
To conserve biodiversity, why must both individual species be protected • and habitats and ecosystems be preserved?
Students with a limited understanding of biodiversity might respond that species need a habitat. Students with a more sophisticated understanding of biodiversity will explain that addressing both issues will help all three levels of biodiversity.
ADJUST INSTRUCTION
Review with students the three levels of biodiversity. Discuss ways in which all three levels can be conserved.
0152_mlbio10_Ch06.indd 200152_mlbio10_Ch06.indd 20 6/29/09 5:14:34 PM6/29/09 5:14:34 PM

1. Calculate By what percentage did the captive population of golden lion tamarins increase between 1970 and 2007?
2. Analyze Data Reintroduction typically begins once a captive population has reached a target size—the size at which a high degree of genetic diversity can be maintained. Based on the graph, what is the approximate target captive population size for the golden lion tamarin?
3. Infer Only 153 tamarins have been reintroduced to the wild. If there are now 650 tamarins in the reintroduced population, where did the other 497 come from?
4. Form an Opinion When populations of wild animals get very small, do you think they should be removed from the wild and brought into captivity? Why or why not?
Adapted from J. D. Ballou and J. Mickelberg, International Studbook for Golden Lion Tamarins (Washington, D.C.: National Zoological Park, Smithsonian Institution, 2007). B. Holst et al., Lion Tamarin Population and Habitat Viability Assessment Workshop 2005, Final Report (Apple Valley, MN: IUCN/SSC Conservation Breeding Specialist Group, 2006.)
Review Key Concepts
1. a. Review Describe the different components of global biodiversity.
b. Apply Concepts What benefi ts does society get from biodiversity?
2. a. Review What are the major threats to biodiversity? b. Relate Cause and Effect Explain the relationship
between habitat size and species diversity.3. a. Review What is the goal of a species survival plan? b. Form an Opinion Do you think that the hot spot
strategy is a good one? Explain your answer.
4. Look back at the biome map on page 111. Compare it to the map in Figure 6–20. Are there any similarities among the biomes the hot spots belong to? Using what you know about biomes, are you surprised by what you’ve found? Explain your answer.
Lesson 6.3 • Self-Test • Lesson Assessment
Recovery and Reintroduction of the Golden Lion Tamarin
Num
ber
of A
nim
als
200
400
600
800
1970 2000 2010
Year
01980 1990
Reintroduced population
Zoo populationParticipating zoos
Saving the Golden Lion TamarinGolden lion tamarins (GLTs) are primates native to the coastal regions of the Amazon rain forest. They have been threatened by habitat destruction and fragmentation. In the early 1970s, there were approximately 200 GLTs in the wild and only 91 animals in 26 zoos. As of 2007, the SSP included 496 GLTs in 145 participating zoos around the world. About 153 tamarins once part of the program have been reintroduced to the wild since 1984, resulting in a reintroduced population of more than 650.
172 Chapter 6 • Lesson 3
0001_Bio10_se_Ch06_S3.indd 7 6/2/09 6:27:28 PM
ecological footprint
0001_Bio10_se_Ch06_S4.indd 1 6/2/09 6:28:00 PM
LESSO
N 6
.3
PURPOSE Students will analyze data about the recovery and reintroduction of golden lion tamarins.
PLANNING Review with students how species survival plans are designed to protect threatened and endangered species.
ANSWERS
545 percent1.
4002.
They must be the offspring of the 153 GLTs that 3. have been reintroduced from zoos since 1984.
Sample answer: Yes. Without the protection 4. of zoos and aquariums, the animals might become extinct.
Assess and RemediateEVALUATE UNDERSTANDING
Call on students to identify and describe the three types of biodiversity. Then, have students complete the 6.3 Assessment.
REMEDIATION SUGGESTION
L1 Struggling Students If students struggle to answer Question 2b, review with them the sub-section, Altered Habitats.
Students can check their under-standing of lesson concepts with the Self-Test assessment. They can then take an online version of the Lesson Assessment.
172 Chapter 6 • Lesson 3
2a. altering habitats, hunting, introducing inva-sive species, releasing pollution into food webs, and climate change
2b. Sample answer: The smaller the habitat size, the less species diversity there is. The reason is that smaller size limits the number of species that can live in the space.
3a. to reintroduce genetically diverse individ-uals to the wild
3b. Sample answer: The strategy is a good one because it will conserve a high con-centration of endangered species with one directed effort.
4. Sample answer: The hot spots mostly occur in areas classified as tropical rain forests or temperate woodland and shrubland. The correlation with tropical rain forests is not surprising, because this biome contains the greatest biodiversity. The correlation with temperate woodland and shrubland is somewhat surprising, though these areas also contain great biodiversity.
1a. Ecosystem diversity refers to the variety of habitats, communities, and ecologi-cal processes in the biosphere. Species diversity is the number of different species in the biosphere or in a particular area. Genetic diversity refers to the different forms of genetic information carried by individuals in a species or in the biosphere.
1b. Answers will vary. Students should men-tion specific benefits in medicine, agricul-ture, and ecosystem services.
Assessment Answers
0152_mlbio10_Ch06.indd 210152_mlbio10_Ch06.indd 21 6/29/09 5:14:48 PM6/29/09 5:14:48 PM

NATIONAL SCIENCE EDUCATION STANDARDS
UNIFYING CONCEPTS AND PROCESSES
I, II, III, IV
CONTENT
C.4.a, C.4.c, C.4.d, C.4.e, C.5.e, C.6.b, F.2, F.3, F.4, F.5, F.6, G.1, G.2
INQUIRY
A.2.a
0001_Bio10_se_Ch06_S3.indd 7 6/2/09 6:27:28 PM
Meeting Ecological Challenges
Key Questions How does the average
ecological footprint in America compare to the world’s average?
How can ecology guide us toward a sustainable future?
Vocabularyecological footprintozone layeraquacultureglobal warming
Taking NotesCompare/Contrast Table As you read, create a table comparing the challenges associated with the ozone layer, fi sheries, and global climate. Note the problem observed, the causes identifi ed, and the solutions implemented.
Ecological Footprints How does the average ecological footprint in America compare
to the world’s average?What is our impact on the biosphere today? To answer that ques-tion, think about the kind and amount of resources each of us uses. Ecologists refer to the human impact on the biosphere using a concept called the ecological footprint. The ecological footprintecological footprint describes the total area of functioning land and water ecosystems needed both to provide the resources an individual or population uses and to absorb and make harmless the wastes that individual or population generates. Ecological footprints take into account the need to provide resources such as energy, food, water, and shelter, and to absorb such wastes as sewage and greenhouse gases. Ecologists use foot-print calculations to estimate the biosphere’s carry-ing capacity for humans. An artist’s rendition of an ecological footprint is shown in Figure 6 –22.
Footprint Limitations Ecologists talk about the eco-logical footprints of individuals, of countries, and of the world’s population. Calculating actual numbers for ecological footprints, however, is complicated. The concept is so new that there is no universally accepted way to calculate footprint size. What’s more, footprints give only a “snapshot” of the situation at a particular point in time.
ECOLOGICAL FOOTPRINTSFIGURE 6–22 The food you eat, the miles you travel, and the electricity you use all contribute to your—and the population’s—ecological footprint.
173Lesson 6.4 • Lesson Overview • Lesson Notes • Visual Analogy
THINK ABOUT IT Every year, the EPA awards up to ten President’s Environmental Youth Awards. Past winners have included an Eagle Scout from Massachusetts who encouraged people who fi sh to stop using lead weights that contaminate water and poison organisms, stu-dents from Washington State who reduced waste at their school and saved more than half a million dollars in the process, and a student from Florida who developed an outreach program to protect local sea turtles. What do these award winners have in common? They came up with ideas that protect the environment while satisfying both present and future needs. This kind of leadership is what will help us chart a new course for the future.
0001_Bio10_se_Ch06_S4.indd 1 6/2/09 6:28:00 PM
Humans in the Biosphere 173
LESSO
N 6
.4
Getting Started
Objectives6.4.1 Explain the concept of ecological footprint.
6.4.2 Identify the role of ecology in a sustainable future.
Student ResourcesStudy Workbooks A and B, 6.4 Worksheets
Spanish Study Workbook, 6.4 Worksheets
Lab Manual B, 6.4 Hands-On Activity Worksheet
Lesson Overview • Lesson Notes • Activity: Visual Analogy • Assessment: Self-Test, Lesson Assessment
For corresponding lesson in the Foundation Edition, see pages 143–149.
Have students read the description of an ecological footprint and examine Figure 6–22. Call on students to identify items representing uses of resources in the analogy, such as the boat, airplane, electric plant, and planted fi elds. Ask students to describe how the natural resources used for each item shown contrib-ute to the community’s ecological footprint.
Students can further explore the analogy by watching how the “size” of a footprint changes when factors such as energy use change in the Visual Analogy: Ecological Footprints.
Teach for UnderstandingENDURING UNDERSTANDING The existence of life on Earth depends on interactions among organisms and between organisms and their environment.
GUIDING QUESTION How can we change our behaviors to help protect our planet?
EVIDENCE OF UNDERSTANDING After completing this lesson, give students the following assessment to show their understanding of an ecological challenge. Ask each student to write a summary of one of the case studies in this lesson. The summary should be two or three paragraphs long, and should describe the problem, identify the cause, and describe changes that could be made to address the problem. Call on volunteers to read their summaries to the class.
0152_mlbio10_Ch06.indd 220152_mlbio10_Ch06.indd 22 6/29/09 5:15:07 PM6/29/09 5:15:07 PM

Ecological Deficit
GreatestLeast
No data
Comparing Footprints Although calculating absolute foot-prints is diffi cult, ecological footprints can be useful for making comparisons among different populations, as shown in Figure 6–23.
According to one data set, the average American has an ecologi-cal footprint over four times larger than the global average. The per person use of resources in America is almost twice that in England, more than twice that in Japan, and almost six times that in China. To determine the ecological footprint of an entire country, researchers calculate the footprint for a typical citizen and then multiply that by the size of the population.
In Your Notebook How have you contributed to your ecological footprint today? Give at least ten examples.
Ecology in Action How can ecology guide us toward a sustainable future?
The future of the biosphere depends on our ecological footprints, global population growth, and technological development. Right now it’s more common to hear stories of ecological challenges than successes. Given the size of those challenges, you might be tempted to give up, to feel that things are getting worse, and that there is nothing we can do about it. But ecological research, properly collected, analyzed, and applied, can help us make decisions that will produce profoundly positive effects on the human condition. The basic principles of ecology can guide us toward a sustainable future. By (1) recognizing a problem in the environment, (2) researching that problem to determine its cause, and then (3) using scientifi c understanding to change our behavior, we can have a positive impact on the global environment. The following case studies illustrate the importance of the steps.
FIGURE 6–23 Relative FootprintsThis world map shows each country in proportion to its ecological footprint. The United States has an ecological footprint about twice the world’s average. By contrast, the African nation of Zambia has a footprint a little over one -fourth the global average. Compare each country’s “footprint” size to its actual size on the smaller map below.
174 Chapter 6 • Lesson 4
0001_Bio10_se_Ch06_S4.indd 2 6/2/09 6:28:06 PM
ozone layer.
0001_Bio10_se_Ch06_S4.indd 3 6/2/09 6:28:14 PM
LESSO
N 6
.4
How Science Works
ECOLOGICAL FOOTPRINTS
Students may confuse the concept of ecological footprint with the concept of carbon footprint, which they have probably heard about. In general, a carbon footprint is a measure of human activities as they produce greenhouse gases and impact climate change. An ecological footprint is a larger and more complicated concept than a carbon footprint. In fact, an ecological footprint includes a version of the carbon footprint. The important idea to emphasize for students is that ecological and carbon footprints are valid concepts and good ways to compare environmental impacts of countries and cultures at a specifi c time.
Teach continued
Use VisualsAsk students to examine the map in Figure 6–23 and read the caption. Make sure they understand the color key and why the continents are shaped as they are.
Ask Why is North America so much larger than South America on this map? (Areas that have larger relative footprints are shown to be bigger than areas that have smaller footprints.)
Then, have students compare the ecological foot-prints of regions and countries with the chapter opener image of Earth from space.
Ask What do you notice about the areas with the largest ecological defi cits? (These areas—United States, Western Europe, South Korea, and Japan—are also the areas with the densest lights as seen from space, which makes sense since those areas are the most developed.)
DIFFERENTIATED INSTRUCTION
L1 Special Needs Have students start by compar-ing a specifi c area on the inset map with its corre-sponding area on the footprint map. For example, ask them to compare Africa on both maps and describe how the relative size of this area changes from one map to the other. Then, guide them to understand the relationship between the two maps. Explain that the footprint map shows each country in proportion to its ecological footprint, while the inset map shows the countries in their correct sizes. Suggest pairs of students discuss and compare the United States on each map.
AnswersIN YOUR NOTEBOOK Sample answer: waking up to a clock radio, turning on lights, using water to take a shower, flushing the toilet, preparing food for breakfast, wearing manufactured clothing, talking on a rechargeable cell phone, riding in a car to school, listening to music on a battery-powered MP3 player, sitting in a heated classroom
174 Chapter 6 • Lesson 4
0152_mlbio10_Ch06.indd 230152_mlbio10_Ch06.indd 23 6/29/09 5:15:19 PM6/29/09 5:15:19 PM

0001_Bio10_se_Ch06_S4.indd 2 6/2/09 6:28:06 PM
Case Study #1: Atmospheric OzoneBetween 20 and 50 kilometers above Earth’s surface, the atmosphere contains a relatively high concentration of ozone called the ozone layer.ozone layer. Ozone at ground level is a pollutant, but the natural ozone layer absorbs harmful ultraviolet (UV) radiation from sunlight. Overexposure to UV radiation is the main cause of sunburn. It also can cause cancer, damage eyes, and lower resistance to disease. And intense UV radiation can damage plants and algae. By absorbing UV light, the ozone layer serves as a global sunscreen.
The following is an ecological success story. Over four decades, society has rec-ognized a problem, identifi ed its cause, and cooperated internationally to address a global issue.
FIGURE 6–24 The Disappearing Ozone
FIGURE 6–25 CFC-Containing Refrigerators
FIGURE 6–26 The Decline of CFCsFIF GURE 6 26 Th D li f CFC
1992 1996 2004 2008
Conc
entr
atio
n (p
pt)
Year
Atmospheric Concentration ofOzone-Destroying Halogens
2000
22002250
2150
2300
20502100
20001950
1 Recognizing a Problem: “Hole” in the Ozone Layer Beginning in the 1970s, satellite data revealed that the ozone concentration over Antarctica was dropping during the southern winter. An area of lower ozone concen-tration is commonly called an ozone hole. It isn’t really a “hole” in the atmosphere, of course, but an area where little ozone is present. For several years after the ozone hole was fi rst discovered, it grew larger and lasted longer each year. Figure 6–24 shows the progression from 1981 to 1999. The darker blue color in the later image indicates that the ozone layer had thinned since 1981.
2 Researching the Cause: CFCs In 1974 a research team led by Mario Molina, F. Sherwood Rowland, and Paul J. Crutzen demonstrated that gases called chloro fl uorocarbons (CFCs) could damage the ozone layer. This research earned the team a Nobel Prize in 1995. CFCs were once widely used as propellants in aerosol cans; as coolant in refrigera-tors, freezers, and air conditioners; and in the production of plastic foams.
3 Changing Behavior: Regulation of CFCs Once the research on CFCs was published and accepted by the scientifi c community, the rest was up to policymakers—and in this case, their response was tremendous. Following the recom-mendations of ozone researchers, 191 countries signed a major agreement, the Montreal Protocol, which banned most uses of CFCs. Because CFCs can remain in the atmosphere for a century, their effects on the ozone layer are still visible. But ozone-destroying halogens from CFCs have been steadily decreasing since about 1994, as shown in Figure 6–26, evidence that the CFC ban has had positive long-term effects. In fact, current data predict that although the ozone hole will continue to fl uctuate in size from year to year, it should disappear for good around the middle of this century.
Humans in the Biosphere 175
0001_Bio10_se_Ch06_S4.indd 3 6/2/09 6:28:14 PM
LESSO
N 6
.4
Humans in the Biosphere 175
Connect to ChemistryExplain that ozone is a form of pure oxygen, though different from the form we need for respiration. A molecule of oxygen has two atoms (O2), while a molecule of ozone has three atoms (O3). Further explain that CFCs degrade in the upper atmosphere, releasing fl uorine and chlorine. Fluorine and chlorine are part of a group of elements called halogens. The halogens released by the CFCs combine with ozone molecules, destroying them. To emphasize how regulation of CFCs had a positive effect on the problem, focus students’ attention on the graph in Figure 6–26.
Ask What trend does the graph show between 1996 and 2007? (The atmospheric concentration of ozone-destroying halogens steadily decreased.)
Ask What caused this trend? (regulation of CFCs)
DIFFERENTIATED INSTRUCTION
L1 Struggling Students To help students better understand what the ozone layer is, show them a labeled diagram of the layers of the atmosphere from an Earth science textbook. Point out that the ozone layer is part of the stratosphere, which is the layer just above the layer of the atmosphere next to Earth’s surface.
LPR Less Profi cient Readers For struggling readers, take the time to preview the basic structure of how each case study is presented. Point out that step 1 explains how humans recognized there was a prob-lem, step 2 details how scientists pinpoint what was or is causing the problem, and step 3 explains how humans are changing their behavior to help address it. Suggest students create a three-row table for each case study and fi ll it in with a summary sentence for each step.
Check for Understanding
FOLLOW-UP PROBES
Ask Why is a “hole” in the ozone layer a problem, and what caused the “hole”? (The “hole” in the ozone layer is a problem because the ozone layer absorbs ultravio-let rays from the sun that can cause cancer and do other damage to life on Earth. The cause of the “hole” was the use of CFCs in aerosol cans, refrigerators, air condition-ers, and plastic foams.)
ADJUST INSTRUCTION
If students have diffi culty answering the question, have them reread the introduction to the case study and the paragraph (step 2) about the cause of the problem. Then, review the answer to the question in class discussion.
0152_mlbio10_Ch06.indd 240152_mlbio10_Ch06.indd 24 6/29/09 5:15:35 PM6/29/09 5:15:35 PM
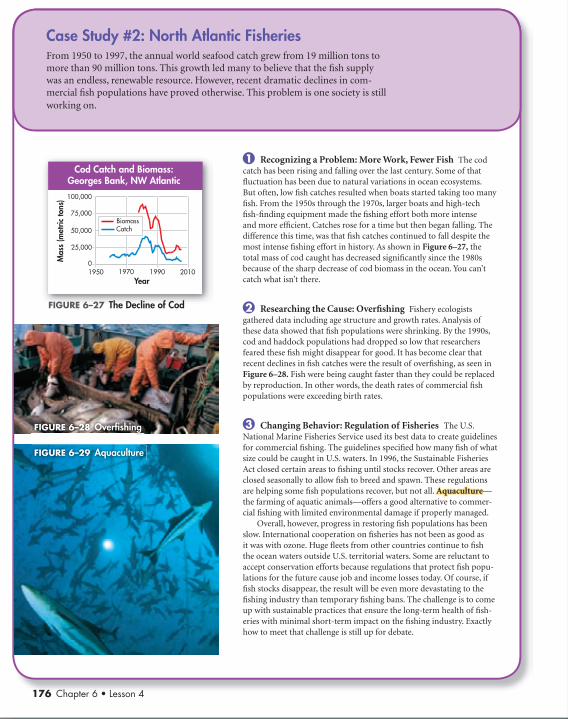
1950 1970 1990 2010
25,000
75,000
Mas
s (m
etric
tons
)
0
Year
Cod Catch and Biomass:Georges Bank, NW Atlantic
100,000
BiomassCatch50,000
Case Study #2: North Atlantic FisheriesFrom 1950 to 1997, the annual world seafood catch grew from 19 million tons to more than 90 million tons. This growth led many to believe that the fi sh supply was an endless, renewable resource. However, recent dramatic declines in com-mercial fi sh populations have proved otherwise. This problem is one society is still working on.
FIGURE 6–27 The Decline of Cod
FIGURE 6–28 Overfi shing
FIGURE 6–29 Aquaculture
1 Recognizing a Problem: More Work, Fewer Fish The cod catch has been rising and falling over the last century. Some of that fl uctuation has been due to natural variations in ocean ecosystems. But often, low fi sh catches resulted when boats started taking too many fi sh. From the 1950s through the 1970s, larger boats and high-tech fi sh-fi nding equipment made the fi shing effort both more intense and more effi cient. Catches rose for a time but then began falling. The difference this time, was that fi sh catches continued to fall despite the most intense fi shing effort in history. As shown in Figure 6–27, the total mass of cod caught has decreased signifi cantly since the 1980s because of the sharp decrease of cod biomass in the ocean. You can’t catch what isn’t there.
2 Researching the Cause: Overfi shing Fishery ecologists gathered data including age structure and growth rates. Analysis of these data showed that fi sh populations were shrinking. By the 1990s, cod and haddock populations had dropped so low that researchers feared these fi sh might disappear for good. It has become clear that recent declines in fi sh catches were the result of overfi shing, as seen in Figure 6–28. Fish were being caught faster than they could be replaced by reproduction. In other words, the death rates of commercial fi sh populations were exceeding birth rates.
3 Changing Behavior: Regulation of Fisheries The U.S. National Marine Fisheries Service used its best data to create guidelines for commercial fi shing. The guidelines specifi ed how many fi sh of what size could be caught in U.S. waters. In 1996, the Sustainable Fisheries Act closed certain areas to fi shing until stocks recover. Other areas are closed seasonally to allow fi sh to breed and spawn. These regulations are helping some fi sh populations recover, but not all. AquacultureAquaculture—the farming of aquatic animals—offers a good alternative to commer-cial fi shing with limited environmental damage if properly managed.
Overall, however, progress in restoring fi sh populations has been slow. International cooperation on fi sheries has not been as good as it was with ozone. Huge fl eets from other countries continue to fi sh the ocean waters outside U.S. territorial waters. Some are reluctant to accept conservation efforts because regulations that protect fi sh popu-lations for the future cause job and income losses today. Of course, if fi sh stocks disappear, the result will be even more devastating to the fi shing industry than temporary fi shing bans. The challenge is to come up with sustainable practices that ensure the long-term health of fi sh-eries with minimal short-term impact on the fi shing industry. Exactly how to meet that challenge is still up for debate.
176 Chapter 6 • Lesson 4
0001_Bio10_se_Ch06_S4.indd 4 6/2/09 6:28:17 PM
global warming.
0001_Bio10_se_Ch06_S4.indd 5 6/2/09 6:28:20 PM
LESSO
N 6
.4
Quick Facts
GEORGES BANK
Georges Bank is located about 120 km off the coast of North America between Cape Cod and Nova Scotia. The Basques established a salted fi sh trade here around the year 1000. They retained control of the area until 1497 when John Cabot, who was searching for a northern spice route on behalf of King Henry VII of England, discov-ered it. Georges Bank owes its productivity to its position at the interception of two currents—the cold, nutrient-rich Labrador current and the warmer Gulf stream. Once among the most productive fi sheries, the National Marine Fisheries Service reported in 1994 that cod stock on Georges Bank had declined 40 percent in just four years. They concluded that in order to be sustainable, fi shing fl eets would have to be cut in half.
Teach continued
Use VisualsFocus students’ attention on the information in the graph in Figure 6–27 to discuss the case study of North Atlantic fi sheries. Make sure students under-stand the meanings of biomass and catch. Explain that biomass refers to the total mass of cod in the North Atlantic, while catch refers to the total mass of the cod caught by the fi shing boats.
Ask What caused the sharp increase in the catch between the late 1970s and the early 1980s? (Larger boats and high-tech fish-finding equipment made fishing more efficient, and the catch grew larger.)
Ask How do you know the decline in catch in the late 1980s was due to overfi shing and not to some-thing else, like a decline in fi shing? (The biomass line shows that there was a sharp decline in the number of cod in the Atlantic during that time.)
Discuss the regulation of fi sheries and why restoring fi sh populations has been slow.
DIFFERENTIATED INSTRUCTION
ELL English Language Learners Students may not understand the term overfishing. Explain that the prefi x over- means “excessive” or “too much.” Overfi shing, then, refers to too much fi shing, which in this case resulted in fi sh being caught faster than they could replace themselves through reproduction. Point out that overfi shing caused a once-renewable resource to become a nonrenewable resource.
176 Chapter 6 • Lesson 4
0152_mlbio10_Ch06.indd 250152_mlbio10_Ch06.indd 25 6/29/09 5:15:52 PM6/29/09 5:15:52 PM

Aquaculture
0001_Bio10_se_Ch06_S4.indd 4 6/2/09 6:28:17 PM
Land
-Sur
face
Te
mpe
ratu
re C
hang
e (ºC
)
Year
Change in Global Land-Surface Air Temperature,1850–2005
1.0
0.6
0.2
0
0.2
0.6
1.01860 1880 1900 1920 1940 1960 1980 2000
1880 2000Sea
Leve
l Cha
nge
(mm
)
Year
Change in Global Sea Level,1870–2005
1920
0
50
50
100
150
100
20019601900 1940 1980
FIGURE 6–30 A Warming Earth
1953 1959 1965 1971 1977 1983 1989 1995 2001 2007
Exte
nt o
f Cha
nge
Year
Change in Mean Global Sea Ice, 1953–2007
1
2
0
3
3
2
1
change from average 1961–1990 temperature
change from average 1953–2007 sea ice extent
change from average 1961–1991sea level
A.
B.
C.
Case Study #3: Climate ChangeGlobal climate involves cycles of matter across the biosphere and everything modern humans do—from cutting and burning forests to manufacturing, driving cars, and generating electricity. The most reliable current information available on this subject comes from the 2007 report of the Intergovernmental Panel On Climate Change (IPCC). The IPCC is an international organization established in 1988 to provide the best possible scientifi c information on climate change. IPCC reports contain data and analyses that have been agreed upon and accepted by 2500 climate scientists from around the world and the governments participating in the study.
1 Recognizing a Problem: Global Warming The IPCC report confi rms earlier observations that global temperatures are rising. This increase in average temperature is called global warming.global warming. Remember that winds and ocean currents, which are driven by differences in temperature across the biosphere, shape climate. Given this link between temperature and climate, it isn’t surpris-ing that the IPCC report discusses more than warming. The report also discusses climate change—changes in patterns of temperature, rainfall, and other physical environmental factors that can result from global warming. There are many lines of evidence, both physical and biological, that have contributed to our current understanding of the climate change issue.
• Physical Evidence Physical evidence of global warming comes from several sources. The graphs in Figure 6–30, taken from data in the 2007 IPCC report, show that Earth’s temperatures are getting warmer, its sea ice is melting, and its sea levels are rising. Eleven of the twelve years between 1995 and 2006 were among the warmest years since temperature recording began in 1850. Between 1906 and 2005, Earth’s average global temperature rose 0.74°C. The largest changes are occurring in and near the Arctic Circle. Average temperatures in Alaska, for example, increased 2.4°C over the last 50 years. Sea level has risen since 1961 at a rate of 1.8 mm each year. This increase is caused by warmer water expanding and by melting glaciers, ice caps, and polar ice sheets. Satellite data confi rm that arctic sea ice, glaciers, and snow cover are decreasing.
Humans in the Biosphere 177
0001_Bio10_se_Ch06_S4.indd 5 6/2/09 6:28:20 PM
LESSO
N 6
.4
Humans in the Biosphere 177
Quick Facts
THE IPCC
The World Meteorological Organization and the United Nations Environment Programme (UNEP) established the Intergovernmental Panel on Climate Change (IPCC) in 1988. The IPCC does not conduct research on its own. Instead, its scientists assess scientifi c, technical, and economic data related to climate change. The infor-mation the organization provides in its reports is based on scientifi c evidence, and the IPCC makes no policy recommendations to governments.
Use VisualsHave students study the graphs in Figure 6–30. Make sure they understand the source of the data. Then, talk about the physical evidence of global warming.
Ask Between 1860 and 1920, did the land-surface air temperature change? (Sample answer: yes, but the fluctuations weren’t large enough to change the approximate average temperature)
Ask When did the downward trend in mean global sea ice begin? (in about the late 1960s)
Ask What has been the trend in global sea level since about 1920? (The trend since about 1920 is a rising sea level.)
DIFFERENTIATED INSTRUCTION
ELL English Language Learners Explain to stu-dents new to English that global is the adjectival form of the word globe, which means a “sphere” or rounded ball. Explain that the term globe is often used as a synonym for Earth or the world. The adjec-tive global, then, means “worldwide.”
LPR Less Profi cient Readers Students may have diffi culty distinguishing between the terms global warming and climate change, since the two terms are often used interchangeably in common speech. Ask a volunteer to read the defi nitions of the two terms aloud. Then, point out that the two have a cause-and-effect relationship.
Ask Which is the cause, and which is the effect? (Global warming is the cause; climate change is the effect.)
0152_mlbio10_Ch06.indd 260152_mlbio10_Ch06.indd 26 6/29/09 5:16:03 PM6/29/09 5:16:03 PM

#2764FPO#2#2#2#2#2#2767676767676444444
500 1000 1500
Year
Greenhouse Gas Concentration Through 2005
CO2 (
ppm
), N
2O (p
pb)
0
300
350
400
2502000
2000
1800
1600
1400
1200
1000
800
600
CH4 (
ppb)
Carbon dioxide (CO2)
Methane (CH4)Nitrous oxide (N2O)
Greenhouse Gas Emissions by Sector, 2004
Industry: 19.4%
Forestry: 17.4%
Waste Management:
2.8%
Transportation: 13.1%
Energy Supply: 25.9%
Residential and CommercialBuildings: 7.9%
Agriculture: 13.5%
• Biological Evidence Small changes in climate that humans scarcely notice can be important to other organisms. Remember that each organism’s range is determined by factors like tem-perature, humidity, and rainfall. If those conditions change, the organisms can be affected. If temperature rises, for example, organisms would usually move toward cooler places away from the equator and from warm lowlands to cooler, higher altitudes. In addition, plant fl owering and animal breeding are often cued by seasonal changes. If warming is occurring, these organisms should respond as though spring begins earlier.
The IPCC report summarizes data from 75 studies cover-ing 1700 species of plants and animals. These data confi rm that many species and communities are responding as though they are experiencing rising temperatures. The yellow-bellied marmot in Figure 6–31, for example, is coming out of hiber-nation over a month earlier than it used to.
2 Researching the Cause: Models and Questions What is causing global warming? Earth’s climate has changed often during its history. So researchers had to determine whether current warming is part of a natural cycle or whether it is caused by human activity or by astronomical and geo-logical changes. As the IPCC report documents, concentra-tions of carbon dioxide and several other greenhouse gases have increased signifi cantly over the last 200 years, as shown in Figure 6–32. Several kinds of data suggest this increase is due to the burning of fossil fuels, combined with the cut-ting and burning of forests worldwide. These activities add carbon dioxide to the atmosphere faster than the carbon cycle removes it. Most climate scientists agree that this added carbon dioxide is strengthening the natural greenhouse effect, causing the biosphere to retain more heat.
• How Much Change? How much warming is expected? For answers, researchers turn to computer models based on data. The models are complex and involve assumptions about climate and human activities. For these reasons, predictions are open to debate. The IPCC reports the result of six differ-ent models, which predict that average global temperatures will rise by the end of the twenty-fi rst century from just under 2°C to as much as 6.4°C higher than they were in the year 2000.
• Possible Effects of Climate Change What does climate change mean? Some changes are likely to threaten ecosystems ranging from tundra and northern forests to coral reefs and the Amazon rain forest. The western United States is likely to get drier. The Sahara Desert, on the other hand, may become greener. Sea level may rise enough to fl ood some coastal eco-systems and human communities. And some models suggest that parts of North America may experience more droughts during the summer growing season.
FIGURE 6–32 Greenhouse Gases
FIGURE 6–31 Waking Up Too Early
Case Study #3: Climate Change (continued)
178 Chapter 6 • Lesson 4
0001_Bio10_se_Ch06_S4.indd 6 6/2/09 6:28:25 PM 0001_Bio10_se_Ch06_S4.indd 7 6/2/09 6:28:28 PM
LESSO
N 6
.4
Teach continued
Lead a DiscussionTalk about how much warming is expected to occur and what the consequences will be.
Ask What are the possible effects for towns and cit-ies along the coasts of the United States? (Because of the rise in sea level, some towns and cities may be flooded.)
Ask Why is it possible that global warming will cause the Sahara Desert to become greener? (Sample answer: Global warming will cause changes in weather patterns throughout the world. If weather patterns change in a certain way, the Sahara could receive more rain than is normal today.)
Turn students’ attention to what might occur in their local region as a result of global warming. Have them predict changes both for humans and for other organisms native to the region.
DIFFERENTIATED INSTRUCTION
L3 Advanced Students Have interested students conduct research to answer this question: How can scientists know about the concentration of green-house gases over 2000 years ago? Students should fi nd out about ice core analysis. Have them share what they learn with the class.
ELL Focus on ELL: Access Content
BEGINNING AND INTERMEDIATE SPEAKERS Have pairs of students make a Cause and Effect Diagram for Case Study #3. Start the diagram for them by identifying climate change as the cause. Suggest they read the paragraphs on the biological and physical evidence associated with climate change to help them identify effects. Accept words or short phrases from beginning speakers. Suggest intermediate speakers write a simple sentence to identify each effect.
Study Wkbks A/B, Appendix S18, Cause and Effect Diagram. Transparencies, GO1.
Address MisconceptionsClimate vs. Weather Some students may doubt predictions about climate change because they have witnessed many wrong predictions about the weather. Explain that there is a big difference between weather and climate. Predicting atmo-spheric conditions in local areas is very diffi cult, but climate is much more predictable.
Check for Understanding
HAND SIGNALS
Give students the following questions, and ask them to show a thumbs-up sign if they can answer a question, a thumbs-down sign if they can’t, or a waving-hand sign if they’re not sure.
What changes in patterns does climate change involve?•
What is strengthening the atmosphere’s natural greenhouse effect?•
What changes in behavior need to occur to minimize further global warming?•
ADJUST INSTRUCTION
For any question that received thumbs-down or waving-hand sign, have students write a one-sentence response to the question using the text as a resource.
178 Chapter 6 • Lesson 4
0152_mlbio10_Ch06.indd 270152_mlbio10_Ch06.indd 27 6/29/09 5:16:13 PM6/29/09 5:16:13 PM

0001_Bio10_se_Ch06_S4.indd 6 6/2/09 6:28:25 PM
3 Changing Behavior: The Challenges Ahead You have seen how research has led to actions that are preserving the ozone layer and attempting to restore fi sheries. In terms of global climate, great challenges lie ahead of us. Scientists have been saying for more than two decades that the world needs to recognize the importance of climate change and take steps to minimize further warming. The changes in behavior needed to cut back on greenhouse gas emissions will be major and will require input from econom-ics and many other fi elds beyond biology. Some changes will rely on new technology for renewable energy and more effi cient energy use. Because changing our use of fossil fuels and other behaviors will be diffi cult, researchers continue to gather data as they try to make more accurate models. In the meantime, we have begun to see the emergence of electric cars, recycled products, and green buildings.
Nations of the world have begun holding international climate summits, at which they attempt to work out agreements to protect the atmosphere and climate—both of which are truly global issues. As the world, and our own government, tries to work through these challenges, remember that the purpose of ecology is not to predict disaster or to prevent people from enjoying modern life. The world is our island of life. Hopefully, humanity can work toward a day when scientifi c information and human ingenuity help us reach the common goal of preserving the quality of life on Earth.
Review Key Concepts 1. a. Review What are ecological footprints? b. Apply Concepts What are the limitations of the ecological
footprint model, and how can ecologists best use it?2. a. Review Why is the ozone layer important to living things? b. Explain What are the major types of physical and biological
evidence for climate change? c. Propose a Solution Suggest one solution for the fi sheries
problem. Your solution can be at the international, national, regional, or individual level. Explain how it would help, and what challenges you see in implementing it.
Interdependence in Nature3. Refer to the carbon cycle
on page 83. Describe how extensive burning of fos-sil fuels is affecting other reservoirs of carbon in the biosphere.
Lesson 6.4 • Self-Test • Lesson Assessment
Case Study #3: Climate Change (continued)
FIGURE 6–33 Little Changes, Big Results
Humans in the Biosphere 179
0001_Bio10_se_Ch06_S4.indd 7 6/2/09 6:28:28 PM
LESSO
N 6
.4
Humans in the Biosphere 179
Assess and RemediateEVALUATE UNDERSTANDING
Call on students to explain ecological footprints and describe how they are useful tools for ecologists. Also, call on students to summarize the steps out-lined in each of the three case studies in this lesson. Then, have students complete the 6.4 Assessment.
REMEDIATION SUGGESTION
L1 Struggling Students If your students have trouble answering Question 2b, have them make bulleted lists of the subsections Physical Evidence and Biological Evidence in Case Study #3.
Students can check their under-standing of lesson concepts with the Self-Test assessment. They can then take an online version of the Lesson Assessment.
1a. An ecological footprint describes the total area of functioning land and water ecosys-tems needed both to provide the resources an individual or population uses and to absorb and make harmless the wastes that an individual or population generates.
1b. The limitations are that there is no univer-sally accepted way to calculate footprint size and footprints give only a “snap-shot” of the situation at a particular point in time. Ecologists can best use them to make comparisons among different populations.
2a. It absorbs harmful UV radiation from sunlight.
2b. Physical evidence: Data show that Earth’s temperatures are getting warmer, its sea ice is melting, and its sea levels are rising. Biological evidence: Data confirm that many species are responding as though they are experiencing rising temperatures.
2c. Sample answer: A solution would be to place strict, worldwide limits on catch-ing all types of fishes for many years. This would help by giving fish populations time
to increase to sustainable levels. The chal-lenge in implementing such limits would be to persuade all countries to go along with the plan. Incentives for fishing com-panies would likely be needed.
3. Sample answer: The burning of fossil fuels is adding more car-bon dioxide to the atmosphere
and depleting it from fossil fuel reservoirs. Since carbon from the atmosphere can dis-solve in water, it is also increasing the amount of carbon in bodies of water.
Assessment Answers
0152_mlbio10_Ch06.indd 280152_mlbio10_Ch06.indd 28 6/29/09 5:16:30 PM6/29/09 5:16:30 PM

CONTENT F.4, F.5
INQUIRY A.1.b, A.1.c, A.2.d, C.4.e
NATIONAL SCIENCE EDUCATION STANDARDS
Pre-Lab: Acid Rain and Seeds
Problem How does acid rain affect seed germination?
Materials white vinegar, distilled water, large test tubes, test-tube rack, glass-marking pencil, 25-mL graduated cylinder, food coloring, pipette, pH paper, dried beans, paper towels, zip-close plastic bags, stick-on labels, hand lens
Lab Manual Chapter 6 Lab
Skills Focus Design an Experiment, Organize Data, Measure, Graph
Connect to the Every organism alters its environment in some way. Elephants uproot trees, prairie dogs dig tunnels, and corals build reefs. But no other organism has as much impact on the global envi-ronment as humans. One of the ways that humans affect global ecology is by burning fossil fuels. The burning produces carbon dioxide, which can accumulate in the atmosphere and cause climate change. Other products react with water to form nitric and sulfuric acids. Rain that contains these acids can damage many things, including stone statues and growing plants. In this lab, you will investigate the effect of acid rain on seeds.
Background Questionsa. Review What does a pH scale measure?
b. Review Which solution is more acidic, one with a pH of 4.0 or one with a pH of 5.0, and why?
c. Explain Use the water cycle to trace the path from acids in water vapor to plants.
Pre-Lab QuestionsPreview the procedure in the lab manual.
1. Design an Experiment What do you think the purpose is of adding food coloring to the vinegar in Part A?
2. Infer How will you know that a seed has germinated?
3. Using Models In this lab, what do the solutions represent?
Chapter 6
Visit Chapter 6 online to test yourself on chapter content and to fi nd activities to help you learn.
Untamed Science Video The Untamed Science crew visits a zoo to learn about the important work that goes on behind the scenes.
Art in Motion View a short animation of biological magnifi cation.
Art Review Review your understanding of the various threats to biodiversity with this activity.
Visual Analogy Compare human impact on the biosphere to a footprint in this activity.
Data Analysis Simulate data collection in order to compare two sites, and learn how to calculate a biodiversity index to quantify biodiversity.
OPEN-ENDED INQUIRY
180 Chapter 6 • Pre-Lab
0001_Bio10_se_Ch06_LAB.indd 1 6/2/09 6:24:24 PM
6.1
6.2
6.3
6.4
6
0001_Bio10_se_Ch06_SCA.indd 1 6/2/09 6:29:07 PM
CH
APTE
R L
AB
180 Chapter 6 • Pre-Lab
Pre-LabIntroduce students to the concepts they will explore in the chapter lab by assigning the Pre-Lab questions.
LabTell students they will perform the chapter lab Acid Rain and Plants described in Lab Manual A.
L1 Struggling Students A simpler version of the chapter lab is provided in Lab Manual B.
SAFETY
Make sure students wear goggles and a lab apron. Caution them to be careful in handling glassware and other breakable materials and to avoid getting the solutions on their skin. Have students wash their hands at the end of the lab.
Look online for Editable Lab Worksheets.
For corresponding pre-lab in the Foundation Edition, see page 150.
PRE-LAB QUESTIONS
Sample answer:1. As the vinegar is diluted with water, the intensity of the color will decrease. The food color-ing provides a visual indicator for the decreased concentration of acid (H+ ions) in the solutions.
Sample answer: The seed coat will 2. crack and a root will be visible.
Sample answer: The solutions repre-3. sent rain with different concentrations of acids.
180 Chapter 6 • Pre-Lab
CH
APTE
R L
AB
BACKGROUND QUESTIONS
A pH scale measures the concentration of Ha. + ions in a solution.
The solution with a pH of 4.0 is more acidic b. because it has a greater concentration of H+ ions (ten times as many per unit volume).
Sample answer: Water vapor in the atmosphere c. can condense and fall to Earth’s surface as rain, which can contain dissolved acids. Some rain is absorbed into the soil where it can enter plants through their roots.
Pre-Lab Answers
0152_mlbio10_Ch06.indd 290152_mlbio10_Ch06.indd 29 6/29/09 5:16:40 PM6/29/09 5:16:40 PM

0001_Bio10_se_Ch06_LAB.indd 1 6/2/09 6:24:24 PM
Study Guide Interdependence in Nature
Humans affect natural ecological processes through agriculture, urban development, and industry. But ecological science gives us strategies for sustainable development, ways we can protect the environment without slowing human progress.
6.1 6.1 A Changing Landscape
Humans affect regional and global environments through agriculture, development, and industry in ways that have an impact on the quality of Earth’s natural resources, including soil, water, and the atmosphere.
Sustainable development provides for human needs while preserving the ecosystems that produce natural resources.
monoculture (155) nonrenewable resource (157)renewable resource (157) sustainable development (157)
6.2 6.2 Using Resources Wisely
Healthy soil supports both agriculture and forestry.
It is possible to minimize soil erosion through careful management of both agriculture and forestry.
The primary sources of water pollution are industrial and agricultural chemicals, residential sewage, and nonpoint sources.
Common forms of air pollution include smog, acid rain, greenhouse gases, and particulates.
desertifi cation (159) biological deforestation (159) magnifi cation (161)pollutant (160) smog (163) acid rain (164)
6.3 6.3 Biodiversity
Biodiversity’s benefi ts to society include contribu-tions to medicine and agriculture, and the provision of ecosystem goods and services.
Humans reduce biodiversity by altering habi-tats, hunting, introducing invasive species, releasing pollution into food webs, and contributing to climate change.
To conserve biodiversity, we must protect indi-vidual species, preserve habitats and ecosystems, and make certain that human neighbors of protected areas benefi t from participating in conservation efforts.
biodiversity (166) genetic diversity (166)ecosystem diversity (166) habitat fragmentation (168)species diversity (166) ecological hot spot (171)
6.4 6.4 Meeting Ecological Challenges
According to one data set, the average American has an ecological footprint over four times larger than the global average.
By (1) recognizing a problem in the environ-ment, (2) researching that problem to determine its cause, and then (3) using scientifi c understanding to change our behavior we can have a positive impact on the global environment.
ecological footprint (173) aquaculture (176)ozone layer (175) global warming (177)
Think Visually Create a fl owchart that shows the steps in the bio-logical magnifi cation of DDT. Your fl owchart should show how DDT enters the food web and what effects it has on organisms.
66
181Chapter 6 • Crossword • Chapter Assessment
0001_Bio10_se_Ch06_SCA.indd 1 6/2/09 6:29:07 PM
STU
DY
GU
IDE
Humans in the Biosphere 181
Study Online
REVIEW AND ASSESSMENT RESOURCES
Editable Worksheets Pages of Study Workbooks A and B, Lab Manuals A and B, and the Assessment Resources Book are available online. These docu-ments can be easily edited using a word-processing program.
Lesson Overview Have students reread the Lesson Overviews to help them study chapter concepts.
Vocabulary Review The Flash Cards and Cross-word provide an interactive way to review chapter vocabulary.
Chapter Assessment Have students take an online version of the Chapter 6 Assessment.
Standardized Test Prep Students can take an online version of the Standardized Test Prep. You will receive their scores along with ideas for remediation.
Diagnostic and Benchmark Tests Use these tests to monitor your students’ progress and supply remediation.
Performance TasksSUMMATIVE TASK Have students work in small groups to create a pamphlet that could be distributed throughout the community to teach people about the impact humans have on the environment. Tell groups they should include information on sustainable development; using soil, water, and atmospheric resources wisely; the importance of biodiversity; and the challenges humans face in the future. Pamphlets should be a combination of text and illustrations.
TRANSFER TASK Have each student write a magazine article describing a success story of an environmental activist who persuaded a community to change a development plan in order to conserve biodiversity or use resources wisely. Explain to students that, although the situation is hypothetical, their description of humans’ impact on the environment should reflect what they have learned in the chapter.
Answers
THINK VISUALLY
Sample answer: (1) Primary producers in an aquatic food web pick up DDT in the water. (2) Zooplankton consume primary producers, and the concentration of DDT is magnifi ed by 10. (3) Small fi sh consume zooplankton, and the concentration of DDT is magnifi ed by 10. (4) Large fi sh consume small fi sh, and the concentration of DDT is magnifi ed by 10. (5) Fish-eating birds consume large fi sh, and the concentration of DDT is magnifi ed by 10. (6) The concentration of DDT in the fi sh-eating birds is high enough to cause females to produce thin, fragile eggshells. (7) The hatching rate falls, and the popu-lation of the birds decreases.
0152_mlbio10_Ch06.indd 300152_mlbio10_Ch06.indd 30 6/29/09 5:16:57 PM6/29/09 5:16:57 PM
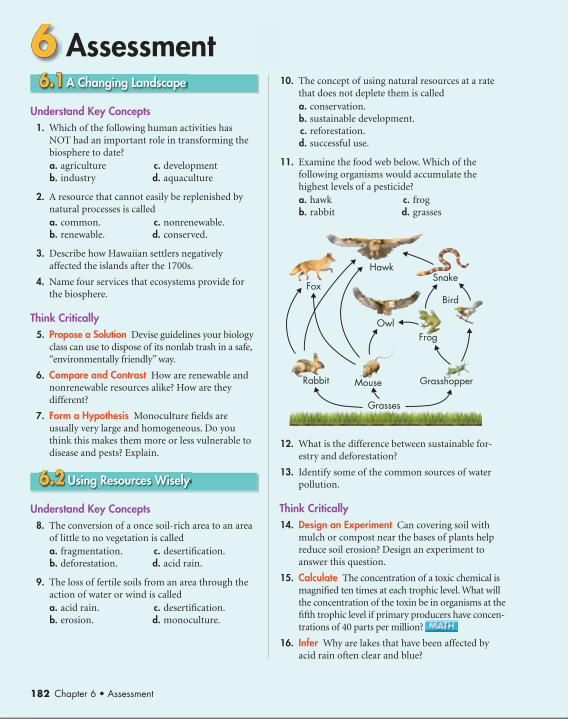
Assessment666.1 6.1 A Changing Landscape
Understand Key Concepts 1. Which of the following human activities has
NOT had an important role in transforming the biosphere to date?
a. agriculture c. development b. industry d. aquaculture
2. A resource that cannot easily be replenished by natural processes is called
a. common. c. nonrenewable. b. renewable. d. conserved.
3. Describe how Hawaiian settlers negatively affected the islands after the 1700s.
4. Name four services that ecosystems provide for the biosphere.
Think Critically 5. Propose a Solution Devise guidelines your biology
class can use to dispose of its nonlab trash in a safe, “environmentally friendly” way.
6. Compare and Contrast How are renewable and nonrenewable resources alike? How are they different?
7. Form a Hypothesis Monoculture fi elds are usually very large and homogeneous. Do you think this makes them more or less vulnerable to disease and pests? Explain.
6.2 6.2 Using Resources Wisely
Understand Key Concepts 8. The conversion of a once soil-rich area to an area
of little to no vegetation is called a. fragmentation. c. desertifi cation. b. deforestation. d. acid rain.
9. The loss of fertile soils from an area through the action of water or wind is called
a. acid rain. c. desertifi cation. b. erosion. d. monoculture.
10. The concept of using natural resources at a rate that does not deplete them is called
a. conservation. b. sustainable development. c. reforestation. d. successful use.
11. Examine the food web below. Which of the following organisms would accumulate the highest levels of a pesticide?
a. hawk c. frog b. rabbit d. grasses
12. What is the difference between sustainable for-estry and deforestation?
13. Identify some of the common sources of water pollution.
Think Critically 14. Design an Experiment Can covering soil with
mulch or compost near the bases of plants help reduce soil erosion? Design an experiment to answer this question.
15. Calculate The concentration of a toxic chemical is magnifi ed ten times at each trophic level. What will the concentration of the toxin be in organisms at the fi fth trophic level if primary producers have concen-trations of 40 parts per million?
16. Infer Why are lakes that have been affected by acid rain often clear and blue?
Fox
HawkSnake
Bird
OwlFrog
GrasshopperMouse
Grasses
Rabbit
182 Chapter 6 • Assessment
0001_Bio10_se_Ch06_SCA.indd 182 6/3/09 4:08:14 PM
6.3
6.4
0001_Bio10_se_Ch06_SCA.indd 183 6/3/09 3:09:07 PM
182 Chapter 6 • Assessment
ASSESSM
EN
T
Lesson 6.1
UNDERSTAND KEY CONCEPTS
1. d 2. c
3. They cut trees to plant crops and introduced nonnative plants, pigs, chickens, dogs, and rats.
4. Sample answer: breathable air, drinkable water, fertile soil, fossil fuels
THINK CRITICALLY
5. Sample answer: Every possible material should be placed in recycle bins, including cans, bottles, plastics, and paper. Food wastes should be com-posted. Hazardous wastes should be collected and disposed of in safe ways.
6. Sample answer: Both renewable and nonrenew-able resources are made by natural ecosystems. However, renewable resources can be produced or replaced by a healthy ecosystem while non-renewable resources cannot be within a reason-able amount of time.
7. Sample answer: Because they are large and homogeneous, monocultures are more vulner-able to disease and pests because if a disease attacks one plant, it can quickly spread to all the other plants and destroy the entire monoculture.
Lesson 6.2
UNDERSTAND KEY CONCEPTS
8. c 9. b 10. b 11. a
12. In sustainable forestry, trees are replanted after they are cut, and no more are cut down than are needed or that can be replaced. In deforestation, trees are cut arbitrarily and are not replanted.
13. industrial and agricultural chemicals, residential sewage, and nonpoint sources such as grease and oil washed off streets by rain or the chemi-cals released into the air by factories and automobiles
THINK CRITICALLY
14. Sample answer: Covering soil with mulch or compost near the bases of plants could reduce soil erosion. A simple experiment to test this hypothesis would be to grow two areas of the same crop, using mulch or compost in one area and not in the other. Results would support the hypothesis if the area of crops with mulch or compost produced more than the area without.
15. 400,000 parts per million
16. Sample answer: The acid rain kills organ-isms in the affected lakes. Without organisms, their wastes, and the turbu-lence caused by their activities, the water remains clear and blue.
Lesson 6.3
UNDERSTAND KEY CONCEPTS
17. b
18. a small area of habitat surrounded by a different habitat
19. ecosystem diversity, species diversity, genetic diversity
0152_mlbio10_Ch06.indd 310152_mlbio10_Ch06.indd 31 6/29/09 5:17:08 PM6/29/09 5:17:08 PM

66.1
6.2
0001_Bio10_se_Ch06_SCA.indd 182 6/3/09 4:08:14 PM
6.3 6.3 Biodiversity
Understand Key Concepts 17. A species that is introduced to an environment
where it has not lived before is described as a. native. c. threatened.
b. nonnative. d. predatory.
18. What is a habitat fragment?
19. List three different kinds of biodiversity that might be described in a given biome.
Think Critically 20. Predict How do you think the loss of biodiversity
would adversely affect humans?
21. Compare and Contrast Explain the difference between species diversity and ecosystem diversity.
6.4 6.4 Meeting Ecological Challenges
Understand Key Concepts 22. The burning of fossil fuels is a direct cause of each
the following EXCEPT a. acid rain. c. smog.
b. global warming. d. the ozone hole.
23. The total impact a person has on the biosphere can be represented by his or her
a. contribution to climate change.b. ecological footprint.c. consumption of fossil fuel.d. production of carbon dioxide.
24. Cite three examples of physical evidence for global warming.
25. What are some of the biological effects of climate change?
Think Critically 26. Relate Cause and Effect Why hasn’t the ozone
layer repaired itself fully since the widespread ban of CFCs in 1987?
27. Apply Concepts Describe some of the steps taken to counter the effects of overfi shing cod in the North Atlantic. Why is overfi shing such a complex environmental issue?
MOVING THE MOAIEaster Island’s environ-ment was not as biologically diverse, and not as resistant to ecological damage, as the Hawaiian Islands. The Rapa Nui cut palm trees for agricul-ture, for logs to move moai, and for wood to make fi shing canoes. They mismanaged cleared fi elds, so fertile topsoil washed away. Meanwhile, rats they brought to the island became invasive. Hordes of the rodents destroyed palm seedlings, ate coconuts, and digested palm seeds before they could germinate. Hawaiians also brought rats to their islands, and rats did serious damage to native Hawaiian plants. But in Hawaii’s more diverse forests, some plant species were not as hard hit by rats and survived. The combination of human activity and the effects of an invasive species led to the destruc-tion of virtually all of Easter Island’s forests. This combination, along with the effects of a harsh climate, limited the island’s carrying capacity for humans from then on.
1. Relate Cause and Effect How did the small size of the island (about half the size of Long Island, New York) affect the outcome of deforestation and pest invasion?
2. Compare and Contrast Gather informa-tion on differences in geography, climate, and biological diversity between Hawaii and Easter Island. How do you think those differ-ences made the islands respond differently to human settlement?
3. Connect to the All human cultures throughout history have interacted with their environments. Do you think that global human society has any lessons to learn from the experiences of the Rapa Nui, the Hawaiians, and other historic cultures?
183Chapter 6 • Untamed Science Video • Chapter Mystery
0001_Bio10_se_Ch06_SCA.indd 183 6/3/09 3:09:07 PM
Humans in the Biosphere 183
ASSESSM
EN
T
After students have read through the Chapter Mystery, discuss how the actions of the Rapa Nui
resulted in the destruction of the forests on Easter Island.
Ask What activities of the Rapa Nui resulted in destruction of Easter Island’s forests? (They cleared trees for agriculture, cut trees to use the logs in mov-ing the moai, and cut trees to make canoes.)
Ask How did the rats reach Easter Island? (They came as stowaways on the Rapa Nui’s boats.)
Ask How did an invasive species contribute to the deforestation of the island? (The rats destroyed coco-nuts that contained the trees’ seeds.)
CHAPTER MYSTERY ANSWERS
1. Sample answer: Because of the small size of the island, relatively few species lived there, and the populations of those species were relatively small. The lack of species diversity and genetic diversity made the organisms native to the island vulnerable to disturbance.
2. Sample answer: Easter Island is smaller, the cli-mate is harsher, and the biological diversity is more limited than in the Hawaiian Islands. Those differences made the ecosystem on Easter Island much more vulnerable to the disturbances of human activities than were the ecosystems on the Hawaiian Islands.
3. Sample answer: The experiences of the Rapa Nui, especially, should be a lesson to global human society. The
Rapa Nui both intentionally and unintentionally destroyed Easter Island’s forests, making life for humans impossible on the island. Global human society should learn from that example to use resources wisely and be aware of changes in the environment that could make human life on Earth difficult in the future.
Have students watch the video What Do Zoos . . . Do? in which the Untamed Science
crew explores a zoo’s role in protecting biodiversity.THINK CRITICALLY
20. Sample answer: The loss of biodiversity would limit the medicines that could be developed, make crop plants more vulnerable to diseases, and it would make ecosystems less stable, produc-tive, and valuable.
21. Species diversity is the number of dif-ferent species in the biosphere or in a particular area. Ecosystem diversity refers to the variety of habitats, com-munities, and ecological processes in the biosphere.
Lesson 6.4
UNDERSTAND KEY CONCEPTS
22. d 23. b
24. Earth’s temperatures are getting warmer, sea ice is melting, and sea levels are rising.
25. Sample answer: Organisms move toward cooler places away from the equator and from warm lowlands to cooler, higher altitudes. Plants flower and animals breed earlier as though spring begins earlier.
0152_mlbio10_Ch06.indd 320152_mlbio10_Ch06.indd 32 6/29/09 5:17:21 PM6/29/09 5:17:21 PM

Connecting Concepts
Use Science GraphicsThe graph shows the amount of bluefi n tuna caught by the United States in the Atlantic Ocean between 2002 and 2006. Use the graph to answer questions 28 and 29.
28. Predict What trend would you expect to see in the annual catch from 2006 to 2007?
29. Propose a Solution What recommendations would you make to help the bluefi n tuna popula-tion recover in the next decade or two?
Write About Science 30. Explanation Write a paragraph explaining the
value of wetlands to human societies. In your paragraph, include the concept of biodiversity as well as the role of wetlands in maintaining water resources for human use.
31. Assess the Why is it important to maintain species diversity in areas where humans live?
32. Assess the What environmental factors make high levels of biodiversity possible in most coastal waters? Refer to the discussion of abiotic and biotic factors in Chapter 4 if you need help answering this question.
The following graph shows the number of species introduced to new habitats in the United States in the last century. Some of the species were relocated to new habitats within the United States while others were imported from other countries.
33. Interpret Graphs Of domestic species and foreign species, which showed the greatest percentage increase between the 1901–1950 period and the 1951–1996 period?
a. domestic species b. foreign species c. Both increased the same amount. d. There is not enough information to tell.
34. Draw Conclusions Which of the following state-ments about introduced species is most likely true based on the data shown?
a. Species introduced from foreign countries are always more harmful than species relocated within the country.
b. All introduced species are brought into this country by accident.
c. It is likely that the increase in the number of introduced species is due to increased global travel, trade, and communication.
d. The number of introduced species is likely to fall in the next half-century.
Daphnia Heart Rate and Caffeine
Tuna
Cat
ch
(met
ric
tons
)
U.S. Catch of Atlantic Bluefin Tuna2000
1600
1200
800
4000
2001
Year2002 2003 2004 2005 20072006
Introduced Species
600
500
400
300
200
100
0
Num
ber
of S
peci
es
1850 –1900 1951–1996
Years850 1900
Domestic
1901–1950
Foreign
184 Chapter 6 • Assessment
0001_Bio10_se_Ch06_SCA.indd 184 6/3/09 3:09:26 PM 0001_Bio10_se_Ch06_STP.indd 185 6/12/09 10:50:28 AM
THINK CRITICALLY
26. The ozone layer hasn’t repaired itself fully yet because CFCs can remain in the atmosphere for a century. CFCs were widely used for many decades before the ban went into place, so their effects are still visible.
27. Sample answer: The steps taken include regu-lating how many fish could be caught in U.S. waters, closing certain areas to fishing until stocks recover, closing some areas season-ally to allow fishes to breed and spawn, and using aquaculture as an alternative to fishing. Overfishing is a complex issue because fleets from other countries fish outside of U.S. territo-rial waters, and countries are reluctant to accept conservation efforts that could cause job loss.
Connecting Concepts
USE SCIENCE GRAPHICS
28. Sample answer: The catch would decrease.
29. Sample answer: The fishing of bluefin tuna should be regulated, strictly limiting the catch for at least the next decade.
WRITE ABOUT SCIENCE
30. Sample answer: Wetlands naturally filter toxins and other materials from water, making the water resources safer for humans, as well as healthier for affected ecosystems. In addition, wetlands provide habitats for many species, increasing an area’s ecosystem diversity and spe-cies diversity.
31. Sample answer: Species diversity in an area contributes to the overall biodi-versity of the area. Biodiversity’s ben-
efits to society include contributions to medicine and agriculture and the provision of ecosystem goods and services.
32. Sample answer: Most coastal waters are in the photic zone. As a result, they receive plenty of solar energy for
the producers that support the food chains there. In addition, runoff from rivers and streams may bring nutrients to coastal waters that also increase the productivity of these ecosystems. Finally, estuaries, the intertidal zone, and the coastal ocean provide varied habitats that encourage biodiversity. PURPOSE Students will draw conclusions about the effect
of introduced species in the United States.
PLANNING Review with students how species introduced to new habitats can become invasive and threaten biodiversity in the habitat.
ANSWERS
33. b
34. c
ASSESSM
EN
T
184 Chapter 6 • Assessment
0152_mlbio10_Ch06.indd 330152_mlbio10_Ch06.indd 33 6/29/09 5:17:34 PM6/29/09 5:17:34 PM

Answers 1. C
2. C
3. C
4. A
5. B
6. B
7. A
8. C
9. A
10. Sample answer: They can use it to analyze human impact on ecosystems and make com-parisons among different populations.
0001_Bio10_se_Ch06_SCA.indd 184 6/3/09 3:09:26 PM
Humans in the Biosphere 185
Multiple Choice
1. Which of the following statements about renewable resources is TRUE?A They are only found in tropical climates.B They can never be depleted.C They are replaceable by natural means.D They regenerate very quickly.
2. Which of the following is a nonrenewable resource?A wind C coalB fresh water D topsoil
3. Which of the following is NOT a direct effect of deforestation?A decreased productivity of the ecosystemB soil erosionC biological magnifi cationD habitat destruction
4. The total variety of organisms in the biosphere is calledA biodiversity.B species diversity.C ecosystem diversity.D genetic diversity.
5. Ozone is made up ofA hydrogen. C nitrogen.B oxygen. D chlorine.
6. Ozone depletion in the atmosphere has been caused byA monoculture.B CFCs.C suburban sprawl.D soil erosion.
7. In a food chain, concentrations of harmful substances increase in higher trophic levels in a process is known asA biological magnifi cation.B genetic drift.C biological succession.D pesticide resistance.
Questions 8 and 9
Fire ants fi rst arrived in the United States in 1918, probably on a ship traveling from South America to Alabama. The maps below show the geographic loca-tion of the U.S. fi re ant population in 1953 and 2001.
8. Which of the following statements about fi re ants in the United States is TRUE?A They reproduce slowly.B They are a native species of the United States.C They are an invasive species.D They do not compete with other ant species.
9. By 2010, fi re ants are MOST likely toA have spread to a larger area.B have reached their carrying capacity.C die out.D return to South America.
Open-Response
10. Describe how ecologists use the ecological foot-print concept.
Standardized Test Prep
If You Have Trouble With . . .Question 1 2 3 4 5 6 7 8 9 10
See Lesson 6.1 6.2 6.2 6.3 6.2 6.4 6.2 6.3 6.3 6.4
1953
2001
0001_Bio10_se_Ch06_STP.indd 185 6/12/09 10:50:28 AM
Humans in the Biosphere 185
ASSESSM
EN
T
Test-Taking Tip
USE TIME WISELY
Advise students that if they are taking a long time to answer a question, they should move on to other questions and come back to the diffi cult question later. In answer-ing other questions, they may remember the information needed to answer the skipped question.
0152_mlbio10_Ch06.indd 340152_mlbio10_Ch06.indd 34 6/29/09 5:17:50 PM6/29/09 5:17:50 PM

NATIONAL SCIENCE EDUCATION STANDARDS
UCP I, II, III
CONTENT C.4.a, C.4.c, C.4.e, F.3, F.4, F.5, F.6
INQUIRY A.1.f, A.2.e, A.2.f
Ecology
186 Unit 2 Project
Unit Project
Refl ection Questions1. Score your performance using the rubric below.
What score did you give yourself?
2. What did you do well in this project?
3. What about your performance needs improvement?
4. After hearing various sides of the argument, meet with a partner and discuss which side you agree with the most. Justify your opinion.
Development DebateA large company wants to build a new factory on your town’s wetlands. Many people in the town are opposed to the idea, claiming it will disturb the local ecosystem and cause problems for residents. Others support the development, arguing that the new factory will bring jobs and money into the town. Representa-tives have been called in to debate the issue before the town council.
Your Task Take on one of the stakeholder roles listed below. Find evidence to support that point of view and debate the issue in class. The roles are
• Conservation ecologist• CEO of the company• Town mayor who supports the development• Resident of the town who lives next to the wetlands
Be sure to• justify your arguments with credible
information.• present your arguments in a clear and convincing
manner.
Assessment Rubric
Student justifies his/her argument with sophisticated and highly credible information.
Student justifies his/her argument with logical and credible information.
Student provides some credible information, but other points are weak or inaccurate.
Student provides mostly illogical and invalid evidence to support his/her argument.
Ideas are presented in a highly convincing and clear manner. Student shows a deep understanding of the issues involved.
Ideas are presented in an effective and clear manner. Student shows a solid understanding of the issues involved.
Some ideas are presented in an unclear manner. Student shows a limited understanding of the issues involved.
Most ideas are presented in an unclear manner. Student shows a very limited understanding of the issues involved.
4
3
2
1
Evidence ProvidedScore Quality of Performance
0001_Bio10_se_U2R.indd 186 9/23/08 8:07:03 PM
186 Unit 2 Project
UN
IT 2
Plan Ahead
Have students preview the Unit 2 Project a few days before the day of debate. Suggest they review ways in which human activities can affect the environ-ment. Then, divide the class into groups of four. Assign each member of the groups one of the four roles for the debate. Tell students they might search online to fi nd evidence to support the position assigned. Encourage students to talk to classmates with the same role about evidence and arguments that could be persuasive in a debate.
Materials Internet access for research
Monitor the Project Suggest students make lists of evidence and argu-ments supporting the position of the role they have taken. Ask individual students how they are preparing for the debate and what evidence they have found that supports their position. On debate day, each group could be given about 10 minutes to debate the issue, or students with the same role could collaborate in a debate that includes the entire class.
Project AssessmentMake sure students use the rubric and refl ection questions to assess their work. Then, use the rubric to assign a fi nal score. If desired, talk with students about any differences between their self-assessment scores and your assigned score.
To be successful in the 21st century, students need skills and learning experiences that extend beyond subject area mastery. The Unit 2 Project helps students build the following 21st Century Skills: Information and Media Literacy; Communication Skills; Critical Thinking and Systems Thinking; Problem Identifi cation, Formulation, and Solu-tion; Interpersonal and Collaborative Skills; Self-Direction; Accountability and Adapt-ability; and Social Responsibility.
FOCUS ON CREATIVITY AND INTELLECTUAL CURIOSITY Extend this Unit Project by asking small groups of students to use what they have learned from the debate to write a screenplay about an environmental controversy within a community.
For more practice building 21st Century Skills, see The Chapter Mystery pages in Study Workbook A.
0186_mlbio10_U2.indd 10186_mlbio10_U2.indd 1 6/29/09 5:18:20 PM6/29/09 5:18:20 PM