chapter 6 a comprehensive model on the investment...
TRANSCRIPT

219
CHAPTER 6
A Comprehensive Model on the Investment
Behaviour of Mutual Fund Investors
6.1 Introduction
Mutual fund (MF) industry in emerging markets has become
highly competitive which necessitates that MF marketers must fully
understand the buying behaviour of investors to be able to effectively
market their MF schemes. Hence, there is a felt need amongst MF
marketers of a comprehensive investment behaviour model to
understand the investors‟ buying decision process for MF schemes.
The current state of knowledge about the investor behaviour is
found not to be quite satisfactory and in fact it is inadequate when
applied to understand the buying decision process of MF investors. The
fundamental normative model of investment behaviour considers only
risk and return as crucial variables impacting the investors‟ buying
behaviour. Further, the model assumes investors as rational. However,
this has not been the case and humans are shown to be irrational at most
times (Shefrin, 2000). Literature in behavioral finance suggests that

220
investor behavior is “predictably irrational” (Ariley, 2008). Further,
there is adequate evidence in the literature suggesting non economic
motives influencing the behaviour of investors (Nagy and Obenberger,
1994). Hence, normative model of investment behavior has only limited
applicability for the MF marketers (Capon, Fitzsimons and Prince, 1996)
and regulators. Hence a model that captures the essence of traditional
finance, behavioral finance and consumer behavior is likely to provide
more insight into the buying decision process of MF investors. This has
more relevance in the current context as today shopping for financial
instrument has become increasingly like shopping for any other
consumer items (Wilcox, 2003).
In this chapter, therefore, a new comprehensive model of investment
behaviour is proposed to explain the impact of investors‟ subjective
knowledge (SK), perceived purchase risk (PPR), and purchase decision
involvement (PDI) on their MF investment behaviour. The proposed
model is tested empirically using the data collected through a survey
wherein a pretested structured questionnaire was administered to the 268
MF investors. In the following section, we explain the theoretical basis
for the model and provide the support for the hypothesized linkages
embedded within.

221
The rest of this chapter is organized in the following way. In
Section 6.2, the relevant literature is critically reviewed and
summarized. Section 6.3 proposes the new investment behaviour model.
The hypotheses of the study are also discussed in this section. Section
6.4 discusses the methodology and the constructs used in the study.
Section 6.5 shows the study results. Section 6.6 presents the conclusion
based on the findings of the study and further highlights the contribution
of this study. The implications of the study for MF managers and
regulators are discussed in Section 6.7. Finally, section 6.8 records the
limitations of this research and possible scope of future research in this
area.
6.2 Literature review
Over the past two decades, MFs have been the focal point of an
increasing number of research studies being conducted in the field of
finance. The basic issues of research dealt in by majority of these studies
have been: performance evaluation of MF (Carhart, Carpenter and
Lynch, 2002; Grinblatt and Titmann, 1993; Malkiel, 1995a; Sharpe,
1966), assessment of market timing ability of fund managers (Chang and
Lewellen, 1984; Grant, 1977; Jiang, 2003), closed end fund puzzle

222
(Hardouvelis La Porta and Wizman, 1993; Malkiel, 1977, 1995b;
Pontiff, 1995). There has, however, been a dearth of studies undertaken
specifically to understand the investment behaviour of MF investors
(Wilcox, 2003). The research pertaining to investors‟ behaviour in
traditional finance has made only little advances beyond the
perspectives, provided by the Markowitz (1952) framework, where
investors (assumed to be the rational utility maximizers) consider
expected returns and risks of the investing avenues as the only crucial
variables while making their investment decisions (Sharpe, 1994; Tobin,
1965).
In recent years numerous behavioural finance studies have
shown that in reality investors are “predictably irrational” and various
kind of behavioural biases (non-economic motives) influence their
investment decision (Arieley, 2008; Barber and Odean, 2001; Nagy and
Obenberger, 1994; Odean, 1999; Shefrin, 2000). Specifically, the
behavioural finance studies suggests that MF investors (a) chase past
performance (Barber et al., 2005); (b) are reluctant to sell their losses
(Barber et al., 2005); (c) react differently to various form of fund
expenses (Barber et al., 2005); and (d) attribute successful outcomes to
their own skill and blame unsuccessful outcome on bad luck (Shefrin,
2000). As yet, behavioural finance research provides little insight into:

223
(a) the causes of these behavioural biases; (b) the impact of behavioural
biases on investor‟s decision making process (Bailey et al., 2010)76
.
Finding a clear insight in to the above issues is of utmost significance
for the marketers of MFs as the shopping for financial instruments has
become increasingly like shopping for any other consumer items
(Wilcox, 2003) wherein, prospective investors now have options to
choose from a variety of financial instruments77
being offered to them.
The studies in consumer behaviour literature have proposed
various consumer behaviour models, which provide some insights into
the factors that influence consumer behaviour (Engel et al., 1995;
Howard and Sheth, 1969; Nicosia, 1966)78
. Nicosia (1966) was the first
to propose a consumer behaviour model.The model focused on the
conscious, deliberative decision making behaviour of consumer. Further,
the model views the act of purchase as only one of the stages in an
ongoing consumer decision making process. The model suggests
consumers as moving from general product knowledge to specific brand
76
Recently, studies have shown that risk perception (Nosic and Weber, 2010) and
investors knowledge (Curtis, 2004) is likely to be linked with the behavioural biases
among investors. 77
Corporate debt and equity securities, fixed deposits of companies and commercial
banks, MF schemes, Unit-linked insurance products, Chit funds from the Non-bank
finance companies etc. 78
There are various consumer behaviour models. However, only three of these models
have received adequate acclamation & recognition viz., the models proposed by the
Nicosia (1966), Howard and Sheth (1969) and Engel et al. (1995).

224
knowledge and from a passive position to an active state which are
motivated towards specific brand knowledge. The model, however,
suffers from the following limitations. First, in spite of the fact that
model discusses about consumer knowledge and motivation, it lacks
specificity with respect to the linkages among the two constructs.
Second, model does not clearly identify elements/factors (Rau and
Samiee, 1981). Third, it does not define any of the factors or elements
in variable terms; hence variables have not been operational (Rau and
Samiee, 1981). Fourth, the level of parsimony is low due to complex
linkage in the model which appears to be all encompassing, thus
resulting in many conceptual overlaps among the elements of the model
(Rau and Samiee 1981). Finally, model cannot be validated (Foxall,
1980).
Howard and Sheth (1969) proposed another model of consumer
behaviour. Their model attempted to depict rational brand choice
behaviour by buyer under conditions of incomplete information and
limited abilities. The model identifies many of the variables influencing
consumers and details how they interact with each other. This model
assumes that buyers do pass through a cognitive, affective and
behavioural stage when there is a high degree of involvement with the
product category, which is perceived to have a high degree of

225
differentiation of product within it (Kotler, 1991). However, the model
has been subject to the following criticisms: First, the sharp distinction
between exogenous and other variables has not been made (Loudon and
Bitta, 2002; Rau and Samiee, 1981). Second, in absence of definitions of
the variables, no attempt has been made to operationalize the variables
(Rau and Samiee, 1981). Third, model cannot be validated because of
there being too many variables in the model (Foxall, 1980; Loudon and
Bitta, 2002).
One of the best examples of contemporary consumer behaviour
models is probably the Engel- Blackwell- Minard model (Engel,
Blackwell and Minard, 1995), which was originally developed in 1968
by Engel–Kollat–Blackwell (Engel, Kollat and Blackwell, 1968) and has
since been subjected to numerous revisions. It stands as one of the most
popular representations of consumer behaviour. Similar to Howard and
Sheth model, the authors recognize two significantly different modes of
operation by consumers. One is described as extended problem solving
(EPS) which is characterized by high level of involvement and/or high
level of perceived risk. In this behaviour, a consumer has high
motivation to search for brand information and one gets involved in
rigorous product evaluation process. The other mode of operation is
described as limited problem solving (LPS) behaviour in which the

226
consumer is operating in low level of involvement and/or low levels of
perceived purchase risk and has low motivation to search for brand
information and to get involved in non-rigorous evaluation of
alternatives. The authors argue that the same basic model can be used to
characterize both EPS and LPS behaviour. What changes is the degree to
which a consumer experiences various stages in the model.
As per this model, the buying decision process consists of five
stages: a) problem recognition, b) information search, c) evaluation of
alternatives, d) purchase decision and e) post purchase behaviour. This
Engel-Kollat-Blackwell model focuses on the level of consumer
involvement while emphasizing on the buying decision process of
consumers. The model, however, suffers from the following limitations.
First, the model is too complex to be verified empirically (Rau and
Samiee, 1981). Second, there is vagueness regarding the role of some
variables. For example, the influence of environmental variable is noted
but their role in affecting behaviour is not well specified (Loudon and
Bitta, 2002). Third, even though the model provides a comprehensive
framework to understand the process of buying decision, it lacks clarity
in terms of causal relationship among variables which have more value
to the marketers, for developing marketing strategy.

227
Overall, the above three most recognized models of consumer
behaviour, (i.e. Nicosia, Howard and Sheth and Engel et al. models)
suffer from the following limitations. First, the above models implicitly
or explicitly acknowledge the impact of consumers‟ knowledge,
perceived purchase risk and involvement on their buying behaviour, but
how these variables interact to impact the buying behaviour is not
clearly stated. Second, the methods of measurement of these variables
have not been clearly identified. Third, even though the above
conceptual models are supported by large volume of empirical work,
most of them have been advanced in the context of studying the
purchase of tangible goods rather than intangible financial goods.
Hence, there is a felt need amongst MF marketers and
researchers for a comprehensive model to understand the investor‟s
buying decision process for MFs.
6.3 Proposed comprehensive model on the investment
behaviour of MF investors
A new comprehensive model on the investment behaviour of MF
investors is proposed as shown in figure 6.1. As per the proposed model,

228
investors purchase decision involvement (a construct used to capture the
investors level of motivation with purchase) mediates the impact of
investors subjective knowledge ( a construct used to capture the
investors‟ confidence in her making an investment decision) and
perceived purchase risk ( a construct used to capture the overall
perceived risk associated with MF purchase as perceived by investor) on
the investment behaviour of MF investors particularly information
search and information processing behaviour.
The model suggests that (a) MF investors subjective knowledge
(SK) negatively impact MF investors perceived purchase risk (PPR)
associated with MF; (b) MF investors SK positively impact purchase
decision involvement (PDI); (c) MF investors PPR negatively impact
PDI; (d) MF investors PDI positively impact their depth of information
search and information processing behaviour; (e) MF investors depth of
information search positively impacts their depth of information
processing. In the following sections (from 6.3.1 through 6.3.5) we
provide theoretical basis for the model and provide support for the
hypothesized linkages embedded within.

229
Figure 6.1
Proposed comprehensive model of investment behaviour
6.3.1 Impact of subjective knowledge on perceived purchase risk of
MF investors
Knowledge has been found to influence all the phases in the
decision process (Bettman and Park, 1980) including the consumers
evaluation of risk inherent in the purchase (Murray and Schlatcer, 1990).
Researchers have distinguished objective knowledge (i.e. what is
actually stored in memory) from subjective knowledge (i.e. what
individual perceive they know). It has been suggested that consumers
Perceived
purchase risk
Subjective
Knowledge
Purchase
decision
involvement
Information
search
behaviour
Information
processing
behaviour
(-)H3
(+)H2
(-)H1
(+)H4
(+)H5b
(+)H5a

230
SK is more related to her self confidence regarding decision making
(Brucks, 1985) hence is likely to influence the consumers‟ evaluation of
risk with the purchase. In consumer behaviour literature, Bauer (1960)
introduced the concept of perceived risk. It is defined as individual‟s
subjective feeling of uncertainty that the consequence of potential
purchase will be favorable (Cox, 1967; Cunningham, 1967). In the
context of tangible goods, there is a consensus among researchers that
subjective knowledge negatively influences the perceived purchase risk
(Havlena and DeSarbo, 1990); however there is a lack of studies that
have investigated the above relationship in the context of intangible
financial goods. Based on the above discussion it is hypothesized that;
H1: MF investors‟ subjective knowledge has a negative impact on their
perceived purchase risk.
6.3.2 Impact of subjective knowledge on purchase decision
involvement of MF investors
Literature in consumer behaviour suggests that consumer
knowledge and involvement are important constructs in understanding
consumer behaviour (Huffman and Houston, 1993; Howard, 1994).
Purchase decision involvement can be defined as the extent of interest

231
and concern that a consumer brings to bear upon a purchase decision
task (Mittal, 1989). A few studies have empirically investigated the
relationship between the SK and PDI (Chang and Huang, 2002; Lin and
Chen, 2006; Park and Moon, 2003). Study suggests that; (a) consumers‟
product knowledge is positively associated with involvement (Park and
Moon, 2003), and (b) product involvement mediates the impact of
product knowledge on purchase decision (Lin and Chen, 2006). Based
on the above discussion we posit the following hypothesis;
H2: MF investors‟ subjective knowledge has a positive impact on their
level of PDI.
6.3.3 Impact of perceived purchase risk on purchase decision
involvement of MF investor
There seems to be consensus among researchers that PPR impact
PDI (Chaffee and Mcleod, 1973; Laurent and Kapferer, 1985;
Rothschild, 1979). However the researchers disagree with the direction
of the impact of PPR on PDI. A few researchers argue that high PPR
puts consumers in a distressed and anxious state, which in turn motivates
them to engage in extensive problem solving activity to resolve it (Engel

232
et al., 1995); hence PPR is likely to positively impact PDI. Several
empirical studies have been conducted to assess the veracity of the
above theory and found mixed results. While several studies have
supported the above theory, an equal number of studies have reported
contradictory findings (Gemunden, 1985). Specifically, it has been
suggested that during purchase of complex products which requires high
technical knowhow and expertise consumers are likely to be motivated
to rely on few personal formal sources (Cho and Lee, 2006; Coleman,
Warren and Houston, 1995; Gemunden 1985) rather than actively
engaging in purchase and seeking information from multiple sources.
Hence it is likely that the impact of PPR on PDI is context specific.
Particularly in the context of the purchase of complex products,
consumers PPR will negatively impact consumers‟ motivation to engage
with purchase decision, hence their PDI.
Investment decisions particularly investment in MF is a complex
task. This is due to the fact that investors may have to go through a
complex decision making process due to the available information about
the MF product which, though abundant, is not quite organized and
comprehensible. The above discussion conjectures that PPR will
negatively impact the level of PDI. Therefore we posit the following
hypothesis;

233
H3: MF investors‟ PPR has a negative impact on their level of PDI.
6.3.4 Impact of purchase decision involvement on the depth of
information search by MFs investor
Three widely recognized contemporary consumer behaviour
model i.e. Nicosia (1966) model, Howard and Sheth model (1969) and
Engel- Blackwell- Minard model (Engel et al., 1995) considers
consumer search for information as an important prepurchase activity.
PDI is likely to have positive impact on the depth of information search.
High PDI consumers are likely use more than one source of information
(Alexander et al, 1997; Richins and Bloch, 1986) and will have a
tendency to use these sources to a high extent in order to seek advanced
information and process all relevant information‟s in detail (Beatty and
Smith, 1987; Gensch, Javalgi, and Rajshekhar, 1987). Based on the
above discussion we posit the following hypothesis;
H4: MF investors‟ PDI has a positive impact on their depthof
information search.

234
6.3.5 Impact of depth of information search and purchase decision
involvement on the depth of information processing by MF investors
Information processing is an important prepurchase activity
which includes identification of key attribute(s) for comparing the
various brands of products to be purchased and comparison of the
available brands on the basis of identified attributes.
The depth of information processing of MF investors is likely to
be positively impacted by depth of information search and level of PDI.
This is due to the fact that high depth of information search positively
impacts the attributes information available with the consumer at the
time of evaluation of products/brands. Hence with high depth of
information search consumer will bring more number of dimensions at
the time of information processing (Brucks, 1985; Johnson and Russo,
1984) which will positively impact the depth of information processing.
Further, depth of information processing is also positively
impacted by level of PDI. High PDI consumers have clearly articulated
attributes to compare brands (Lee and Marlowe, 2003). They engage in
extensive evaluation of attributes and products (Hansen, 2005). Further
they are likely to engage in high degree of cognitive activity and will

235
make strong efforts in evaluating and comparing products before
reaching a reasoned decision (Dawar and Parker, 1994). Based on the
above discussion it is hypothesized that
H5a: MF investors‟ depth of information search has a positive impact on
their depth of information processing.
H5b: MF investors‟ PDI has a positive impact on their depth of
information processing.
6.4 Methodology
6.4.1 Sample
The data was collected through a survey wherein a pretested structured
questionnaire was administered to the 350 respondents. The survey
respondents were conveniently selected from those who invested in one
or more MF scheme(s) within one month period prior to the survey date
and were based in the Jammu region of J&K (India). The condition that
respondent must have invested in one or more MF scheme(s) within one
month period prior to the survey date was applied so as to more clearly
measure the respondent‟s PPR, SK and PDI close to their purchase of

236
MF schemes. Further, the framing effect (i.e. investment choices
available with individual investor) during their investment decision was
controlled in the study by the nature of sample itself. The study was
confined to individual investors and institutional investors were
excluded from the study, hence each respondent had equal access to all
investment choice available for investors in India.
Since it was hard to reach the population, we used convenience sampling
method and identified respondents for the study by reaching to the place
where they are reasonably expected to gather. The local offices of the
five Asset Management Companies located in Jammu region, Jammu &
Kashmir (India) was identified for this purpose. A self administered
survey questionnaire was used to collect data. During the survey the
questionnaire was handed out to respondents who were asked to return
the filled questionnaire.
6.4.2 Survey Design and analysis
This study was conducted in four stages. In the first stage
(Sections 6.2 and 6.3); relevant literature was reviewed to propose a
comprehensive investment behaviour model. In this stage series of
hypotheses were also proposed. In the second stage, structured

237
questionnaire was developed and pretested for validity and reliability.
The constructs used in the pretested questionnaire are described in
Section 6.4.3. In the third stage, the data was collected through a survey
wherein a pretested structured questionnaire was administered to the 350
respondents. The total 276 respondents (78.25%) returned the filled
questionnaire. Among the 276 responses received, 8 responses were
found to be incomplete and were not included in the study. The total
usable responses were 268 (76.57 % of the sample size) which forms the
basis for the study. The final (fourth) stage involved following four
steps. In step 1, the dimensionality and reliability of the constructs was
tested. The exploratory factor analysis (EFA) was used to assess the
dimensionality of the constructs (Hair et al., 2005). Cronbach‟s alpha
was used to test the reliability of the constructs used in this study (Hair
et al., 2005). In step 2, discriminant validity is assessed for every
possible pair of constructs by constraining the estimated correlation
parameter between them to 1.0 and then performing a chi-square
difference test on the values obtained for the constrained and
unconstrained model (Anderson and Gerbing, 1988). A significantly
lower chi-square value in an unconstrained model indicates that
discriminant validity is achieved. In step 3, convergent validity is
assessed from the measurement model by determining whether each
indicator‟s estimated pattern coefficient on its posited underlying

238
construct factor is significant. In step 4, structural equation modeling
(SEM) with maximum likelihood estimate (AMOS 16) was used to test
the proposed hypotheses and the overall fit of the proposed model and
was compared with alternative models using goodness of fit measures.
6.4.3 Constructs used in the pretested questionnaire
This section describes the operationalization of various
constructs used in the study.
6.4.3.1 Subjective Knowledge (SK)
Subjective knowledge is defined as MF investor‟s subjective
assessment of perceived familiarity with the MFs (Brucks, 1985). Three
items on the five point Likert scale was used to operationalize SK. The
scores of the individual items were added to find the overall score. The
items used to measure SK are shown in table 6.1.
6.4.3.2 Perceived purchase risk (PPR)
PPR is defined as individual‟s subjective feeling of uncertainty
that the consequence of potential purchase will be favorable (Cox 1967;

239
Cunningham 1967). This study measured PPR based on measures use to
measure PPR in accounting services (Garner and Garner, 1985) and
banking services (Heaney and Goldsmith, 1999). The PPR was
measured by 4 items five point Likert scale; where 1 = not at all and 5 =
very much. The score of the individual items were added to find the
overall score. The items used to measure PPR are shown in table 6.1.
6.4.3.3 Level of purchase decision involvement (PDI)
To measure PDI, Laurent and Kapferer abridged Consumer
Involvement Profile (CIP) (Laurent & Kapferer, 1985) was used. The
PDI was measured by 3 items five point Likert scale. The scores of the
individual items were added to find the overall score. The items used to
measure PDI are shown in appendix table 6.1.
6.4.3.4 Depth of information search
It connotes the effort that an investor makes in searching and
seeking pre-purchase information. It was measured by 12 items five
point Likert scale; where 1= did not use and 5= used a lot. Each item
represented some particular source of information which investors can
possibly use as a source of information before/ at the time of purchase of
the scheme(s). The scores of the individual items were added to find the

240
overall score. The items used to measure the depth of information search
are shown in table 6.1.
6.4.3.5 Depth of information processing
It connotes the level of effort done by the respondents to evaluate
and compare the MF schemes before reaching to decision. It was
measured by 12 items five point Likert scale; where 1= did not use and
5= used a lot. Each items represented some particular attribute of the MF
schemes which investors can possibly use to compare the various MFs
before/ at the time of purchase of the MF schems(s). The scores of the
individual items were added to find the overall score. The items used to
measure depth of information processing are shown in appendix table
6.1.
6.5 Results
The demographic profiles of the sample MF investors are same
as shown in table 3.1. This section is organized as follows. First, the
scale refinement, dimensionality and reliability of each of the latent
constructs used in this study are discussed. Second, the results of test of
discriminant validity of the constructs are discussed. Next, the results of

241
the test of convergent validity are discussed. Fourth, the results of the
test of proposed hypotheses of the study are discussed. Finally, the result
of the overall fit of the proposed model is discussed and the proposed
model is compared with alternative models.
6.5.1 Dimensionality and reliability of latent research constructs
The test results of dimensionality and reliability of the constructs
are shown in Table 6.2. The dimensionality is assessed using exploratory
factor analysis (EFA), a method based on the pattern of correlations
between the questionnaire item scores. If all items share moderate to
strong correlations, this produces a single 'factor' and suggests that the
scale measures a single dimension. Several groups of such items
produce several factors, suggesting that several dimensions are being
measured through a single construct. Principal component analysis with
varimax rotation was conducted to identify the number of dimensions
(factors).
To determine the appropriateness of factor analysis, the Kaiser-
Meyer-Olkin (KMO) and the Bartlett‟s test of Sphericity are examined.
The KMO measure of sampling adequacy for all the constructs is above
minimum acceptable value of 0.60, which means data is adequate for
EFA (Tabachnick and Fidel, 1989). The Bartlett‟s test of Sphericity is

242
also found to be significant (p < .001). A significant Bartlett‟s test of
Sphericity indicates that each factor identified by EFA has only one
dimension and each attributes load only on one factor.
First the EFA of subjective knowledge construct was examined.
Principal components analysis of subjective knowledge construct reveals
the unidimensional nature of the construct as all the items are loaded
into one single factor. Second, the EFA of PPR was examined. Principal
components analysis of PPR construct also reveals the unidimensional
nature of the construct as all the items are loaded into one single factor.
Third, the principal component analysis of PDI construct also revealed
its unidimensional nature.
Fourth, “depth of information search” construct was examined
for the factorability of the twelve items “depth of information search”
scale by using correlation method. A result reveals that two items did
not correlate at least 0.3 with at least one other item; hence these items
were not included in the study. The items which did not correlate with
any other items were “To what extent you have used MF sales agent to
gather information before the purchase of recent MF scheme” and “To
what extent you have used banks to gather information before the
purchase of recent MF scheme”. Principal component analysis was used

243
to identify the underlying factors of the “depth of information search”
scale. The two factor solution which explained 49.27 % of the variance
was preferred because of its previous theoretical support. Two items
with high loading on the third factor were eliminated. The items were
“To what extent you have used mail to gather information before the
purchase of recent MF scheme” and “To what extent you have used
financial portals to gather information before the purchase of recent MF
scheme”. A principal component analysis of remaining 8 items, using
varimax rotations was conducted, with two factors explaining 55.23 %
of variance. A careful analysis of items under construct „depth of
information search‟ indicates that the items under factor 1 and 2,
respectively, measure the depth of formal information search and the
depth of informal information search by MF investors.
Finally, “depth of information processing” construct was
examined for the factorability of the twelve items “depth of information
processing” scale by using correlation method. Result reveals that all the
items correlate at least 0.3 with at least one other item. A principal
component factor analysis of 12 items, using varimax rotations was
conducted, with two factors explaining 58.51 % of variance. A careful
analysis of items under construct „depth of information processing‟
indicates that the items under factor 1 and 2, respectively, measure the

244
depth of non performance attributes processing and the depth of
performance attributes processing by MF investors.
For all the above constructs, the reported eigen value is greater
than 1 and the factor loadings exceed the acceptable threshold level of
0.4 (Hair et al., 2005).
After identifying the dimensionality, the reliability of the
constructs was measured using the Cronbach‟s Alpha (α). Table 6.1
shows that the reliability of all the constructs as measured by the
Cronbach‟s α is above the recommended minimum acceptable value of
0.7 (Hair et al., 2005). Based on the above results, it is concluded that all
the measures are adequate to measure the constructs of the study.

245
Table 6.1
Dimensionality and reliability of latent research constructs (N=268)
Construct Items Loadings Eigen
Value
KMO Cronbach’s
Alpha
Factor 1 Factor
2
Subjective
knowledge
2.261 0.715 0.836
Compared to average
men and women, I am
very familiar with
wide variety of MF
schemes.
0.892
Compared to my
friends, I am very
familiar with wide
variety of MF
schemes.
0.846
Compared to people
who invest a lot in MF
schemes, I am very
familiar with wide
variety of MF
schemes.
0.866
Perceived purchase
risk
2.385 0.680 0.770
How much there is a
chance that the
agent(s) will mislead
while purchasing MF
scheme?
0.786
How much there is a
chance that there may
be hidden charges
while/after purchasing
MF scheme?
0.745
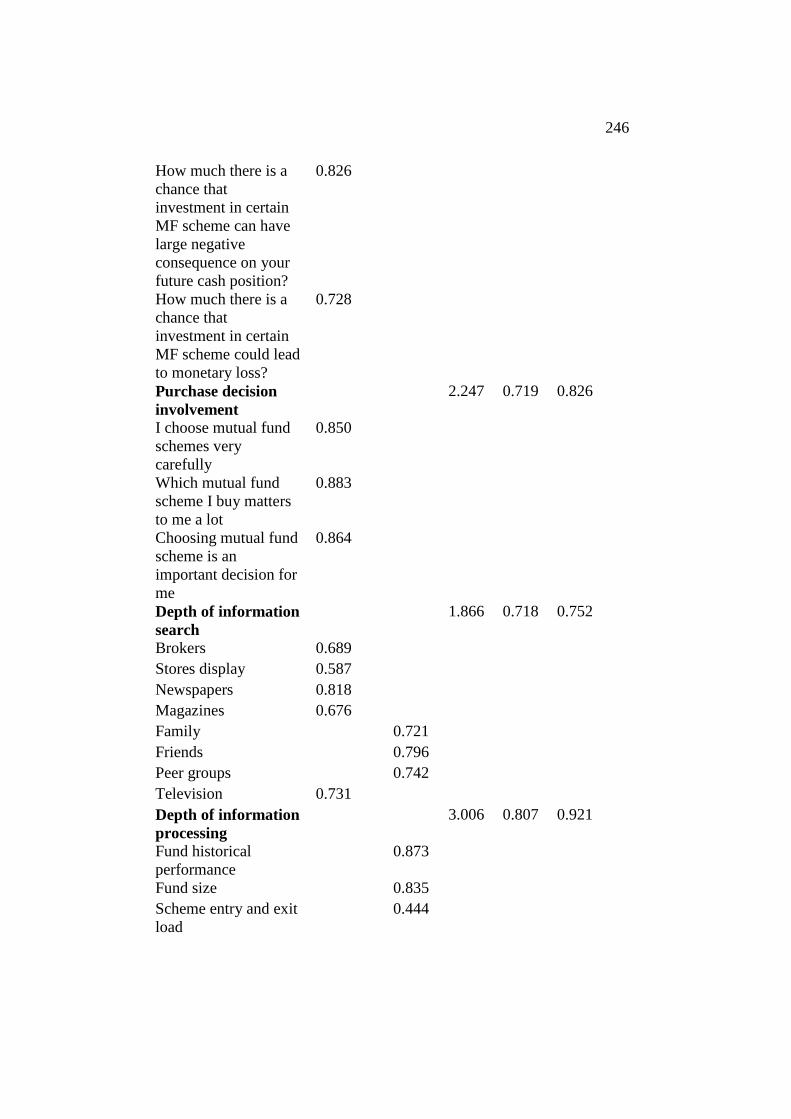
246
How much there is a
chance that
investment in certain
MF scheme can have
large negative
consequence on your
future cash position?
0.826
How much there is a
chance that
investment in certain
MF scheme could lead
to monetary loss?
0.728
Purchase decision
involvement
2.247 0.719 0.826
I choose mutual fund
schemes very
carefully
0.850
Which mutual fund
scheme I buy matters
to me a lot
0.883
Choosing mutual fund
scheme is an
important decision for
me
0.864
Depth of information
search
1.866 0.718 0.752
Brokers 0.689
Stores display 0.587
Newspapers 0.818
Magazines 0.676
Family 0.721
Friends 0.796
Peer groups 0.742
Television 0.731
Depth of information
processing
3.006 0.807 0.921
Fund historical
performance
0.873
Fund size 0.835
Scheme entry and exit
load
0.444

247
Scheme investment
portfolio
0.631
Favorable rating of
MF scheme
0.554
Clarity of accounting
statement
0.711
Reputation of fund
manager
0.768
Fund manager
background
0.838
Investment style 0.742
Scheme tax benefit 0.623
Pending legislation 0.812
Fund advertisement
expense
0.699
Figure 6.2 represents the proposed investment behaviour model with
measurement items. The model specifies the pattern by which each measure
load on particular factor. Based on the findings of exploratory factor
analysis, depth of information search is measured by the two subscales depth
of formal search (search 1) and depth of informal search (search 2).
Similarly, depth of information processing was measured by two subscales
depth of non- performance attributes processing (processing 1) and depth of
performance attributes processing (processing 2).

248
Figure 6.2
Proposed comprehensive model of investment behaviour with
measurement items
Perceived
purchase risk
Subjective
Knowledge
H1
Purchase
Decision
Involvement
H2
X1 X2 X6
X5
X4
X8
X9
X10
H5a
Extent of
information
processing
X11 X12
X3 X7
H3
Extent of
informati
on search
H4
H5b
X13
X14

249
Note:
X1 Compared to average men and women, I am very familiar with wide variety of MF
schemes; X2 Compared to my friends, I am very familiar with wide variety of MF
schemes; X3 Compared to people who invest a lot in MF schemes, I am very familiar
with wide variety of MF schemes; X4 How much there is a chance that the agent(s)
will mislead while purchasing mutual fund scheme?; X5 How much there is a chance
that there may be hidden charges while/after purchasing mutual fund scheme?; X6
How much there is a chance that investment in certain mutual fund scheme can have
large negative consequence on your future cash position?; X7 How much there is a
chance that investment in certain mutual fund scheme could lead to monetary loss? ;
X8 I choose mutual fund schemes very carefully; X9 Which mutual fund scheme I buy
matters to me a lot; X10 Choosing mutual fund scheme is an important decision for
me; X11 Search 1; X12 Search 2; X13 Processing 1; X14 Processing 2.
6.5.2 Results of the test of discriminant validity of the constructs
In order to test the discriminant validity of each constructs, two
models were tested for each possible pair of estimated constructs. The first,
model was the constrained model where the correlation parameter was
constrained between each pair of construct to 1.00. The, second model was
the unconstrained model (free model) where the correlation parameter
between the two construct was not manipulated (Joreskog, 1971). The χ²
value was generated for both constrained and unconstrained models with the
respective degree of freedom. Afterward, a χ² difference test was performed

250
on the two models. A significantly lower χ² value for unconstrained model
demonstrates that discriminant validity has been achieved (Anderson and
Gerbing, 1988; Bogazzi and Phillips, 1982). Table 6.2 indicates that all the
constructs possesses discriminant validity.
Table 6.2
Results of discriminant validity test
Combination Correlation χ²
(Corr.
Fixed)
d.f χ²
(Corr.
Free)
d.f Change
in χ²
Change
in d.f
Sig.
Level
1 and 2 -0.302 261.2 14 84.4 13 176.8 1 0.001
1 and 3 0.588 61.5 9 19.7 8 41.8 1 0.001
1 and 4 0.257 127.6 20 64.7 19 62.9 1 0.001
1 and 5 -0.05 146.4 9 47.5 8 98.9 1 0.001
1 and 6 0.455 236.9 35 197.8 34 39.1 1 0.001
1 and 7 0.546 57.9 20 26.9 19 31 1 0.001
2 and 3 -0.284 265 14 78.9 13 186.1 1 0.001
2 and 4 -0.274 284.5 27 123 26 161.5 1 0.001
2 and 5 0.005 212.6 14 104.4 13 108.2 1 0.001
2 and 6 -0.385 436.2 44 243.8 43 192.4 1 0.001
2 and 7 -0.444 339.4 27 137.8 26 201.6 1 0.001
3 and 4 0.449 131.5 20 78.9 19 52.6 1 0.001
3 and 5 0.166 108.2 9 20.8 8 87.4 1 0.001
3 and 6 0.411 239.7 35 185.5 34 54.2 1 0.001
3 and 7 0.581 93.2 20 55.9 19 37.3 1 0.001
4 and 5 0.431 149.9 20 104.2 19 45.7 1 0.001
4 and 6 0.604 292.3 54 276.2 53 16.1 1 0.001
4 and 7 0.554 137.2 35 111.8 34 25.4 1 0.001
5 and 6 0.38 267.2 35 212.3 34 54.9 1 0.001
5 and 7 0.408 110.6 20 70 19 40.6 1 0.001
6 and 7 0.741 293.7 54 280.7 53 13 1 0.001

251
Note: Corr. = Correlation; 1 = Subjective Knowledge; 2 = Perceived purchase risk; 3 =
Purchase Decision Involvement; 4 = information search 1; 5 = information search 2; 6
= Information processing 1; 7 = Information processing 2
6.5.3 Results of the test of convergent validity of the constructs
In estimating convergent validity for structure equation modeling
studies, examining the standardized confirmatory factor analysis (CFA)
parameters estimated pattern coefficient is one method often used (Marsh
and Grayson, 1985). Convergent validity can be assessed from the
measurement model by determining whether each indicator‟s estimated
pattern coefficient on its posited underlying construct factor is significant
(Anderson and Gerbing, 1988). Statistically significant large factor loadings
indicate convergent validity. As shown in table 6.3 all of the estimated
pattern coefficients on their posited underlying construct factors were
significant at 0.05 significance level (i.e., each had a critical ratio (cr) >
±1.96). In fact, the smallest critical ratio was 3.84. Therefore, convergent
validity was achieved for all the variables in the study.

252
Table 6.3
Parameter estimates of the proposed five factor model (N=268)
Subj
ectiv
e
Kno
wled
ge
Perc
eive
d
pur
chas
e
risk
Purch
ase
Decisi
on
Involv
ement
Sear
ch1
Sear
ch2
Proc
essin
g 1
Proces
sing 2
X1* Estima
te
1.00
SE
c.r
X2 Estima
te
.77*
*
SE 0.06
c.r 11.7
6
X3 Estima
te
.93*
*
SE 0.07
c.r 12.2
2
X4 Estima
te
.86*
*
SE 0.09
c.r 8.81
X5 Estima
te
.75*
*
SE 0.09
c.r 8.10
X6* Estima
te
1
SE
c.r
X7 Estima
te
.88*
*

253
SE 0.09
c.r 9.52
X8 Estima
te
1.06**
SE 0.09
c.r 11.63
X9* Estima
te
1.00
SE
c.r
X10 Estima
te
.91**
SE 0.07
c.r 11.9
X11 Estima
te
.60**
SE 0.08
c.r 7.38
X12 Estima
te
.50**
SE 0.06
c.r 7.27
X13
*
Estima
te
1.00
SE
c.r
X14 Estima
te
.87**
SE 0.09
c.r 9.52
X15 Estima
te
.82**
SE 0.09
c.r 9.16
X16 Estima
te
.99*
*
SE 0.16
c.r 6.15
X17
*
Estima
te
1.00

254
SE
c.r
X18 Estima
te
.87*
*
SE 0.14
c.r 5.95
X19 Estima
te
1.03*
*
SE 0.07
c.r 13.13
X20 Estima
te
.86**
SE 0.07
c.r 12.17
X21 Estima
te
.75**
SE 0.08
c.r 9.41
X22
*
Estima
te
1.00
SE
c.r
X23 Estima
te
1.03*
*
SE 0.07
c.r 13.84
X24 Estima
te
.82**
SE 0.07
c.r 11.79
X25 Estima
te
.61**
SE 0.06
c.r 9.49
X26
*
Estima
te
1.00
SE
c.r
X27 Estima
te
1.10**

255
SE 0.10
c.r 10.26
X28 Estima
te
.90**
SE 0.10
c.r 8.64
X29 Estima
te
.84**
SE 0.09
c.r 8.84
X30 Estima
te
.38**
SE 0.10
c.r 3.84
Note:
Estimate= Unstandardized parameter estimate; SE = Standard error; cr = Critical ratio
* Variable (indicators) was constrained to 1.0 with the corresponding latent construct
X1 Compared to average men and women, I am very familiar with wide variety of MF
schemes; X2 Compared to my friends, I am very familiar with wide variety of MF
schemes; X3 Compared to people who invest a lot in MF schemes, I am very familiar
with wide variety of MF schemes; X4 How much there is a chance that the agent(s)
will mislead while purchasing mutual fund scheme?; X5 How much there is a chance
that there may be hidden charges while/after purchasing mutual fund scheme?; X6
How much there is a chance that investment in certain mutual fund scheme can have
large negative consequence on your future cash position?; X7 How much there is a
chance that investment in certain mutual fund scheme could lead to monetary loss? ;
X8 I choose mutual fund schemes very carefully; X9 Which mutual fund scheme I buy
matters to me a lot; X10 Choosing mutual fund scheme is an important decision for
me; X11To what extent you have used brokers as a source of information before the

256
purchase of this MF scheme? X12 To what extent you have used stores display as a
source of information before the purchase of this MF scheme?; X13 To what extent
you have used newspapers as a source of information before the purchase of this MF
scheme?; X14 To what extent you have used magazines as a source of information
before the purchase of this MF scheme?; X15 To what extent you have used television
as a source of information before the purchase of this MF scheme?; X16 To what
extent you have used family as a source of information before the purchase of this MF
scheme?; X17 To what extent you have used friends as a source of information before
the purchase of this MF scheme?; X18 To what extent you have used your peer group
as a source of information before the purchase of this MF scheme?; X19 To what
extent you have used scheme investment portfolio for comparing MF schemes
before/at the time of purchase of this scheme?; X20 To what extent you have used
clarity of accounting statement for comparing MF schemes before/at the time of
purchase of this scheme?; X21To what extent you have used reputation of fund
manager for comparing MF schemes before/at the time of purchase of this scheme?;
X22 To what extent you have used fund manager background for comparing MF
schemes before/at the time of purchase of this scheme?; X23 To what extent you have
used fund investment style for comparing MF schemes before/at the time of purchase
of this scheme?; X24To what extent you have used scheme pending legislation for
comparing MF schemes before/at the time of purchase of this scheme?; X25 To what
extent you have used fund advertisement expense for comparing MF schemes before/at
the time of purchase of this scheme?; X26 To what extent you have used fund
historical performance for comparing MF schemes before/at the time of purchase of
this scheme”; X27 To what extent you have used fund size for comparing MF schemes
before/at the time of purchase of this scheme?; X28 To what extent you have used
scheme entry and exit load for comparing MF schemes before/at the time of purchase

257
of this scheme?; X29 To what extent you have used favourable rating of fund scheme
for comparing MF schemes before/at the time of purchase of this scheme?; X30 To
what extent you have used scheme tax benefit for comparing MF schemes before/at the
time of purchase of this scheme?
6.5.4 Test of proposed hypotheses
Table 6.4 presents the mean, standard deviation and correlation among
the study variables. Figures in the diagonal represent the composite
reliability of the scales based on confirmatory factor analysis.

258
Table 6.4
Means, standard deviations, and intercorrelations among study variables
Variables M SD 1 2 3 4 5 6 7
1 Subjective
knowledge
8.73 2.75 0.83
2 Perceived
purchase risk
13.43 3.32 -
0.24**
0.77
3 Purchase
decision
involvement
9.91 2.76 0.50** -
0.24**
0.83
4 Search 1 10.14 4.36 0.23** -
0.21**
0.36** 0.76
5 Search 2 7.06 2.93 0.00 -0.03 0.11 0.32** 0.65
6 Processing 1 16.15 7.31 0.38** -
0.30**
0.36** 0.49** 0.21** 0.88
7 Processing 2 14.69 4.99 0.43** -
0.31**
0.49** 0.47** 0.26** .53** 0.74
Notes:
Figure in the diagonal represents composite reliability of scales
** p< .01 * p<.05

259
The test results of the proposed hypotheses using structural equation
model with maximum likelihood estimate (AMOS 16) are shown in Figure
6.3. Results support the entire proposed hypothesis. SK negatively impact
PPR (path estimate -.274, p<.01). SK positively impact PDI (path estimate
.593, p<.01). PPR negatively impact PDI (path estimate -.143, p<.05). PDI
positively impacts depth of information search (path estimate .483, p<.01).
Depth of information search positively impacts depth of information
processing (path estimate .605, p<.01). PDI positively impacts depth of
information processing (path estimate .408, p< .01).

260
Figure 6.3
AMOS results for proposed comprehensive model of investment
behaviour
* p<.05 ** p<.01
6.5.5 Model fit and test of alternative models
The fit statistics for the hypothesized model is displayed in Table
6.5. As shown in the table, hypothesized model appeared to fit the data
adequately based on the convention used to judge the fit statistics. The chi-
square statistics was nonsignificant and the ratio of chi-square to degree of
freedom was below 3 (Kline, 1998; but see MacCallum, 1998 for cautionary
note), GFI, AGFI, CFI, TLI and IFI statistics were greater than or close to
Perceived purchase
risk
Subjective
knowledge
Purchase
decision
involvement
Information search
behaviour
Information
processing
behaviour
.593**
.408**
.483**
.605**
-.143*
-.274**

261
0.90 (Hair et al., 2005). However RMSEA and SRMR value of 0.08 and 0.07
respectively suggests that the model only adequately fits the data. Based on
the overall analysis of the goodness of fit statistics, and the conventions used
we suggests that model adequately fits the data. The squared multiple
correlations for each structural equation were as follows: perceived purchase
risk, R² =.075; purchase decision involvement, R² =.418; depth of
information search, R² =.233; depth of information processing, R² =.771.
In evaluating a hypothesized model, it is important to compare its fit
to competing models (MacCallum et al., 1993). We estimated the following
alternative models; (a) knowledge mediates the influence of perceived
purchase risk and purchase decision involvement on investment behaviour
(referred to as Alternative 1), were by perceived purchase risk and purchase
decision involvement only directly affected the subjective knowledge which
subsequently influenced investment behaviour; (b) perceived purchase risk
mediates the influence of subjective knowledge and purchase decision
involvement on investment behaviour (referred to as Alternative 2), were by
subjective knowledge and purchase decision involvement only directly
affected the perceived purchase risk which subsequently influenced
investment behaviour.

262
The difference in chi-square between the hypothesized model and
each alternative model was significant. (Alternative 1: Δχ² = 23.54, p<.01;
Alternative 2: Δχ² = 129.68, p<.01), indicating that the alternative models
provided a significantly poorer fit the data than did the hypothesized model.
Moreover the difference between the AIC of the hypothesized model and the
alternative model was also substantial (Alternative 1: ΔAIC = 21.48, p<.01;
Alternative 2: ΔAIC= 127.62, p<.01). The other fit statistics for the
alternative models were also poorer than the hypothesized model.

263
Table 6.5
Fit statistics for hypothesized model
Model χ² Df χ²/df GFI AGFI CFI IFI SRM
R
RMSE
A
AIC
Hypothesized model 188.56 70 2.69 0.911 0.866 0.919 0.920 0.07 0.08 258.56
Alternative model 1 212.04 71 2.98 0.904 0.859 0.904 0.905 0.110 0.08 280.04
Alternative model 2 318.18 71 4.48 0.856 0.787 0.832 0.834 0.171 0.114 386.18
Note. χ² = Chi-square; df = degree of freedom; GFI= goodness-of-fit index; AGFI= adjusted goodness-of-fit index; CFI= comparative fit index; IFI=
Incremental fit index; SRMR= standardized root mean square residual; RMSEA= root-mean-square error of approximation; AIC= Akaike
Information Criterion

264
6.6 Discussion
The hypothesized comprehensive model on the investment behaviour
of MF investor was tested using maximum likelihood estimate (AMOS 16).
Overall, the findings of the study support the hypothesized model.
Specifically, the study finds that (a) SK negatively influence the PPR of MF
investors; (b) SK positively impact PDI of MF investors; (c) PPR negatively
impact PDI of MF investors; (d) PDI positively impact the depth of
information search by MF investors; (e) depth of information search
positively impact the depth of information processing by MF investors; (e)
PDI positively impact the depth of information processing by MF investors.
Following conclusion is drawn based on the findings of the study: First,
investors‟ having high confidence in their knowledge (high SK) related to
MF investment decisions will perceive MF as less risky and is motivated to
actively engage in MF investment decision (high level of PDI). This may be
due to one of the following reasons: (i) MF investors‟ level of objective
knowledge is also high due to exposure to domain knowledge (Alba and
Hutchinson, 2000) or prior experience (Schmidt and Spreng, 1996) of
purchase of MFs, which makes them feel that they have control on the
purchase risk associated with MF; (ii) MF investors‟ are over confident of

265
their information search and processing ability and their ability to control the
risk associated with MF purchase (Tapia and Yermo, 2007). Second,
investors having low confidence in their knowledge (low SK) related to MF
investment decision will perceive MF as more risky and is motivated to
remain passive during MF investment decision (low PDI). The manifestation
of this behaviour will be in form of low depth of information search and
information processing by these categories of investors.This behaviour will
be in the form of low depth of information search and information processing
by these categories of investors. Hence they will use few specific
information sources on which they rely upon (Cho and Lee, 2006; Coleman
et al., 1995; Gemunden, 1985). Further, rather than engaging in extensive
processing of attribute information related to MFs, they will rely on few
attributes which they will use as cues (decision heuristics) as an indicator of
the quality of MFs (Dawar and Parker, 1994; Tapia and Yermo, 2007).
The study makes the following contributions. First, it is one of the
few studies which have proposed an investment behaviour model to
understand the buying behaviour of MF investors and empirically validated it
on the sample of MF investors. Second, few studies have examined the
impact of knowledge, perceived purchase risk and involvement
simultaneously on the buying decision process (Chang and Huang, 2002).
Even though Chang and Huang (2002) studied the joint effect of product

266
involvement and prior knowledge on decision making path, they did not
study how prior knowledge and involvement interact to influence purchase
behaviour? Hence this study is likely to improve consumer behaviour theory
by deepening our understanding of how investors make buying decisions for
the intangible financial goods. Third, the MF regulators across the globe
want to encourage the participation of individual investors with MF product.
However, there is a dearth of empirical research on actual individual
investors and their behaviour to support the policy decisions (Wilcox, 2003).
Most of the well known empirical studies in the field of mutual fund
investment behaviour are based on secondary data which does not capture
the important behavioral stimulus like level of purchase decision
involvement, subjective knowledge, perceived purchase risk etc., which can
be captured by the primary study conducted on the actual investors. Hence,
this study will provide an insight to the regulators and policy makers
regarding the investment behaviour of individual investor.
6.7 Implications
As MF companies spend heavily on marketing of MFs, an
understanding about the investment behaviour of investors is very crucial for
them. Particularly, an understanding of the forces that activate and direct the
behaviour of MF investor is of high importance to MF marketers. This study

267
suggests that investors PDI mediate the influence of investors‟ subjective
knowledge and perceived purchase risk on their investment behaviour.
Further, the study suggests that investors‟ subjective knowledge (which
represents investor‟s confidence on her ability to make MF investment
decision) negatively influence the extent of risk investor attach to the MF
purchase. (i.e. perceived purchase risk) and positively influence the
motivation to engage in purchase decision (i.e. purchase decision
involvement). Hence MF marketers should carve different marketing strategy
for passive investors of MF schemes (investors with low SK, high PPR and
low PDI) and active investors of MF schemes (investors with high SK, low
PPR and high PDI).
Passive investors have following characteristics; (i) engage less in
information search and rely on few specific source for investment advice; (ii)
consider distribution channel as reliable source of information; (iii) engage in
less extensive processing of MF attribute information; (iv) likely to use
mental shortcuts (i.e. rule of thumb) to evaluate and select MF schemes for
example historical performance of funds (Benartzi and Thaler, 2001;
Huberman and Jiang, 2006); and (v) likely to show a preference towards
default funds/index funds. Hence, the above characteristic of these investors
may be effectively used to design and promote the MF schemes. Specifically,
MF companies should promote index fund among these categories of

268
investors. MF companies can also design innovative „default funds‟, like
teachers specific fund directed towards academicians, doctor specific fund
directed towards doctors etc. to tap these categories of investors. Further, MF
companies should effectively use their distribution channel to promote their
funds among these categories of investors. Finally, advertisement can be
more effectively targeted towards these investors rather than active investors
where the role of advertisement is somewhat limited.
Active investors have following characteristics; (i) engage
extensively for information search and rely on multiple sources of
information; and (ii) engage in extensive information processing and use
multiple attribute information to compare MF schemes. As these categories
of MF investor use large number of attributes information, they are likely to
restrict their attention to fewer number of brands during the choice of a MF
(i.e. will use brand by brand comparison) (Powell and Ansic, 1997). Hence
those MF schemes/companies which are part of the consideration set will
have more probability for being selected in comparison to those which are
not. Hence, while targeting these categories of MF investors MFCs faces a
challenge to be among the top four or five names so that they become the
part of the consideration set of these categories of MF investors. Active
investors, if engaged in the promotion of MF schemes, will effectively help
MFCs in promoting their funds.

269
The findings of the study have also implications for the MF industry
regulators. First, in order to improve the quality of decision of active MF
investors (investors with high SK), regulators and policy makers requires
having a check on the information overload. There is large empirical
evidence suggesting the notion that large number of investment options can
cause information overload (Tapia and Yermo, 2007). Hence, MF companies
should be discouraged to introduce “new fund offer” which is similar to the
existing schemes of the MF Company. Second, investors with low SK
perceive high risk in MF purchase and will remain passive during investment
decision making process (low PDI). It has been found in the earlier chapter
in this thesis that those investors who feel less confident to engage actively
in information search and processing are the one who rely more on the
distribution channels for investment advice (chapter 3, pg. 105). However,
there is adequate empirical evidence to doubt the quality of financial advice
provided by these professional due to conflict in the objective of investors
and advisor (Mahoney, 2004), lack of knowledge of advisor (Minimum
common standard for financial advisors and financial education: A
consultation paper79
), and disparity in the definition of “low risk” between
investor and advisor (Conquest Research Limited, 2004). Hence policy
makers and regulators of MF industry have to work on manifold objectives.
79
Minimum Common Standard for Financial Advisors and Financial Education : A
Consultation Paper retrieved from
http://pfrda.org.in/writereaddata/linkimages/Consultation%20Paper9207652836.pdf

270
First, strengthen the existing policy of certification and training of
distribution channels/ financial advisors to ensure that these professionals are
adequately equipped and motivated to guide investors in selecting
appropriate MF schemes. Second, encourage investors to actively engage in
investment decision by advancing their knowledge on various facets of
financial planning. Third, reduce ambiguity surrounding MF products
through effective mass communication media so that investors are rightly
able to appreciate the risk associated with MF products. Fourth, bring
measures to enhance the transparency in the working of MF industry and put
a check on mis-selling. Fifth, put mechanism in place so that financial
education program can be introduced at the school level as investment
decision substantially influence the financial well being of individuals.
6.8 Limitations and future direction of research
The findings of the study are constrained by the following
limitations. First, the study focuses on the prepurchase information search
behaviour and information processing behaviour of MF investors and the
post purchase behaviour is not discussed. Second, depth of information
processing behaviour has been discussed with reference to the extent to

271
which each type of attributes information are used by MF investors before/at
the time of purchase of MF schemes. However, more insights can be
achieved with an understanding of the sequence in which attributes
information are used, the number of stages in which the decision is taken and
the number of MF schemes considered at various stages of information
processing. Third, post purchase perceived risk of MF investors have been
measured in this study. It may be possible that there is a difference in
prepurchase perceived risk and post purchase perceived risk due to the effect
of actual purchase on perceived risk of the respondents. A natural expansion
of this study is to empirically validate this model on the sample of investors
whose prepurchase risk as well as post purchase risk is captured. This will
also capture investors post purchase regret which is not included in this
study. Fourth, the literature suggests that apart from subjective knowledge,
perceived purchase risk is also likely to be influenced by demographic
variables like age, income, wealth, gender, marital status, personality and
educational attainment (Finke and Huston, 2003; Rajarajan, 2000, 2003).
However, the study did not controlled for the effect of other variables on
perceived purchase risk due to limitation related to the sample size and
nature of respondents. This was also reflected in the squared multiple
correlations of the structural equation for perceived purchase risk (i.e. R²
=.075). The above limitation provides the future scope of research in this
field. Fifth, the sample selected for the study is through convenience

272
sampling due to non avaibility of data on MF investors. Due consideration
was given to check the validity and internal consistency of the data however
care has to be taken while generalizing upon the results. Further, use of
random sampling method to select respondents would have further improved
the statistical validity of the findings. Sixth, the study is conducted using the
respondents from the Jammu region, J&K (India). To further validate the
results similar study needs to be conducted on the residents of other region,
states and countries. Seventh, the study is confined to individual investors of
MF schemes and institutional investors are excluded from the study.
Therefore, including other categories of investors‟ might lead to different
behavioural outcome.
6.9 Conclusion
The MF industry has experienced phenomenal growth over the past
decade. In spite of that there has been limited research into the way MF
schemes are purchased by investors. This study proposes a comprehensive
model of investment behaviour of MF investors to explain their information
search and processing behaviour. The role of marketers and regulators has
also been outlined in the process.