chapter 5 supply
TRANSCRIPT

132 UNIT 2 THE MARKET ECONOMY
CONSIDER ...
5 Why would a fi rm decide to store its products in a warehouse rather than off er them for sale?
5 When might hiring another worker actually reduce a fi rm’s output?
5 Can a fi rm shut down without going out of business?
5 Why do movie theaters have so many screens?
5 Why is bigger not always better when it comes to the size of a fi rm?
CHAPTER 5
Supply
5.1 The Supply Curve
5.2 Shifts of the Supply Curve
5.3 Production and Cost
Point your browser
www.cengage.com/school/contecon
moo
dboa
rd/J
upite
r Im
ages
; bac
kgro
und
imag
e: L
ukiy
anov
a N
atal
ia/f
rent
a/Sh
utte
rsto
ck.c
om
80186_ch05_ptg01_hr_132-166.indd 13280186_ch05_ptg01_hr_132-166.indd 132 2/11/12 7:22 AM2/11/12 7:22 AM
Chapter 5 S u p p l y 133
5.1 T H E S U P P LY C U R V E
Learning Objectives
L 1 Explain the law of supply.
L 2 Describe the elasticity of supply, and explain how it is measured.
In Your WorldJust as consumer behavior shapes the demand curve, producer behavior shapes the supply curve. When studying demand, you should think like a consumer, or a demander. When studying supply, however, you must think like a producer, or a supplier. You may feel more natural as a consumer—after all, you are one. But you know more about producers than you may realize. Either online or in person, you have been around them all your life—Walmart, Subway, Best Buy, Exxon, McDonald’s, Microsoft, Apple, KFC, Pizza Hut, Ford, Home Depot, Target, Gap, Google, Facebook, local businesses, and thousands more. You will draw on your knowledge to develop an understanding of supply and the supply curve.
Key Termssupply 134
law of supply 134
supply curve 134
elasticity of supply 138
LAW OF SUPPLYWith demand, the assumption is that consumers try to maximize utility, the incentive that motivates their behavior. With supply, the assumption is that producers try to maximize profi t. Profi t is the incentive that motivates the behavior of suppliers.
Role of Profi tA fi rm tries to earn a profi t by transforming resources into products. Profi t
equals total revenue minus total cost. Recall that total revenue equals the price times the quantity sold at that price. Total cost includes the cost of all resources used by a fi rm in producing goods or services, including the entrepreneur’s opportunity cost.
Profi t = Total revenue − Total cost
When total revenue just covers total cost, a fi rm breaks even. Over time, total revenue must cover total cost for the fi rm to survive. If total revenue falls short of total cost year after year, the fi rm will fail.
Each year, millions of new fi rms enter the U.S. marketplace and nearly as many leave. Most of the more than 30 million profi t-seeking fi rms in the United States consist of just an owner-operator, such as a plumber or an accountant, with no hired employees. And, as you can see from the Figure 5.1 on page 134, among fi rms that have employees, more fi rms may close their doors than enter the market in a given year. Firms must decide what goods and services to produce and what
L 1Explain
the law
of supply.
80186_ch05_ptg01_hr_132-166.indd 13380186_ch05_ptg01_hr_132-166.indd 133 2/11/12 7:22 AM2/11/12 7:22 AM

UNIT 2 THE MARKET ECONOMY
resources to employ. Firms must make plans while facing uncertainty about consumer demand, resource availability, and the intentions of other fi rms in the market. Despite the uncertainties, the profi t incentive is strong enough to moti-vate entrepreneurs to pursue their dreams.
SupplyJust as demand is a relation between price and quantity demanded, supply is a
relation between price and quantity supplied. Supply indicates how much of a good producers are willing and able to off er for sale per period at each price, other things constant. Th e law of supply says that the quantity supplied is usually directly, or positively, related to its price, other things constant. Th us, the lower the price, the smaller the quantity supplied. Th e higher the price, the greater the quantity supplied.
Figure 5.2 presents the market supply schedule and market supply curve S for pizza. A supply curve shows the quantities of a particular good supplied at various prices during a given time period, other things constant. Both show the quantities of 12-inch pizzas supplied per week at various prices by the many pizza makers in the market. As you can see, price and quantity supplied are directly related, other things constant. Th e supply curve shows, for example, that at a price of $6 per pizza, the quantity supplied is 16 million per week. At a price of $9, the quantity supplied increases to 20 million.
supply A relation showingthe quantities of a goodproducers are willing and ableto sell at various prices during a given period, other thingsconstant
law of supply The quan-tity of a good supplied during a given time period is usually directly related to its price, other things constant
supply curve A curve, or line, showing the quantitiesof a particular good suppliedat various prices during agiven time period, otherthings constant
FIGURE 5.1 Starts and Closures of Employer Firms, 2005–2009* In the U.S. economy, the supply of goods and services is constantly changing. This is refl ected
by the number of fi rms which start, close, or go bankrupt in a year.
Source: U.S. Dept. of Commerce, Census Bureau, Administrative Offi ce of the U.S. Courts, U.S. Dept. of Labour, Business Employment Dynamics (BED).*Estimates based on Census data and BED trends
134
80186_ch05_ptg01_hr_132-166.indd 13480186_ch05_ptg01_hr_132-166.indd 134 2/11/12 7:22 AM2/11/12 7:22 AM

Chapter 5 S u p p l y 135
Like the demand curve, the supply curve refl ects a particular period of time. It shows quantity supplied per period. For any supply curve, it is assumed that the prices of other goods the business could produce using these same resources remain unchanged. Th us, along the supply curve for pizza, the price of pizza changes relative to other prices, which do not change. Th e supply curve shows the eff ect of a change in the relative price of pizza—that is, relative to the prices of other goods the resources could supply. Producers have a profi t incentive to sup-ply more pizza at a higher price than at a lower price, so the supply curve slopes upward, from left to right.
More Willing to SupplyProducers off er more for sale when the price rises for two reasons. First, as
the price increases, other things constant, a producer becomes more willing to supply the good. Prices act as signals to existing and potential suppliers about the rewards for producing various goods. An increase in the price of pizza, with other prices remaining constant, creates a profi t incentive to shift some resources out of producing other goods, whose prices are now relatively lower, and into pizza, whose price is now relatively higher. A higher pizza price makes supplying pizza more profi table and attracts resources from lower-valued uses.
More Able to SupplyHigher prices also increase the producer’s ability to supply the good. Th e cost
of producing an additional unit of a good usually rises as output increases—that is, the marginal cost of production increases as output increases. (You will learn more about marginal cost in Lesson 5.3.) Because suppliers face a higher marginal
(A) SUPPLY SCHEDULE
Quantity supplied per week(millions)
Priceperpizza
$1512
96
3
28242016
12
(B) SUPPLY CURVE
12 16 20 24 280
3
6
9
12
$15
Millions of pizzas per week
Pric
e pe
r piz
za
S
FIGURE 5.2 Supply Schedule and Supply Curve for PizzaMarket supply curve S shows the quantity of pizza supplied, at various prices, by all pizza makers.
80186_ch05_ptg01_hr_132-166.indd 13580186_ch05_ptg01_hr_132-166.indd 135 2/11/12 7:22 AM2/11/12 7:22 AM

UNIT 2 THE MARKET ECONOMY136
cost of producing the good, they need to get a higher price to be able to increase the quantity supplied. A higher price makes producers more able to increase quantity supplied.
For example, a higher price for gasoline in recent decades increased producers’ ability to search for oil in less-accessible areas, such as the remote jungles of the Amazon, the oil-sands of the Canadian West, the stormy waters of the North Sea, and the frozen tundra above the Arctic Circle. Th us, the quantity of oil supplied increased as the price increased. On the other hand, gold prices fell by more than half between 1980 and 2000, so producers were no longer able to mine gold in less-accessible regions or where the ore contained less gold. As the price declined, the quantity supplied decreased. A rebound in gold prices since 2000, however, has revived gold production around the world, increasing the quantity supplied.
In short, a higher price makes producers more willing and more able to increase quantity supplied. Suppliers are more willing because production of the higher-priced good now is more profi table than the other uses of the resources. Suppliers are more able because the higher price allows them to cover the higher marginal cost that typically results from increasing production.
Supply Versus Quantity SuppliedAs with demand, economists distinguish between supply and quantity sup-
plied. Supply is the entire relation between the price and quantity supplied, as shown by the supply schedule or supply curve. Quantity supplied refers to the amount off ered for sale at a specifi c price, as shown by a point on a given sup-ply curve. Th us, it is the quantity supplied that increases with a higher price, not supply. Th e term supply by itself refers to the entire supply schedule or supply curve.
How does a producer respond when the price of its product increases?
Vasi
lySm
irnov
/iSto
ckph
oto.
com
ESSENTIAL QUESTIONStandard CEE 4: Incentives People usually respond predictably to positive and negative incentives.
80186_ch05_ptg01_hr_132-166.indd 13680186_ch05_ptg01_hr_132-166.indd 136 2/11/12 7:23 AM2/11/12 7:23 AM

Chapter 5 S u p p l y 137
Individual Supply and Market SupplyEconomists also distinguish between individual supply (the supply from an
individual producer) and market supply (the supply from all producers in the market for that good). Th e market supply curve shows the total quantities supplied by all producers at various prices.
In most markets, there are many suppliers, sometimes thousands. Assume for simplicity, however, that there are just two suppliers in the market for pizza: Pizza Palace and Pizza Castle. Figure 5.3 shows how the supply curves of two producers in the pizza market are added together to yield the market supply curve for pizza. Individual supply curves are summed across to get a market supply curve.
For example, at a price of $9, Pizza Palace supplies 400 pizzas per week and Pizza Castle supplies 300. Th us, the quantity supplied in the market for pizza at a price of $9 is 700. At a price of $12, Pizza Palace supplies 500 and Pizza Castle supplies 400, for a market quantity of 900 pizzas per week. Th e market supply curve in panel (C) of Figure 5.3 shows the horizontal sums of the individual sup-ply curves in panels (A) and (B).
Th e market supply curve is simply the horizontal sum of the individual supply curves for all producers in the market. Unless otherwise noted, when this book talks about supply, you can take that to mean market supply.
FIGURE 5.3 Summing Individual Supply Curves to Find the Market Supply Curve
The market supply curve is the horizontal sum of all individual supply curves.
(A) PIZZA PALACE (B) PIZZA CASTLE (C) MARKET SUPPLY
sc sp + sc = S
400 500 0
Pizzas per week Pizzas per week Pizzas per week
Pric
e
400 300 700 900
9
$12
9
$12
9
$12
sp
Explain the law of supply in your own words.
80186_ch05_ptg01_hr_132-166.indd 13780186_ch05_ptg01_hr_132-166.indd 137 2/11/12 7:23 AM2/11/12 7:23 AM

UNIT 2 THE MARKET ECONOMY
ELASTICITY OF SUPPLYPrices are signals to both sides of the market about the rela-tive scarcity of products. High prices discourage consumption but encourage production. Low prices encourage consumption but discourage production. Elasticity of demand measures how responsive consumers are to a price change. Likewise, elasticity of supply measures how responsive producers are to a price change.
MeasurementElasticity of supply is calculated similarly to elasticity of demand. Elasticity
of supply equals the percent change in quantity supplied divided by the percent change in price.
Elasticity of supply = Percent change in quantity supplied
Percent change in price
Suppose the price increases. Because a higher price makes production more attractive, the quantity supplied increases as the price increases.
Figure 5.4 depicts the typical upward-sloping supply curve presented earlier. As you can see, if the market price of pizza increases from $9 to $12, the quantity supplied increases from 20 million to 24 million. What is the elasticity of supply between these two points? Th e percent change in quantity supplied is the change in quantity supplied—4 million—divided by 20 million. So quantity supplied increases by 20 percent. Th e percent change in price is the change in price—$3—divided by $9, which is 33 percent.
L 2Describe the
elasticity of
supply.
elasticity of supply A measure of the responsivenessof quantity supplied to a price change; the percent change in quantity supplied divided by the percent change in price
20 24 28 0
9
12
Millions of pizzas per week
Pric
e pe
r piz
za
$15
6
3
12 16
S
FIGURE 5.4 The Supply of Pizza If the market price increases from $9 to $12, the quantity of pizza
supplied increases from 20 million to 24 million per week.
138
80186_ch05_ptg01_hr_132-166.indd 13880186_ch05_ptg01_hr_132-166.indd 138 2/11/12 7:23 AM2/11/12 7:23 AM
Chapter 5 S u p p l y 139
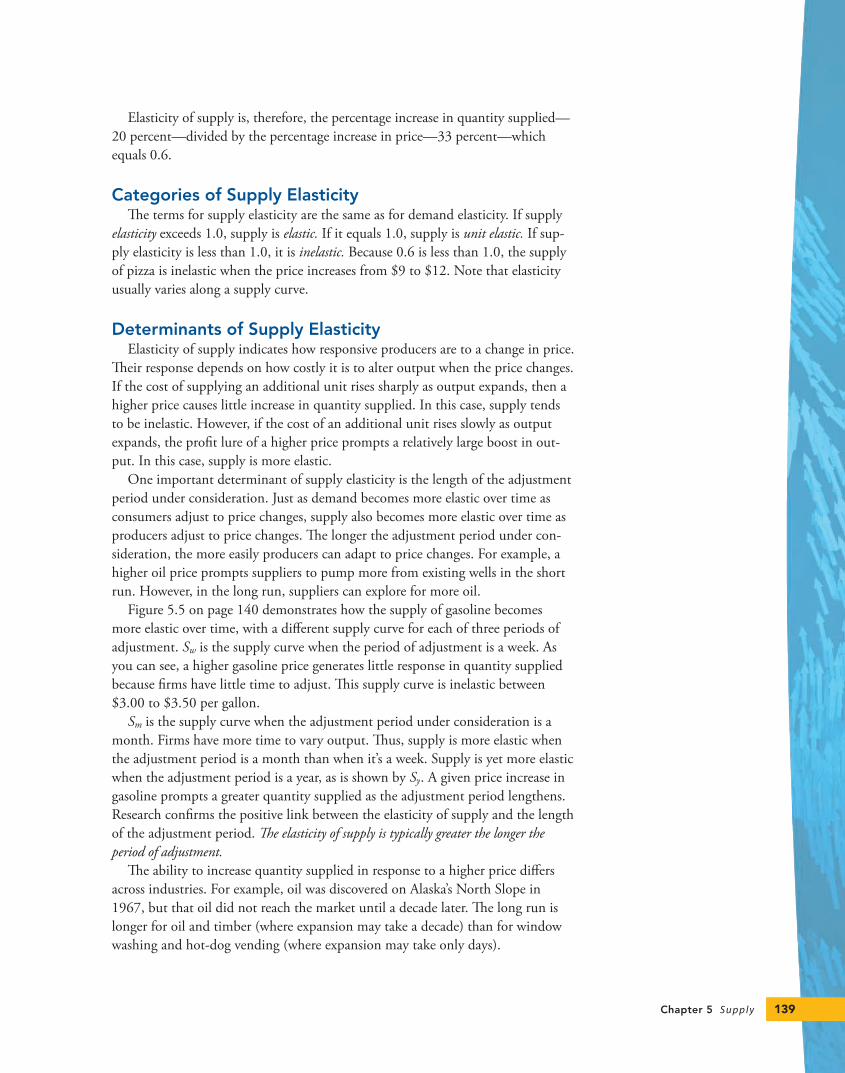
Elasticity of supply is, therefore, the percentage increase in quantity supplied—20 percent—divided by the percentage increase in price—33 percent—which equals 0.6.
Categories of Supply ElasticityTh e terms for supply elasticity are the same as for demand elasticity. If supply
elasticity exceeds 1.0, supply is elastic. If it equals 1.0, supply is unit elastic. If sup-ply elasticity is less than 1.0, it is inelastic. Because 0.6 is less than 1.0, the supply of pizza is inelastic when the price increases from $9 to $12. Note that elasticity usually varies along a supply curve.
Determinants of Supply ElasticityElasticity of supply indicates how responsive producers are to a change in price.
Th eir response depends on how costly it is to alter output when the price changes. If the cost of supplying an additional unit rises sharply as output expands, then a higher price causes little increase in quantity supplied. In this case, supply tends to be inelastic. However, if the cost of an additional unit rises slowly as output expands, the profi t lure of a higher price prompts a relatively large boost in out-put. In this case, supply is more elastic.
One important determinant of supply elasticity is the length of the adjustment period under consideration. Just as demand becomes more elastic over time as consumers adjust to price changes, supply also becomes more elastic over time as producers adjust to price changes. Th e longer the adjustment period under con-sideration, the more easily producers can adapt to price changes. For example, a higher oil price prompts suppliers to pump more from existing wells in the short run. However, in the long run, suppliers can explore for more oil.
Figure 5.5 on page 140 demonstrates how the supply of gasoline becomes more elastic over time, with a diff erent supply curve for each of three periods of adjustment. Sw is the supply curve when the period of adjustment is a week. As you can see, a higher gasoline price generates little response in quantity supplied because fi rms have little time to adjust. Th is supply curve is inelastic between $3.00 to $3.50 per gallon.
Sm is the supply curve when the adjustment period under consideration is a month. Firms have more time to vary output. Th us, supply is more elastic when the adjustment period is a month than when it’s a week. Supply is yet more elastic when the adjustment period is a year, as is shown by Sy. A given price increase in gasoline prompts a greater quantity supplied as the adjustment period lengthens. Research confi rms the positive link between the elasticity of supply and the length of the adjustment period. Th e elasticity of supply is typically greater the longer the period of adjustment.
Th e ability to increase quantity supplied in response to a higher price diff ers across industries. For example, oil was discovered on Alaska’s North Slope in 1967, but that oil did not reach the market until a decade later. Th e long run is longer for oil and timber (where expansion may take a decade) than for window washing and hot-dog vending (where expansion may take only days).
80186_ch05_ptg01_hr_132-166.indd 13980186_ch05_ptg01_hr_132-166.indd 139 2/11/12 7:23 AM2/11/12 7:23 AM

UNIT 2 THE MARKET ECONOMY140
What does the elasticity of supply measure, and what factors
infl uence its numerical value?
FIGURE 5.5 Market Supply Becomes More Elastic Over Time The supply curve one week after a price increase, S
w , is less elastic, at a given
price, than the curve one month later, Sm
, which is less elastic than the curve one year later, S
y. In response to a price increase from $3.00 to $3.50, quantity
supplied per day increases to 110 million gallons after one week, to 140 million gallons after one month, and to 200 million gallons after one year.
Why do you think the “long run” is longer for a business that produces windows than it is for a business that washes windows?
Pass
ant/
iSto
ckph
oto.
com
Bor
k/S
hutt
erst
ock.
com
S w Sm
Sy
140 200 0
3.00
Millions of gallons per day
Pric
e pe
r gal
lon $3.50
100 110
80186_ch05_ptg01_hr_132-166.indd 14080186_ch05_ptg01_hr_132-166.indd 140 2/11/12 7:23 AM2/11/12 7:23 AM

Chapter 5 S u p p l y
Key Termsmovement along a supply
curve 147
shift of a supply curve 147
Learning Objectives
L 1 Identify the determinants of supply, and explain how a change in each affects the supply curve.
L 2 Contrast a movement along the supply curve with a shift of the supply curve.
In Your WorldSupply curves indicate the price and variety of goods available to you—from the latest social network sites to the smartest phones. Assumed constant along a supply curve are the determinants of supply other than the good’s price. As you will see, there are fi ve such determinants of supply. A change in any of these could cause a supply curve to shift. Th is contrasts with a change in price, other things constant, which causes a movement along a supply curve.
S H I F T S O F T H E S U P P LY C U R V E
5.2
DETERMINANTS OF SUPPLYEach fi rm’s supply curve is based on the cost of production and profi t opportunities in the market. Anything that aff ects production costs and profi t opportunities helps shape the supply curve. Following are the fi ve determinants of market supply other than the price of the good:
1. Th e cost of resources used to make the good
2. Th e price of other goods these resources could make
3. Th e technology used to make the good
4. Producer expectations
5. Th e number of sellers in the market
Change in the Cost of ResourcesAny change in the cost of resources used to make a good will aff ect the supply
of the good. For example, suppose the cost of mozzarella cheese falls. Th is reduces the cost of making pizza. Producers are therefore willing and able to supply more pizza at each price. Th is is refl ected by a rightward shift of the supply curve from S to S´ in Figure 5.6. After the shift, the quantity supplied is greater at each price. For example, at a price of $12, the quantity supplied increases from 24 million to
L 1Identify the
determinants
of supply, and
explain how
a change in
each affects
the supply
curve.
143
80186_ch05_ptg01_hr_132-166.indd 14380186_ch05_ptg01_hr_132-166.indd 143 2/11/12 7:23 AM2/11/12 7:23 AM
UNIT 2 THE MARKET ECONOMY144
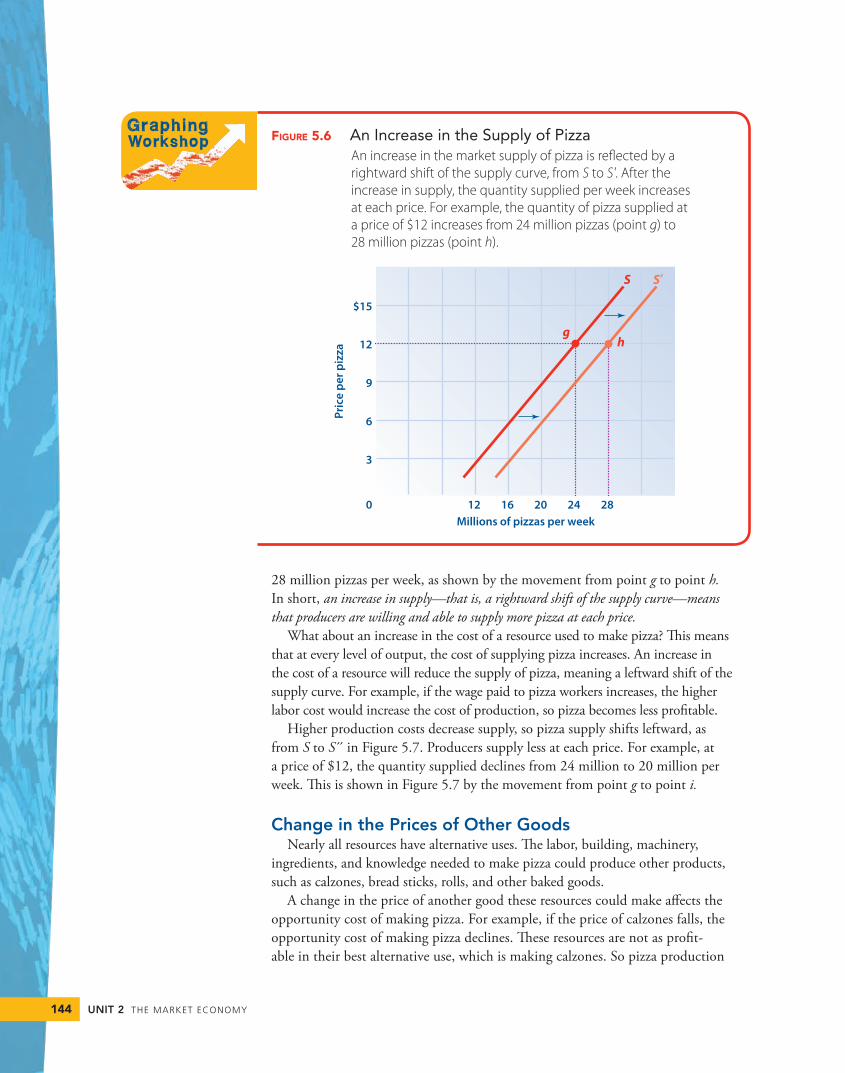
28 million pizzas per week, as shown by the movement from point g to point h. In short, an increase in supply—that is, a rightward shift of the supply curve—means that producers are willing and able to supply more pizza at each price.
What about an increase in the cost of a resource used to make pizza? Th is means that at every level of output, the cost of supplying pizza increases. An increase in the cost of a resource will reduce the supply of pizza, meaning a leftward shift of the supply curve. For example, if the wage paid to pizza workers increases, the higher labor cost would increase the cost of production, so pizza becomes less profi table.
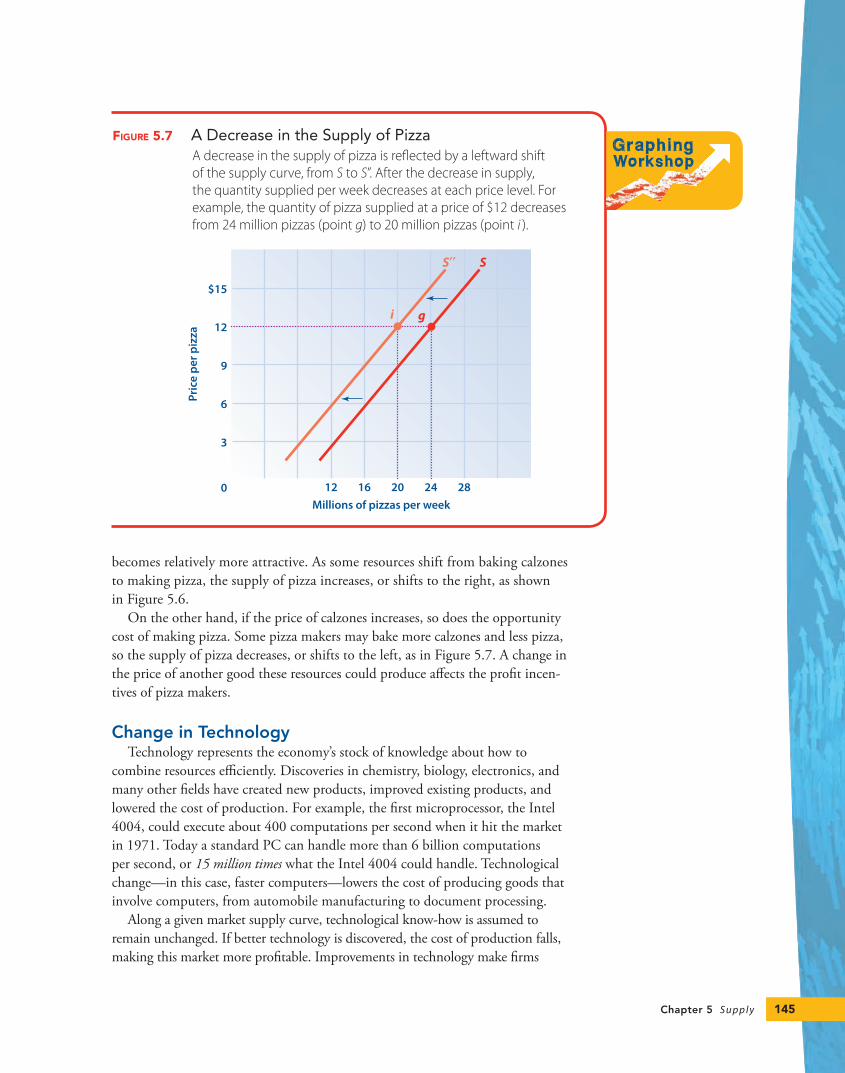
Higher production costs decrease supply, so pizza supply shifts leftward, as from S to S´́ in Figure 5.7. Producers supply less at each price. For example, at a price of $12, the quantity supplied declines from 24 million to 20 million per week. Th is is shown in Figure 5.7 by the movement from point g to point i.
Change in the Prices of Other GoodsNearly all resources have alternative uses. Th e labor, building, machinery,
ingredients, and knowledge needed to make pizza could produce other products, such as calzones, bread sticks, rolls, and other baked goods.
A change in the price of another good these resources could make aff ects the opportunity cost of making pizza. For example, if the price of calzones falls, the opportunity cost of making pizza declines. Th ese resources are not as profi t-able in their best alternative use, which is making calzones. So pizza production
FIGURE 5.6 An Increase in the Supply of Pizza An increase in the market supply of pizza is refl ected by a
rightward shift of the supply curve, from S to S'. After the increase in supply, the quantity supplied per week increases at each price. For example, the quantity of pizza supplied at a price of $12 increases from 24 million pizzas (point g) to 28 million pizzas (point h).
S′S
12 16 20 24 28 0
3
6
9
12
$15
Millions of pizzas per week
Pric
e pe
r piz
zag
h
80186_ch05_ptg01_hr_132-166.indd 14480186_ch05_ptg01_hr_132-166.indd 144 2/11/12 7:23 AM2/11/12 7:23 AM
Chapter 5 S u p p l y 145
becomes relatively more attractive. As some resources shift from baking calzones to making pizza, the supply of pizza increases, or shifts to the right, as shown in Figure 5.6.
On the other hand, if the price of calzones increases, so does the opportunity cost of making pizza. Some pizza makers may bake more calzones and less pizza, so the supply of pizza decreases, or shifts to the left, as in Figure 5.7. A change in the price of another good these resources could produce aff ects the profi t incen-tives of pizza makers.
Change in TechnologyTechnology represents the economy’s stock of knowledge about how to
combine resources effi ciently. Discoveries in chemistry, biology, electronics, and many other fi elds have created new products, improved existing products, and lowered the cost of production. For example, the fi rst microprocessor, the Intel 4004, could execute about 400 computations per second when it hit the market in 1971. Today a standard PC can handle more than 6 billion computations per second, or 15 million times what the Intel 4004 could handle. Technological change—in this case, faster computers—lowers the cost of producing goods that involve computers, from automobile manufacturing to document processing.
Along a given market supply curve, technological know-how is assumed to remain unchanged. If better technology is discovered, the cost of production falls, making this market more profi table. Improvements in technology make fi rms
FIGURE 5.7 A Decrease in the Supply of Pizza A decrease in the supply of pizza is refl ected by a leftward shift
of the supply curve, from S to S”. After the decrease in supply, the quantity supplied per week decreases at each price level. For example, the quantity of pizza supplied at a price of $12 decreases from 24 million pizzas (point g) to 20 million pizzas (point i ).
S′′ S
i
12 16 20 24 280
3
6
9
12
$15
Millions of pizzas per week
Pric
e pe
r piz
za
g
80186_ch05_ptg01_hr_132-166.indd 14580186_ch05_ptg01_hr_132-166.indd 145 2/11/12 7:23 AM2/11/12 7:23 AM

UNIT 2 THE MARKET ECONOMY
willing and able to supply more of the good at each price. Con-sequently, supply increases, as refl ected by a rightward shift of the supply curve. For example, suppose a new high-tech oven that costs the same as exist-ing ovens bakes pizza in half the time. Such a breakthrough would shift pizza supply rightward, as from S to S´ in Figure 5.6, so more is supplied at each price.
Change in Producer ExpectationsProducers transform resources into goods they hope to sell for a profi t. Any
change that aff ects producer expectations about profi tability can aff ect market supply. For example, if pizza makers expect the price to increase in the future, some may expand their production capacity now. Th is would shift the supply of pizza rightward, as shown in Figure 5.6.
Some goods can be stored easily. For example, crude oil can be left in the ground and grain can be stored in a silo. Expecting higher prices in the future might prompt some producers to reduce their current supply while awaiting the higher price. Th is would shift the current supply curve to the left, as shown in Figure 5.7. Th us, an expectation of higher prices in the future could either increase or decrease current supply, depending on the good.
Change in the Number of SuppliersAny change in the market environment also can aff ect the number of suppli-
ers in that market. For example, government regulations may infl uence market supply. As a case in point, for decades government strictly regulated the prices and entry of new fi rms in a variety of industries including airlines, trucking, and telecommunications. During that era, the number of fi rms in each market was artifi cially limited by these government restrictions. When these restrictions were eased, more fi rms entered these markets, increasing supply. More generally, any government action that aff ects a market’s profi tability, such as a change in busi-ness taxes, could shift the supply curve. Lower taxes on a particular industry will attract more fi rms to that market, thereby increasing supply. Higher taxes will have the opposite eff ect.
What are the fi ve determinants of supply, and how does a change in
each affect the supply of a product?
Changes and advances in computer technology have lowered the production costs of many goods and services in recent years. Since the year 2000, many major developments have occurred. Access a time-line that covers developments in computer technology from 2000 to 2011 by clicking on the URL below. After scanning the list, click on one of the links for a development you think infl uenced the production of goods and services in some way. Write a paragraph describing the development and its infl uence.
www.cengage.com/school/contecon
Businesses generally pay taxes to the local, state, and federal governments. Contact your local govern-ment’s bureau of taxation. Find out what taxes are paid by local businesses. Also fi nd out if business taxes have changed in the past fi ve years. Has an increase or decrease in tax rates aff ected supply in your area? Write a paragraph to explain your fi ndings.
146
80186_ch05_ptg01_hr_132-166.indd 14680186_ch05_ptg01_hr_132-166.indd 146 2/11/12 7:23 AM2/11/12 7:23 AM

Chapter 5 S u p p l y
A MOVEMENT ALONG A SUPPLY CURVE VERSUS A SHIFT OF A SUPPLY CURVE
Note again the distinction between a movement along a supply curve and a shift of a supply curve. A change in price, other things constant, causes a movement along a supply curve from one price-quantity combination to another. A change in one of the determinants of supply other than the price causes a shift of a supply curve, changing supply. A shift of the supply curve means a change in the quantity supplied at each price.
A change in price, other things constant, changes quantity supplied along a given supply curve. A change in a determinant of supply other than the price of the good—such as the cost of resources used to make the good, the price of other goods these resources could produce, technology used to make the good, producer expectations, or the number of fi rms in the market—shifts the entire supply curve to the right or left.
L 2Contrast a
movement
along the
supply curve
with a shift
of the supply
curve.
movement along a supply curve Change inquantity supplied resulting froma change in the price of the good,other things constant
shift of a supply curve Increase or decrease in supply resulting from a change in one of the determinants of supply otherthan the price of the good
Oil for One and One for OilThe Organization of the Petroleum Exporting Countries (OPEC) is a 12-nation, international group that works to control the output and price of oil. OPEC pumps about one-third of the world’s crude oil. Its production policies can have a major eff ect on the price consumers pay for fuel to drive their cars and heat their homes.
Representatives of 12 countries meet periodically and agree to increase, decrease, or hold constant the number of barrels of crude oil they supply to achieve the price level they desire. If the market price drops, OPEC can cut pro-duction to increase the price to the desired level. If the market price rises, OPEC can increase production to lower the price to the desired level. OPEC has no control over the world demand for oil or what other oil producers supply. When OPEC reaches its productive capacity, it can still reduce output to increase the price, but it can’t increase output much if it wants to lower the price.
Think Critically As OPEC nears its productive capacity, why can it more easily raise the world price of oil than lower the world price?
Sources: Berkman, Ouliaris, & Samiei, “The Structure of the Oil Market and Causes of High Prices,” International Monetary Fund, September 21, 2005.
Explain the difference between a movement along a supply curve
and a shift of a supply curve.
147
80186_ch05_ptg01_hr_132-166.indd 14780186_ch05_ptg01_hr_132-166.indd 147 2/11/12 7:23 AM2/11/12 7:23 AM