chapter 5: summary of findings from the … 5: summary of findings from the participant outcome...
TRANSCRIPT

CHAPTER 5: SUMMARY OF FINDINGS FROM THE PARTICIPANT OUTCOME ANALYSIS
5.1 INTRODUCTION
Over the course of the evaluation, the Participant Outcome Analysis (POA) produced numerous findings about what changed under the Waiver regarding permanency and safety outcomes. This chapter reviews previous years’ POA results and summarizes significant findings in Years 2 through 4 of the evaluation. (For details on findings and methodology, refer to the previous annual reports.1) The Year 5 analyses follow in Chapter 6.
This chapter summarizes findings from previous annual reports and so incorporates several different analytic approaches and presentations. The analyses in Years 2 and 3 were primarily at the county level, while the Year 4 analyses presented in this chapter were at an aggregate level (and the Chapter 7 case studies explore at the county level some of the aggregate findings). The findings in Years 2 and 3 should be viewed as preliminary, because they were based on early analyses (the Waiver had not been in operation for very long yet) and were not adjusted for case characteristics. They provided preliminary indications of what might be happening under the Waiver, but were not conclusive. On the other hand, the Year 4 findings (and the Year 5 findings presented in the next chapter) were based on more years of experience and data, and did adjust for case characteristics, so should be viewed as the POA primary findings on Waiver effects. However, in the area of child safety, even the Years 4 and 5 findings were severely constrained by data limitations in the areas of substantiation and indication, as well as the variation among the counties in how they categorize cases, assess risk, and record risk levels. Much remains to be learned about child safety under the Waiver.
To help track and understand the findings, Table 5.1 summarizes the topics discussed in this chapter, the chapter sections where they are discussed, the annual report that presented the findings, and the significant results. Discussions of the source of the POA data and the methodology used for the POA follow Table 5.1. The chapter then presents background information on caseload trends (number of reported abuse and neglect incidents and number of children in ongoing cases), from the Fourth Annual Report, to provide a context for the outcome findings. The remainder of the chapter summarizes
1 See Second Annual Report: Evaluation of Ohio’s Title IV-E Waiver Demonstration Project
“ProtectOhio”, Salem, OR: HSRI contract report, June 2000; Third Annual Report: Evaluation of Ohio’s Title IV-E Waiver Demonstration Project “ProtectOhio”, Salem, OR: HSRI contract report, June 2001 (revised September 2001); and Fourth Annual Report: Evaluation of Ohio’s Title IV-E Waiver Demonstration Project “ProtectOhio”, Salem, OR: HSRI contract report, September 2002.
Page 124 Fifth Annual Report--Chapter 5
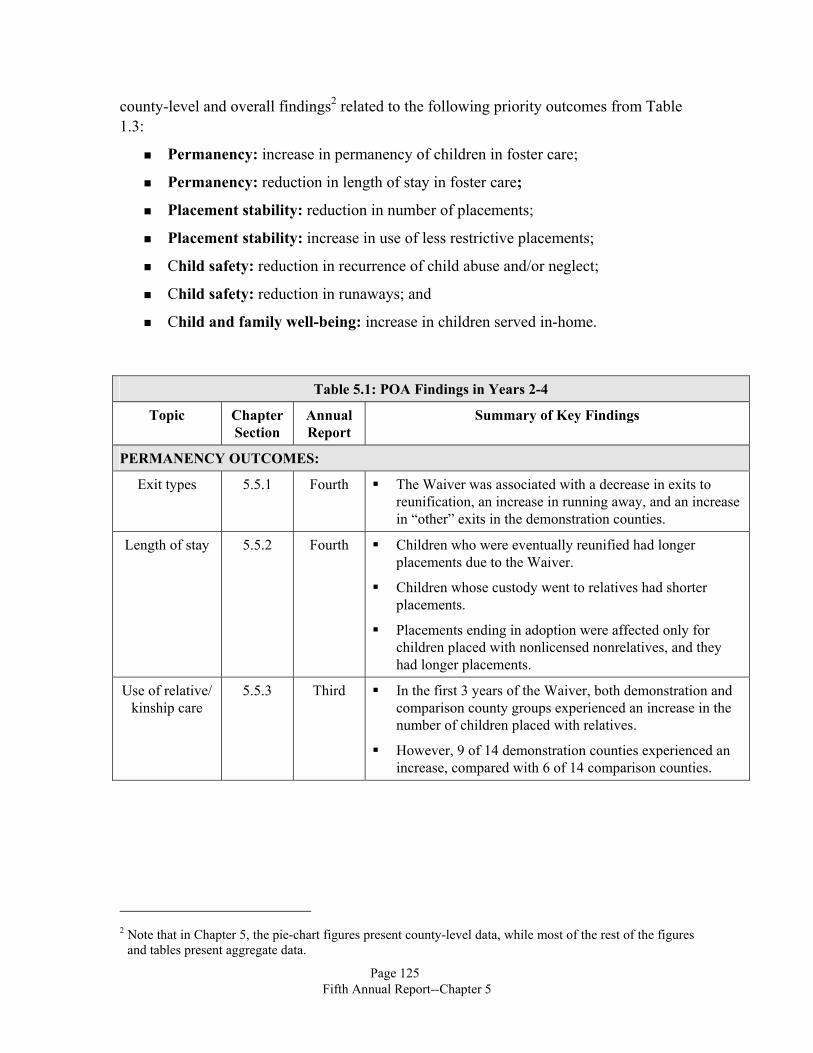
county-level and overall findings2 related to the following priority outcomes from Table 1.3:
Permanency: increase in permanency of children in foster care;
Permanency: reduction in length of stay in foster care;
Placement stability: reduction in number of placements;
Placement stability: increase in use of less restrictive placements;
Child safety: reduction in recurrence of child abuse and/or neglect;
Child safety: reduction in runaways; and
Child and family well-being: increase in children served in-home.
Table 5.1: POA Findings in Years 2-4
Topic Chapter Section
Annual Report
Summary of Key Findings
PERMANENCY OUTCOMES:
Exit types 5.5.1 Fourth The Waiver was associated with a decrease in exits to reunification, an increase in running away, and an increase in “other” exits in the demonstration counties.
Length of stay 5.5.2 Fourth Children who were eventually reunified had longer placements due to the Waiver.
Children whose custody went to relatives had shorter placements.
Placements ending in adoption were affected only for children placed with nonlicensed nonrelatives, and they had longer placements.
Use of relative/ kinship care
5.5.3 Third In the first 3 years of the Waiver, both demonstration and comparison county groups experienced an increase in the number of children placed with relatives.
However, 9 of 14 demonstration counties experienced an increase, compared with 6 of 14 comparison counties.
2 Note that in Chapter 5, the pie-chart figures present county-level data, while most of the rest of the figures
and tables present aggregate data.
Page 125 Fifth Annual Report--Chapter 5
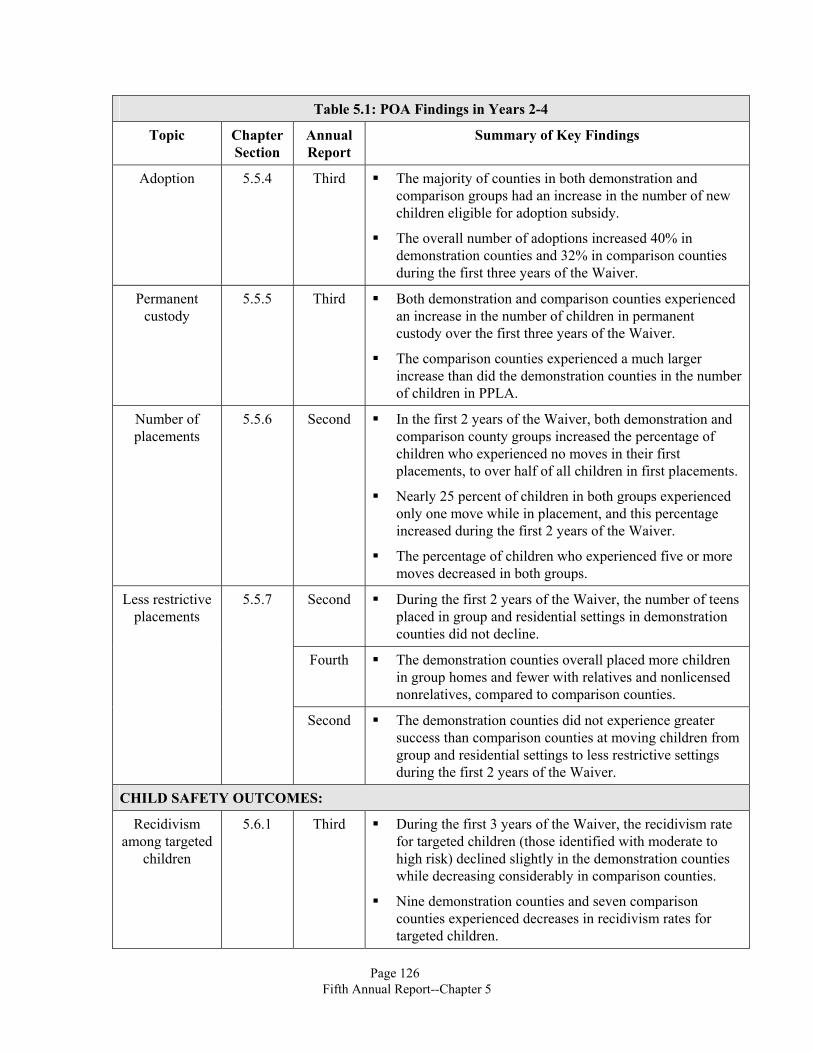
Table 5.1: POA Findings in Years 2-4
Topic Chapter Section
Annual Report
Summary of Key Findings
Adoption 5.5.4 Third The majority of counties in both demonstration and comparison groups had an increase in the number of new children eligible for adoption subsidy.
The overall number of adoptions increased 40% in demonstration counties and 32% in comparison counties during the first three years of the Waiver.
Permanent custody
5.5.5 Third Both demonstration and comparison counties experienced an increase in the number of children in permanent custody over the first three years of the Waiver.
The comparison counties experienced a much larger increase than did the demonstration counties in the number of children in PPLA.
Number of placements
5.5.6 Second In the first 2 years of the Waiver, both demonstration and comparison county groups increased the percentage of children who experienced no moves in their first placements, to over half of all children in first placements.
Nearly 25 percent of children in both groups experienced only one move while in placement, and this percentage increased during the first 2 years of the Waiver.
The percentage of children who experienced five or more moves decreased in both groups.
Second During the first 2 years of the Waiver, the number of teens placed in group and residential settings in demonstration counties did not decline.
Fourth The demonstration counties overall placed more children in group homes and fewer with relatives and nonlicensed nonrelatives, compared to comparison counties.
Less restrictive placements
5.5.7
Second The demonstration counties did not experience greater success than comparison counties at moving children from group and residential settings to less restrictive settings during the first 2 years of the Waiver.
CHILD SAFETY OUTCOMES:
Recidivism among targeted
children
5.6.1 Third During the first 3 years of the Waiver, the recidivism rate for targeted children (those identified with moderate to high risk) declined slightly in the demonstration counties while decreasing considerably in comparison counties.
Nine demonstration counties and seven comparison counties experienced decreases in recidivism rates for targeted children.
Page 126 Fifth Annual Report--Chapter 5

Table 5.1: POA Findings in Years 2-4
Topic Chapter Section
Annual Report
Summary of Key Findings
Recidivism in closed cases
5.6.2 Third During the first 3 years of the Waiver, the demonstration county group overall experienced little change in the recidivism rate for closed cases, while the rate dropped substantially in the comparison group.
Seven demonstration counties and nine comparison counties experienced drops in recidivism rates for closed cases.
Re-entry from reunification
5.6.3 Fourth The Waiver had no significant effect on the re-entry rate after reunification.
Runaway 5.6.4 Fourth The Waiver increased the daily rate of runaways by 133 percent.
Use of in-home vs. placement
services
5.6.5 Fourth The balance between in-home and placement services remained stable across the baseline and the Waiver periods, and demonstration counties’ proportions were similar to comparison counties’.
5.2 POA DATA SOURCE
The POA is based on child-level administrative data obtained from ODJFS’s Family and Child Information System (FACSIS). FACSIS collects information on children and families receiving services in the State of Ohio. FACSIS is supported by information submitted directly from counties, either from their own electronic data systems or from their local subsystems of FACSIS (called “micro-FACSIS”). Data for micro-FACSIS are collected by counties and entered into their micro-FACSIS systems, then the information is sent electronically to the state’s FACSIS system.
ODJFS provided data files for the 14 demonstration and 14 comparison counties with records on all placements that had started or were continuing in 1991 through February 28, 2002, along with disposition information. The study team created its files from 27 Child Protection Oversight and Evaluation (CPOE) files extracted from the FACSIS database, using data from 1990 through February 2002. The files contain FACSIS variables on:
Demographic profiles of clients served;
Abuse and neglect incidents, victims, perpetrators, and caretakers;
Case openings and closures for ongoing services;
Page 127 Fifth Annual Report--Chapter 5

Out-of-home placements, goals, long-term care, adoption, placement resources and facility licensing; and
Court-related activity such as custody, custody appeals, adjudication, dispositional hearings, shelter care hearings, reasonable efforts, and protective supervision.
The FACSIS identification number “cnref” was used as the unique identifier for each child. Preparatory steps in constructing a useable record for each child included deriving 78 variables from 65 raw FACSIS files in order to create the analysis files. Child-level data were then aggregated to the county level. In Year 4, variables were compared pre-Waiver and post-Waiver, with the Waiver period (for the purposes of the study) defined as January 1, 1998, through February 28, 2002. (Reports prior to Year 4 used shorter Waiver periods.) In that year, the analysis was conducted at an aggregate level, rather than the county level in previous years, to enable the study team to measure overall Waiver effects. The indicators presented are based on those developed in the first year evaluation report,3 with changes noted, if required.
FACSIS allows children to be followed from the first time they are registered as a client in a case. New children first appear as a victim in a child abuse report, as a new client in an ongoing case, or, sometimes concurrently, entering foster care or county custody. In the POA, the study team defined the child abuse and neglect population to include those children whose activities in FACSIS began with registration as a victim. Service cases, including court referrals, are defined by the absence of a child abuse and neglect incident as their initiating activity. The study team defined case type (in home or in placement) by the presence or lack of a foster care placement in the current year.
In the first year of the evaluation, the study team visited each demonstration and comparison county and conducted extensive interviews with PCSA staff to learn how they collect, enter, and report the FACSIS data, in order to understand the data flow and the data system’s strengths and weaknesses. In addition, in Year 1 the study team conducted a telephone survey with PCSA staff regarding data quality and usage, and in Year 2 conducted additional visits to counties with complicated data issues. As a result, the study team identified several issues that would affect the use of the FACSIS data for the POA, including4:
Definitional concerns. Often, situations arise which do not fit easily into the categories available in the micro-FACSIS system. Counties must decide how they are going to interpret special cases and where in micro-FACSIS the information should be entered. These situations can then lead to different counties adopting different methods for dealing with similar situations. In addition, differences in county practices create differences in the way data are entered. One example is
3 First Annual Report: Evaluation of Ohio’s Title IV-E Waiver Demonstration Project “ProtectOhio”,
Salem, OR: HSRI contract report, June 1999. 4 These issues are further discussed in the Second Annual Report.
Page 128 Fifth Annual Report--Chapter 5

that most counties record a relative placement in FACSIS only if the county has custody; however, several counties revealed that they rarely take custody and always make attempts to give custody to a relative. Another example is that some counties license relatives’ homes as foster homes and are unable to track them separately from regular foster homes. An important area of definitional differences was in handling low-priority cases; the state requires FACSIS registration only of screened child abuse and neglect incidents, while other cases are registered as clients but not as incidents, resulting in differential documentation of these cases among the counties.
Data not passed to Host FACSIS. The interviews revealed that some data recorded by the counties on their micro-FACSIS are not transmitted to host FACSIS. These events, called “county-defined,” are added by the counties to their own systems to fit their own data needs, and there is variation among the counties in the values used for these data.
Data quality. The interviews revealed numerous issues related to data quality. For instance, some counties expressed concerns that the transmission process, which takes data from the counties and enters them into the State system, is inadequate and either loses data or improperly overwrites previous transmissions. In addition, some individuals in the system have multiple ID numbers, and there is some case duplication across counties. FACSIS quality assurance is conducted through CPOE, which comprises an ongoing and continual set of onsite activities conducted by PCSAs and ODJFS to promote the effective and efficient service delivery of child protection services in the State of Ohio. CPOE involves a monthly data validation process that flags discrepancies for investigation.
An example of how data quality issues can compromise the POA arose in Year 5 of the evaluation (Year 5 outcome findings are reported in the next chapter). In that year, one of the large urban demonstration counties (Hamilton County) submitted a revised data file for previous years in which length of stay and initial placement (especially regarding residential settings) were changed for a large number of children. In addition, the revised data file used a different criterion for the designation of an ongoing case. The study team determined that analyses using the revised data file would substantially alter several of the findings that were reported earlier, especially those concerning residential settings.5 After examining findings concerning all placements, the study team determined that most of those findings would not be substantially affected and so could be retained. Thus, some of the Year 4 findings had to be retracted (as noted later in this chapter), but there are as yet no new findings to replace them.
5 The Year 5 modeling and analysis had already been completed and, due to resource and time limitations,
could not be repeated with the revised data file.
Page 129 Fifth Annual Report--Chapter 5

5.3 POA METHODOLOGY
Early in the evaluation, the study team made two important decisions concerning the POA that would influence the analysis in the following four years. First, ProtectOhio was a state project, and success (or lack thereof) must be measured overall, not at the individual county level. However, the study team was aware that substantial differences likely existed among the counties, especially influenced by county size and urbanicity, so the team also grouped the counties on those characteristics and examined those findings. As a result, the outcome findings were generally presented on two levels: overall (for all demonstration counties, where the final outcomes must be assessed) and for specific counties or county groups. When the overall outcome findings were largely driven by results in one or two counties, the team noted that. In the remainder of this chapter, outcome findings are characterized as either “county-level” or “overall” to delineate the difference in approaches.
Second, a primary goal of the Waiver was to reduce placement costs. Investigating the mechanisms by which placement costs can be reduced helps to understand the impact of flexible funding, such as that under a title IV-E waiver. Basically, placement costs can be reduced either by reducing placement days or by reducing unit costs. The fiscal analysis presented in Chapter 4 found that neither of these (placement days nor unit costs) was reduced.6 Although placement days could be reduced either by reducing the number of admissions or by reducing length of stay in placement, the demonstration counties emphasized that the latter (reducing length of stay in placement) was one of their highest priorities, as was noted in Chapter 1. Thus, the POA study team decided to focus detailed attention on what happened to length of stay under the Waiver.
The study team examined the administrative data for changes in length of stay and exit types that might be associated with the Waiver. In Year 2, the analysis examined patterns in exit types, in-home vs. placement, length of stay, use of relatives, placement stability, and recidivism based on county groups that took into consideration size and urbanicity. In Year 3, the analysis examined use of relatives, adoptions, use of permanent custody and PPLA, and recidivism at the county level. In Year 4, the analysis controlled for county and case differences to assess significant Waiver effects overall.
In Year 4, the analyses were based on data for the entire study period, covering all children who started their first placements in 1991 or later, up through February 28, 2002. The analyses of the length of the first placement examined several different outcomes, including reunification, transfer of the child’s custody to a relative, the child’s adoption, and the child running away from the placement. The length of the first placement was defined by its start and stop dates. The information about where the child went when he 6 The fiscal analysis found no significant differences between demonstration and comparison counties in
placement day usage, unit costs, or use of residential care days. Expenditures increased dramatically in both groups, and in most demonstration counties the additional revenue was spent on child welfare services other than placement costs.
Page 130 Fifth Annual Report--Chapter 5

or she exited the first placement (i.e., the outcome of the placement) had to be derived from different data items in the FACSIS database. For this purpose, the team integrated the information from the placement removal reason and the custody termination reason. Additionally, for those children whose first placement ended with reunification, the team examined re-entry into a second placement.
It is important to recognize a key challenge of analyzing data on length of stay in placement. About 10 percent of first placements that started in 1991 or later were still ongoing at the end of the study period (February 28, 2002). That is, it was not known how long these children would ultimately stay in their first placements – their data were “censored” with respect to the ultimate outcome information. At the same time, they did provide some information for the evaluation, since they had already spent a certain amount of time in their placements. The study team used survival analysis methodology because it incorporates the information from these cases and avoids the bias due to the missing data (i.e., the still ongoing cases) that would otherwise affect the findings. (See the Fourth Annual Report for a full discussion of the survival analysis methodology.)
The length of the first placement was defined by its start and stop dates. The information about where a child went when he or she exited the first placement (i.e., the exit type) had to be derived from several data items in the FACSIS database. For this purpose, the team integrated the information from the placement removal reason and the custody termination reason. Additionally, the analyses were designed to take into account a number of other child and case factors that could potentially influence the length of placement and placement outcome. These included age, sex, race, medical conditions and disabilities, type of placement, allegations of abuse or neglect, and whether the child had been sexually abused. These variables were extracted from the administrative database. In addition, counties were classified as small rural, small urban, or large urban. After fitting the multivariate survival models to the data, the team used the model information to impute unbiased values for length of stay and exit type for the censored cases. (See the Fourth Annual Report for details on the imputation process.)
5.4 TRENDS IN CASELOAD CHARACTERISTICS
Caseload trends establish a context for reviewing the permanency and safety outcomes. This section presents data on caseload trends from baseline (two years prior to the beginning of the Waiver, FFY96 and FFY97) through the first four fiscal years of the Waiver (FFY98 through FFY01). The trends are compared for the demonstration county group and the comparison county group. Individual county data were presented in Appendix II of the Fourth Annual Report.
A first step is to monitor the caseload sizes in each county, from the baseline period through the first 4 years of the Waiver period. Caseload counts are useful in identifying differences in PCSAs’ use of FACSIS, the relative size of PCSA caseloads, and changes
Page 131 Fifth Annual Report--Chapter 5

in the volume of children served by each PCSA. While changes in caseload indicators do not offer insight into why caseload volume has changed, it is nonetheless a familiar statistic for PCSA staff and indicative of some external or internal systemic change. This section describes changes from baseline through 2001 in the number of abuse and neglect incidents, the use of in-home vs. placement services, and the number of children served.
5.4.1 Number of Reported Abuse and Neglect Incidents
Reported cases of child abuse and neglect are the primary entryway to the foster care system for many children. Typically, the referrals received by PCSAs in Ohio are organized into two categories: reports of child abuse and neglect (incidents) and other requests for service. Most of the other requests for services come from the courts for dependent, delinquent, or unruly children, but concerned families or community members may also make some of these requests. As a caseload measure, the number of incidents indicates the number of workers a PCSA will need to handle investigations and the size of the pool of children who might require foster care placement.
Figure 5.1 shows that the number of abuse and neglect incidents decreased during the Waiver period for both demonstration and comparison county groups. The decrease was steeper in the comparison county group. The reduction in the number of incidents may have been affected by county initiatives such as efforts to increase the “screening out” of cases – when a hotline call is screened out, it is not entered as a documented incident in FACSIS. In addition, data collection procedures may have changed; for example, a large drop in incidents may be due to changes in a county’s reporting system that improved the accuracy of the data. Finally, this trend in Ohio is similar to national trends in child victimization rates; the National Child Abuse and Neglect Data System (NCANDS) showed that the rate was 14.7 victims per 1,000 children in 1996, and it had declined to 12.4 victims per 1,000 children in 2001 (U.S. Department of Health and Human Services, 2003).
Page 132 Fifth Annual Report--Chapter 5

Figure 5.1: Number of Child Abuse and Neglect Incidents By Federal Fiscal Year
0
5000
10000
1500020000
25000
30000
35000
1996 1997 1998 1999 2000 2001
Fiscal Year
Num
ber o
f Chi
ld A
buse
and
N
egle
ct In
cide
nts
Demonstration CountiesComparison Counties
Summary: The number of reported abuse and neglect incidents decreased during the Waiver period for both demonstration and comparison counties.
5.4.2 Number of Children in Ongoing Cases
In addition to the number of incidents, the number of children in each PCSA’s caseload is an important statistic. The larger the caseload, the greater the workforce needed to handle service delivery and case management. Some counties are able to respond to increased agency caseloads by adding workers; many others simply absorb the added workload among existing workers, with potential negative effects on casework quality and documentation.
It might be expected that if abuse and neglect incidents decrease, caseloads will also decrease. However, that is not necessarily the case. This analysis counts the individual children in ongoing cases at any time during the year. Figure 5.2 shows that, for the years prior to the Waiver, the demonstration and comparison counties both had fairly stable ongoing caseloads. During the Waiver period, however, the demonstration and comparison county groups experienced contrasting trends in the number of children in ongoing cases: caseloads in the demonstration county group increased, while caseloads in the comparison county group decreased. Thus, although the number of abuse and neglect reports declined in demonstration counties, case managers might have seen increased workload pressures from higher caseloads.
Page 133 Fifth Annual Report--Chapter 5

Figure 5.2: Number of Children Served During Federal Fiscal Year
05000
1000015000200002500030000350004000045000
1996 1997 1998 1999 2000 2001
Fiscal Year
Num
ber o
f Chi
ldre
n Se
rved
DemonstrationCountiesComparisonCounties
Summary: The number of reported abuse and neglect incidents decreased during the Waiver period for both demonstration and comparison counties.
5.5 PERMANENCY OUTCOMES
Achieving permanency for children in placement is a central focus of all PCSAs, both demonstration and comparison counties alike. Through such efforts, children are removed from foster care and given the opportunity to stabilize relationships with a caregiver. Custody is given or returned to the caregiver and the PCSA takes a back seat for care of the child. Permanency was a particular focus for the demonstration counties, as they explored ways to use flexible title IV-E funds. Indeed, among the 14 demonstration counties, six counties chose to use IV-E funds directly on permanency-related activities such as supplementing adoption subsidies, providing financial incentives to nonrelated guardians, expanding independent living programs, paying for treatment of children in court custody, and providing post-PCSA intervention services.
This section presents significant findings on what happened under the Waiver to the types of exits from placement, length of stay, use of relative/kinship care, adoption, permanent custody, number of placements, and use of less restrictive placements. In earlier years, county-level analyses described the changes observed without being able to attribute them to the Waiver. In the Year 4 analysis, the study team attributed overall changes directly to the Waiver. The survival analysis modeling in that year compared length of stay in first placements during the pre-Waiver period to first placements during the Waiver period, while taking into account the case and child characteristics that might also affect the outcomes. However, it is important to note that these “Waiver effects” also could have been influenced by other unmeasured factors.
Page 134 Fifth Annual Report--Chapter 5

5.5.1 Types of Exit from First Placements7
In making the programmatic changes associated with the Waiver, demonstration counties were concerned about the effects on where children went when they left placement. Were fewer children going home? If so, where were they going instead?
Indeed, the Year 4 analysis showed that overall exit to reunification declined significantly (from 53 percent to 45 percent) under the Waiver in the demonstration counties and increased in the comparison counties (from 45 percent to 49 percent), as shown in Table 5.2. Although placements ending with running away declined in both county groups under the Waiver, they declined less in the demonstration counties, so the Waiver effect was to dampen the decrease in those exits (i.e., even fewer children would have run away in the absence of the Waiver). The “other exits” category (which includes emancipation, court termination, death, jail or juvenile detention, and transfer to other institutional care) shows results opposite those for reunification. In fact, most of the differences seen in reunification are balanced by opposite changes in the “other exits” category. For demonstration counties, “other exits” increased by 9 percent during the Waiver period, while in comparison counties these types of exits decreased by 2 percent.
Table 5.2: Destination of Children Exiting From First Placement Episode
by Study Group and Time Period Percent
Demonstration Counties
Comparison Counties
Difference Between Demonstration and
Comparison Counties Exit
Destination Pre-
Waiver Waiver period Change Pre-
Waiver Waiver period Change Pre-
Waiver Waiver period Change
n=29,029 n=18,498 n=16,940 n=9,476
Reunification 52.55 44.94 -7.61* 45.27 48.86 3.60* 7.29 -3.92 -11.21*
Custody to Relatives 19.45 18.01 -1.45* 24.58 22.42 -2.15* -5.12 -4.42 0.71
Adoption 8.28 9.30 1.02* 9.14 10.31 1.17 -0.86 -1.01 -0.15
Runaway 1.55 1.04 -0.52* 1.06 0.32 -0.74* 0.49 0.72 0.23*
Other 18.16 26.71 8.55* 19.96 18.09 -1.87* -1.80 8.63 10.42*
*Indicates statistically significant change. Summary: The Year 4 analysis found that the Waiver was associated with an overall decrease in exits to reunification, an overall increase in running away, and an overall increase in “other” exits in the demonstration counties.
7 Year 5 findings on Waiver effects on exit types are presented in the next chapter. Note that the approach
and analytic method in Year 5 are different from those in Year 4, so some findings are different.
Page 135 Fifth Annual Report--Chapter 5

5.5.2 Length of Stay
Waiver counties identified reducing length of stay in foster care as a primary objective of the Waiver. Were the demonstration counties successful at accelerating the discharge of children from their first placement? This question was addressed in the Year 4 survival analysis, which took into account a number of child and case characteristics that interact with and affect the length of a child’s first placement episode and its exit type.8 By using this strategy, the study team determined that the overall changes that were ascribed to the Waiver were unlikely to be due to differences in case mix, such as there being more babies (who were more likely to be adopted) or teenagers (who were more prone to run away). The findings are summarized in Table 5.3 and discussed following the table. This section reviews overall length-of-stay findings on all exits; exits to reunification; exits to relatives’ custody; and exits to adoption. Later sections present additional information on the use of relative/kinship care and exits to adoption.
Table 5.3: Different Exit Types: Summary of Length of Stay Findings
Exit Type Overall Effect in Demonstration Counties Compared to Comparison Counties
Children exiting first placement in out-of-home care for any reason
None
Children reunified with parents or guardians at the end of first placement in out-of-home care
Longer time in care
Children whose custody was transferred to a relative at the end of first placement in out-of-home care
Shorter time in care
Children under age 12 whose first placement ended with adoption
None, except shorter time in care for children placed with nonlicensed nonrelatives
All Exits from First Placements
According to the Year 4 analysis, the Waiver did not cause overall changes in the length of stay of children’s first placement in foster care. However, while the Waiver effect was
8 Year 5 findings on Waiver effects on length of stay are presented in the next chapter. Note that the
approach and analytic method in Year 5 are different from those in Year 4, and had somewhat different results.
Page 136 Fifth Annual Report--Chapter 5
not significant across all cases and an exit of any type, it was significant in specific circumstances, as described below.9
Exits to Reunification
Children who were reunified with parents overall represented approximately 45-53 percent of the children who left first placements (from Table 5.2). This was by far the most common exit type. The Year 4 survival model showed that one effect of the Waiver was to slow the overall rate of reunification. This was true in both small and large demonstration counties, and in contrast to the pattern in the comparison counties. In small demonstration counties, the daily rate of reunification was 9 percent slower than it would have been without the Waiver. This effect was even greater for large demonstration counties, where the daily rate of reunification was 22 percent slower than it would have been without the Waiver.
Exits to Relatives’ Custody
Another permanency outcome that was examined for Waiver effects was the permanent placement of a child with a relative. Permanent placement with a relative was defined as an exit where a child leaves placement and the court transfers custody of the child from the PCSA to a relative. This permanency outcome represented approximately 18-25 percent of the children exiting care after first placement episodes (from Table 5.2). Use of relative/kinship care (which may or may not represent an exit from placement, since relatives are also used as placement settings) is discussed in detail in Section 5.5.3.
Again, the survival model was able to take some account of case mix factors when examining the effect of the Waiver on children’s length of placement until their custody was given to relatives. After adjusting for these extraneous, case-mix effects, the model showed that, for those children who were not alleged victims of abuse or neglect, the Waiver significantly accelerated their overall daily rate of exit to relative custody by 64 percent. For children who were alleged to be victims of abuse or neglect, the effect was smaller but still significant: the daily rate of transfer of custody to a relative for abused/neglected children was 20 percent faster than it would have been without the Waiver.
Exits to Adoption
In the Year 4 analysis, using a survival model, the study team estimated the overall length of time in care before exit to adoption to determine whether the Waiver affected that 9 The Fourth Annual Report reported that the Waiver accelerated the discharge rate in the two large
demonstration counties, especially for children placed in residential settings. However, one of those counties (Hamilton County) extensively revised its data set, and a new analysis based on the revised data set would result in different results. Thus all Year 4 findings regarding residential placements were invalidated, but new analyses were not possible due to resource and time limitations.
Page 137 Fifth Annual Report--Chapter 5
length of stay.10 The study team analyzed data only on children under 12 years of age at the time of placement, as there were so few older children who were adopted. Adoption represented approximately 8-11 percent of all children exiting care after first placement episodes, but 13 percent of children under age 12. Adoption is further discussed in Section 5.5.4.
The results provided no strong evidence for a Waiver effect on overall length of stay until adoption. From the pre-Waiver to the Waiver period, the placement duration was shortened in both demonstration and comparison counties by similar amounts (by about 2 months – to about 24 months for demonstration counties and 27 months for comparison counties, which does not constitute a statistically significant difference between the two groups).
However, the Waiver did appear to retard the rate of adoption for children initially placed with nonlicensed nonrelatives (who were often godparents or family friends available at the time of an emergency removal). The daily rate of adoption of this subgroup was estimated to be 75 percent lower in demonstration counties than it would have been without the Waiver. However, this exit occurs infrequently. In demonstration counties, it occurred about 4 percent of the time for first placements of children in both pre-Waiver and Waiver periods. In comparison counties, it was used to a modest extent during both periods but increased significantly from 1.4 percent of first placements before the Waiver to 2.3 percent during the Waiver period. The median length of stay for these children increased in the demonstration counties (from about 25 months to 27 months), while it decreased in the comparison counties (from about 27 months to 20 months). Further research is warranted to try to identify whether there is anything unique about the use of nonlicensed nonrelative placements in the comparison counties that may have resulted in their increased use and reduced median duration of placement.
Summary: The Year 4 analysis found that in the demonstration counties the Waiver was associated with a slower rate of reunification, an accelerated transfer of custody to a relative, and a slower rate of adoption for the small subset of children placed with nonlicensed nonrelatives.
5.5.3 Use of Relative/Kinship Care
In an effort to find permanent settings quickly for children in PCSA custody, both demonstration and comparison counties pushed workers to explore opportunities to place children with relatives. Finding a relative home for a child was viewed as supporting the best interest of the child, as well as enabling the county to become less involved in the case and ultimately reducing placement days. Such arrangements typically kept a child closer to the birth family and, should termination of parental rights become necessary, the
10 This is an analysis of first placement episodes only. Since PCSAs try first to return children home, it is
possible that the Waiver has a different impact on children awaiting adoption in their second or later placement in foster care.
Page 138 Fifth Annual Report--Chapter 5

child could maintain family ties. Counties expected that relative placements would increase as PCSAs created more in-home services and were able to better support children in relatives’ homes.
Throughout the discussion on relative/kinship care, limitations in the administrative data must be kept in mind. Several counties rarely or never use the relative care event code in FACSIS; some place children directly with relatives (as shown in Table 5.4, from the Year 3 annual report), avoiding any entry of that placement into FACSIS, while others may place few children in relative care or may record relative placements in a separate event in FACSIS. Also, some counties license relatives’ homes as foster homes and are unable to track them separately from regular foster homes. Thus, the findings should be interpreted cautiously.
Table 5.4: Most Frequent Approaches to the Use of Relative/Kinship Care*
Approach Demonstration Counties Comparison Counties Informal placement directly with relative
Muskingum Allen, Columbiana, Hancock, Hocking, Mahoning, Miami, Trumbull
Custody to relative after short time
Belmont, Clark, Crawford, Greene, Medina, Richland, Stark
Butler, Clermont, Montgomery, Scioto, Wood
Placement with relative, custody to PCSA
Ashtabula, Fairfield, Franklin, Hamilton, Portage
Summit, Warren
Approach not determined Lorain None *Information was obtained through telephone interviews in 2001.
While many demonstration and comparison counties stated that use of relatives for placement options was an ongoing emphasis of the agency, the degree of formalization of this effort varied greatly among PCSAs. Many counties trained workers to explore more quickly the possibilities of relative placements, including increasing use of risk assessment tools to identify potential relatives for placement options. In more targeted efforts to encourage relatives to take a child, several counties used flexible funding resources (i.e., IV-E Waiver and PRC dollars) to support the needs of relative placements and pay for goods and services. These funds were used to provide day care or respite, pay utility bills, purchase furniture, and in some counties, pay a per diem. Counties also developed support services/groups for kinship providers so they were able to talk with other relative caregivers and make better use of benefits that are available. One comparison county even created two kinship care units that paralleled the foster care services to provide equal support to relative caregivers. Clearly, counties took a number of different approaches to both identify and support relative placements in order to make better use of these placement options.
In Year 2, site visits revealed the following variations in county practice:
Page 139 Fifth Annual Report--Chapter 5

a) Custody could fall into three categories: PCSA custody, parent custody, and relative custody. In many counties, when a child was placed with a relative, the PCSA held custody. This arrangement could be used if PCSA wanted to keep open the option to file for permanency. Alternatively, custody could be passed to the relative caring for the child. This might have been done in order to qualify the child for services (i.e., enroll in school). Finally, custody might have remained with the parent; the PCSA encouraged voluntary placement with a relative, accompanied with a safety plan. Some counties preferred this arrangement because the birth parent remained involved in the case. The voluntary agreements were also preferred in some counties as a way to reduce the amount of time they spent in court. Many counties used a combination of these custody arrangements.
b) Licensure: While most relative placements were in unlicensed homes, some counties did license the relatives’ homes, when the child was in the custody of the PCSA. In the past, some counties did this so they could pay the relatives a foster care per diem and protect themselves from liability (once the child was in their custody). However, under recent practice, relatives who had been licensed were treated in the records system the same as any foster home, and were not separately identified as kinship placements. In Year 2, the study team determined that slightly more than half of the counties (eight demonstration and eight comparison counties) would, under certain conditions, license a relative’s home. Since federal policy requires that all relative caregivers be allowed to become licensed foster caregivers, counties will license them if requested to do so. But typically, relative caregivers do not choose to do so, or are not specifically offered the opportunity.
c) Fiscal incentives: Many counties provided relatives with some sort of payment to compensate for the cost of caring for a child. In counties where relatives’ homes were licensed, a per diem was provided to the relative. In unlicensed homes, when custody was with the PCSA, either per diems or one-time payments might have been offered to relatives. Lastly, when a relative had custody, that relative might have received a payment, usually in the form of a one-time payment. Kinship funds, family stability funds, and other special programs were available as needed to meet relative caretakers’ needs. In one demonstration county, the PCSA targeted older adolescents who had been in stable placements with relatives but were not eligible for adoption, and provided the family with financial assistance as a way to provide permanency and allow the PCSA to withdraw.
The Year 3 analysis found that overall, during the first three years of the Waiver period, the comparison counties experienced the same amount of growth in the number of children in nonlicensed relative homes (15 percent) as the demonstration counties. However, the county-level analysis showed that nine of the 14 demonstration counties experienced increases in the number of children in relative care (Figure 5.3). In contrast, only six comparison counties experienced a growth in the number of children in relative care. Decreases were observed in five demonstration and four comparison counties.
Consistent with this finding at the individual county level, the caseworker survey found a significant difference between demonstration and comparison county cases in the
Page 140 Fifth Annual Report--Chapter 5

proportion of children who lived with a relative. In 47 percent of the demonstration county sample, the child lived with a relative, compared to only 36 percent of comparison county cases.
Figure 5.3: Change In Number Of Children In Nonlicensed Relative Care Between End Of Baseline Period And Third Year Of Waiver Period
Demonstration Counties Comparison Counties
4 Counties
6 Counties
4 Counties
Increase
Decrease
Same
9 Counties
5 Counties
Increase
Decrease
During the Year 4 site visits, approximately half the counties mentioned a new initiative, the Kinship Navigator program, which also impacted the amount of support that was provided to relatives. This program was “a statewide network of ‘kinship navigators’ who serve as the point of contact for kinship caregivers who are seeking information regarding services and benefits available at the state and local level and assist caregivers in accessing the benefits and services for which they may be eligible.”11 Some PCSAs hired a Kinship Navigator internally, while others contracted with local private providers to develop the services. The overall goal of the program was to support and maintain relative placements, primarily by providing information and referrals for relatives, as well as some more targeted services, such as legal assistance on obtaining custody.
Another important issue that came up in Year 4 discussions was the PCSAs’ serious concern about their ability to keep using relatives for placements, given federal policy interpretation (ACYF-CB-PA-01-02) that was scheduled to go into effect October 1, 2002.12 This interpretation said that states could only claim administrative cost reimbursements for children placed in licensed relative care. Since most relative care in Ohio was unlicensed, this policy interpretation was likely to reduce administrative reimbursement, especially for counties that were successful at increasing the portion of
11http://www.state.oh.us/odjfs/kinship.htm 12 As of May 2003, the policy interpretation has not yet gone into effect, but Ohio counties are still
preparing for its implementation.
Page 141 Fifth Annual Report--Chapter 5
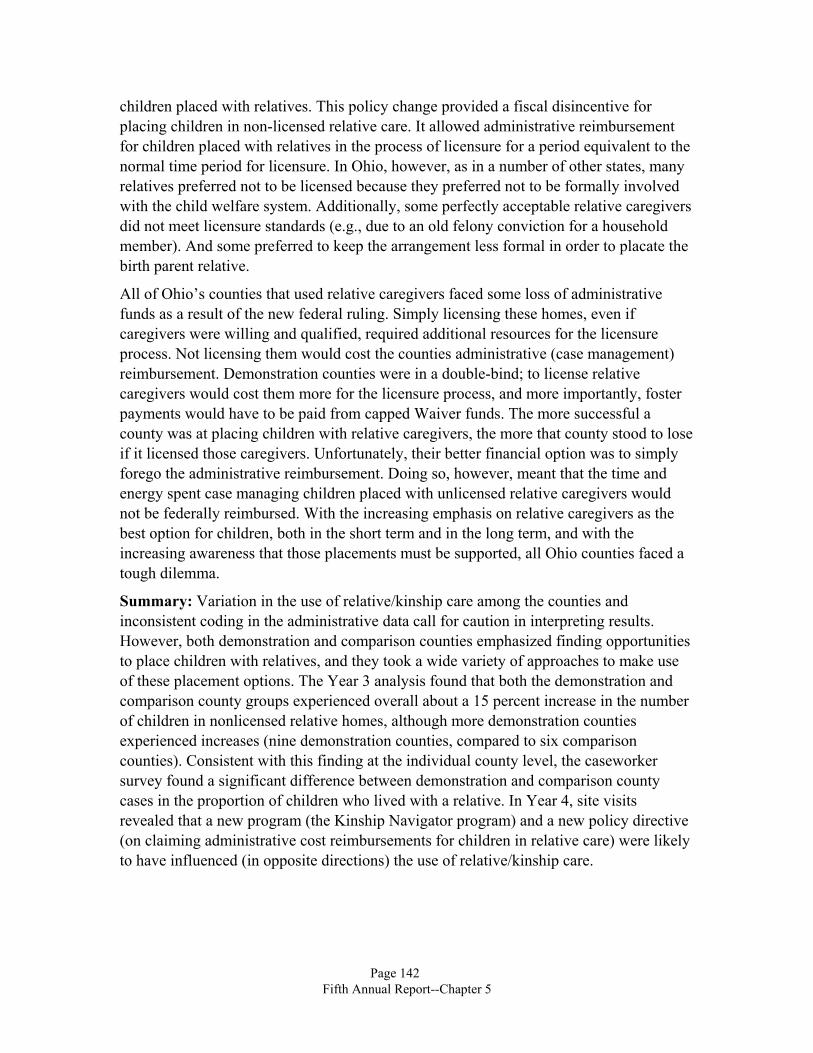
children placed with relatives. This policy change provided a fiscal disincentive for placing children in non-licensed relative care. It allowed administrative reimbursement for children placed with relatives in the process of licensure for a period equivalent to the normal time period for licensure. In Ohio, however, as in a number of other states, many relatives preferred not to be licensed because they preferred not to be formally involved with the child welfare system. Additionally, some perfectly acceptable relative caregivers did not meet licensure standards (e.g., due to an old felony conviction for a household member). And some preferred to keep the arrangement less formal in order to placate the birth parent relative.
All of Ohio’s counties that used relative caregivers faced some loss of administrative funds as a result of the new federal ruling. Simply licensing these homes, even if caregivers were willing and qualified, required additional resources for the licensure process. Not licensing them would cost the counties administrative (case management) reimbursement. Demonstration counties were in a double-bind; to license relative caregivers would cost them more for the licensure process, and more importantly, foster payments would have to be paid from capped Waiver funds. The more successful a county was at placing children with relative caregivers, the more that county stood to lose if it licensed those caregivers. Unfortunately, their better financial option was to simply forego the administrative reimbursement. Doing so, however, meant that the time and energy spent case managing children placed with unlicensed relative caregivers would not be federally reimbursed. With the increasing emphasis on relative caregivers as the best option for children, both in the short term and in the long term, and with the increasing awareness that those placements must be supported, all Ohio counties faced a tough dilemma.
Summary: Variation in the use of relative/kinship care among the counties and inconsistent coding in the administrative data call for caution in interpreting results. However, both demonstration and comparison counties emphasized finding opportunities to place children with relatives, and they took a wide variety of approaches to make use of these placement options. The Year 3 analysis found that both the demonstration and comparison county groups experienced overall about a 15 percent increase in the number of children in nonlicensed relative homes, although more demonstration counties experienced increases (nine demonstration counties, compared to six comparison counties). Consistent with this finding at the individual county level, the caseworker survey found a significant difference between demonstration and comparison county cases in the proportion of children who lived with a relative. In Year 4, site visits revealed that a new program (the Kinship Navigator program) and a new policy directive (on claiming administrative cost reimbursements for children in relative care) were likely to have influenced (in opposite directions) the use of relative/kinship care.
Page 142 Fifth Annual Report--Chapter 5

5.5.4 Adoption
If a child cannot return to the care of parents, custody will be given to the PCSA after the legal termination of parental rights. Then, finding an adoptive home for a child in PCSA permanent custody is the most desirable permanency option. However, finding a home that fits the needs of a particular child can be a difficult task. In an effort to develop better access to adoptive homes, several counties joined the AdoptOhio initiative. They believed it would reduce the amount of time that children remained in PCSA custody while awaiting adoptive homes. Similarly, federal ASFA requirements pushed all PCSAs to shorten the time until adoptions are finalized. As was presented in Section 5.5.2, the Year 4 analysis found no significant Waiver effect on length of stay until adoption, except for the small subset of children placed with nonlicensed nonrelatives, for whom it slowed the rate of adoption. The finding of no Waiver effect was not surprising, given the widespread activity under AdoptOhio and ASFA.
The Year 3 county-level analysis found that, in the first three years of the Waiver, the majority of counties in both the demonstration and comparison groups increased the number of new children whose adoptions were finalized and who were eligible for adoption subsidy. It was likely that ASFA and AdoptOhio were equally pressuring all counties in the state. Figure 5.4 shows substantial increases in ten demonstration counties and nine comparison counties. Two demonstration counties and one comparison county experienced little or no change in the number of children eligible during the Waiver period. Only two demonstration counties and four comparison counties experienced decreases in the number of children eligible for adoption subsidy. In that year, the overall number of adoptions increased by 40 percent in the demonstration counties and 32 percent in the comparison counties.
Figure 5.4: Change In Number Of New Children Eligible For Adoption Subsidy Between End Of Baseline Period And Third Year Of Waiver Period
Demonstration Counties Comparison Counties
9 Counties
4 Counties
1 County
Increase
Decrease
Same
10 Counties
2 Counties
2 Counties
Increase
Decrease
Same
Page 143 Fifth Annual Report--Chapter 5

Summary: The Year 3 analysis found that most counties in both the demonstration and comparison groups increased the number of new children eligible for adoption subsidy. The overall number of adoptions increased by 40 percent in the demonstration counties and 32 percent in the comparison counties during the first 3 years of the Waiver.
5.5.5 Permanent Custody
From FACSIS, the study team used custody type to track court outcomes. Permanent custody referred to children whose parents’ custody was terminated and the children were placed fully in the legal care of the PCSA. They were children usually available for adoption. Children in Permanent Planned Living Arrangements (PPLA) were older children in long-term foster care, where custody might remain with parents, but since the parents are unfit or unavailable, children are expected to stay in care until the age of majority.
In Year 3, the study team examined both the number of children in permanent commitment and the number of children in PPLA. Overall, both the demonstration and comparison counties experienced increases in the number of children in permanent commitment during the Waiver period. The study team observed an increase of 35 percent in the demonstration group between the end of the baseline period and the end of the third year of the Waiver period. Similarly, the comparison group showed an increase of 28 percent. In fact, nine of the demonstration counties and eight of the comparison counties experienced increases in the number of children in permanent commitment, as shown in Figure 5.5. This pattern of overall increase is not surprising, given the emphasis in ASFA to move children to permanency and the increase (noted above) in number of children eligible for adoption subsidy.
Page 144 Fifth Annual Report--Chapter 5

Figure 5.5: Change In Number Of Children In Permanent Commitment Between End Of Baseline Period And Third Year Of Waiver Period
Demonstration Counties Comparison Counties
9 Counties
4 Counties
1 County
Increase
Decrease
Same
2 Counties
8 Counties4 Counties
IncreaseDecrease
Same
Results were more mixed when examining the number of children in PPLA. Over the first three years of the Waiver period, the number of children in PPLA in the demonstration group increased very slightly (by only 4 percent), while the comparison group experienced a more substantial increase (28 percent). Figure 5.6 shows that eleven demonstration counties experienced decreases in the number of children in PPLA between the end of the baseline period and the end of the third year of the Waiver period. Only two demonstration counties experienced an increase, and the number of children in one county remained about the same. On the other hand, seven comparison counties showed increases and six of the remaining comparison counties showed decreases. One comparison county showed little or no change.
Figure 5.6: Change In Number Of Children In Permanent Planned Living Arrangements Between End Of Baseline Period And Third Year Of Waiver Period
Demonstration Counties Comparison Counties 1 County
2 Counties
11 Counties
Increase
Decrease
Same
7 Counties
6 Counties
1 County
IncreaseDecrease
Same
Page 145 Fifth Annual Report--Chapter 5
Summary: The Year 3 analysis found that overall both demonstration and comparison counties increased the number of children in permanent commitment during the Waiver period. The number of children in PPLA increased very slightly in demonstration counties, while increasing substantially in comparison counties.
5.5.6 Number of Placements
In the Year 2 analysis, the study team compared the distribution of moves for children who had their first placement episodes during the baseline period or first 2 years of the Waiver in demonstration and comparison counties. If the first episode was during the baseline period, then the study team examined the number of moves that the child experienced until the end of the baseline period. The study team also examined children who had their first episode during the first 2 years of the Waiver period and recorded the number of moves they experienced during that period. The study team then compared the results for the two time periods, and found no large differences between demonstration and comparison counties on number of placements. The results showed that:
Overall, an average of 40 percent or more children in both demonstration and comparison counties experienced no moves during the baseline period, and that percentage increased to over 50 percent during the first 2 years of the Waiver in both groups.
Nearly 25 percent of children in both demonstration and comparison counties experienced only one move while in placement, and this percentage also increased during the first 2 years of the Waiver.
The percentage of children who experienced five or more moves decreased in both demonstration and comparison counties. That percentage ranged from 3 to 9 percent during the baseline period, and fell to between 0 and 3 percent.
Summary: The Year 2 analysis showed that both the demonstration and comparison counties increased the stability of child placements. The percentage of children who experienced no moves in their first placements increased to over half of all children in first placements. The percentage of children who were moved five or more times declined in both groups.
5.5.7 Less Restrictive Placements
Flexible funding, especially through managed care contracts, promotes the clinical and financial goal of moving children out of expensive and institutional-like settings into more family-like foster care or home settings. Demonstration counties, as part of the Waiver, are trying to minimize the use of costly group and residential treatment center placements for children, especially for teenagers. In this section, the study team presents findings on two measures: (1) frequency of use of group and residential treatment center settings, and (2) success at moving children out of group care to more family-like settings.
Page 146 Fifth Annual Report--Chapter 5

Use of Group and Residential Treatment Center Settings
For the first measure, in Year 2 the study team examined whether living in a demonstration or comparison county was related to the setting where a teen (age 13 or older) was placed in that year. In Year 4, the study team examined overall Waiver effects on the setting of first placement for all children, using survival analysis methodology.
The Year 2 analysis showed that the Waiver did not appear to have influenced where teens (age 13 and older) were placed in their first placement settings.13 During the baseline period and first 2 years of the Waiver, between 65 and 83 percent of teens were placed in group and residential settings in the demonstration counties, compared to between 40 and 48 percent in comparison counties, indicating a large pre-existing difference between the two county groups that continued into the Waiver.
As shown in Table 5.5, the Year 4 analysis found that the demonstration counties overall placed significantly more children (of all ages) in group homes and fewer children with relatives and nonlicensed nonrelatives, compared to comparison counties, from the pre-Waiver to the Waiver period. The use of foster care homes declined slightly in both demonstration and comparison counties.14
13 Original findings found significant changes in the two large urban counties, but revisions in one county’s
data have invalidated the findings on residential placements. 14 Findings on placements in residential treatment centers are inconclusive, due to extensive revisions in
one county’s data that changed the results reported in Year 4.
Page 147 Fifth Annual Report--Chapter 5

Table 5.5: Percentage of Children in First Placement, Where First Placed, by Study Group and Time Period
Demonstration
Counties Comparison
Counties
Difference Between Demonstration and
Comparison Counties Child’s First Placement
Pre-Waiver
Waiver period Change
Pre-Waiver
Waiver period Change
Pre-Waiver
Waiver period Change
Group Home 5.79 9.95 4.15* 5.24 5.10 -0.14 0.56 4.85 4.29*Foster Home 43.41 42.36 -1.05* 62.07 60.74 -1.33* -18.66 -18.39 0.28Nonlicensed Nonrelative15
4.03 3.95 -0.08 1.40 2.34
0.94*
2.62 1.60 -1.02*
Relative 30.82 25.93 -4.90* 19.16 22.41 3.26* 11.67 3.51 -8.16*Independent Living
0.05 0.04 -0.01 0.11 0.05 -0.05* -0.06 -0.01 0.04*
Detention Facility or Hospital
4.00 4.53 0.53* 5.19 3.39
-1.80*
-1.19 1.14 2.33*
Adoptive Home
0.04 0.05 0.01 0.02 0.02 0.00 0.03 0.03 0.01
*Statistically significant effect
Moving Children Into More Family-Like Settings.
For this measure, in Year 2 the study team identified all children that entered a group or institutional setting during the baseline or Waiver periods. The study team then looked at what placement changes occurred for that child from the time of placement into that particular group setting until he/she exited care at the end of the study period (baseline or Waiver period).16 If children stayed in care until the end of the period, the study team identified the highest level of care to which they transferred. For example, if a child entered a group home and stayed in a group home, the study team counted that as a lateral move or “same level placement.” A child who entered a group home and then went to and remained in a foster home would be counted as a move to a foster home.
The Year 2 analysis, presented in Table 5.5, showed that demonstration counties excluding the large urban counties were able to “step down” 61-71 percent of their children before the Waiver, and that changed little during the first 2 years of the Waiver. The percentages were similar in the comparison counties. Thus, both groups had about the same rate of success in moving children into more family-like settings before and during the Waiver.
15 “Nonlicensed nonrelative” includes family friends, godparents, etc. In Ohio, county staff refer to this as
“kinship placement.” “Nonlicensed nonrelative” was chosen to distinguish this category from nonlicensed relative and the modern connotation of kinship.
16 The baseline for Year 2 measures included FFY 1995 to FFY 1996, allowing a comparison against the first 2 years with or the Waiver FFY 1997 to FFY 1998.
Page 148 Fifth Annual Report--Chapter 5

Summary: The Year 2 and Year 4 analyses showed that, overall, the demonstration counties did not reduce their use of costly group and residential treatment center placements for children. Both groups had about the same rate of success in moving children into more family-like settings before and during the Waiver. This is consistent with the fiscal findings in Section 4.3.3.
5.6 CHILD SAFETY OUTCOMES
A fundamental goal of child welfare is to prevent further maltreatment of children who have been reported to protective services. Activities to reduce placement costs must not jeopardize children’s safety. Children in custody should not be returned home too quickly nor should supervision be removed too quickly from families receiving ongoing services. Recurrent maltreatment is an indicator of how well a child welfare system is performing, although a recidivism rate of zero may indicate that the child welfare agency is too reluctant to return children home. Determining an acceptable level of recidivism is ultimately a local and state responsibility.
This section summarizes significant findings on recidivism in targeted cases (those cases with indicated or substantiated incidents, or those identified with moderate to high risk); recidivism in closed cases; re-entry after reunification; and runaway. Finally, it reviews trends in counties’ use of in-home vs. placement services (a child and family well-being outcome in Table 1.3). In this context, the study team viewed serving a family in-home, rather than removing the child, as an enhancement to child and family well-being.
5.6.1 Recidivism among Targeted Children
As the demonstration counties integrated new Waiver services and organizational/cultural changes, were they able to maintain the same level of success at helping children and families and avoiding recidivism – i.e., preventing families from returning in a new incident? In the Year 3 analysis, the base for the recidivism rate included all targeted children in incidents for the first time. “Targeted children” were those children in indicated or substantiated incidents and children in incidents identified with moderate to high risk.17 The study team looked to see whether these children returned in a second incident targeted for services within 6 months.18 All incidents were included, regardless 17 As discussed in the Third Annual Report, the study team designed a method to identify as “targeted” all
children classified with either indicated/substantiated reports or being at higher risk under the case resolution rubric. The purpose was to provide a consistent categorization of all children, since during the Waiver the counties made a major procedural change in risk assessment methodology and the recording of risk levels in FACSIS.
18 It is possible that the recidivism rate within 6 months was confounded by different counties’ practices in recording separate referrals as separate incidents. If a county recorded two incidents when there were two referrals about the same occurrence, the study team counted the second referral as a recidivistic victim in our calculations, even if the two referrals were within a few days.
Page 149 Fifth Annual Report--Chapter 5
of the place of abuse or neglect. It included cases both open and closed at the time of the new and subsequent incidents. While these measures do not control for case mix or changes in the population, the results do suggest that safety was not compromised by the Waiver.19
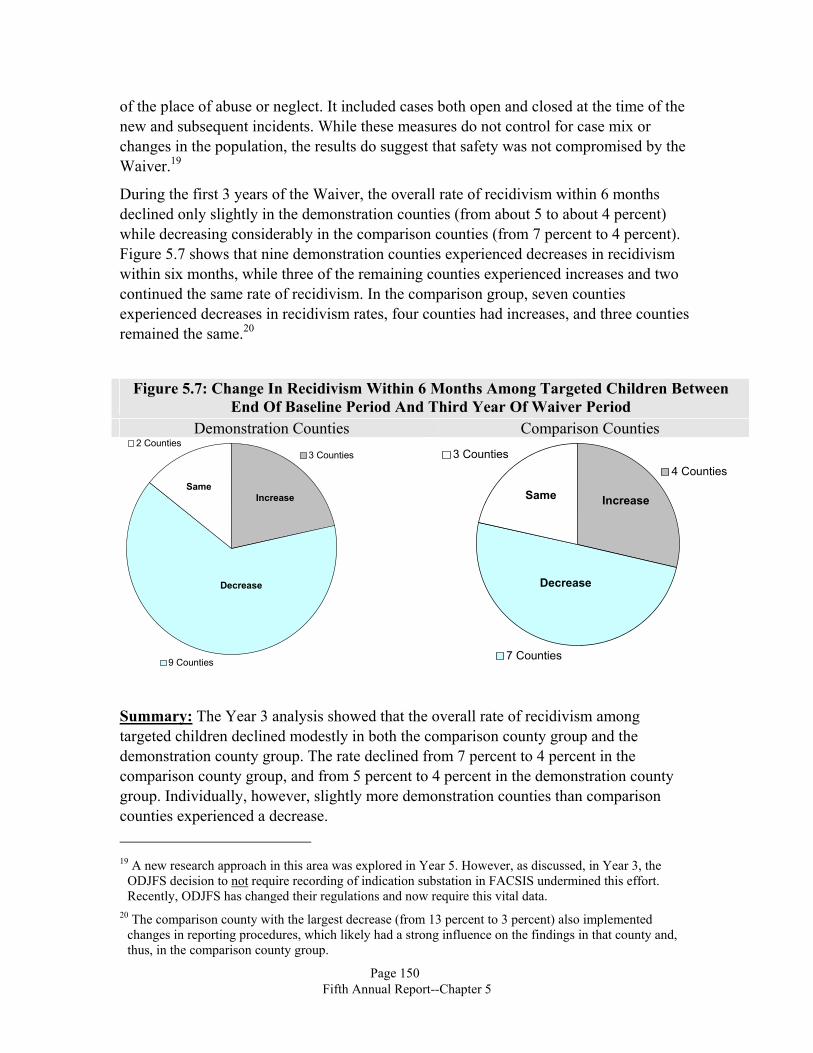
During the first 3 years of the Waiver, the overall rate of recidivism within 6 months declined only slightly in the demonstration counties (from about 5 to about 4 percent) while decreasing considerably in the comparison counties (from 7 percent to 4 percent). Figure 5.7 shows that nine demonstration counties experienced decreases in recidivism within six months, while three of the remaining counties experienced increases and two continued the same rate of recidivism. In the comparison group, seven counties experienced decreases in recidivism rates, four counties had increases, and three counties remained the same.20
Figure 5.7: Change In Recidivism Within 6 Months Among Targeted Children Between End Of Baseline Period And Third Year Of Waiver Period
Demonstration Counties Comparison Counties
7 Counties
4 Counties3 Counties
Increase
Decrease
Same
9 Counties
3 Counties2 Counties
Increase
Decrease
Same
Summary: The Year 3 analysis showed that the overall rate of recidivism among targeted children declined modestly in both the comparison county group and the demonstration county group. The rate declined from 7 percent to 4 percent in the comparison county group, and from 5 percent to 4 percent in the demonstration county group. Individually, however, slightly more demonstration counties than comparison counties experienced a decrease. 19 A new research approach in this area was explored in Year 5. However, as discussed, in Year 3, the
ODJFS decision to not require recording of indication substation in FACSIS undermined this effort. Recently, ODJFS has changed their regulations and now require this vital data.
20 The comparison county with the largest decrease (from 13 percent to 3 percent) also implemented changes in reporting procedures, which likely had a strong influence on the findings in that county and, thus, in the comparison county group.
Page 150 Fifth Annual Report--Chapter 5
5.6.2 Recidivism in Closed Cases
Are cases being closed too quickly, putting children at risk? A second measure looks at the percentage of cases that were closed where children became victims at a later date. The study team identified children in all closed cases during each period, then looked to see whether the child appeared in a new targeted incident.
In the Year 3 analysis, the study team observed a decrease in overall 6-month recidivism rates of children in closed cases in the comparison group, and no change in the demonstration group during the Waiver period. The demonstration counties remained about the same, dropping from a 9 percent recidivism rate in the second year of the baseline period to an 8 percent recidivism rate in the third year of the Waiver period. In contrast, the study team observed a substantial drop in the comparison counties between the end of the baseline and the third year of the Waiver period (from 10 percent in FFY1997 to 6 percent in FFY2000).
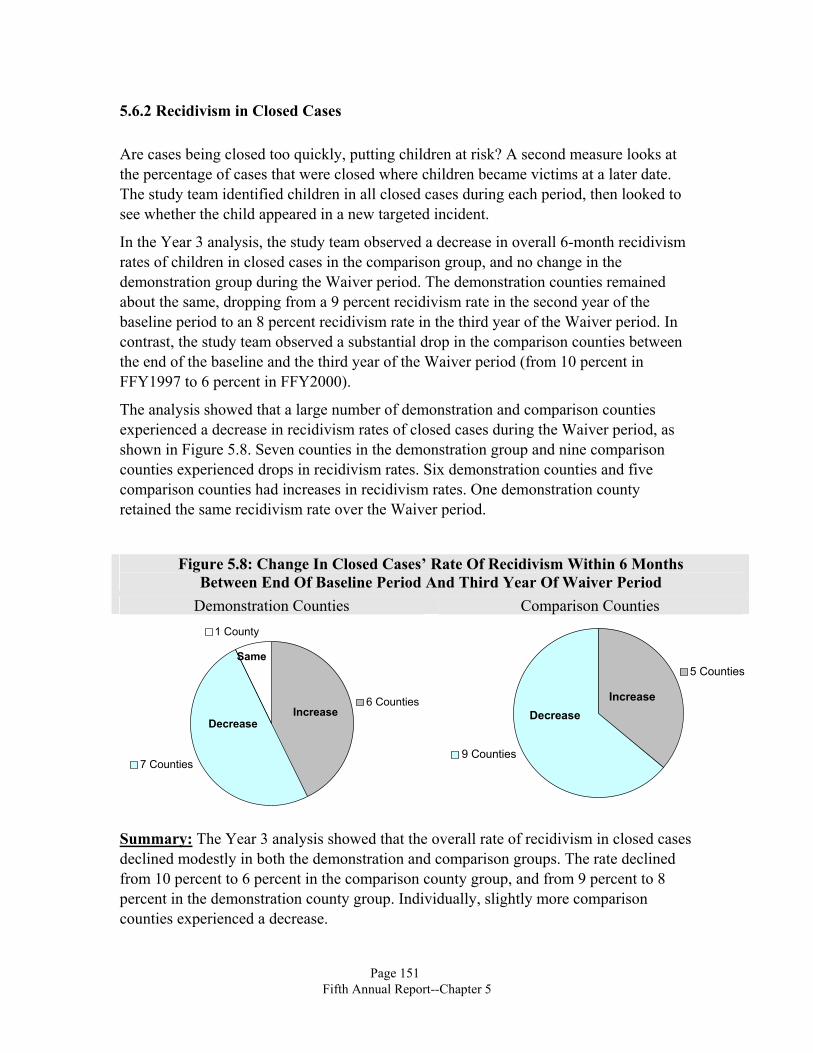
The analysis showed that a large number of demonstration and comparison counties experienced a decrease in recidivism rates of closed cases during the Waiver period, as shown in Figure 5.8. Seven counties in the demonstration group and nine comparison counties experienced drops in recidivism rates. Six demonstration counties and five comparison counties had increases in recidivism rates. One demonstration county retained the same recidivism rate over the Waiver period.
Figure 5.8: Change In Closed Cases’ Rate Of Recidivism Within 6 Months Between End Of Baseline Period And Third Year Of Waiver Period
Demonstration Counties Comparison Counties
5 Counties
9 Counties
IncreaseDecrease
7 Counties
6 Counties
1 County
IncreaseDecrease
Same
Summary: The Year 3 analysis showed that the overall rate of recidivism in closed cases declined modestly in both the demonstration and comparison groups. The rate declined from 10 percent to 6 percent in the comparison county group, and from 9 percent to 8 percent in the demonstration county group. Individually, slightly more comparison counties experienced a decrease.
Page 151 Fifth Annual Report--Chapter 5

5.6.3 Re-Entry from Reunification
Reunification with family is a permanent and successful outcome, as long as the child remains with the family thereafter and experiences no further maltreatment. In Year 4, the study team explored what happened after a child was reunified with family. Results showed that overall more than 36 percent of these children re-entered placement. The question addressed was: Did the Waiver have an impact on the re-entry rate?
The re-entry model focused on identifying any effects of the Waiver on the length of time a reunified child remains reunified before re-entering a second foster care placement. In contrast to other Year 4 models that took into account the child and case characteristics at the time of first placement, it was considered that, for re-entry, case characteristics at the time of exit from the first placement would be equally important and should be added to the analysis. The analysis showed that there was no significant Waiver effect on the rate of re-entry after reunification.21
Summary: When taking into account case characteristics through the model, the differences were not statistically significant. Thus, the study team did not detect any significant Waiver effect on the 36 percent rate of re-entry after reunification, when case-mix features were taken into account.
5.6.4 Runaway
Although running away is not a permanency option, it is a possible method for a child to exit placement, especially older children in group and residential facilities. A child who ran away from a placement and did not return for 30 days was documented in FACSIS as a placement that ended through the runaway event. If the child returned to PCSA care after that time, then the FACSIS system would show that a second placement episode had begun. This analysis included only the children in first placement who were age 10 and older when placed.
Children run away for individual reasons: expressing anger, rebelling, or just trying to get home. Running away was a rare occurrence, representing fewer than 2 percent of all children exiting care after the first placement episode, but nearly 3 percent of children 10 or older. Despite its rarity, from the evaluation perspective, it is a definitive placement failure; that is, it is clear that the setting did not match the needs of the child.
In the Year 4 analysis, once variation in case mix was controlled, strong evidence emerged for a Waiver effect on overall time to runaway. The daily rate of runaways was
21 Year 5 findings on Waiver effects on re-entry after reunification are presented in the next chapter, and
support the Year 4 findings.
Page 152 Fifth Annual Report--Chapter 5
Page 153 Fifth Annual Report--Chapter 5
133 percent larger for children age 10 and older in demonstration counties than it would have been without the Waiver.22
Summary: The Year 4 analysis found that the Waiver significantly increased the overall daily rate of runaways.
5.6.5 Use of In-Home vs. Placement Services
The premise of the Waiver’s cost-neutrality is that counties can reduce placements and reinvest the savings in other services. Thus, a decrease in the number of children placed in foster care, an objective of the project, would translate into an increase in the number of cases receiving in-home services, in order to maintain the children safely in their homes.
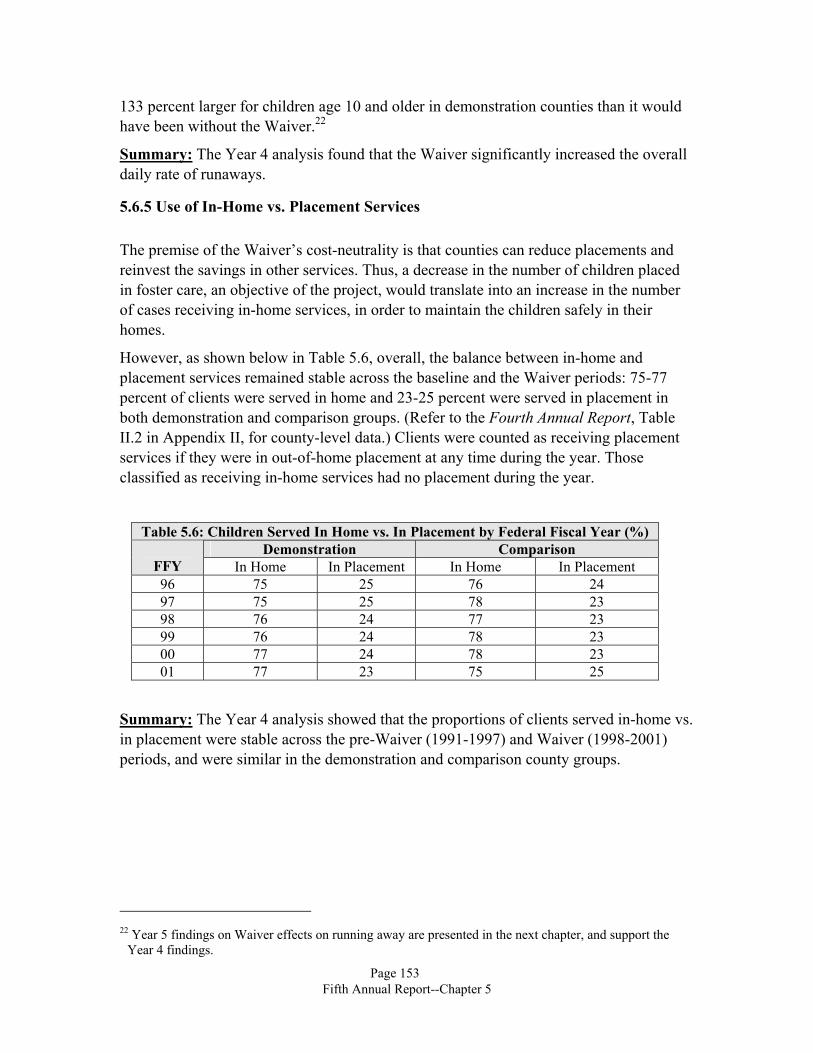
However, as shown below in Table 5.6, overall, the balance between in-home and placement services remained stable across the baseline and the Waiver periods: 75-77 percent of clients were served in home and 23-25 percent were served in placement in both demonstration and comparison groups. (Refer to the Fourth Annual Report, Table II.2 in Appendix II, for county-level data.) Clients were counted as receiving placement services if they were in out-of-home placement at any time during the year. Those classified as receiving in-home services had no placement during the year.
Table 5.6: Children Served In Home vs. In Placement by Federal Fiscal Year (%)
Demonstration Comparison FFY In Home In Placement In Home In Placement 96 75 25 76 24 97 75 25 78 23 98 76 24 77 23 99 76 24 78 23 00 77 24 78 23 01 77 23 75 25
Summary: The Year 4 analysis showed that the proportions of clients served in-home vs. in placement were stable across the pre-Waiver (1991-1997) and Waiver (1998-2001) periods, and were similar in the demonstration and comparison county groups.
22 Year 5 findings on Waiver effects on running away are presented in the next chapter, and support the
Year 4 findings.