chapter 5...production value continued to slide even after 2010 until signs of recovery finally...
TRANSCRIPT

1. Economic size of the ICT industry(1) Market size (domestic production value)⃝ ICT industry market accounted for about 9.6 percent of all industries,
making it the largest industryThe ICT industry’s market size in 2016 was 94.4 tril-
lion yen (based on nominal domestic production value), accounting for 9.6 percent of all industries and making it the largest industry in the country (Figure 5-1-1-1). Looking at the industry’s performance over time finds that its production value cooled off for several years af-ter 2000 in response to the collapse of the IT bubble. The industry entered positive growth territory again starting in 2005, but its production value plummeted between 2008 and 2009 due to the global financial crisis. ICT’s production value continued to slide even after 2010 until signs of recovery finally started to appear in the years after 2013. After it rose to 96.4 trillion yen in 2015, it de-creased to 94.4 trillion yen in 2016 (Figure 5-1-1-2).
Looking at the transitions in market size (based on real domestic production ) of the main industries in con-
stant 2011 values reveals that the ICT industry fell down by the 2008 – 2009 global financial crisis to 91.3 trillion yen in 2012 but trended gradual upward after 2013 and recovered to 98.2 trillion yen in 2015 (Figure 5-1-1-2). The ICT industry’s market size (based on real domestic production) in 2016 was 96.6 trillion yen. The industry’s average annual growth rate from 2000 to 2016 was 0.7 percent.
(2) Gross domestic product (GDP)⃝ The real GDP of the ICT industry in 2016 is 45.4 trillion yen accounting
for 9.4 percent of all industriesThe nominal GDP of the ICT industry rose in 2016 by
0.5 percent year-on-year to 43.6 trillion yen. Conversely, the real GDP of the ICT industry in constant 2011 values increased 0.3 percent year-on-year in 2016 to 45.4 trillion yen. (Figure 5-1-1-3).
Looking at the size of nominal GDP of the main indus-tries finds that the ICT industry’s nominal GDP accounts
Section 1 ICT Industry Trends
Nominal market size of all industries
(2016) 982.7 trillion
ICT industry94.49.6%
ICT industry94.49.6%
Commerce91.29.3%
Commerce91.29.3%
Real estate74.17.5%
Real estate74.17.5%
Medical, health care and welfare
70.57.2%
Medical, health care and welfare
70.57.2%
Construction65.56.7%
Construction65.56.7%
Business services61.56.3%
Transportation equipment
55.85.7%
Personal services52.15.3%
Other industries417.642.5%
Other industries417.642.5%
(Unit: trillion yen)Figure 5-1-1-1 Market sizes of major industries (based on nominal domestic production) (breakdown) (2016)
(Source) “Study on Economic Analysis of ICT,” MIC (2018)
54
Chap
ter 5
Chapter 5Basic Data on the ICT Field

for 8.7 percent of the combined nominal GDPs of all in-dustries and is the third largest after the ‘commerce’ and ‘real estate’ industry. The growth rate of the ICT indus-try in terms of nominal GDP bounded to plus 0.5 percent over 2015 and 2016. Examining the real GDPs of the main industries finds that the ICT industry’s real GDP in 2016 accounts for 9.4 percent of all industries, making it the third largest industries following ‘commerce’ and
‘real estate’ industries (Figure 5-1-1-4).
(3) Employment⃝ ICT industry employment totaled 3.949 million in 2016 accounting for
5.8 percent of total employment in all industriesThe ICT industry employed 3.949 million people in
2016 (down 0.1 percent from the previous year), ac-counting for 5.8 percent of total employment in all indus-
(Source) “Study on Economic Analysis of ICT,” MIC (2018)
Figure 5-1-1-2 Transitions in market sizes of major industries (based on nominal domestic production and real domestic production)
116,627116,627
94,39194,391
010,00020,00030,00040,00050,00060,00070,00080,00090,000
100,000110,000120,000
2000 2001 2002 2003 2004 2005 2006 2007 2008 2009 2010 2011 2012 2013 2014 2015 2016
(in billions of yen)【Nominal domestic production】 【Real domestic production】
(year)
86,97486,97496,59496,594
010,00020,00030,00040,00050,00060,00070,00080,00090,000
100,000110,000120,000
2000 2001 2002 2003 2004 2005 2006 2007 2008 2009 2010 2011 2012 2013 2014 2015 2016
(in billions of yen, 2011 values)
(year)
Medical, health care and welfareCommerce Real estateBusiness services
ConstructionICT industryTransportation equipment Personal services
Figure 5-1-1-3 Transitions in the nominal GDP and real GDP of major industries
(Source) “Study on Economic Analysis of ICT,” MIC (2018)
【Nominal GDP】 【Real GDP】
(year)2000 2001 2002 2003 2004 2005 2006 2007 2008 2009 2010 2011 2012 2013 2014 2015 2016
43,62943,629
0
10,000
20,000
30,000
40,000
50,000
60,000
70,000
80,000(in billions of yen)
(year)2000 2001 2002 2003 2004 2005 2006 2007 2008 2009 2010 2011 2012 2013 2014 2015 2016
45,38045,380
53,36053,360
30,55230,552
0
10,000
20,000
30,000
40,000
50,000
60,000
70,000
80,000(in billions of yen,2011 values)
Medical, health care and welfareCommerce Real estateBusiness services
ConstructionICT industryTransportation equipment Personal services
(Source) “Study on Economic Analysis of ICT,” MIC (2018)
Figure 5-1-1-4 Nominal GDP and real GDP of major industries【Nominal GDP】 【Real GDP】
Nominal GDP of all industries
(2016)504.2 trillion yen
Nominal GDP of all industries
(2016)504.2 trillion yen
Nominal GDP of all industries
(2016)504.2 trillion yen
ICTindustry
43.68.7%
ICTindustry
43.68.7%
ICTindustry
43.68.7%
Commerce59.9
11.9%
Commerce59.9
11.9%
Commerce59.9
11.9%
Real estate58.7
11.6%
Real estate58.7
11.6%
Real estate58.7
11.6%
Medical, health care and welfare
42.18.3%
Medical, health care and welfare
42.18.3%
Constrution30.56.0%
Constrution30.56.0%
Constrution30.56.0%Business services
40.48.0%
Business services40.48.0%
Business services40.48.0%
Transportation equipment
11.42.3%
Transportation equipment
11.42.3%
Transportation equipment
11.42.3%
Personal services
28.25.6%
Personal services
28.25.6%
Personal services
28.25.6%
Other industry189.537.6%
Other industry189.537.6%
Other industry189.537.6%
Real GDP of all Industries
(2016)(2011value)
480.4 trillion yen
ICTindustry
45.49.4%
ICTindustry
45.49.4%
ICTindustry
45.49.4%
Commerce60.7
12.6%
Commerce60.7
12.6%
Commerce60.7
12.6%
Real estate60.1
12.5%
Real estate60.1
12.5%
Real estate60.1
12.5%
Medical, health care and welfare
38.98.1%
Constrution30.36.3%
Business services38.28.0%
Transportation equipment
9.72.0%
Personalservices
27.05.6%
Otherindustries
170.235.4%
Otherindustries
170.235.4%
Otherindustries
170.235.4%
(Unit: trillion yen) (Unit: trillion yen)
55
Chap
ter 5

tries. Employment increased by 5.7 percent from 2015 in the communications sector, by 1.0 percent in the infor-mation services sector, and by 5.8 percent in the Inter-
net-related services sector. However, employment in other sectors in the ICT industry decreased respectively (Figure 5-1-1-5).
2. ICT industry contributions to the national economy(1) ICT industry’s economic spillover effects⃝ The ICT industry contributes to large economic spillover effects of all
industries in terms of added valueThe ICT industry’s real domestic production in 2016
was 96.6 trillion yen. The industry’s economic spillover effects,22 were estimated to be 82.1 trillion yen in in-duced added value and 8.237 million in induced jobs. By
comparison, in 2000 the ICT industry’s real domestic production value was 87 trillion yen, which contributed 73.8 trillion yen in induced added value and 9.925 million in induced jobs. Since technological innovation has a large impact on the ICT industry, the industry is be-lieved to be a stronger driver of added value than em-ployment (Figure 5-1-2-1).
Figure 5-1-2-1 Transitions in economic spillover effects (induced added value and jobs) from major industries’ production ac-tivities
(Source) “Study on Economic Analysis of ICT,” MIC (2018)
ICT industry Commerce Real estateConstruction
Medical, health care and welfarePersonal serviceBusiness service Transportation equipment
(year)
73.880.2
81.4 80.983.0
82.1
0
20
40
60
80
100
120
2000 2005 2011 2014 2015 2016
(in trillions of yen)
(year)2000 2005 2011 2014 2015 2016
992.5914.0
863.4 825.3 829.9 823.7
0200400600800
1,0001,2001,4001,6001,800(tens of thousands of jobs)
【Induced added value】 【Induced jobs】
22 There are two methods of calculating economic spillover effects: (1) calculating the economic spillover effects for all Japan’s industries brought about by each industry sector’s final demand, focusing on the goods and services that constitute the industry sector’s final demand and (2) calculating the economic spillover effects for all Japan’s industries brought about by each industry sector’s production activities (total of final demand and intermediate demand), focusing on the industry sector itself. The latter method was used here.
(Source) “Study on Economic Analysis of ICT,” MIC (2018)
Figure 5-1-1-5 Transitions of employment in ICT industry
0
500
1,000
1,500
2,000
2,500
3,000
3,500
4,000
4,500
5,000
2000 2001 2002 2003 2004 2005 2006 2007 2008 2009 2010 2011 2012 2013 2014 2015 2016
(thousands of jobs)
(year)
ICT-related manufacturingVideo, audio and text information productionBroadcasting
Internet-related servicesICT-related services
Communications Information services
ICT-related construction Research
4,7434,7434,5314,531
4,1944,194 4,1394,139 4,1644,164 4,1564,156 4,2014,201 4,1874,187 4,2034,203 4,1184,118 4,0104,010 3,9493,949 3,9033,903 4,0214,021 3,9783,978 3,9523,952 3,9493,949
56
Chap
ter 5

3. Research and development in the ICT field(1) Research and development spending⃝ The ICT industry23 spent 3.6715 trillion yen on research in FY 2016,
accounting for 27.6 percent of all corporate research spendingAccording to the “2017 Research Investigation Report
on Science and Technology”, Japan’s total scientific and technological research spending (i.e., research spend-ing) in FY 2016 stood at 18.4326 trillion yen (the com-bined research spending by enterprises, nonprofit orga-nizations, public agencies, universities, etc.).
Corporate research spending, which accounts for about 70 percent of all research spending, was 13.3183 trillion yen. Of this amount, 3.6715 trillion yen (27.6 per-cent) was spent on research by the ICT industry. The ICT equipment and appliance manufacturing segment was the largest research spender in the ICT industry
(Figure 5-1-3-1).
(2) Technology trading⃝ The ICT industry posted a surplus in technology exports24 in FY 2016
The value received from Japan’s technology exports in FY 2016 totaled 3.5719 trillion yen, to which the ICT industry contributed 467.1 billion yen, or 13.1 percent. On the other side, the costs of technology imports was 452.9 billion yen, of which the ICT industry paid out 178.8 billion yen, or 39.5 percent. Both total and the ICT industry posted export surpluses in technology trading.
The ICT equipment and appliance manufacturing seg-ment accounted for the largest share of the ICT indus-try’s technology imports and exports (Figure 5-1-3-2).
23 ICT industry here refers to the ICT equipment and appliance manufacturing segment, the electrical equipment and appliance manufacturing segment, the electronic component, device, and circuitry manufacturing segment, and the information and communications segment (includ-ing the information services, communications, broadcasting, Internet-related services, and other ICT sectors).
24 The value of technology trade is the equivalent value received from the provision (export) of patents, knowledge, technical direction, and other forms of technology transfers to other countries or the equivalent value paid the reception (import) of the same forms of technology transfers from other countries.
Figure 5-1-3-1 Breakdown of corporate research spending by industry (FY 2016)
(Source) Prepared from the “2017 Research Investigation Report on Science and Technology,” MIC
ICT equipment and appliance manufacturing
1.357210.2%
Electrical equipment and appliance manufacturing
1.12118.4%
Electronic component, device, and circuitrymanufacturing
0.60754.6%
Communications0.33722.5%Information services
0.24131.8%
Internet-related and other ICT services
0.00630.0%
Broadcasting0.00080.0%
Total for other manufacturing
industries8.488962.5%
Total for other manufacturing
industries8.488962.5%
Total for other industries1.15798.7%
(corporate reseach spending: 13.3183 trillion yen)(Unit: trillion yen)
Figure 5-1-3-2 Technology trading by industry (FY 2016)
(Source) Prepared from the “2017 Research Investigation Report on Science and Technology,” MIC
ICT equipment and appliance manufacturing
252.9 7.1%
Electrical equipment and appliance manufacturing
164.6 4.6%
Electronic component, device, and circuitry
manufacturing20.2 0.6%
Information and communications
29.4 0.8%
Total for other manufacturing industries
3,040.185.1%
Total for other manufacturing industries
3,040.185.1%
Total for other manufacturing industries
3,040.185.1%
Total for other industries
64.81.8%
Value of technology exports(all industries: 3.5719 trillion yen)
ICT equipment and appliance manufacturing
86.0 19.0%
ICT equipment and appliance manufacturing
86.0 19.0%
ICT equipment and appliance manufacturing
86.0 19.0%
Electrical equipment and appliance manufacturing
24.4 5.4%
Electronic component, device, and
circuitry manufacturing
3.50.8%
Information and communications
64.914.3%
Information and communications
64.914.3%
Information and communications
64.914.3%
Total for other manufacturing
industries251.755.6%
Total for other manufacturing
industries251.755.6%
Total for other manufacturing
industries251.755.6%
Total for other industries
22.4 4.9%
Value of technology imports(all industries: 452.9 billion yen)
(Unit: billion yen) (Unit: billion yen)
57
Chap
ter 5

(3) Number of researchers⃝ The ICT industry employed 166,334 researchers, or 34.0 percent of all
corporate researchers in JapanThere were 853,704 researchers in Japan on March
31, 2017 (the total of all researchers at enterprises, non-profit organizations, public agencies, universities, etc.).
Enterprises employed 488,828 researchers, or about 60 percent of the total. The ICT industry employed 166,334 researchers, or 34.0 percent of all corporate researchers in Japan. The ICT equipment and appliance manufactur-ing segment had the most researchers of any ICT indus-try sector (Figure 5-1-3-3).
Figure 5-1-3-3 Corporate researchers by industry (as of March 31, 2017)
(Source) Prepared from the “2017 Research Investigation Report on Science and Technology,” MIC
ICT equipment and appliance manufacturing
72,48414.8%
ICT equipment and appliance manufacturing
72,48414.8%
Electrical equipment and appliance manufacturing
38,040 7.8%
Electronic component, device, and circuitry
manufacturing29,413
6.0%Information services
19,997 4.1%
Communications5,953 1.2%
Internet-related and other ICT services
410 0.1%
Total for other manufacturing
industries286,80758.7%
Total for other manufacturing
industries286,80758.7%
Total for other
industries35,6877.3%
Total for other
industries35,6877.3%
(corporate researchers in all industries: 488,828)
Broadcasting37
0.0%
(Unit: people)
4. State of ICT enterprise operationsThe Basic Survey on the Information and Communi-
cations Industry is a general statistical survey (started in 2010) that MIC and the Ministry of Economy, Trade and Industry jointly conduct under the Statistics Act (Law No. 53 of 2007) to clarify the operations of enter-prises belonging to the ICT industry — a Large Catego-ry G in the Japan Standard Industry Classification — and to obtain basic data for ICT industry policies. The following sections provide an overview of the 2017 sur-vey that pertains to enterprises operations.
(1) Summary of enterprises engaging in ICT business operations (activity-base results)
a. General summary of the survey results⃝ 5,519 enterprises were engaged in ICT business operations with sales
in excess of 48 trillion yenSales attributed to ICT business operations in FY 2016
totaled 48.0099 trillion yen (total sales by all enterprises were 71.9756 trillion yen). By sector, the telecommuni-cations sector accounted for 35.1 percent of all sales (up 0.5 percentage points from the previous year), the soft-ware sector 31.0 percent (down 0.5 points), and the in-formation processing services sector 12.1 percent (up 0.4 points) (Figure 5-1-4-1).
The number of enterprises engaging in ICT business
Figure 5-1-4-1 ICT industry sales
Telecommunicationservice operators
(356)168,49135.1%
Telecommunicationservice operators
(356)168,49135.1%
Software service providers (2,930)
148,96631.0%
Software service providers (2,930)
148,96631.0%
Internet-related service providers (687)
30,2616.3%
Private broadcasters (374)23,599
4.9%
Newspaper companies (125)
14,251 3.0%
Publication companies (351)
10,853 2.3%
Film makers and distributors (451)
9,060 1.9%
Cable broadcasting service providers (218)
5,299 1.1%
Advertising agencies (144)
3,3150.7%
Audio program producers (113)
1,8010.4%
Service providers related to video, audio, or text information (158)
1,331 0.3%
Miscellaneous communication service providers
4,8941.0%
Sales in the ICT industriesFY2016
48.0099 trillion yen
Information processing service providers (1,776)
57,97812.1%
Figures in parentheses are the number of companies
(Unit: 100s of millions of yen)
(Note) “Miscellaneous communication service providers” refers to enterprises that selected “other” as the primary business in the breakdown of sales attributable to ICT business operations.
(Source) “2017 Basic Survey on the Information and Communications Industry,” MIC / METI
58
Chap
ter 5

operations (irrespective of whether ICT business opera-tions are the enterprise’s mainstay operations) stood at 5,519. Operating profits were 6.1015 trillion yen, ordi-nary income was 6.4894 trillion yen, and the enterprises held 10,842 subsidiaries and associated companies.
b. Breakdown of sales⃝ Enterprises capitalized at less than 100 million yen accounted for more
than 50 percent of all enterprises in 8 of the 12 ICT industry sectorsA breakdown of ICT industry enterprises by capital
size discovers that enterprises capitalized at less than 100 million yen accounted for more than 50 percent of all enterprises in 8 of the 12 ICT industry sectors. Of par-ticular note is the video information production and dis-tribution sector and the audio information production sector, where enterprises capitalized at less than 50 mil-lion yen accounted for more than 40 percent of all enter-prises in the respective sectors (Figure 5-1-4-2).
5. Telecommunication market trends(1) Market size⃝ Mobile communications accounted for more than 50 percent of sales in
the telecommunications sector, while, by service category, the data transmission services’ share is increasing year by yearSales in the telecommunications sector in FY 2016
were 14.1862 trillion yen (an increase of 1.1 percent from the previous year) (Figure 5-1-5-1). Fixed-line communi-cations accounted for 31.4 percent of all sales in FY 2016,
and mobile communications for 51.4 percent (Figure 5-1-5-2). Looking at sales by service category finds voice transmission services accounted for 26.1 percent and data transmission services for 56.8 percent (Figure 5-1-5-3). The average revenue per user (ARPU) among the main mobile communication service providers was 4,680 yen for NTT docomo, 6,500 yen for KDDI, and 4,350 yen for SoftBank (Figure 5-1-5-4).
(Note) Comparisons must be made with caution, as sales represent the simple sum of figures from all responding carriers and the number of respond-ing carriers differs from year to year.
(Source) Prepared from “2017 Basic Survey on the Information and Communications Industry,” MIC / METI
Figure 5-1-5-1 Transitions in telecommunications sector sales
132,713132,713 129,551129,551 136,384136,384 136,904136,904 140,342140,342 141,862141,862
0
20,000
40,000
60,000
80,000
100,000
120,000
140,000
160,000
2011 2012 2013 2014 2015 2016 (FY)
(in 100s of millions of yen)
(Source) “2017 Basic Survey on the Information and Communications Industry,” MIC / METI
Figure 5-1-4-2 Breakdown of ICT industry enterprises by capital size28.4
13.8
24.3
11.9
29.9
26.5
16.7
42.6
44.2
31.2
30.2
34.0
29.1
52.5
31.3
17.4
15.5
12.8
35.3
33.4
26.8
25.1
24.8
28.0
37.9
40.3
39.9
23.5
19.7
20.5
22.2
17.4
18.9
20.8
23.3
14.0
12.4
24.0
15.7
13.9
20.9
8.4
8.9
19.4
16.0
25.7
7.4
8.8
12.8
9.3
9.7
9.6
8.3
8.3
6.3
8.7
3.2
4.5
5.6
5.0
2.5
3.6
6.7
1.8
3.5
4.0
2.8
2.1
1.3
1.8
5.9
16.9
13.1
22.0
4.1
4.7
9.2
6.0
2.7
3.2
3.4
0.7
1.3
4.7
1.1
2.0
2.1
2.3
0.6
1.0
2.8
0.7
1.8
-
1.1-
0.6
-
1.4
5.6
1.1
2.8
1.3
1.2
1.7
0.7
0.9
-
0.6
0.7
0.6
0.30 10 20 30 40 50 60 70 80 90 100
Total (5,519)Telecommunication
service operators (356)Private broadcasters (374)
Cable broadcasting service providers (218)Software service providers (2,930)
Information processingservice providers (1,776)
Internet-related service providers (687)Film makers and distributors (451)
Audio program producers (113)Newspaper companies (125)Publication companies (351)
Advertising agencies (144)Service providers related to video,
audio, or text information (158)TV / radio program producers
(included in other results)
Less than 50 million yen 50 million yen to less than 100 million yen 100 million yen to less than 300 million yen300 million yen to less than 500 million yen 500 million yen to less than 1 billion yen 1 billion yen to less than 5 billion yen5 billion yen to less than 10 billion yen 10 billion yen or more
(%)
59
Chap
ter 5

Figure 5-1-5-2 Telecom carriers’ sales breakdown by fixed-line communications and mobile communications
(Note) Calculating excluding sales breakdown "Unknown"(Source) Prepared from “2017 Basic Survey on the Information and Communications Industry,” MIC / METI
Fixed-linecommunications
31.4%
Fixed-linecommunications
31.4%
Mobilecommunications
51.4%
Mobilecommunications
51.4%
Other17.1%Other17.1%
(Note) Calculating excluding sales breakdown "Unknown"(Source) Prepared from “2017 Basic Survey on the Information and Communications Industry,” MIC / METI
Figure 5-1-5-3 Telecom carriers’ sales breakdown by voice transmission and data transmission
Voicetransmission
26.1%
Voicetransmission
26.1%
Datatransmission
56.8%
Datatransmission
56.8%
Others17.1%Others17.1%
Figure 5-1-5-4 Transitions in mobile ARPU in the past five years for 3 domestic mobile operators
(Notes) * Each company’s ARPU is calculated and released based on the respective company’s criteria. The figures were not calculated using the same method.
*Due to rounding, the total of individual ARPU figures may not equal the total ARPU figures.*NTT docomo includes Smart ARPU, KDDI includes value added ARPU, and SoftBank includes service ARPU.* The ARPU figures for KDDI after FY 2012 were taken from au Communications ARPU under the personal segment. Applied discount amounts were subtracted from the voice ARPU.
*SoftBank ARPU figures included communication modules until FY 2011.*SoftBank Mobile took over SoftBank BB, SoftBank Telecom, and Y!Mobile on April 1, 2015 (name changed to SoftBank on July 1, 2015).*NTT docomo’s and KDDI’s ARPU in FY15 are monthly sales per user.
(Source) Prepared from financial statements from each company
1,370 1,180 1,210 1,250 940 7801,520
2,6402,600
2,960 3,1803,210 3,450
2,9305,690 5,830
4,230 4,150 3,8003,950
490 590290 320
440510
540550
4,5004,500 4,3704,3704,1704,170
4,4304,430 4,4904,490 4,5504,550
6,1306,1306,3406,340
4,4504,4504,2304,230
4,7004,7004,5004,500
1,370
3,310 5,910
590
560
4,6804,680
6,5006,500
4,3504,350
0
1,000
2,000
3,000
4,000
5,000
6,000
7,000
FY13 FY14 FY15 FY16 FY17FY13 FY14 FY15 FY16 FY17FY13 FY14 FY15 FY16 FY17NTTdocomo KDDI (au) SoftBank
(yen per month)
Data ARPU Other ARPUVoice ARPU Voice ARPU + Data ARPU
60
Chap
ter 5

6. Broadcasting market trends(1) Size of the broadcasting marketa. Broadcaster sales⃝ Broadcaster sales totaled 3. 9312 trillion yen in FY 2016
Japanese broadcasters are divided into 2 categories: Japan Broadcasting Corp., a public broadcaster known as NHK, which depends on reception fee revenues, and private broadcasters that depend on advertisements or paid programming. Apart from these categories, the Open University of Japan provides broadcasting servic-es for educational purposes.
The entire broadcasting sector’s sales, including rev-enues from broadcasting and non-broadcasting opera-tions, increased since FY 2015 and to 3.9312 trillion yen
(by 0.4 percent up from the previous year) in FY2016. By category, terrestrial-based private broadcasters’ sales were 2. 3773 trillion yen (up 1.3 percent from the previ-ous year), satellite-based private broadcasters’ sales were 346.3 billion yen (down 9.1 percent from the previ-ous year), cable TV broadcasters’ sales were 503.1 bil-lion yen (up 0.6 percent from the previous year), and NHK’s ordinary operating income was 704.5 billion yen (up 2.4 percent from the previous year).
In terms of market share, terrestrial-based private broadcasters accounted for 73.7 percent (up 1.0 percent-age points from the previous year) of private broadcast-ers’ sales. (Figure 5-1-6-1).
7. Content market trends(1) Size of Japan’s content market⃝ The Japanese content market was valued at 11.6986 trillion yen, over 50
percent of which was attributable to video content, less than 40 percent to text-based content, and less than 10 percent to audio-based contentThe Japanese content market was valued at 11.6986
trillion yen in 2016. By content segment, video content accounted for 55.7 percent of the market, text-based con-tent, 37.3 percent, and audio-based content, 7.0 per-cent.25 (Figure 5-1-7-1).
The overall size of the content market has been in-
Figure 5-1-6-1 Transitions in and breakdown of the broadcasting sector market size (total sales)
38,356 39,698 40,152 40,422 41,17839,689
38,254 39,089 39,115 38,915 39,307 38,759 39,152 39,312
0
5,000
10,000
15,000
20,000
25,000
30,000
35,000
40,000
45,000
2003 2004 2005 2006 2007 2008 2009 2010 2011 2012 2013 2014 2015 2016 (FY)
(100s of millions of yen)
Satellite-basedbroadcasters※1 NHK※3Terrestrial-basedbroadcasters Cable TV broadcasters※2
(※1) Figures for satellite-based broadcasters represent operating revenues from satellite-based broadcasting services.(※2) Cable TV broadcasters until FY 2010 were business enterprises providing independent broadcasting services with facilities licensed under the
former licensing scheme under the former Act on Cable Television Broadcasting. (Note that facilities registered under the former Act on Broad-cast on Telecommunications Services included those that use the same broadcasting method as facilities licensed under the former licensing scheme). From FY 2011 on, cable TV broadcasters were registered general broadcasting enterprises with wired telecommunication facilities providing independent broadcasting services. (Both exclude business operators using IP multicasts.)
(※3) Figures for NHK represent ordinary operating income.(※4) Community broadcasting operators that also provide cable TV broadcasting services are excluded.
(Source) Prepared from MIC materials and the “NHK financial statements” for each fiscal year
fiscal year 2003 2004 2005 2006 2007 2008 2009 2010 2011 2012 2013 2014 2015 2016
privatebroadcaster
Terrestrial-basedbroadcasters 25,229 26,153 26,138 26,091 25,847 24,493 22,574 22,655 22,502 22,870 23,216 23,375 23,461 23,773
Community broadcasters included in total above※4
141 140 140 144 148 150 123 116 120 115 124 127 126 136
Satellite-basedbroadcasters※1 2,995 3,158 3,414 3,525 3,737 3,905 3,887 4,185 4,490 4,510 4,491 3,661 3,809 3,463
Cable TV broadcasters※2 3,330 3,533 3,850 4,050 4,746 4,667 5,134 5,437 5,177 4,931 5,030 4,975 5,003 5,031NHK※3 6,803 6,855 6,749 6,756 6,848 6,624 6,659 6,812 6,946 6,604 6,570 6,748 6,879 7,045total 38,356 39,698 40,152 40,422 41,178 39,689 38,254 39,089 39,115 38,915 39,307 38,759 39,152 39,312
( )
25 The market size was measured and analyzed by assessing the primary nature of the content works and recalculating the value at each distribu-tion level, such as primary distribution or multiuse. The value of content was not calculated by media channel.
61
Chap
ter 5

creasing since 2012. The size of each content segment as well stayed flat by 2012, after 2013 the video content segment expanded while the text-based content seg-ment contracted (Figure 5-1-7-2).
(2) Trends in the online content market⃝ The market for online content, which is via the Internet to computers
or mobile phones, was 3.2904 trillion yen, accounting for 28.1 percent of the entire content marketAs part of the overall content market, the market for
online content, which is via the Internet to computers or mobile phones, reached 3.2904 trillion yen, which ex-ceeded 3 trillion yen for the first time. By content seg-ment, the video content segment accounted for 58.6 per-cent of the online content market, the text-based content segment, 29.8 percent, and the audio-based content seg-ment, 11.6 percent. (Figure 5-1-7-3).
The online content market has been growing steadily since 2012. The market by content segment shows that the video content segment, which more than doubled from 2012 to 2016 in particular due to the hot game soft-ware portion increase, has been driving the online con-tent’s market expansion (Figure 5-1-7-4).
(3) Trends in the broadcast content market⃝ Export value of Japanese broadcast content was 39.35 billion yen in FY
2016The export value of Japanese broadcast content in FY
2016 was 39.35 billion yen (Figure 5-1-7-5). Looking at the composition of the export value of Japanese broad-cast content, ‘program broadcast rights’ (31.4%) and ‘merchandising rights’ (32.7%) accounts for the majority, and ’Internet distribution rights’ (26.9%) is the next. ’Format and restaging rights’ (5.3%) holds a certain
Figure 5-1-7-1 Breakdown of Japan’s content market (2016)
(Source) “Survey on the Production and Distribution of Media Content,” Institute for Information and Communications Policy, MIC
Video content segment
6.5187 trillion yen55.7%
Movies755.76.5% Videos
417.63.6%
Terrestrial TV programs2806.524.0%
Satellite and cable TV broadcast programs909.17.8%
Game software1391.911.9%
Original Internet videos237.82.0%
Music598.95.1%
Radio programs208.21.8%
Original Internet audio-based content
11.90.1%
Newspaper articles1579.513.5%
Comics416.43.6%
Magazines1008.1
8.6%Books834.17.1%
Database information278.02.4%
Original Internet other content
244.72.1%
total content market
11.6986 trillion yen
Audio-based content segment
0.8191 trillion yen7.0%
Text based content segment
4.3608 trillion yen37.3%
(Unit: billion yen)
(Source) “Survey on the Production and Distribution of Media Content,” Institute for Information and Communications Policy, MIC
Figure 5-1-7-2 Transitions in Japan’s content market size (by content segment)
5.6 6.0 6.2 6.3 6.5
0.8 0.8 0.8 0.7 0.8
4.8 4.5 4.5 4.5 4.4
11.2 11.3 11.5 11.5 11.7
0
2
4
6
8
10
12
2012 2013 2014 2015 2016
(trillions of yen)
(year)
Videocontent segment
Audio-based content segment
Text-based content segment
62
Chap
ter 5

Figure 5-1-7-3 Breakdown of the online content market (2016)
(Source) “Survey on the Production and Distribution of Media Content,” Institute for Information and Communications Policy, MIC
Video content segment
1.929trillion yen58.6%
Voice-based content segment0.3811trillion yen
11.6%
Tex-based content segment0.9804trillion yen
29.8%
Game software1128.634.3%
Original Internet videos237.87.2%
Videos224.06.8%
Movies201.46.1%
Terrestrial TVprograms53.21.6%
Satellite and cable TV broadcast programs
83.92.5%
Music357.210.9%
Other audio-based
content23.90.7%
Original Internet other content
244.77.4%
Original Internet other content
244.77.4%
Database information
232.07.1%
Books203.96.2%
Newspaper articles167.45.1%
Other text-based content132.44.0%
Total digital content market
3.2904 trillion yen
(billion yen)
(Source) “Survey on the Production and Distribution of Media Content,” Institute for Information and Communications Policy, MIC
Figure 5-1-7-4 Transitions in the online content market size (by content segment)
Video content Audio-based content Text-based content
0.91.3
1.6 1.7 1.90.4
0.30.3 0.3
0.4
0.80.7
0.81.0
1.0
2.12.3
2.73.0
3.3
0.0
0.5
1.0
1.5
2.0
2.5
3.0
3.5
2012 2013 2014 2015 2016
(trillion yen)
(year)
(Notes) * Export value of broadcast content: total export value of program broadcast rights, Internet distribution rights, video and DVD rights, format and restaging rights, merchandising rights, and similar rights.
* Calculated based on the questionnaire responses by NHK, main commercial broadcast stations, production, sub-main commercial broadcast stations in Osaka, local stations and satellite broadcasting stations.
* Calculation of FY 2016 was changed in that survey sheet questionnaire was changed from the FY 2015 survey and calculated by including digital gaming rights in merchandising rights.
(Source) “Survey on the State of Overseas Expansion of Broadcast Content (FY 2016),” MIC
Figure 5-1-7-5 Export value of Japanese broadcast content
0
50
100
150
200
250
300
400
350
2012 2013 2014 20162015
(in 100s of million of yen)
(FY)
104.3137.8
182.5
288.5
393.5
63
Chap
ter 5
1. Internet usage trends(1) State of ICT device ownershipa. State of major ICT device ownership (households)⃝ Ownership of smartphones exceeds that of computers
The household ICT device ownership rate of 2017 was 94.8 percent for ‘mobile terminals26’ and 72.5 percent for ‘computers’. The rate for ‘smartphones’, which are in-cluded in ‘mobile terminals’ category, increased to 75.1 percent (up 3.3 percentage points from a year earlier), exceeding the households ownership rates of “comput-ers” (Figure 5-2-1-1).
(2) State of Internet usagea. Internet usage rate (personal)⃝ The usage of Internet via smartphone exceeds the usage via computers
The Internet usage rate (personal) was 80.9 percent
(Figure 5-2-1-2). Those using smartphones to access the Internet accounted for 59.7 percent of all Internet users, which is the highest and exceeded 52.5 percent for com-puters (Figure 5-2-1-3).
b. Purposes of using the Internet⃝ “Sending and receiving emails” was the most common purpose of us-
ing the InternetWhile among all age groups, the most common pur-
pose of using the Internet was “sending and receiving emails”, the number of users varies by age groups for “using social media,” and “using video posting / sharing sites” (Figure 5-2-1-4).
Section 2 ICT Service Usage Trends
scale. Looking at the value of the export of Japanese broadcast content by entity, 49.0% is by “NHK and main commercial broadcast stations”, “production etc.” is 45.2%, “sub-main commercial broadcast stations in Osa-ka” is 5.2%, “local stations” is 0.5% and “satellite broad-casting stations” is 0.3%. In the export value of program selling rights (total of program broadcast rights, Inter-net distribution rights and video and DVD rights), ratio of “production” is lower.
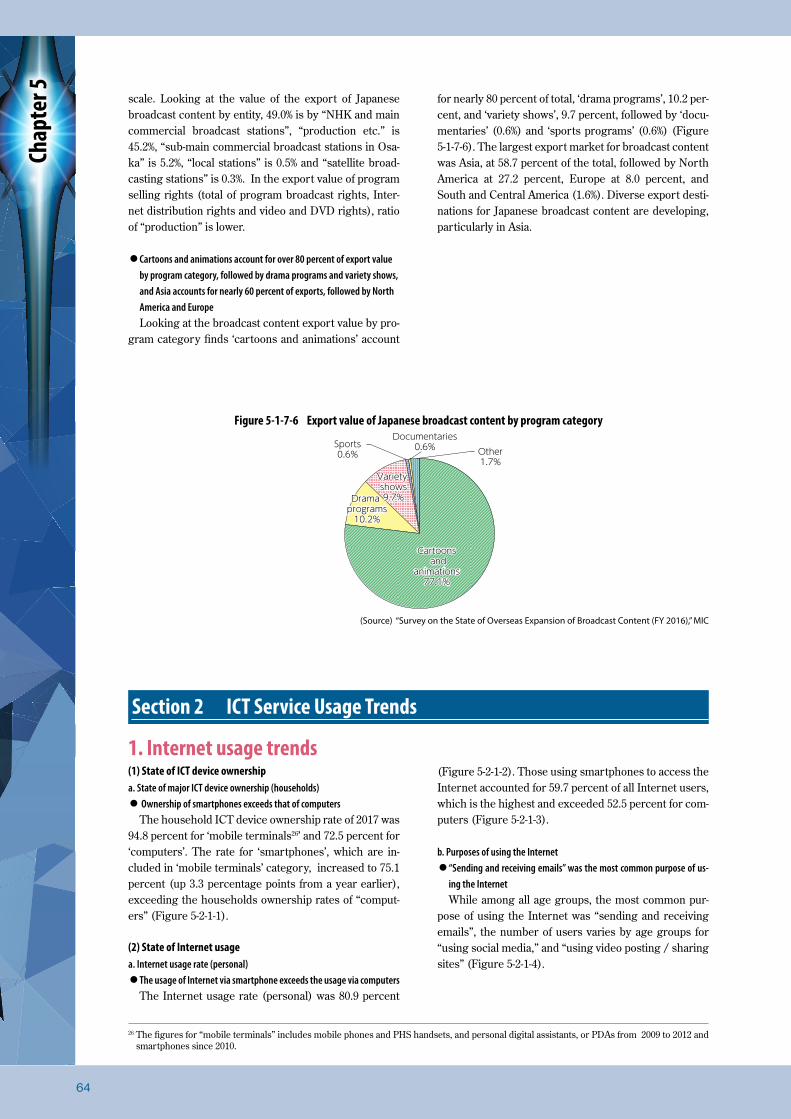
⃝ Cartoons and animations account for over 80 percent of export value by program category, followed by drama programs and variety shows, and Asia accounts for nearly 60 percent of exports, followed by North America and EuropeLooking at the broadcast content export value by pro-
gram category finds ‘cartoons and animations’ account
for nearly 80 percent of total, ‘drama programs’, 10.2 per-cent, and ‘variety shows’, 9.7 percent, followed by ‘docu-mentaries’ (0.6%) and ‘sports programs’ (0.6%) (Figure 5-1-7-6). The largest export market for broadcast content was Asia, at 58.7 percent of the total, followed by North America at 27.2 percent, Europe at 8.0 percent, and South and Central America (1.6%). Diverse export desti-nations for Japanese broadcast content are developing, particularly in Asia.
26 The figures for “mobile terminals” includes mobile phones and PHS handsets, and personal digital assistants, or PDAs from 2009 to 2012 and smartphones since 2010.
Figure 5-1-7-6 Export value of Japanese broadcast content by program category
(Source) “Survey on the State of Overseas Expansion of Broadcast Content (FY 2016),” MIC
Other1.7%
Documentaries0.6%Sports
0.6%
Variety shows9.7%
Variety shows9.7%Drama
programs10.2%
Drama programs
10.2%
Cartoons and
animations77.1%
Cartoons and
animations77.1%
64
Chap
ter 5
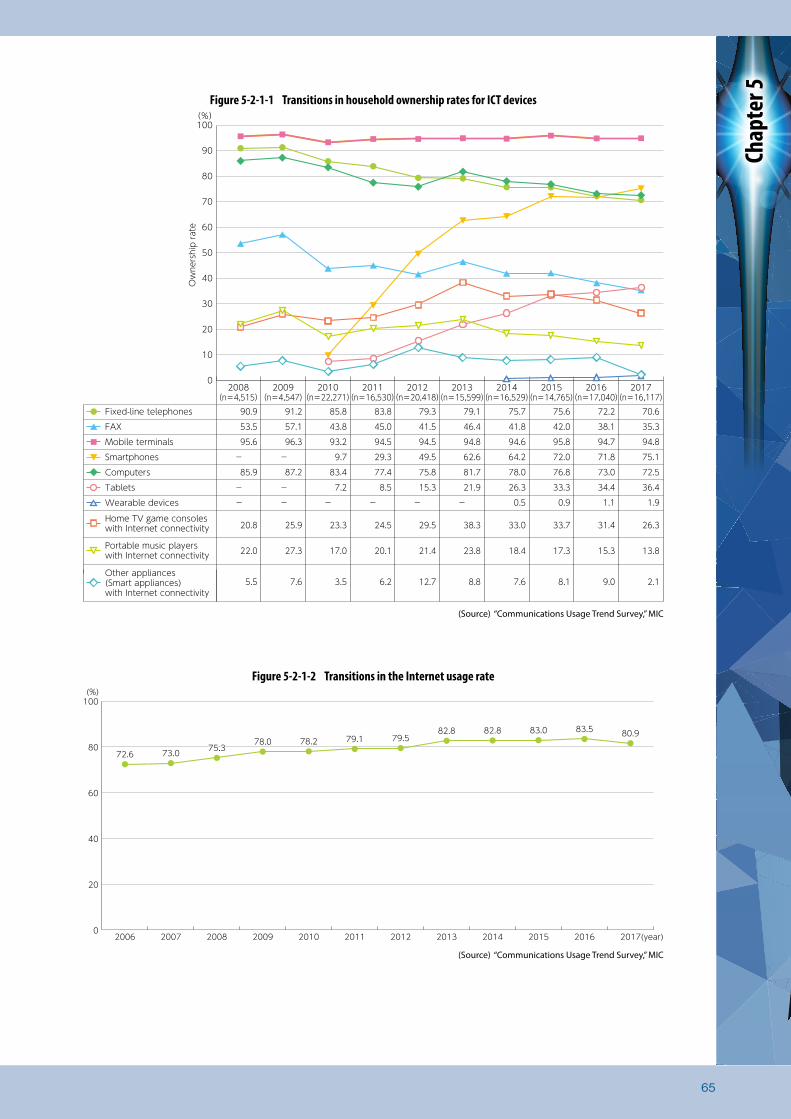
Figure 5-2-1-1 Transitions in household ownership rates for ICT devices
(Source) “Communications Usage Trend Survey,” MIC
Fixed-line telephones 90.9 91.2 85.8 83.8 79.3 79.1 75.7 75.6 72.2 70.6FAX 53.5 57.1 43.8 45.0 41.5 46.4 41.8 42.0 38.1 35.3Mobile terminals 95.6 96.3 93.2 94.5 94.5 94.8 94.6 95.8 94.7 94.8Smartphones 9.7 29.3 49.5 62.6 64.2 72.0 71.8 75.1Computers 85.9 87.2 83.4 77.4 75.8 81.7 78.0 76.8 73.0 72.5Tablets 7.2-
- -
--- - - - -
8.5 15.3 21.9 26.3 33.3 34.4 36.4Wearable devices 0.5 0.9 1.1 1.9
20.8 25.9 23.3 24.5 29.5 38.3 33.0 33.7 31.4 26.3
22.0 27.3 17.0 20.1 21.4 23.8 18.4 17.3 15.3 13.8
5.5 7.6 3.5 6.2 12.7 8.8 7.6 8.1 9.0 2.1
0
10
20
30
40
50
60
70
80
90
100(%)
2008(n=4,515)
2009(n=4,547)
2010(n=22,271)
2011(n=16,530)
2012(n=20,418)
2013(n=15,599)
2014(n=16,529)
2015(n=14,765)
2016(n=17,040)
2017(n=16,117)
Other appliances (Smart appliances) with Internet connectivity
Portable music players with Internet connectivity
Home TV game consoles with Internet connectivity
Ow
ners
hip
rate
Figure 5-2-1-2 Transitions in the Internet usage rate
(Source) “Communications Usage Trend Survey,” MIC
72.6 73.0 75.375.378.0 78.2 79.1 79.5
82.8 82.8 83.0 83.5 80.9
0
20
40
60
80
100
2006 2007 2008 2009 2010 2011 2012 2013 2014 2015 2016 2017
(%)
(year)
65
Chap
ter 5

(3) Challenges for secure Internet usagea. Matters of concern with Internet usage and problems with ICT
networks usage⃝ Individuals are concerned about personal information exposure, and
enterprises are concerned about virus infectionsThe percentage of individuals who feel insecure with
the Internet usage which includes respondents of total of “insecure” and “somewhat insecure” reached 66.8 per-cent, about 70 percent feel insecure (Figure 5-2-1-5). Among matters of concerns about using the Internet, 89.5 percent cited of “external disclosure or exposure of per-sonal information or Internet usage histories without per-mission” as a concern. This was followed, in order, by “computer virus infections” (69.6 percent) and “unsolicit-ed email” (53.5 percent) (Figure 5-2-1-6). Among enter-prises, 47.4 percent, the highest response rate, mentioned “concern about virus infections” as a problem when using the ICT networks (the Internet and internal LANs) (Fig-ure 5-2-1-7).
b. Information security measures⃝ Almost 70 percent of households and almost all of enterprises have
implemented some form of information security measuresLooking at the state of information security measures
taken by households that use the Internet finds that 65.4 percent of households have taken some form of informa-tion security measures. The leading security measures were “install or update security software” (46.2 percent) and “sign up for or renew a security service” (25.4 per-cent) (Figure 5-2-1-8).
Looking at the state of information security measures implemented by enterprises that use ICT networks finds that 99.3 percent of enterprises have implemented some form of information security measures, which represents almost all the enterprises. The leading security measure was “install anti-virus programs on computers and other devices (operating systems, software, etc.),” which is done by 88.9 percent of enterprises. This was followed, in order, by “install anti-virus programs on servers” (66.5 percent) and “train employees” (57.6 percent). (Figure 5-2-1-9).
Figure 5-2-1-3 Internet usage device by category
(Note) Figures indicate the percentage of people who accessed the Internet using the corresponding device during the past one year.(Source) “Communications Usage Trend Survey,” MIC
59.7
52.5
20.9
9.9
8.8
7.2
57.9
58.6
23.6
13.3
9.2
6.8
0 20 40 60 80
Smartphones
Computers
Tablets
Home game consoles withInternet connectivity
Televisions withInternet connectivity
(%)
Mobile phones andPHS handsets
(excluding smartphones)
2017(n=38,630) 2016(n=40,297)
Figure 5-2-1-4 Applications / purposes of using the Internet by age group (multiple answers)
(Source) “Communications Usage Trend Survey,” MIC
0
20
40
60
80
100(%)
Usin
g e-
lear
ning
Send
ing
and
rece
ivin
g em
ails
Brow
sing,
pos
ting,
cre
atin
g an
d up
datin
g w
ebsit
es a
nd b
logs
Usin
g so
cial
med
ia
Usin
g fre
e vo
ice
call
apps
or v
oice
cha
t site
s
Usin
g vi
deo
post
ing
/ s
harin
g sit
es
Usin
g on
line
gam
es
Parti
cipa
ting
in q
uiz
/ pr
ize c
ompe
titio
ns o
r que
stio
nnai
res
Map
or t
rans
porta
tion
info
rmat
ion
serv
ices
(fre
e of
cha
rge)
Usin
g w
eath
er fo
reca
sts
(fre
e of
cha
rge)
Usin
g ne
ws
sites
Usin
g di
ctio
narie
s an
d e
ncy c
lope
dias
Purc
hasin
g or
trad
ing
goo
ds a
nd s
ervi
ces
(tota
l)
Usin
g e-
gove
rnm
ent
and
e-lo
cal
gov
ernm
ent s
ervi
ces
Purc
hasin
g or
trad
ing
good
s an
d s
ervi
ces
(exc
ludi
ng d
igita
l con
tent
pur
chas
es a
nd fi
nanc
ial t
rans
actio
ns)
Purc
hasin
g or
trad
ing
dig
ital c
onte
nt
finan
cial
tran
sact
ions
Inte
rnet
auc
tions
Usin
g on
-dem
and
stre
amin
g s
ervi
ces
for r
adio
, TV
prog
ram
s, m
ovie
s, et
c.
total 13~19 (n=2,177) 20~29 (n=3,093) 30~39 (n=4,130)40~49 (n=5,145) 50~59 (n=5,159) 60 or older (n=7,362)
66
Chap
ter 5

Figure 5-2-1-5 Percentage of individuals to feel insecure with Internet usage (multiple answers permitted)
(Source) “Communications Usage Trend Survey,” MIC
(Unit: %)
2017year (n=3,645)
feel insecure24.8
feel insecure24.8
somewhat feel insecure
42.0
somewhat feel insecure
42.0
somewhat do not
feel insecure20.2
somewhat do not
feel insecure20.2
do not feel insecure
12.9
do not feel insecure
12.9
Figure 5-2-1-6 Matters of concern with Internet usage
(Source) “Communications Usage Trend Survey,” MIC
89.5
69.6
49.2
33.2
23.5
14.2
11.8
2.3
87.8
67.4
51.551.6
53.547.7
46.4
31.0
23.5
13.8
10.1
2.4
0 20 40 60 80 100External disclosure or exposure of
personal information or Internet usage history without permission
Computer virus infections
Unsolicited email
security measures
Trustworthiness of electronic paymentsBrowsing illegal and harmful information
Conflict with communication partners
Internet addiction
Others
False billing and other types ofInternet fraud
(%)
2016 year(n=2,578)2017 year (n=2,477)
(Source) “Communications Usage Trend Survey,” MIC
Figure 5-2-1-7 Problems with ICT network usage at enterprises (multiple answers permitted)
47.4
40.9
39.1
37.3
34.7
26.8
12.9
12.4
9.6
8.9
4.3
3.7
3.4
2.6
11.0
48.8
36.8
38.2
41.3
32.8
25.2
11.8
8.9
6.8
9.4
3.1
4.3
2.4
2.2
12.7
0 10 20 30 40 50Concern about virus infections
Difficult to develop security measures
Operational and management cost increases
Operational and management personnel shortages
Low security awareness among employees
Difficult to recover from failures, outages, etc.
Difficult to quantify benefits
High communication charges
Low communication speeds
Difficult to obtain benefitsConcern about protection of
copyrights and intellectual propertyConcern about trustworthiness
of electronic paymentsConcern about trustworthiness
of authentication technologyOthers
No particular problems
(%)
2017 year (n=2,527) 2016 year(n=1,963)
67
Chap
ter 5

(4) Cloud service usage trends of enterprisesa. State of cloud service usage⃝ The percentage of enterprises using cloud services significantly rose
from 201656.9 percent of enterprises answered they had used
cloud services either partially or extensively, which sig-nificantly rose from 46.9 percent from the previous year. (Figure 5-2-1-10)
b. Effectiveness of cloud services⃝ Many enterprises recognized the effectiveness of cloud services
Among enterprises using cloud services, 85.2 percent responded “very effective” or “somewhat effective”. Many enterprises recognized the effectiveness (Figure 5-2-1-11).
Figure 5-2-1-8 Implementation of information security measures at households (multiple answers permitted)
(Source) “Communications Usage Trend Survey,” MIC
0 20 40 60 80(%)
65.4
22.8
11.8
46.2
25.4
23.1
18.0
2.5
67.7
22.3
10.0
47.7
24.6
22.6
17.9
2.6
Implemented measures
Have not implemented measures
Don’t know whether measureshave been taken
Install or update security software
Sign up for or renew a security service
Do not connect to untrusted Internet connections
Set passwords on devices
Set administrator and check
2016 year (n=1,892)2017 year (n=1,776)
(Source) “Communications Usage Trend Survey,” MIC
Figure 5-2-1-9 Implementation of information security measures at enterprises (multiple answers permitted)
0.7
22.0
19.8
18.9
11.1
29.3
99.3
88.9
66.5
48.2
44.2
41.2
34.2
26.3
1.6
98.4
88.2
66.8
53.755.3
57.650.5
46.1
39.9
37.0
34.0
23.4
19.6
18.5
17.1
10.5
28.3
0 20 40 60 80 100
Implemented measures
Have not implemented measures
Install anti-virus programs on servers
Control access with IDs and passwords
Train employees
Set up and deploy firewalls
Apply operating system security patches
Establish security policies
Retain access logs
Construct virus walls for external connections
Use proxies (proxy servers)
Encrypt data and networks
Audit security measures
13.315.1
Authenticate users with authentication technology
17.414.9Monitor access lines15.8
14.1
12.713.2Establish anti-virus response manuals
15.012.2Outsource security management
Set up and deploy Web application firewalls
Other measures
(%)
2016 year (n=2,014)2017 year (n=2,554)
Install anti-virus programs on computers and other devices (operating systems, software, etc.)
Set up and deploy intrusion detection systems (IDS) or intrusion protection systems (IPS)
68
Chap
ter 5

c. Breakdown of cloud service usage⃝ The most frequently used cloud service is “file storage and data shar-
ing”The most frequently used cloud service is “file stor-
age and data sharing” cited by 51.2 percent of respon-dents, followed, in order, by 47.6 percent for “server us-age” and 46.3 percent for “emails” (Figure 5-2-1-12).
Figure 5-2-1-10 State of cloud service usage
(Source) “Communications Usage Trend Survey,” MIC
29.4
24.4
22.8
20.7
15.0
27.5
22.5
21.7
18.0
18.0
13.4
14.5
15.0
15.9
17.5
22.1
29.3
30.0
32.2
34.4
7.6
9.3
10.4
13.1
15.0
0 20 40 60 80 100 (%)
Use company wide Use at some sales locations and divisions Do not use presently, but plan to use in the futureDo not use presently and have no plan to use in the future Do not fully understand cloud services
56.9
46.9
44.6
38.7
33.1
2017 year(n=2,570)
2016 year(n=2,071)
2015 year(n=1,821)
2014 year(n=2,098)
2013 year(n=2,183)
Figure 5-2-1-11 Effectiveness of cloud services
(Source) “Communications Usage Trend Survey,” MIC
negatively effective0.4%
not effective1.0%
very effective30.9%
very effective30.9%
somewhat effective54.3%
somewhat effective54.3%
uncertain13.3%
uncertain13.3%
2017 year(n=1,550)
Figure 5-2-1-12 Breakdown of cloud service usage
(Source) “Communications Usage Trend Survey,” MIC
51.2
47.6
46.3
37.7
34.4
34.1
27.1
14.5
12.3
10.4
9.2
8.6
7.9
7.7
6.8
5.6
4.7
1.6
7.5
50.7
46.7
51.7
38.4
27.0
38.3
26.4
14.8
12.2
8.3
8.2
7.0
8.6
7.8
7.2
5.0
4.9
1.2
7.4
0 10 20 30 40 50 60
File storage and data sharing
Server usage
Internal informaition sharing / portals
Data backups
Schedule sharing
Marketing assistance
Payrolls, financial accounting, HR
Sharing information with trading partners
Project management
Production, distribution, and retali-outlet management
Purchasing
Order-taking and sales
Billing and payment systems
Authentication systems
Research and development
Other uses
(%)
2016 year (n=960)2017 year (n=1,571)
e-Learning
System development and Website construction
69
Chap
ter 5

2. State of telecommunication service provision and usage(1) State of provision a. Overview(i) Subscriptions to voice communication services⃝ Subscriptions to fixed-line communications are trending downward
while subscriptions to mobile communications and 0ABJ-IP phone ser-vices have increased steadilySubscriptions to fixed-line communication services
(including NTT East and West subscriber telephone ser-vices (including ISDN), non-NTT telephone services,27
and cable TV-based telephone services but excluding 0ABJ-IP phone services) have been declining, while those to mobile communication services (mobile phone and PHS handset services) and 0ABJ-IP phone services have been growing steadily. Subscriptions to 050-IP phone services have been flat in recent years.
There were about 8.1 times more mobile communica-tion subscriptions than fixed-line communication sub-scriptions (Figure 5-2-2-1).
(ii) State of broadband usage⃝ Subscriptions to mobile ultra-high-speed broadband services have
leaped dramatically year by yearThe number of subscriptions to fixed-line broadband
services28 at the end of FY 2017 stood at 39.35 million (up 1.9 percent from the previous year). Subscriptions to mobile ultra-high-speed broadband services was 120.73 million for 3.9G and 4G (LTE) services (up 17.3 percent) and 58.22 million for BWA services (up 21.6
percent) (Figure 5-2-2-2). Trends of the net increase in the number of subscriptions to FTTH and DSL shows that DSL continues to decrease while FTTH continues to increase.
b. Mobile communications⃝ Subscriptions to mobile communication services have risen each year;
subscriptions to MVNO services counted as mobile communication sub-scriptions also surgedSubscriptions to mobile communication services29
(mobile phones, PHS handsets, and BWA) at the end of FY 2017 totaled 173.57 million (an increase of 3.4 per-cent from the previous year). The net growth compared to end of FY2016 was 5.70 million subscriptions, which continues the upward trend (Figure 5-2-2-3).
The carrier (Group) shares by mobile communication subscription were 38.7 percent for NTT docomo (down 1.1 percentage points from the previous year), 27.6 per-cent for the KDDI Group (up 0.8 percentage points), and 23.1 percent for the SoftBank Group (down 0.8 percent-age points) (Figure 5-2-2-4). The carrier (Group) shares by MVNO services were 5.3 percent for NTT docomo MVNO (up 0.5 percentage points from the previous year), 2.8 percent for the KDDI Group MVNO (up 0.2 percentage points), and 2.4 percent for the SoftBank Group (up 0.3 percentage points)
Subscriptions to MVNO services30 in the subscrip-tions to mobile communication services (mobile phones,
27 Non-NTT services are subscriber phone services provided by telecom carriers other than NTT East and West and cover direct subscriber telephone and ISDN services and new-type non-NTT telephone and ISDN services.
28 Figures for subscriptions to fixed-line broadband services cover FTTH, DSL, cable TV, and FWA services.29 Figures after adjusting for internal group transactions.30 Figures after subtracting subscriptions to MVNOs that are MNOs.
Figure 5-2-2-1 Transitions in subscriptions to voice communication services
(Notes) *Subscriptions to mobile communication services cover mobile phone, PHS services and BWA.* Figures for mobile communication services from FY 2013 forward are the figures ‘after adjusting for internal group transactions’. ‘After adjusting for internal group transactions’ refers the adjustments made to count 1 mobile phone device as 1 contract and not 2 contracts so as not to diverge from the actual state, when an MNO receives mobile phone or BWA services as an MVNO from another MNO in the same group and provides these services together with its own services to 1 mobile phone device.
*Figures of the past years are different from those in the last year’s publication due to amendments by the target enterprises. (Source) Prepared from “Announcement of Quarterly Data on Telecommunication Service Contracts and Market Shares
(4Q of FY 2017 (March 31, 2018)),” MIC
5,515 5,123 4,732
4,334 3,957 3,596 3,274 3,004
2,774 2,507 2,298
10,170 10,734 11,205 11,63012,329
13,50714,644 14,919
15,633 16,17516,787
421 776
1,116 1,453 1,790 2,0962,407 2,650
2,846 3,075 3,241
1,027 978
906 864 790 753 721 728 718 771 854
2,135
17,357
3,359
8850
2,000
4,000
6,000
8,000
10,000
12,000
14,000
16,000
18,000
2006 2007 2008 2009 2010 2011 2012 2013 2014 2015 2016 2017
(tens of thousands subscriptions)
(FY)
Fixed-line communications Mobile communications 0ABJ-IP phone services 050-IP phone services
70
Chap
ter 5

PHS handsets, and BWA) continue to increase, reaching 18.40 million (an increase of 16.0 percent from the FY 2016). (Figure 5-2-2-5)
(2) State of telecommunication usagea. State of traffic(i) Internet traffic⃝ Total download traffic by broadband service subscribers in Japan
reached an average of 10.8 Tbps as of November 2017, 31.6 percent increase from the same month of a year ago
(a) Transitions in traffic by broadband subscribersTraffic by ISP531 broadband service subscribers con-
tinues to grow, with download traffic (A1 OUT) reaching a monthly average of 4,359.2 Gbps in November 2017 (28.3 percent increase from the same month a year ago). Download traffic (A1 OUT) widened its gap with upload traffic (A1 IN: 597.1 Gbps), from 5.6 times last fiscal year to 7.3 times. Thus, most traffic is download traffic (Fig-ure 5-2-2-6).(b) Transitions in traffic exchanged between ISPs
The traffic exchanged with major domestic internet exchanges (IX)s (B1), the traffic exchanged with do-
31 ISP5 is the total for five cooperating ISPs, namely the Internet Initiative Japan (IIJ), NTT Communications, K-Opticom, KDDI, and SoftBank.
Figure 5-2-2-2 Transitions in broadband service subscriptions
*Figures of the past years are different from those in the last year’s publication due to amendments by the target enterprises. (Source) Prepared from “Announcement of Quarterly Data on Telecommunication Service Contracts and Market Shares
(4Q of FY 2017 (March 31, 2018)),” MIC
2,022 2,230 2,382 2,527 2,656 2,782 2,925
820 670 542 447 375 320 251567 591 601 623 643 673 6851 1 1 1 1 1 13,4103,410 3,4933,493 3,5263,526 3,5973,597 3,6753,675 3,7763,776 3,8623,862
3,030
215
6891
3,9353,935
0
500
1,000
1,500
2,000
2,500
3,000
3,500
4,000
4,500
2010 2011 2012 2013 2014 2015 2016 2017
(tens of thousands of sbuscriptions)
FWACATVDSLFTTH
81 230 531 746
1,947
3,514
4,789
3 230
2,037
4,641
6,778
8,747
10,294
5,822
12,073
0
2,000
4,000
6,000
8,000
10,000
12,000
2010 2011 2012 2013 2014 2015 2016 2017
(tens of thousands of subscriptions)
BWA LTE
(end of FY) (end of FY)
【Fixed-line broadband services】 【Mobile ultra-high-speed broadband services】
Figure 5-2-2-3 Transitions in mobile phone subscriptions
*(Note) ‘After adjusting for internal group transactions’ refers the adjustments made to count 1 mobile phone device as 1 contract and not 2 contracts so as not to diverge from the actual state, when an MNO receives mobile phone or BWA services as an MVNO from another MNO in the same group and provides these services together with its services in 1 mobile phone device. *Figures of the past years are different from those in the last year’s publication due to amendments by the target enterprises.
(Source) Prepared from “Announcement of Quarterly Data on Telecommunication Service Contracts and Market Shares (4Q of FY 2017 (March 31, 2018)),” MIC
13,50714,644
15,702
17,732
19,570
21,474 21,760 22,133 22,556
14,91915,633 16,175
16,787 16,821 16,929 17,098
12,82013,604 14,188
14,87915,654
16,344 16,405 16,534 16,727
23,102
17,357
17,009
10,000
12,000
14,000
16,000
18,000
20,000
22,000
24,000
March 2012 March 2013 March 2014 March 2015 March 2016 March 2017 June 2017(1Q)
September 2017(2Q)
March 2018(4Q)
December 2017(3Q)
Mobile phones / PHS / BWA (net total) Mobile phones / PHS / BWA Mobile phones
(tens of thousands of subscriptions)
Figure 5-2-2-4 Transitions in carrier shares in mobile com-munication subscriptions (after adjusting for internal group transactions)
KDDI Group share includes KDDI, Okinawa Cellular, and UQ Communi-cations; Softbank Group share includes Softbank, Y!Mobile, and Wire-less City Planning.
(Source) Prepared from “Announcement of Quarterly Data on Telecommunication Service Contracts and Market Shares
(4Q of FY 2017 (March 31, 2018)),” MIC
(%)
40.2 39.8 39.8 39.5 39.1
3.6 4.8 4.9 5 5.2
26.6 26.8 26.9 27 27.2
2.3 2.6 2.7 2.8 2.825.3 23.9 23.6 23.5 23.41.9 2.1 2.1 2.2 2.3
38.7
5.3
27.6
2.823.12.4
0
20
40
60
80
100
16・3 17・3 17・6(1Q)
17・9(2Q)
18・3(4Q)
17・12(3Q)
NTTDocomo NTTDocomo (MVNO) KDDI GroupKDDIGroup (MVNO) Softbank GroupSoftbank Group (MVNO)
71
Chap
ter 5

mestic ISPs without passing through major domestic IX32(B2) and traffic exchanged with overseas ISPs(B3), data inflow has exceeded outflow in all types. The gap has been increasing (Figure 5-2-2-6).
(c) Estimations in traffic passing over the Internet in JapanWe estimated the total download traffic by broadband
service subscribers in Japan from A1 — the traffic of ISP5 broadband service subscribers (DSL, FTTH, CATV, FWA) — and the percentage of ISP5 subscrip-tions among all broadband subscriptions in Japan. This estimate found that an average of approximately 10.8 Tbps of traffic passed over the Internet during Novem-ber 2017. This was a 31.6 percent increase from the same month 1 year ago, continuing the increase in traf-fic over the Internet (Figure 5-2-2-6).
(ii) Mobile communication traffic⃝ Mobile communication traffic increased at a pace of about 1.4 times
over the last yearThe rapid increase in traffic, particularly data commu-
nications, in recent years is a significant factor in radio spectrum congestion in the frequencies assigned to mo-bile communication systems. In view of this, five mobile communication carriers (NTT docomo, KDDI, Soft-Bank, UQ Communications, and Wireless City Plan-ning) worked together to tabulate and analyze data on mobile communication traffic volumes (non-voice traf-fic). As of December 2017 mobile communication traffic increased about 1.4 times over the last year, reaching an average of 2314.2 Gbps (Figure 5-2-2-7).
32 Total for IXs run by Internet Multifeed, Equinix Japan, Japan Internet Exchange, BBIX, and WIDE Project.
Figure 5-2-2-5 Transitions in subscriptions to MVNO servic-es (excluding MVNOs that are MNO)
(Source) Prepared from “Announcement of Quarterly Data on Telecommunication Service Contracts and Market Shares
(4Q of FY 2017 (March 31, 2018)),” MIC
742
958
1,269
1,586 1,636 1,6871,764
599
791
1,102
1,409 1,454 1,501 1,575
142 166 167 177 182 186 188
1,840
1,652
188
0
200
400
600
800
1,000
1,200
1,400
1,600
1,800
2,000
March2014
March2015
March2016
March2017
June 2017(1Q)
Sept 2017(2Q)
March 2018(4Q)
Dec 2017(3Q)
(tens of thousands of subscriptions)
Mobile phones / PHS / BWAMobile phones / PHS BWA
Figure 5-2-2-6 Tabulations and estimates of Internet traffic in Japan*1*2
【Traffic tabulations and estimates】
Year Month
Total traffic by broadband service subscribers in Japan (estimated) [Gbps] ※3
Traffic per broadband service subscriber (estimated) [kbps]
(A1)Traffic by broadband service subscribers (DSL, FTTH, CATV, FWA etc.) [Gbps]
(A2)Traffic by other subscribers (leased lines, data centers, etc.) [Gbps]
(B1)Traffic exchanged between major domestic IXs and ISP5 [Gbps]
(B2)Traffic exchanged between domestic ISPs and ISP5 without passing through major domestic IXs [Gbps]
(B3)Traffic exchanged between overseas ISPs and ISP5 [Gbps]
(X)ISP5 share (calcu-lated from sub-scription num-bers) ※4
in out in out in out in out in out in out in out
20125 652 1,714 18.6 48.9 287.8 756.6 251.5 243.0 118.4 98.6 317.4 145.1 528.7 178.8 44.13%
11 664 1,897 18.8 53.8 294.0 840.3 268.3 257.2 103.2 83.2 316.6 135.7 571.3 201.6 44.29%
20135 776 2,293 21.9 64.7 347.8 1,027.8 300.3 286.4 114.5 85.5 423.3 161.3 633.9 231.6 44.82%
11 830 2,571 23.2 72.0 370.0 1,146.3 336.5 326.2 138.9 94.9 520.8 186.2 714.5 259.7 44.59%
20145 904 2,889 25.0 80.0 398.9 1,274.5 359.2 317.2 163.6 101.5 614.9 214.3 808.3 282.3 44.11%
11 932 3,560 25.5 97.6 407.6 1,557.0 496.1 426.1 192.3 104.6 765.1 246.5 924.6 340.6 43.73%
20155 1,054 4,448 28.4 119.9 457.0 1,928.9 525.6 440.2 198.9 117.5 955.6 287.5 941.5 308.1 43.37%
11 1,060 5,467 28.2 145.7 452.9 2,336.1 581.1 503.0 251.9 137.1 1,306.4 366.6 1,059.7 307.9 42.73%
20165 1,317 6,840 34.6 179.5 551.5 2,863.3 652.7 570.5 277.0 112.6 1,765.1 453.8 1,080.1 292.4 41.86%
11 1,460 8,232 37.8 212.9 602.5 3,396.6 1,246.0 653.6 311.0 113.6 1,989.2 518.2 1,221.9 353.8 41.26%
20175 1,814 9,636 46.6 247.7 743.7 3,950.6 1,304.0 690.9 427.4 146.5 2,809.3 625.9 1,248.5 308.7 41.00%
11 1,483 10,830 37.8 276.0 597.1 4,359.2 1,347.2 755.0 514.5 123.6 3,091.0 587.3 1,390.8 348.8 40.25%
(Notes) *1 ISP5 is the total for five cooperating ISPs, namely the Internet Initiative Japan (IIJ), NTT Communications, K-Opticom, KDDI, and SoftBank.*2 The total traffic by broadband service subscribers in Japan (estimated), the traffic per broadband service subscriber (estimated) for A1, and
for A2 columns, In stands for uploads and Out stands for downloads.*3 Total traffic by broadband service subscribers in Japan was estimated from the traffic of ISP5 broadband service subscribers (A1) and the
ISP5 share of all subscriptions (X). *4 Estimation by linear interpolation using the data of “Announcement of Quarterly Data on Telecommunication Service Contracts and Market
Shares”
72
Chap
ter 5

3. State of broadcasting service provision and usage⃝ Subscriptions to NHK terrestrial, NHK-BS, WOWOW and cable TV servic-
es in FY 2016 increased from the previous yearSubscriptions to all broadcasting services, except
110° CS, 124/128° CS broadcasts, increased in FY 2016 (Figure 5-2-3-1).
*A1 includes the following types of traffic: • Some traffic on public wireless LAN services from some ISP carriers • Some traffic on femtocell services from some mobile communication carriers* Clarified that from November 2016, traffic by CDN cache and traffic by customer ISPs connecting with cooperating ISPs which provide transit are handled as A2.
*B2 includes traffic exchanged via the following: • private peering with domestic ISPs • transit provided by domestic ISPs • public peering at other domestic IXs other than major domestic IXs* B3 includes traffic exchanged via the following; however, clarified that from November 2016, among the traffic, the traffic at domestic connection points are handled as B2.
• private peering with overseas ISPs • transit provided by overseas ISPs • public peering at overseas IXs.
(Source) Prepared from “Announcement Japan’s Internet Traffic Tabulations and Estimates for November 2017,” MIC
Domestic ISPsOverseas ISPs
ISP5
B1 Traffic exchanged with major domestic IXs
B2 Traffic exchanged between domestic ISPs without passing through major domestic IXs
B3 Traffic exchanged with overseas ISPs
A2 Traffic by other subscribersA1 Traffic by broadband
service subscribers
B1In Out
In
Out
A1In
Out
A2
In
Out
B2
In
Out
C Traffic at major domestic IXs
A Traffic by subscriber type
B Traffic exchanged between ISPs
Broadband service subscribers(FTTH, DSL, CATV, FWA)
BB BBOther subscribers
(leased lines, data centers, etc.)
Major Domestic
IXC
Internet Initiative Japan (IIJ)NTT CommunicationsK-OpticomKDDISoftBank
CDNcacheDC
BBEnterprises
Run by Internet Mul-tifeed, EquinixJapan, J a p a n I n t e r n e t Exchange, BBIX, and WIDE Project.
B3
Types of tabulated traffic
Figure 5-2-2-7 Transitions in the monthly average mobile communication traffic in JapanTabulated Month June 2016 September 2016 December 2016 March 2017 June 2017 September 2017 December 2017
Average monthly traffic up down total up down total up down total up down total up down total up down total up down total
Average (Gbps) 196.7 1227.9 1424.6 217.5 1345.0 1562.5 225.0 1411.6 1636.6 249.0 1566.6 1815.6 266.9 1724.2 1991.1 289.3 1910.4 2199.7 315.3 1998.9 2314.2
(Source) Prepared from “Information and Communications Statistics Database,” MIC
73
Chap
ter 5

4. Promoting informatization in government services(1) Promoting e-government⃝ State of promoting e-government based on the inventory of adminis-
trative procedures In order to improve the convenience of the whole admin-
istrative services, Cabinet Secretariat conducted a detailed survey on the administrative procedures (inventory sur-vey). The result shows that 1% (580 types) of the total types of procedures (46,385 types), which had more than 0.1 mil-lion filings in a year accounted for 99% (4.8 billion) of the number of procedure fillings. Especially, the online usage rate of 57 types of the improvement promotion proce-dures33, which are frequently used by citizens and enter-prises has steadily been rising (190,455,866 procedures
out of all 413,709,993 procedure fillings were filed online, online usage rate is 46.0%, an increase of 2.5 percentage points from the previous fiscal year) (Figure 5-2-4-1). Fac-tors influencing the online usage rate such as the presence or absence of attached documents or the method of identi-ty verification have also been clarified to a certain extent.
(2) Promoting informatization in local governments a. State of online usage ⃝ The usage rate of local government procedures selected for online-us-
age promotion increased over the previous fiscal yearThe online usage rate of local government administrative
procedures34 was 51.4 percent in FY 2016 (Figure 5-2-4-2).
33 Improvement promotion procedures are frequently used procedures that are filed 1 million or more times a year by citizens or enterprises or that are mainly used iteratively or continuously by enterprises even if annual filings are less than 1 million.
34 The targeted procedures were those selected for online-usage promotion under the E-Local Government Online Usage Advancement Policy.
Figure 5-2-3-1 Subscribers to broadcasting services
(Notes) *NHK terrestrial subscribers are the number of all NHK subscription contracts.*NHK-BS subscribers are the number of NHK satellite contracts.*WOWOW subscribers are the number of WOWOW contracts.*110° East CS subscribers are the number of Sky PerfecTV contracts.*124/128° East CS subscribers are the number of Sky PerfecTV premium contracts.* Until FY 2010, cable TV subscribing households are the number of subscribing households to business enterprises providing independent broadcasting services with facilities licensed under the former licensing scheme. From FY 2011 on, it represents the number of subscribing households to registered business enterprises with wired telecommunication facilities providing independent broadcasting services. (Both exclude broadcasts using IP multicasts.)
(Source) Prepared using materials from Japan Electronics and Information Technology Industries Association, materials from Japan Cable Laboratories, materials from NHK, and “State of Satellite Broadcasting”
and “State of Cable Television” from MIC
6,7256,725 6,9716,971 7,1897,189 7,3087,308 7,4267,426 7,5367,536 7,6307,630 7,7317,731 7,8067,806
0
1,000
2,000
3,000
4,000
5,000
6,000
7,000
8,000tens of thousands of subscribers)
2008 2009 2010 2011 2012 2013 2014 2015 2016 (FY)
NHK-BS
errestrial-based broadcasters(NHK)
WOWOW
124/128° East CS
110° East CS
Cable TV 2,885.0
209.3
114.4
282.3
4,315.4
2,066.7
2,852.0
219.5
120.3
280.5
4,258.2
1,993.3
2,817.0
212.0
125.4
275.6
4,200.1
1,911.3
2,767.0
205.6
157.1
264.8
4,141.2
1,823.2
2,707.0
196.3
176.2
263.1
4,082.9
1,737.4
2,655.6
173.7
196.3
254.8
4,027.4
1,649.6
2,601.6
140.4
221.1
251.2
3,975.1
1,567.2
2,470.6
112.6
245.6
249.0
3,893.2
1,475.2
2,300.7
83.0
273.7
247.6
3,820.2
1,399.9
Figure 5-2-4-1 Transitions in the online usage of improvement promotion procedures
fiscal year procedure filings Filings done online Online usage rate [%]2016 413,709,993 190,455,866 46.02015 401,460,093 174,595,944 43.5 2014 393,192,170 162,501,867 41.3
(Source) “Online of Inventory Results of Administrative Procedures” Cabinet Secretariat and MIC https://cio.go.jp/tetsuduki_tanaoroshi
74
Chap
ter 5

1. State of usage and number of radio stations(1) Radio stations⃝ The number of radio stations in Japan has increased steadily since 2006
The number of radio stations (excluding PHS and wireless LAN handsets and other radio stations for which no license is required) at the end of FY 2017 in-creased by 7.9 percent from a year earlier to 234.45 mil-lion, including 231.09 million mobile phones and other
land mobile stations, a jump of 7.7 percent increase. Mo-bile phones and other mobile land stations accounted for a huge 98.6 percent of all radio stations. The number of convenience stations climbed by 6.0 percent to 1.18 mil-lion (Figure 5-3-1-1).
Section 3 Radio Spectrum Usage Trends
(※1) “Land mobile station” refers to a radio station that is operated either while in motion on land or while stationary in an unspecified location (such as mobile phones).
(※2) “Convenience station” refers to a radio station used for simple radio communications.
Figure 5-3-1-1 Transitions in the number of radio stations
2005 2006 2007 2008 2009 2010 2011 2012 2013 2014 2015 2016 2017other 36 41 49 49 48 46 43 46 50 50 55 49 49Base stations 62 62 63 41 41 54 58 63 68 71 70 73 125Convenience stations※2 65 66 68 70 72 74 77 84 90 97 105 112 118Amateur stations 56 53 51 49 47 45 44 44 44 44 44 43 43Land mobile stations※1 10,212 10,059 10,573 10,993 11,448 11,879 13,266 14,388 15,472 17,493 19,711 21,457 23,109Percentage of landmobile stations 97.9 97.9 97.9 98.1 98.2 98.2 98.3 98.4 98.4 98.5 98.6 98.7 98.6
97.9 97.9 97.9 98.1 98.2 98.2 98.3 98.4 98.4 98.5 98.6 98.7 98.6
0
20
40
60
80
100
0
5,000
10,000
15,000
20,000
25,000
(tens of thousands of stations)
(End of FY)
(%)
(%)
(Note) The total yearly filings are an estimate for the entire country calculated based on the total number of filings and the populations in the jurisdic-tions of local governments that had already placed the targeted procedures online.
(Source) “State of Online Administrative Procedures in FY 2016,” MIChttp://www.e-gov.go.jp/doc/facilitate/announce.html
Figure 5-2-4-2 Transitions in the usage of local government procedures selected for online-usage promotion
40.0
42.6
45.247.1
49.151.451.4
30
35
40
45
50
55
2011 2012 2013 2014 2015 2016 (FY)
(%) fiscal year
Total procedure filings for the year
Filings done online
Online usage rate [%]
2011 337,590,000 135,031,153 40.0
2012 349,000,000 148,496,598 42.6
2013 367,327,000 165,922,189 45.2
2014 368,733,000 173,807,766 47.1
2015 384,473,000 188,831,889 49.1
2016 397,823,000 204,525,754 51.4
75
Chap
ter 5

2. Radio surveillance to eliminate interference with key radio communica-tions
⃝ There were 522 reports of interference with key radio communications in FY 2017, and 1,468 actions were taken against illegal radio stationsIn the interests of eliminating radio interference and
obstructions and maintaining a favorable radio spec-trum usage environment, officials at the 11 Regional Bu-reaus of Telecommunications and elsewhere use illegal radio station search vehicles and sensor stations in-stalled in towers and on building rooftops in major urban areas nationwide to investigate the sources of radio sig-nals that interfere with fire and emergency services ra-dio, aeronautical and maritime radio, mobile phones, and other key radio communications. Officials also crack down on illegal radio stations and undertake pub-lic awareness activities to ensure more people use the radio spectrum properly.
Since FY 2010, radio authorities have been working to promptly eliminate interference with key radiocommu-nications with a system that accepts interference reports
around the clock. Radio authorities also monitor short-wave radio and cosmic radio waves at international radio surveillance facilities registered with the International Telecommunication Union (ITU).
In FY 2017, there were 2,249 reports of radio interfer-ence or obstructions of all kinds, 165 fewer (down 6.8 percent) than the previous year. Among these, there were 522 reports of interference with key radio commu-nications, 81 fewer (down13.4 percent) than the previ-ous year. In response to these reports, 2,310 actions35 were taken in FY 2017 (Figure 5-3-2-1).
In FY 2017, 4,770 illegal radio stations were detected, 329 more (up 7.4 percent) than the previous year. In re-sponse, 1,468 actions35 were taken in FY 2017, an in-crease of 104 actions (up 7.6 percent) from the previous year. These actions included 168 indictments (11.4 per-cent of all actions) and 1,300 directives (88.6 percent of all actions).
35 The number of actions includes incomplete actions remaining from the previous fiscal year.
0
500
1,000
1,500
2,000
2,500
3,000
3,500
2004 2005 2006 2007 2008 2009 2010 2011 2012 2013 2014 2015 2016 2017
(Fiscal Year)
(reports / actions)
Number of interference/ obstruction reports 2004 2005 2006 2007 2008 2009 2010 2011 2012 2013 2014 2015 2016 2017
592 674 684 512 532 513 689 501 532 605 771 676 6031,711 1,991 2,344 2,364 2,241 2,041 1,934 1,873 1,826 1,740 1,995 1,821 1,8112,303 2,665 3,028 2,876 2,773 2,554 2,623 2,374 2,358 2,345 2,766 2,497 2,414
Number of actions in response to interference/obstruction reports2,155 2,403 2,745 3,179 2,772 2,289 2,669 2,453 2,389 2,346 2,667 2,348 2,414
5221,7272,249
2,310
Reports of interference with key radio communications
Other interference report Actions taken in responce to reports
Reports of interference withkey radio communicationsOther interference reportActions taken in responce to reports
Number of actions in response to reports
Figure 5-3-2-1 Transitions in the number of radio station interference / obstruction reports and the number of actions taken in response
76
Chap
ter 5