chapter 5 price: the role of supply and demand © 2001 south-western college publishing
TRANSCRIPT

Chapter 5
Price: The Role of Supply and Demand
© 2001 South-Western College Publishing

2
Law of Demand
The quantity purchased of a good or service is inversely related to the price, all other things being equal

3
Quantity Demanded vs. Demand
Quantity Demanded:
The quantities of a good or service that people will purchase at a specific price over a given period of time.
Demand:
A schedule of the total quantities of a good or service that purchasers will buy at different prices at a given time

4
Demand
Individual demand:
– quantity of a good or service that an individual or firm stands ready to buy at various prices at a given time
Market demand:
– sum of the individual demands in the marketplace

5
Demand Schedule/Demand Curve
Demand Schedule:Demand Schedule:– table showing the various quantities of a
good or service that will be purchased at various prices
Demand Curve:Demand Curve:– curve that indicates the number of units
of a good or service that consumers will buy at various prices at a given time

6
Demand Curve for Internet Time
$1.55
1.50
1.45
1.40
1.35
1.30
1.25
1.20
1.15
1.10
1.05
0 1 2 3 4 5 6 7 8 9 10 11 12 13 Quantity (millions
of hours)
Pri
ce p
er
H
ou
r
D
7
Changes in Demand
Change in Quantity Demanded:– Movement along the demand curve that
occurs because the price of the product has changed
Change in Demand:– Change in the amounts of the product
that would be purchased at the same given prices; a shift in the entire demand curve

8Quantity (millions of hours)
Demand Curves for Internet Time
$1.55
1.50
1.45
1.40
1.35
1.30
1.25
1.20
1.15
1.10
1.05
0 1 2 3 4 5 6 7 8 9 10 11 12 13
Pri
ce p
er
H
ou
r
DD2
D1

9
Supply
Supply: The total quantities of a good or service that sellers stand ready to sell at different prices at a given time
Individual Supply: Quantities offered for sale at various prices at a given time by an individual seller
Market Supply: Sum of the individual supply schedules in the marketplace

10
Supply
Supply Schedule: Table showing the various quantities of a good or service that sellers will offer at various prices at a given time
Supply Curve: Line showing the number of units of a good or service that will be offered for sale at different prices at a given time

11
Law of Supply
The quantity offered by sellers of a good or service is directly related to price, all things being equal.

12
Changes in Supply
Change in the Quantity Supplied: Movement along the supply curve that occurs because the price of the product has changed
Change in Supply: A change in the amount of the product that would be offered for sale at the same given price; a shift of the entire supply curve

13Quantity (millions of hours)
Supply Curves for Internet Time
$1.55
1.50
1.45
1.40
1.35
1.30
1.25
1.20
1.15
1.10
1.05
0 1 2 3 4 5 6 7 8 9 10 11 12 13
Pri
ce p
er
H
ou
r
SS2 S1

14
Determinants of Supply
Changes in the cost of resources
Technology
Expectations of future prices
Prices of related products

15
Equilibrium Price
The price at which the quantity demanded equals the quantity supplied

16Quantity (millions of hours)
Demand, Supply, and Market Price for Internet Time
$1.55
1.50
1.45
1.40
1.35
1.30
1.25
1.20
1.15
1.10
1.05
0 1 2 3 4 5 6 7 8 9 10 11 12 13
Pri
ce p
er
H
ou
r
SupplyDemand
EE

17Quantity (millions of hours)
Surplus, Shortage, and Equilibriumfor Internet Time
$1.55
1.50
1.45
1.40
1.35
1.30
1.25
1.20
1.15
1.10
1.05
0 1 2 3 4 5 6 7 8 9 10 11 12 13
Pri
ce p
er
H
ou
r
SupplyDemand
E
Surplus
Shortage

18
Alternate Supply and Demand Positions
D
D1
SP
Q/t Q/t
P
D
SS1
Demand Increases(D becomes D1 )
Demand Decreases(D1 becomes D)
Supply Increases(S becomes S1 )
Supply Decreases(S1 becomes S)

19
Price Ceiling
Government mandated maximum price that can be charged for a good or a service

20
Effects of a Price Ceiling on Rental Housing
700
500
0 18,000 30,000 40,000
ShortageD
S
E
Mon
thly
Pri
ce
($)
Quantity (housing units)

21
Price Floor
Government mandated minimum price that can be charged for a good or a service

22
Effects of a Price Floor on Wheat
3.00
2.00
0 75,000 100,000 115,000
Surplus
D
SP
rice p
er
bu
sh
el ($
)
Quantity (bushels)

23
Price Elasticity of Demand
Measure of the sensitivity or responsiveness of quantity demanded to a change in price
– Formula method
– Total revenue method

24
D2
D2
Quantity/Time
Demand Curve Showing Different Elasticities
$13
12
11
10
9
8
7
6
5
4
3
2
1
0 1,600 2,000 2,400
Pri
ce
D
DD1
D1
25
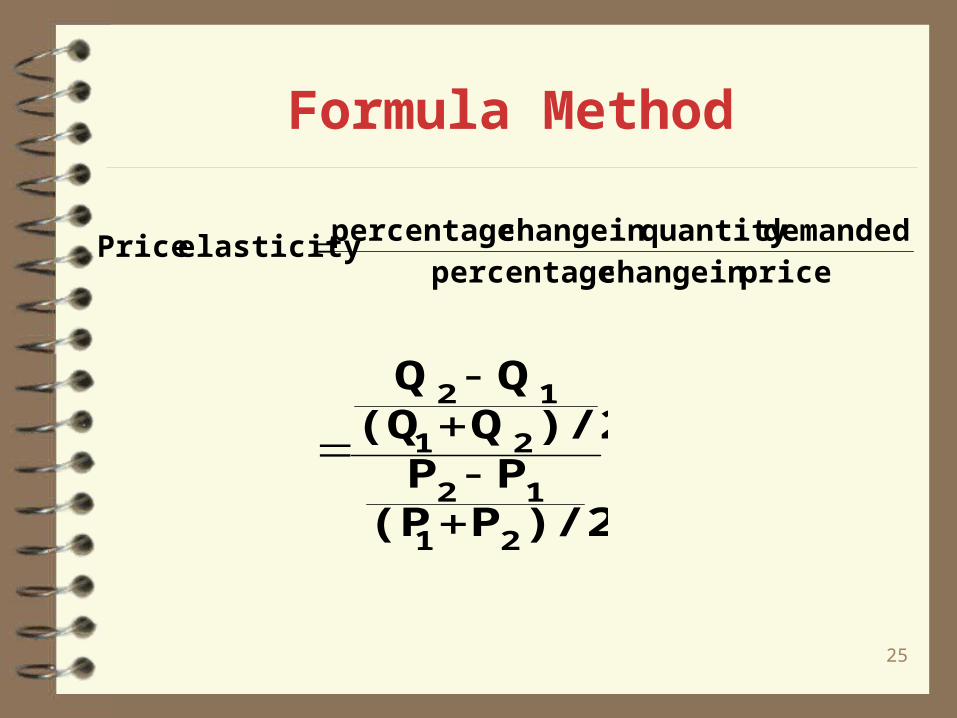
Formula Method
price in change percentagedemanded quantity in change percentageelasticity Price
)/2P(PPP
)/2Q(QQQ
21
12
21
12
26
Unit Elastic Demand
Demand that exists when a percentage change in price causes an equal percentage change in quantity demanded
– has an elasticity coefficient equal to 1.0

27
Elastic Demand
Demand that exists when a percentage change in price causes a greater percentage change in quantity demanded
– has an elastic coefficient greater than 1.0

28
Inelastic Demand
Demand that exists when a percentage change in price causes a smaller percentage change in quantity demanded
– has an elasticity coefficient less than 1.0
29
Total Revenue Method
If price changes and total revenue is constant, unit elasticity of demand exists
If price changes and total revenue moves in the opposite direction, demand is elastic
If price changes and total revenue moves in the same direction, demand is inelastic
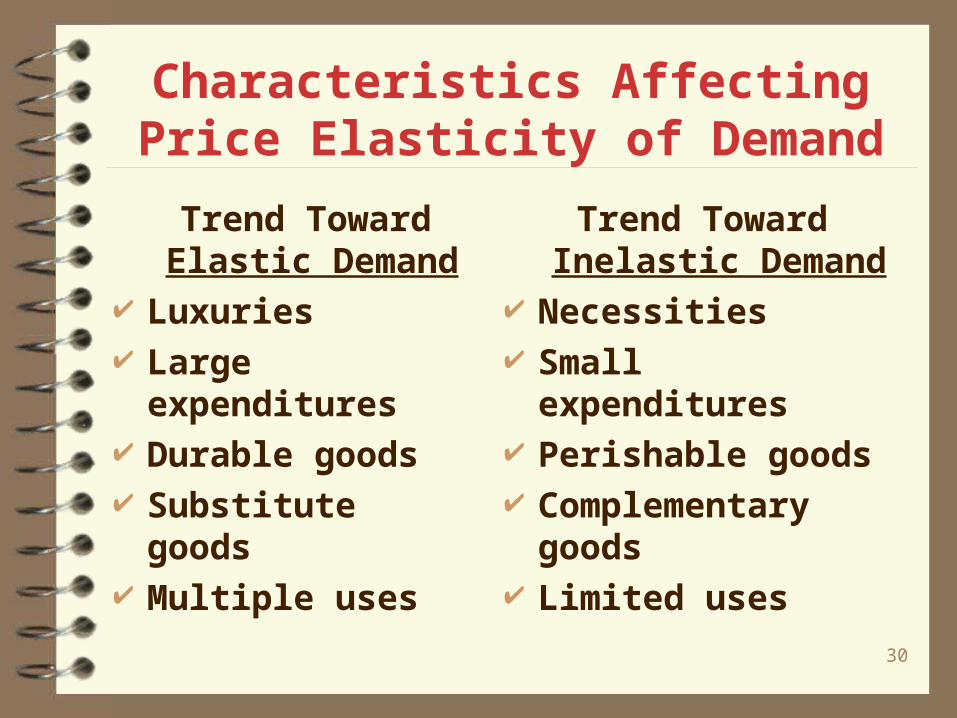
30
Characteristics Affecting Price Elasticity of Demand
Trend Toward Elastic Demand
Luxuries Large expenditures Durable goods Substitute goods Multiple uses
Trend Toward Inelastic Demand
Necessities Small expenditures Perishable goods Complementary goods Limited uses
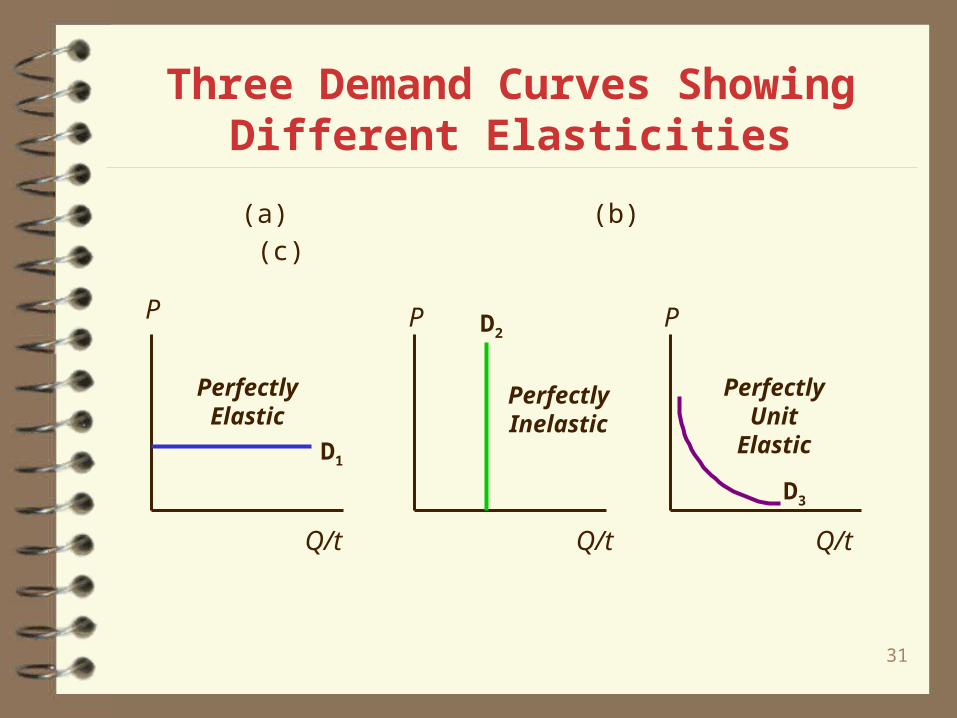
31
D1
Three Demand Curves Showing Different Elasticities
P P P
Q/t Q/t Q/t
D2
D3
(a) (b) (c)
Perfectly Elastic
Perfectly Inelastic
Perfectly Unit
Elastic

32Quantity/Time
Demand Curve Showing Different Elasticities
$12
11
10
9
8
7
6
5
4
3
2
1
Pri
ce
Elas
tic
dem
and
0 10 20 30 40 50 60 70 80 90 100 110 120
Uni
t Ela
stic
Inel
astic
de
man
d

33
Other Types of Elasticity
Cross elasticity of demand
Income elasticity of demand
Price elasticity of supply

34
Cross Elasticity of Demand
Measure of the responsiveness of the quantity demanded of one product as a result of a change in the price of another product
Aof price in change percentageB of demandedquantity in change percentage
demand of elasticity Cross
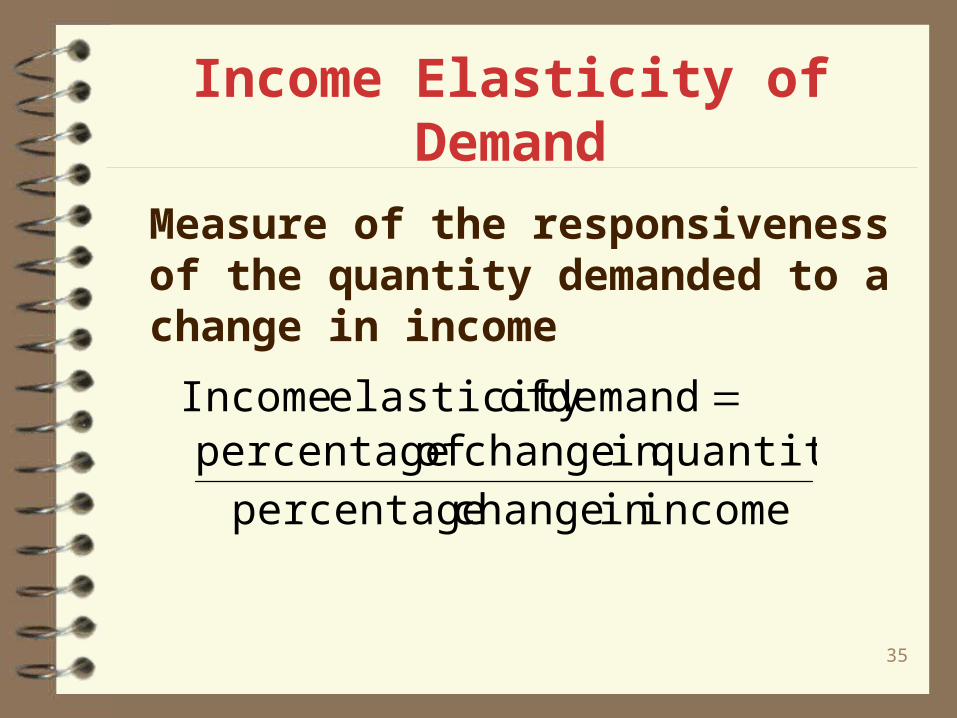
35
Income Elasticity of Demand
Measure of the responsiveness of the quantity demanded to a change in income
income in change percentagequantity in change of percentage
demand of elasticity Income

36
Price Elasticity of Supply
Measure of the responsiveness of the quantity supplied to a change in price
price in change percentagesuppliedquantity in change percentage
supply of elasticity Price
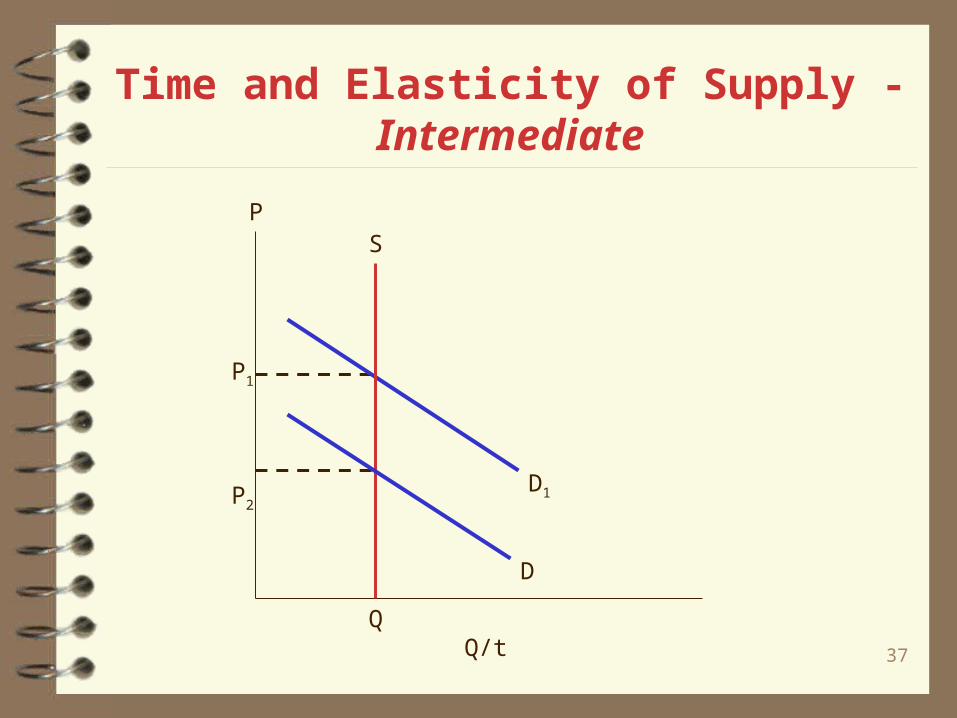
37
Time and Elasticity of Supply - Intermediate
P1
P2
Q Q/t
D1
S
D
P

38
Time and Elasticity of Supply - Short Run
P2
P
Q Q2 Q/t
D1
S
D
P
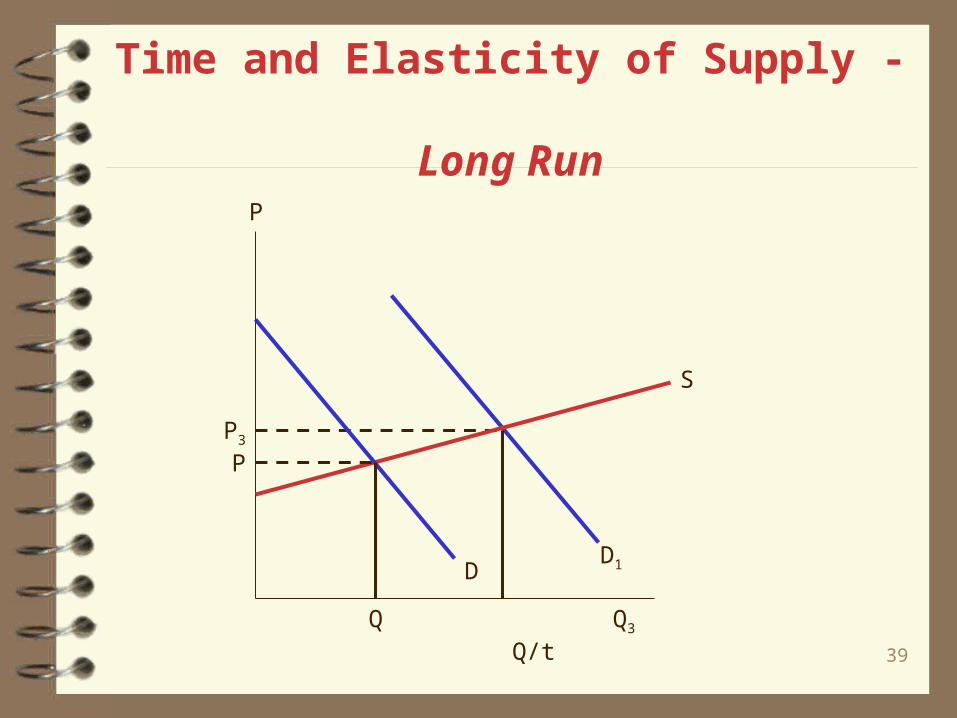
39
Time and Elasticity of Supply - Long Run
P3
P
Q Q3 Q/t
D1
S
D
P

40
Effects of a Tax on Cigarettes
D
S
Price per Pack
($)
40 50
D
S
Quantity (millions of packs)
3.25
3.00
Quantity (millions of packs)
S + $1
3.7
5
3.0
0
48 50
S + $1
ee
R R
Price per Pack
($)