chapter 5 object-oriented (oo) modeling
TRANSCRIPT
Chapter 5
Object-Oriented (OO) Modeling
Dr. Eng. Shady Aly
١
OO development
• The most commonly used method in system
development object-oriented (OO) modeling
and programming (OO development ).
• The object-oriented approach stresses the
encapsulation (تغليف) of data and procedures
within segments of software code called
objects.
٢
OO development-cont.
• Instead of separating programming code from
data files used by the code, the two come
together in one module, the object.
• Objects are instances (مثال و تجسيد) of classes,
which are generic templates of the objects.
• The object has the characteristics of the class
from which it is created.
٣

OO development-cont.
• A specific set of object-oriented design tools that evolved from the trend in object thinking is known as Unified Modeling Language (UML).
• UML, like the IDEF framework, is a set of tools developed to assist analysts in uncovering the important features of a design project, finally arriving at a set of models that will be used to design, document, and implement the project (information system or software)
• In database design projects, UML is often thought of as a tool for object-oriented databases.
• Even if the target database management system (DBMS) is a relational database, the UML design tools can be used.
٤

Difference between structured and OO
programming
Structured
programming
OO
programming٥

Difference between structured and OO
programming- cont.Structured programming:
• The sensor that provides a temperature reading to a software program running on a computer.
• The computer program may have a function called fetch_reading(), which reads the current value of the sensor. The sensor data are always present at the port of the computer for reading whenever the function is called. The program resident on the computer is a series of functions that collect the data and record it or do some computation with it.
• The sensor just converts an environmental condition into a voltage that is then converted to a series of bits that a computer can read. The term “dumb sensor” is appropriate since the sensor has no oversight of its own functionality.
٦

Difference between structured and OO
programming-cont.OO programming:
• The sensor is a real-world object that collects sensory data. The object “sensor” has its own program logic, functionality and its own way of control. (the functionality of the object is encapsulated within the object sensor).
• In a physical device, such as a sensor, this usually requires a microprocessor that is resident within the object.
• The computer (an object itself) requests a reading of the current value of the sensor. The sensor, accepting the request, runs a software component (called a method) to read the current value and then calls another software component (another method) to send the value to the computer.
• The control is distributed to each object instead of being centralized in one main program.
٧

Object-oriented design concepts
• The object-oriented approach creates software in modules (objects). Each object is an independent entity of the system in which it resides. It has a set of tasks it can perform (the methods) and encapsulated data that it can access, maintain, and use.
• Object-oriented design helps create autonomous structures (the objects) that represent real-world entities and have the ability to interact with other objects.
• OO design methods lead to economic software development. Software can be designed as objects, the objects can be used and reused to design systems in a plug-and-play ( سھولة ا�ستخدام= التوصيل و التشغيل ) fashion.
• The programmer no longer has to deal with writing detailed code. Rather, the system is designed by making appropriate connections between objects that must communicate with each other. This reduces development time and enhances system reliability.
٨
Object-oriented design concepts-cont.
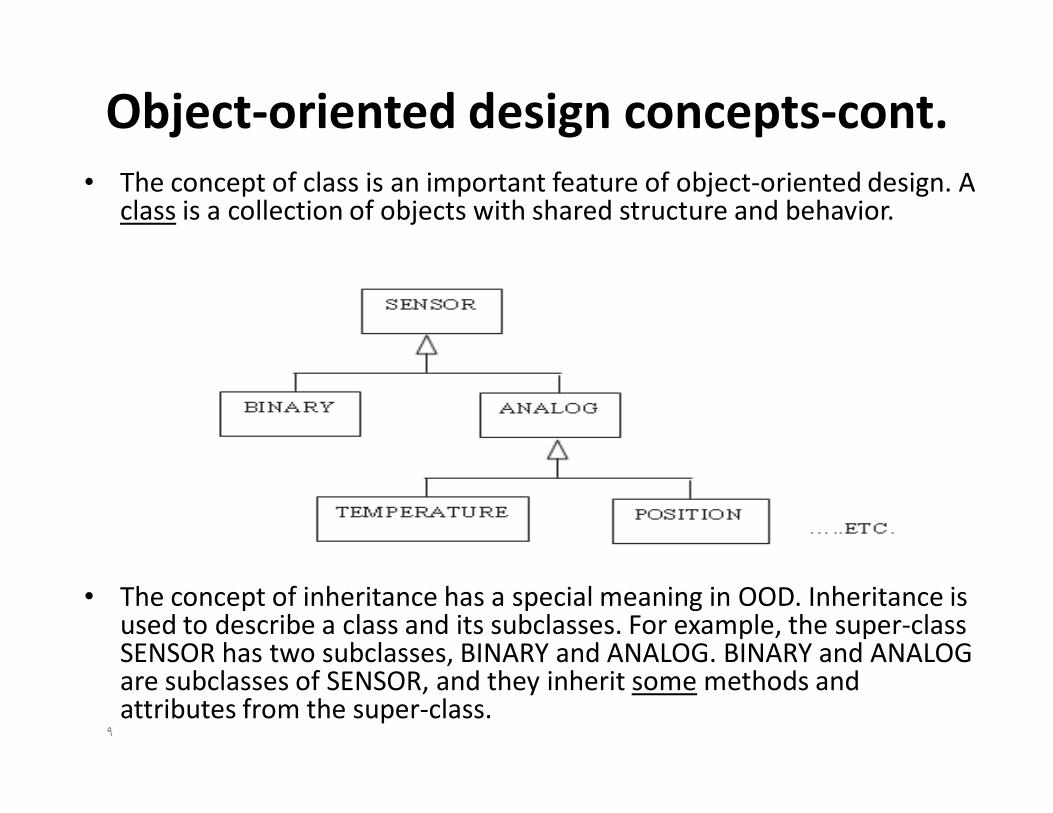
• The concept of class is an important feature of object-oriented design. A class is a collection of objects with shared structure and behavior.
• The concept of inheritance has a special meaning in OOD. Inheritance is used to describe a class and its subclasses. For example, the super-class SENSOR has two subclasses, BINARY and ANALOG. BINARY and ANALOG are subclasses of SENSOR, and they inherit some methods and attributes from the super-class.
٩

Object-oriented design concepts-cont.
• An attribute is a characteristic of an object and class.
• Classes have attributes, but no values. Objects of a class have the attributes of the class and values for those attributes.
• Objects operate under their own specific control.
• An object goes through a series of states, which describe the dynamic behavior of the object.
• The states are a representation of the various phases the object passes through during its operating cycle.
١٠

Object-oriented design concepts-
Cont.
• An object has a set of software functions that
it can execute. The functions are often
associated with a state of the object, but this
is not necessary.
• The important thing is that an object can use
these functions whenever it is appropriate. In
the OO world, these functions are called
methods.
١١
Object-oriented design concepts-cont.
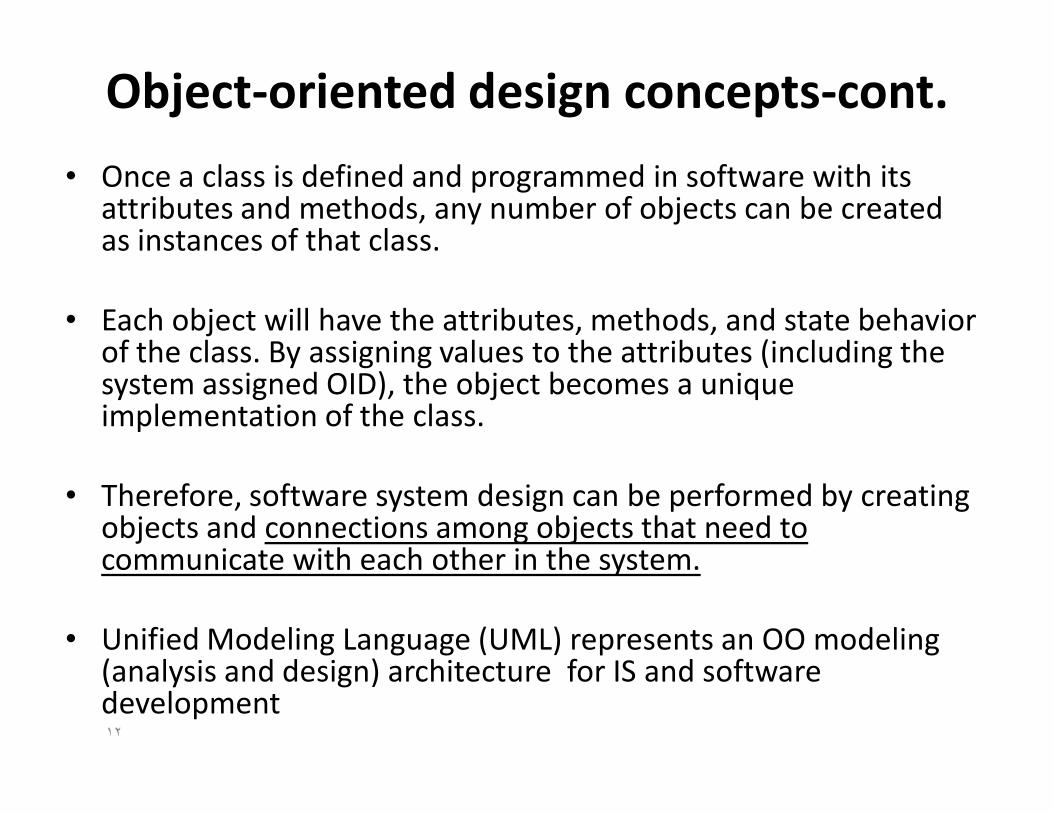
• Once a class is defined and programmed in software with its attributes and methods, any number of objects can be created as instances of that class.
• Each object will have the attributes, methods, and state behavior of the class. By assigning values to the attributes (including the system assigned OID), the object becomes a unique implementation of the class.
• Therefore, software system design can be performed by creating objects and connections among objects that need to communicate with each other in the system.
• Unified Modeling Language (UML) represents an OO modeling (analysis and design) architecture for IS and software development١٢

UML design models
• UML has nine diagrams. They can be classified as either structural diagrams or behavioral diagrams.
• The structural diagrams define the static relationships among components of the architecture.
• The behavioral diagrams define the dynamics of components of the design.
• The categorization of diagrams is as follows:– Structural: Class diagrams, object diagrams, component diagrams,
and deployment diagrams
– Behavioral: Use case diagrams, sequence diagrams, collaboration diagrams, state chart diagrams, and activity diagrams
١٣
UML design models-cont.
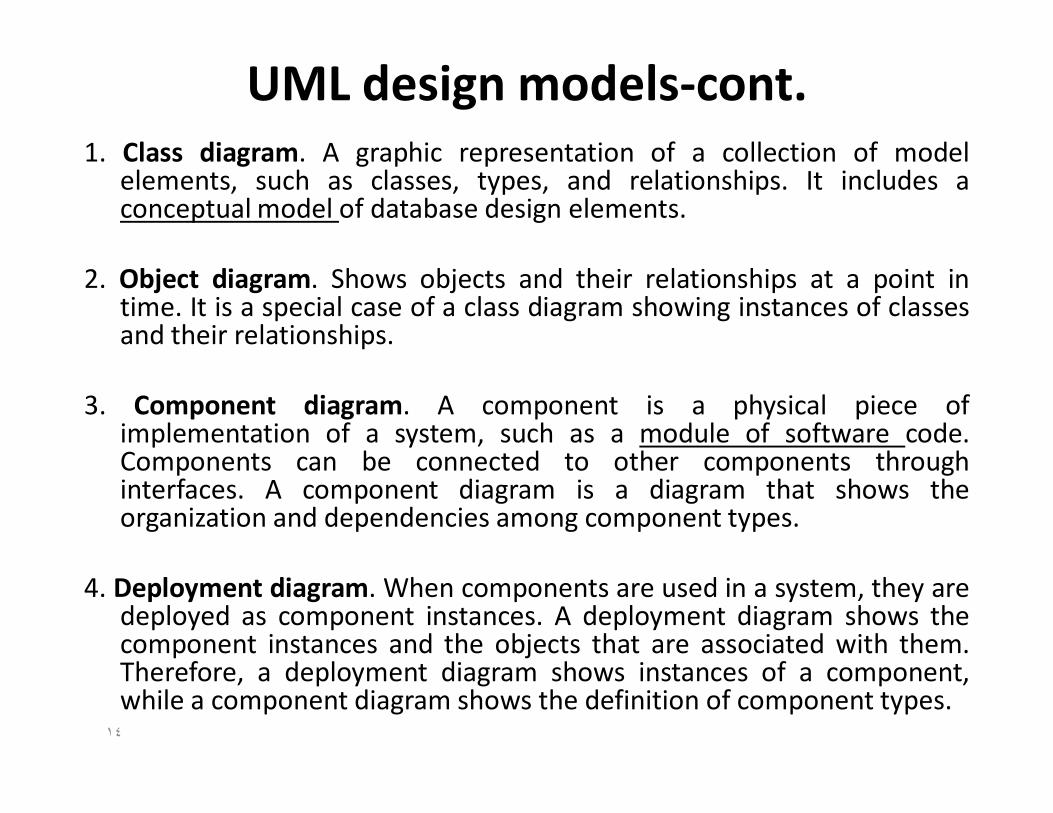
1. Class diagram. A graphic representation of a collection of modelelements, such as classes, types, and relationships. It includes aconceptual model of database design elements.
2. Object diagram. Shows objects and their relationships at a point intime. It is a special case of a class diagram showing instances of classesand their relationships.
3. Component diagram. A component is a physical piece ofimplementation of a system, such as a module of software code.Components can be connected to other components throughinterfaces. A component diagram is a diagram that shows theorganization and dependencies among component types.
4. Deployment diagram. When components are used in a system, they aredeployed as component instances. A deployment diagram shows thecomponent instances and the objects that are associated with them.Therefore, a deployment diagram shows instances of a component,while a component diagram shows the definition of component types.
١٤

UML design models-cont.
5. Use case diagram. Use case is a function that the system can perform when it
interacts with outside actors. The concept of an “actor” is an abstraction of a
person or thing outside the system that interacts directly with the system — for
example, a database user. The use case diagram shows the functional interaction
between actors and the system when performing a user function.
6. Sequence diagram. A sequence diagram shows the interaction of the actor with
the objects in the system and the timing of the interactions. It gives a dynamic
view by time-sequencing the flow of messages among objects.
7. Collaboration diagram. A collaboration is an arrangement of objects and links that
interact to implement a behavior, such as a use case. The collaboration diagram
illustrates that interaction.
١٥

UML design models-cont.
8. State chart diagram. A state machine is a sequence of states and
transitions between states that an object goes through in
response to events in its life cycle. A state chart diagram shows
the state machine, including nested component states, in a
simple diagrammatic form. State chart diagrams depict the
dynamics of objects.
9. Activity diagram. An activity is an execution of a process, which
could be within the system or a real-world function that interacts
with the system. An activity diagram shows a graph that models
the activity. Activity diagrams are very useful in modeling
business operations and workflows.
١٦

Architecture design using UML
• In UML, development begins with the requirements
determination, and proceeds to specification and
logical modeling (analysis), then to architectural
modeling (design) and implementation and coding,
and finally to testing and maintenance.
• In traditional architecture specification, as in the
case of IDEF, determination of requirements,
design, and analysis is done from the top down
based on functional decomposition, combined with
separate data model design.١٧

Architecture design using UML-cont.
• UML permits functional analysis and system (database) specification to evolve simultaneously with the goal of identifying objects and object classes, their relationships, and their methods.
• Once an object class is identified, it can be worked on (encoded) independently of other classes in the system.
• To identify objects and classes in UML , first we need to uncover ways in which the system is expected to interact with its environment by creating use cases. The use cases should suggest objects, their attributes, and their methods.
• Once objects are identified, more specificity can be added using sequence diagrams, which model the interaction among objects and the timing of that interaction.
• The execution of code by an object implies the existence of a method.
١٨
Use case diagram
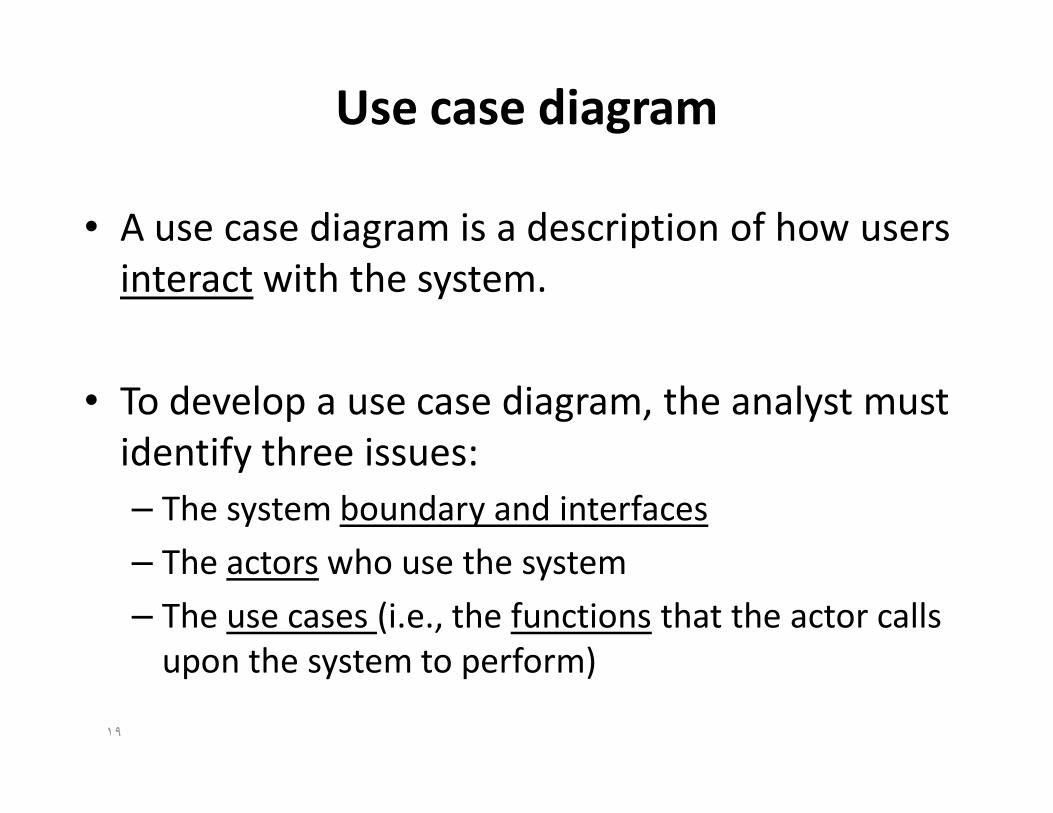
• A use case diagram is a description of how users
interact with the system.
• To develop a use case diagram, the analyst must
identify three issues:
– The system boundary and interfaces
– The actors who use the system
– The use cases (i.e., the functions that the actor calls
upon the system to perform)
١٩

Example Use case diagram
٢٠
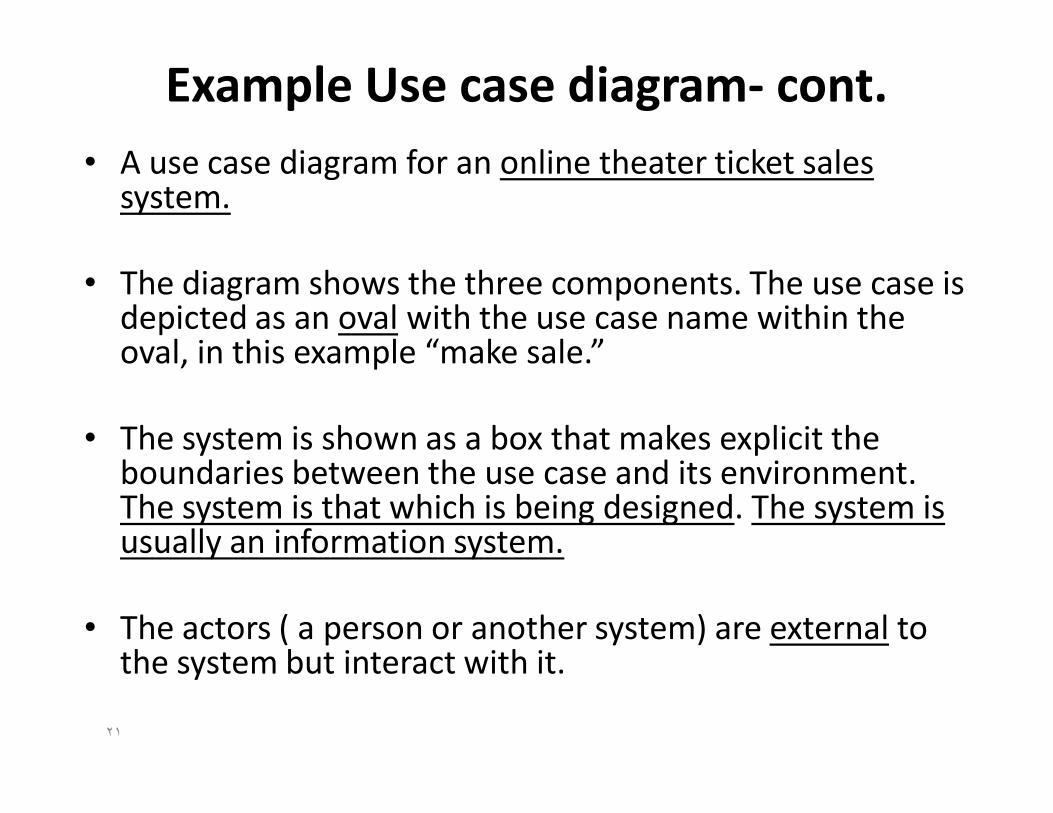
• A use case diagram for an online theater ticket sales system.
• The diagram shows the three components. The use case is depicted as an oval with the use case name within the oval, in this example “make sale.”
• The system is shown as a box that makes explicit the boundaries between the use case and its environment. The system is that which is being designed. The system is usually an information system.
• The actors ( a person or another system) are external to the system but interact with it.
Example Use case diagram- cont.
٢١

Example Use case diagram-cont.
• Another way to represent an actor, particularly if it is not a person, is by using a box with the word <<actor>> in guillemets.
• The use case diagram of previous figures tells a story. One of the uses of the system is to make a sale.
• There are two actors (external entities) involved. One is the customer and the other is the credit authorization entity.
• When documenting a use case, it is important to write an explanation of the use case that will help convey the message of the diagram. This document can be in the form of a text file that describes the activities that take place in executing the use case. These descriptions are called scenarios.
٢٢
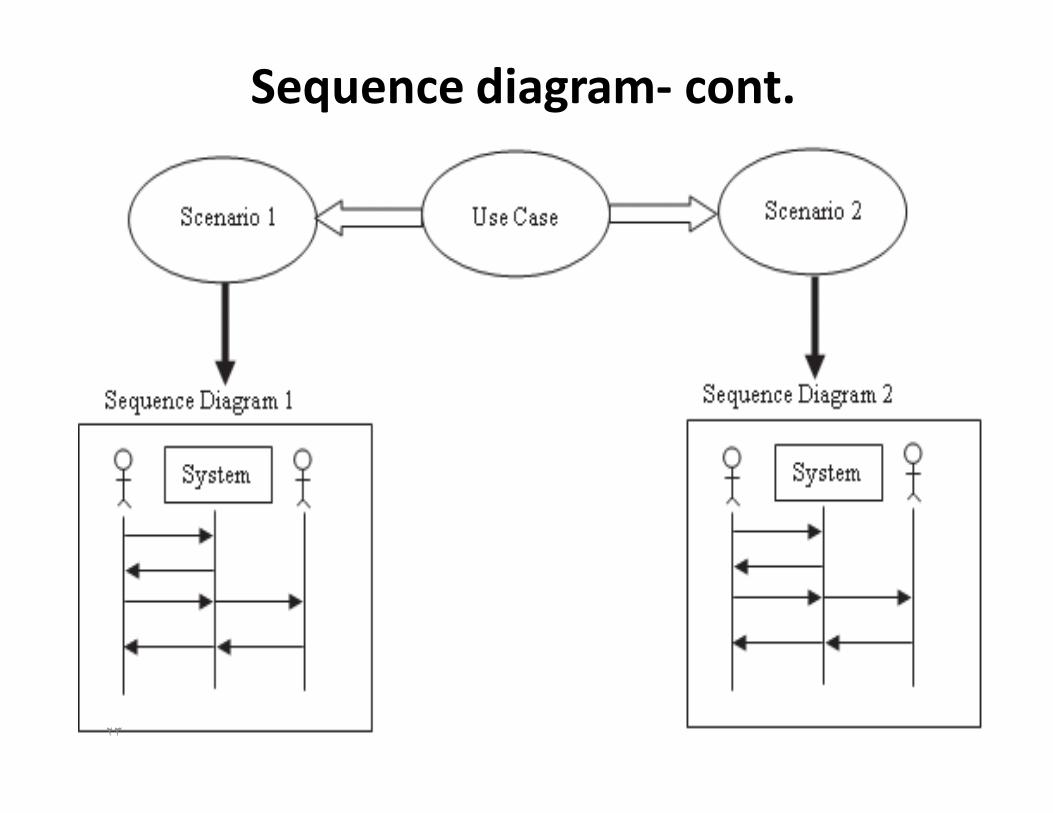
Sequence diagram- cont.
٢٣

Sequence diagram-cont.
• Better understanding of the various possible interactions that may occur between the actorsand the system during the execution of a use case, is through constructing scenarios ( مسار .(احداث
• A scenario is a description of a sequence of actions that illustrates the execution of a use case instance. In most use cases, several possible scenarios may occur.
٢٤
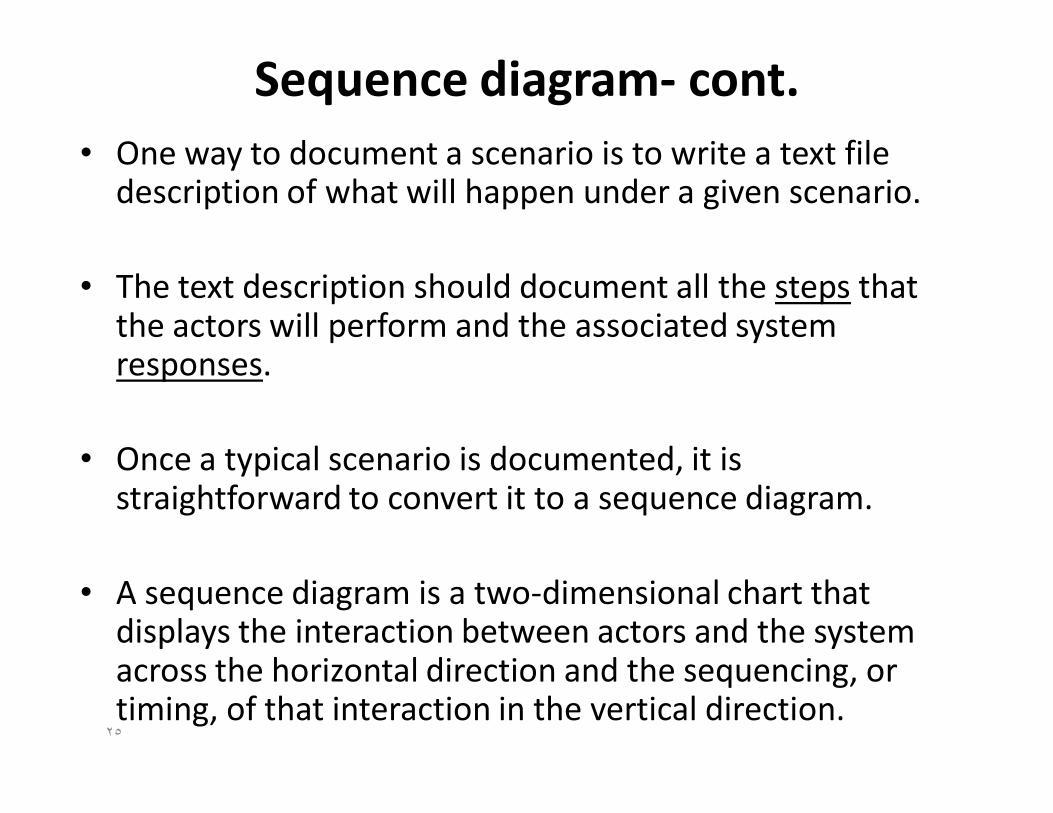
Sequence diagram- cont.
• One way to document a scenario is to write a text file description of what will happen under a given scenario.
• The text description should document all the steps that the actors will perform and the associated system responses.
• Once a typical scenario is documented, it is straightforward to convert it to a sequence diagram.
• A sequence diagram is a two-dimensional chart that displays the interaction between actors and the system across the horizontal direction and the sequencing, or timing, of that interaction in the vertical direction.
٢٥

Sequence diagram: scenario of a use caseScenario 1: Make Sale Use Case Normal Scenario
1. The customer requests a performance and seating preference from the ticket sale system.
2. The system verifies whether the performance and seating are available.
3. The performance and seating are available. The system offers the ticket to the customer.
4. The customer accepts the ticket.
5. The system temporarily places the seating for that performance “on hold” while it processes
the sale.
6. The system requests credit card information from the customer.
7. The customer supplies credit card information.
8. The system requests authorization to debit the credit card from the MasterCard authorization
service (we will assume that MasterCard is the only acceptable form of payment).
9. The system receives the authorization approval.
10. The system confirms the sale to the customer and requests final acceptance of the transaction
by the customer.
11. The customer accepts the transaction.
12. The system bills the price of the ticket(s) to MasterCard.
13. MasterCard accepts the charge.
14. The system changes the status of the ticket from “on hold” to “sold.”
15. The system sends a final confirmation to the customer, which includes the sale transaction
number that the customer will use to pick up the ticket at the box office prior to the performance
(we don’t mail tickets).٢٦

Sequence diagram (scenario 1)
٢٧
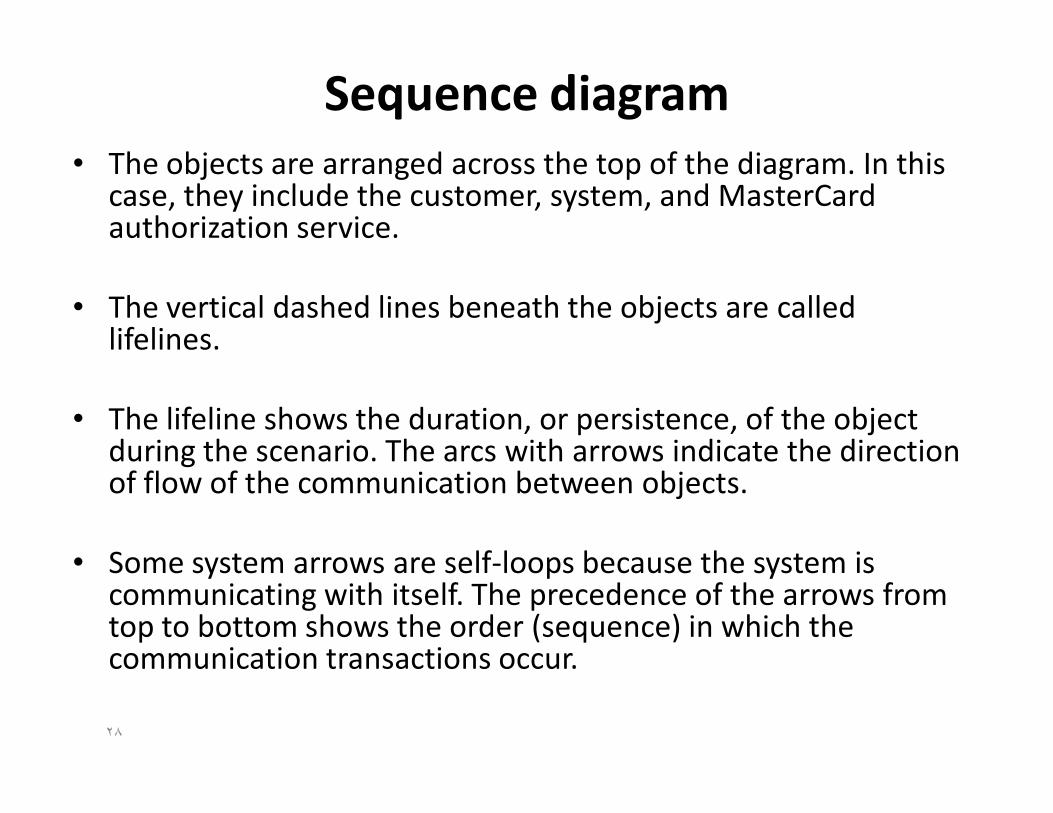
Sequence diagram
• The objects are arranged across the top of the diagram. In this case, they include the customer, system, and MasterCard authorization service.
• The vertical dashed lines beneath the objects are called lifelines.
• The lifeline shows the duration, or persistence, of the object during the scenario. The arcs with arrows indicate the direction of flow of the communication between objects.
• Some system arrows are self-loops because the system is communicating with itself. The precedence of the arrows from top to bottom shows the order (sequence) in which the communication transactions occur.
٢٨

Sequence diagram (scenario 2)
٢٩

Detailed sequence diagram (scenario 1)
٣٠

Detailed sequence diagram
• Embedded in the SYSTEM object are lower-level objects. two main object classes of which the “system” is composed.
• System object is broken down into two components: Ticket Agent and Database Server.
• The Ticket Agent object stores and retrieves information by sending SQL queries to the database server. Information on performances, seating, ticket prices, and sales is kept in a database server, which is the second object class.
• The self-loops previously were shown are queries (functions) and responses between the ticket agent and the database server.
٣١

Detailed sequence diagram-cont.
• The vertical rectangle boxes along the lifeline are activation boxes.
• Activation boxes indicate the beginning and end of the activation of a procedure.
• The procedure usually begins with a message between objects, shown as an arrow having a solid line. The procedure ends with a return arrow to the initiator.
• Messages may be communications or they may be method calls. If a method call returns a value, this is shown as an arrow with a dash line.
٣٢
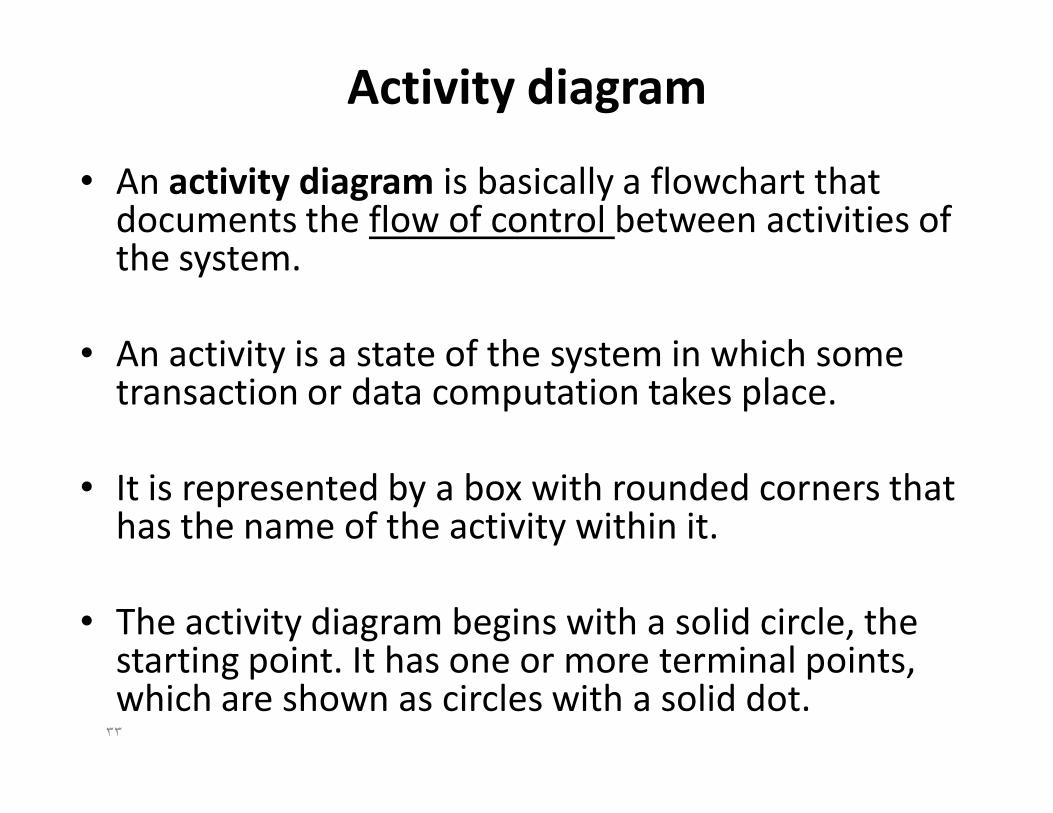
Activity diagram
• An activity diagram is basically a flowchart that documents the flow of control between activities of the system.
• An activity is a state of the system in which some transaction or data computation takes place.
• It is represented by a box with rounded corners that has the name of the activity within it.
• The activity diagram begins with a solid circle, the starting point. It has one or more terminal points, which are shown as circles with a solid dot.
٣٣

Activity diagram-cont.
• In modeling the flow of control, activities are usually followed by decision points, shown as diamonds.
• A decision point models branching behavior when the flow of control is dependent on the outcome of the activity in the state prior to the decision point.
• The directed arcs show the direction of the flow of control. All arcs in an activity diagram are directed arcs.
• Activity diagram includes all transactions and operations of all scenarios carried out by the system.
٣٤

Activity diagram of ticket sales scenario
٣٥

Activity diagram-cont.
• The activity diagram enters a fork, shown as a bar. A forkhas one input arc and more than one output arc. This leads to the activation of more than one activity in parallel.
• When the simultaneous and independent activities are complete, they enter a join. A join has two or more input arcs and one output arc.
• The activity diagram includes all possible scenarios. In fact, when an activity diagram is used to document a use case, the activity diagram should cover all of the scenarios that might occur in the execution of a use case.
٣٦

Activity diagram-cont.
• The string of activities of scenario 1 is as follows:
start → verify seating available → offer seating →
place ticket on hold → request card information
→ request MasterCard authorization → confirm
sale → commit sale and debit credit card →
normal completion.
• The string of activities of scenario 2 : start →
verify seating available → inform customer of
failure → transaction canceled.
٣٧

State chart diagram
• A state chart diagram is a dynamic model that shows the various states that an object can be in and how the object passes through those states over time as a result of events that occur.
• The state chart can capture behavior at various levels of the system, including overall system behavior, class behavior, and detailed behavior of specific objects.
• UML state chart diagrams are a variant of a traditional model of computer behavior known as a finite state machine. A finite state machine is composed of three elements: states, transitions, and event conditions.٣٨

State chart diagram of instances of the
ticket sales system-cont.
٣٩
State chart diagram of instances of the
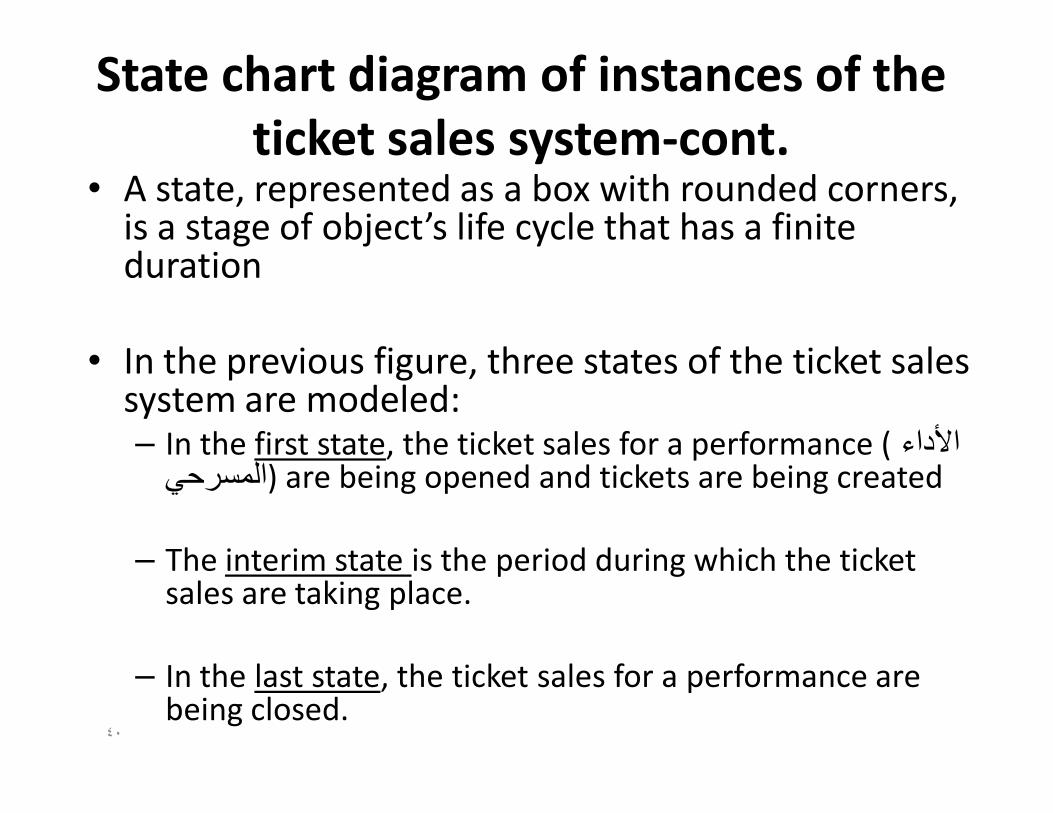
ticket sales system-cont.• A state, represented as a box with rounded corners,
is a stage of object’s life cycle that has a finite duration
• In the previous figure, three states of the ticket sales system are modeled:– In the first state, the ticket sales for a performance ( ا#داء
are being opened and tickets are being created (المسرحي
– The interim state is the period during which the ticket sales are taking place.
– In the last state, the ticket sales for a performance are being closed.
٤٠
State chart diagram of instances of
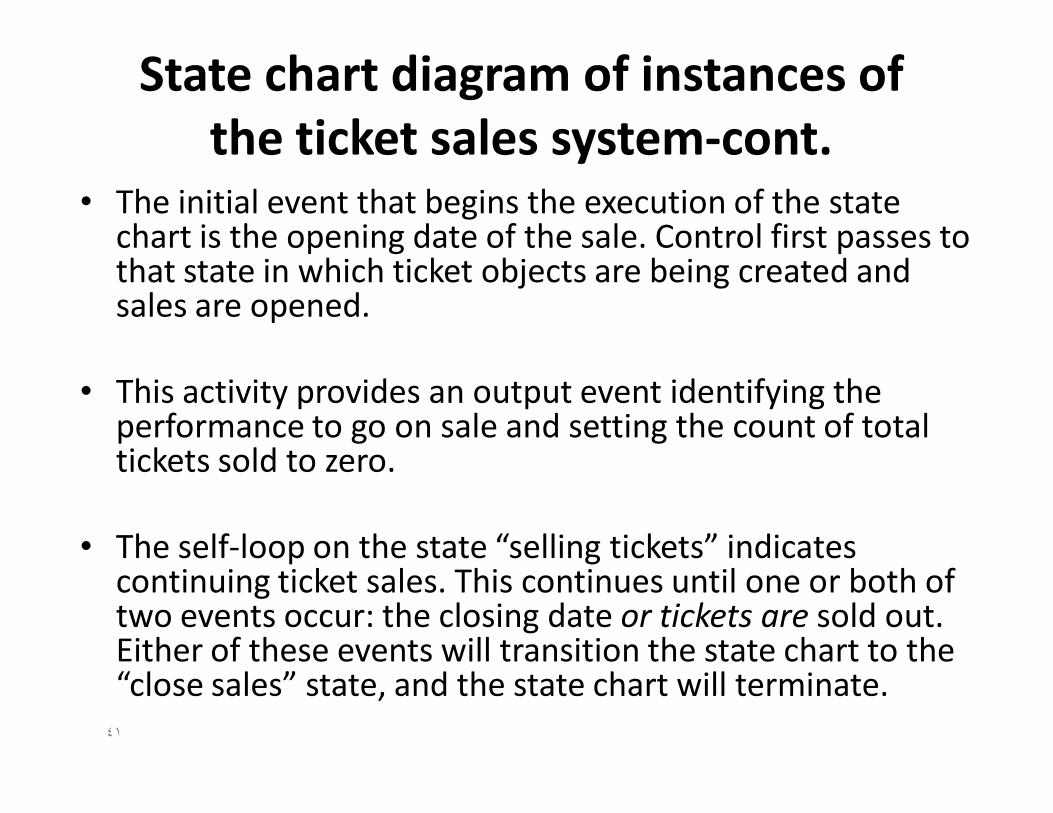
the ticket sales system-cont.• The initial event that begins the execution of the state
chart is the opening date of the sale. Control first passes to that state in which ticket objects are being created and sales are opened.
• This activity provides an output event identifying the performance to go on sale and setting the count of total tickets sold to zero.
• The self-loop on the state “selling tickets” indicates continuing ticket sales. This continues until one or both of two events occur: the closing date or tickets are sold out. Either of these events will transition the state chart to the “close sales” state, and the state chart will terminate.
٤١
State chart diagram-cont.
• In the state chart diagram, the transitions are the connecting arcs between states. A transition is labeled with an event condition that identifies the event that triggers .the transition (يحدث)
• When an object is in a particular state, the output transition of that state is armed (مستعد أو جاھز للحدوث) (ready to be fired). If a transition is armed and the event condition on an output transition is true, the transition will fire and the object’s state changes from the input state of the transition to its output state.
• The event condition is labeled Event Name. The event name is the trigger (condition) that causes the transition to fire; the optional action statement is an action that results from the event.
• For each state, two label; state name at the top, and below are: “Action label/Action expression or activity”.
• Unlike a state, which may be occupied over a period of time, an event and the firing of its transition occur at an instant in time. Transitions can also be self-loops of a state.
٤٢

State chart diagram showing ticket
object states during sales
٤٣

State chart diagram showing ticket
object states during sales-cont.• Here we see that, after creation, a ticket can be in one of three states.
Immediately after creation, it is in the “available” state
• When a ticket is in the available state and the event “place on hold” occurs, the ticket transitions to the “on hold” state. Note that the event “place on hold” is generated by the Ticket Agent object during the “make sales” use case.
• Similarly, when a ticket sale is committed, the state of the object transitions from “on hold” to “sold.” The state chart shows that during the period of sales, the states of the ticket objects are changing from “available” to “sold.”
• When the closing date for ticket sales for a performance occurs, tickets will be in one of two states: available or sold.
• Note that the events of the result in a cancellation of a reservation after a ticket is placed “on hold” but before it is “sold” are captured , the transition labeled “transaction canceled.” This transition takes the ticket back to the “available” state.
٤٤

Class diagram
• The class diagram is the most important UML
model as it defines the object types that can be
created by the system.
• Use case, sequence, activity, and state chart
diagrams should suggest data elements that are
required for the data model.
٤٥

Class diagram
• From the behavior (use case, sequence, activity , state diagram of the tickets sale system), some concepts have been identified: performance, seating, ticket, credit card, and sale. structural relationship between these concepts as follows:
1. A Ticket represents a claim on a Performance and a Seat.
2. Each Performance is associated with many Tickets.
3. Each seat (which we shall call a Location) is associated with many Tickets, since the same seat is used for more than one Performance.
4. A ticket Sale is made for one or more Tickets.
5. A Credit Card is used in each sale.٤٦

Class diagram of the ticket sale system
• Both PERFORMANCE and LOCATION have a one-
to-many relationship with TICKET.
• For a given performance, there will be many
tickets, but each ticket is for one and only one
performance.
• A location has many tickets since the same
location is used over and over again for
different performances.٤٧

Class diagram of the ticket sale system
٤٨

Components of a Class• What is referred to as an “entity set” in relational data
models is analogous to a “class” in OO data models.
• A class diagram is composed of classes, which are the templates for sets of similar objects that have the same attributes and behavior.
• In a class diagram, each class is represented by a box with three distinct sections.
• The name of the class is given in the top panel, analogous to the name of the entity set in relational data models.
• The center panel contains the attributes of the class and their data types.
٤٩

Components of a Class
• Object-oriented models support the usual datatypes of string, integer, date, and so forth, as wellas user-defined data types.
• The third panel contains the behavior of the classin the form of operations that the class canperform on its data — that is, on the values of itsattributes. These operations, which are functionsthat can be called (invoked), are sometimesreferred to as “operations” and sometimes as“methods.”
٥٠

Components of a Class• In OO data models, the operations that are
performed on the data are part of the objectdefinition and reside in the object itself.
• Primary keys are not used to uniquely identify anobject because each object of a class willautomatically be assigned a unique object ID (OID) bythe system when the object is created.
• Methods are shown in the lower panels of theclasses. The method “Commit ( )” in the Ticket class,when invoked, results in the change of status of theTicket object from “on hold” to “sold.” This behaviorwas described in the state chart.٥١

Class Diagram - Associations
• An association in a class diagram is analogous to arelationship in a traditional E-R
• Associations are shown as lines connecting classes.
• The cardinality of the association is shown at each end ofthe line using the notation “<lower limit>..<upper limit>.”
• Cardinalities notations of classes relationships:
– Exactly one “1..1”
– One or more “1..*”
– Zero or one “0..1”
– Zero or more “0..*”٥٢
Class Diagram - Associations-cont.
Aggregation (part
of association)
٥٣

Class Diagram – Associations-cont.
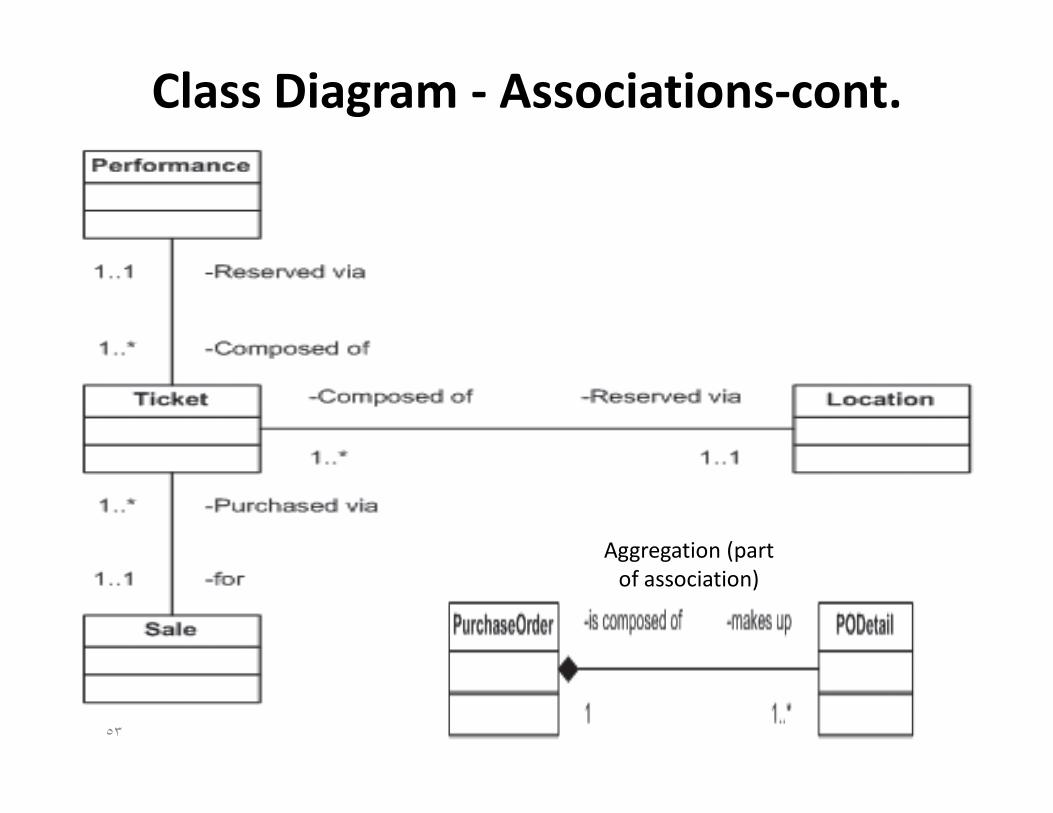
• The association between Performance and Ticket indicates “1..1” on the Performance side and “1..*” on the Ticket side.
• Each performance is associated with one or more tickets, where “*” is the generic “more than.” For a cardinality of zero, one, or more, the notation would be “0..*”, and for exactly 2, it would be “2..2.”
• If the association is called aggregation (parent-child) relationship, the connecting arc has a diamond on the whole side. An example is the association between PurchaseOrder and PODetail.
• The diamond can be either hollow or solid. If the association is optional to the whole, then the diamond is not filled in (hollow). When the association is mandatory to the parent, the diamond is solid.
• For the case of a mandatory association, deletion of the parent object cannot occur without prior deletion of the child object.
٥٤

Class diagram - Generalization
٥٥

Class Diagram- Generalization
• Class diagrams also support superclass/subclass relationships, which are called supertype and subtype generalizations in UML.
• The subtype classes are connected to the supertype classes using arcs with an arrow pointing to the supertype. Each occurrence of a subtype has an “is a” association to the supertype.
• The coverage of the subtypes is indicated by a label on the arc. For example, {disjoint} means that there is no overlapping between subtypes and {incomplete} means that there are material lots of the supertype that are not represented in the subtype, for example, subassemblies.
• So the actual situation can be described by combinations of {overlapping, disjoint} and {incomplete, complete}.
٥٦

Object-Oriented Analysis and
Design: example Use Cases
٥٧

A use case diagram for a university
registration system
٥٨
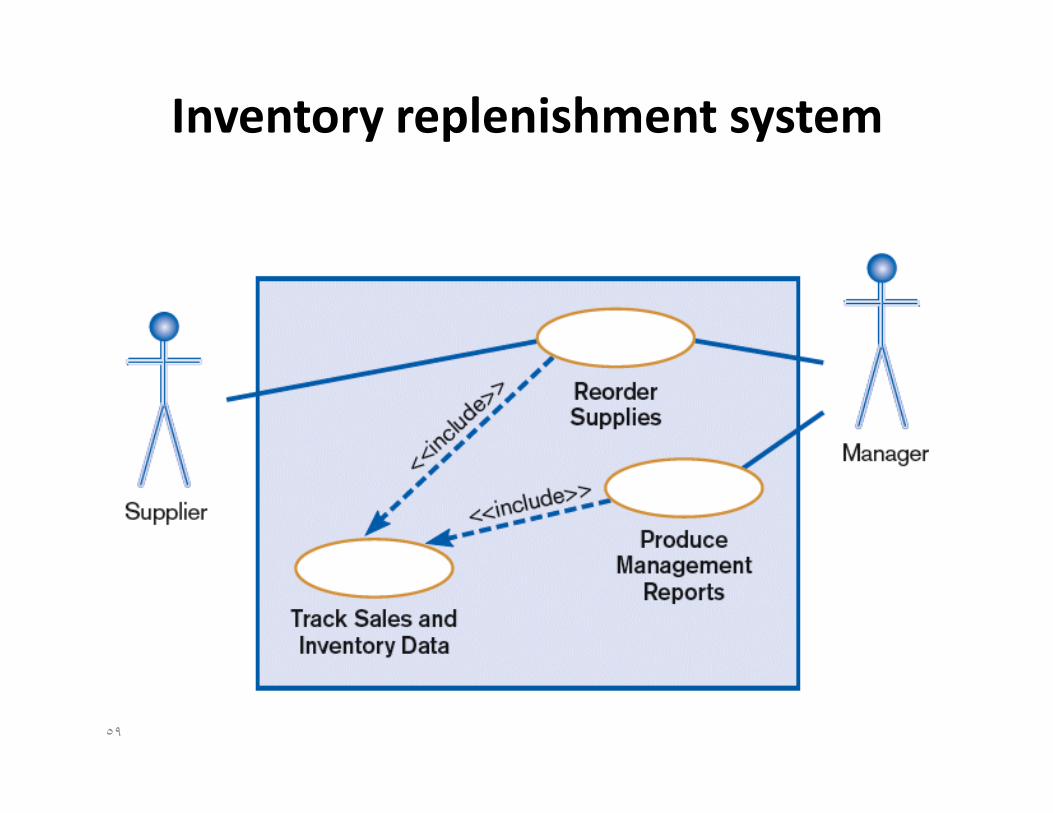
Inventory replenishment system
٥٩

Point of Sales Terminal
٦٠

Point of Sales Terminal
٦١

Object-Oriented Analysis and
Design: example Activity diagrams
٦٢
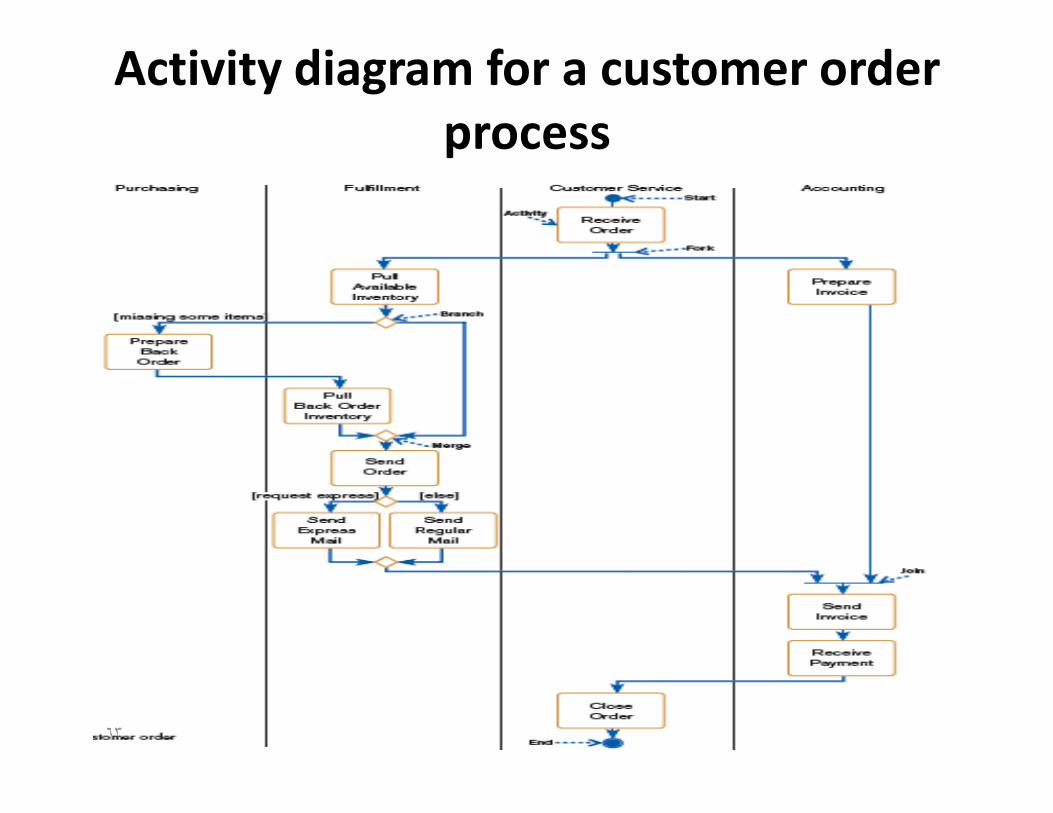
Activity diagram for a customer order
process
٦٣

Process Order activity diagram
٦٤

Object-Oriented Analysis and Design:
example state chart diagram
٦٥
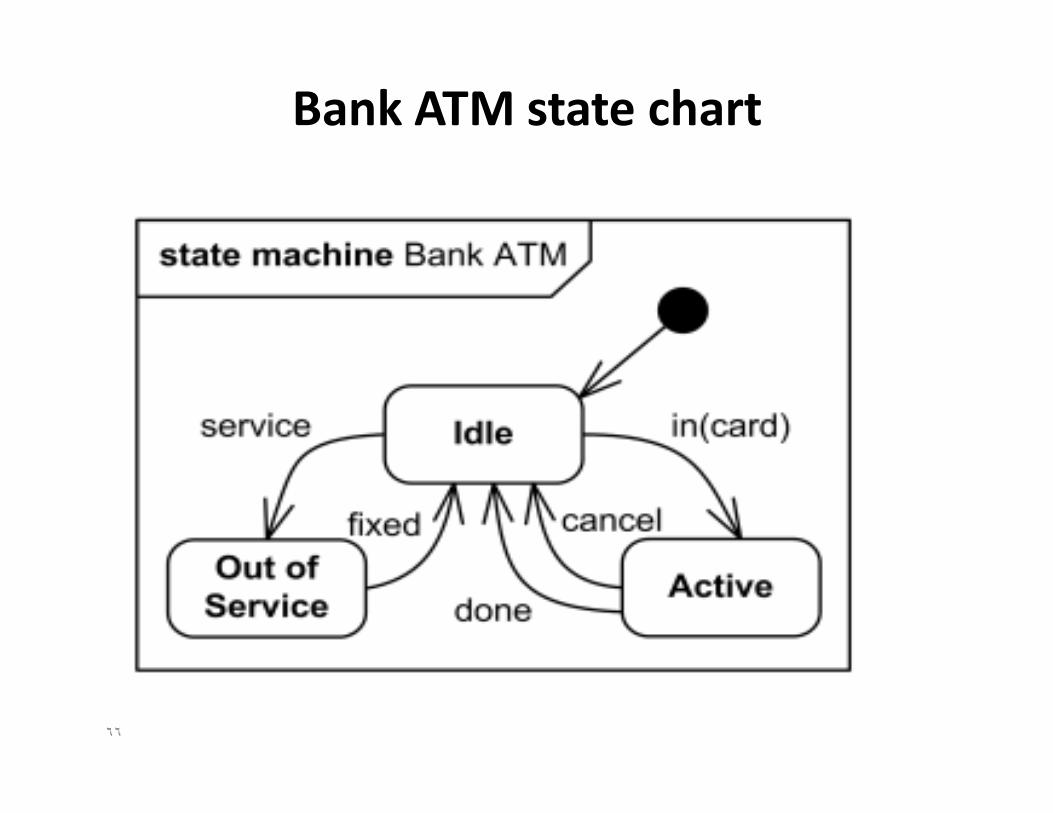
Bank ATM state chart
٦٦

Inventory system state chart
٦٧
Object-Oriented Analysis and Design:
example sequence diagram
٦٨

Course registration sequence diagram
٦٩

Object-Oriented Analysis and Design:
example class diagram
٧٠

Example classes and associations
٧١

Course registration classes
٧٢

Course registration classes
٧٣
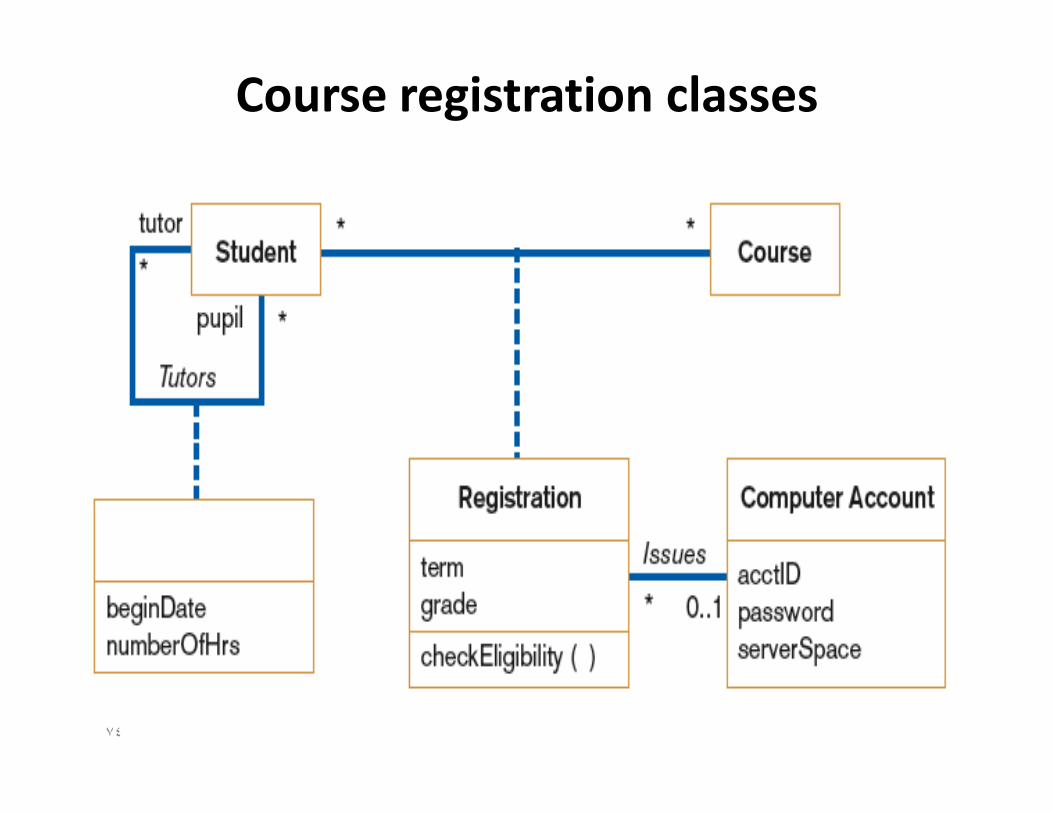
Course registration classes
٧٤

Inventory control system class
diagram
٧٥
UML examples websites/tutorials
•http://www.uml-diagrams.org
٧٦