chapter 5 - marmara Üniversitesimimoza.marmara.edu.tr/~deniz.tufan/enve3003/lecture5.pdflecture...
TRANSCRIPT

LECTURE PRESENTATIONS
For BROCK BIOLOGY OF MICROORGANISMS, THIRTEENTH EDITION
Michael T. Madigan, John M. Martinko, David A. Stahl, David P. Clark
Lectures by
John Zamora
Middle Tennessee State University
© 2012 Pearson Education, Inc.
Microbial Growth
Chapter 5

I. Bacterial Cell Division
• 5.1 Cell Growth and Binary Fission
© 2012 Pearson Education, Inc. Marmara University – Enve3003 Env. Eng. Microbiology – Assist. Prof. Deniz AKGÜL
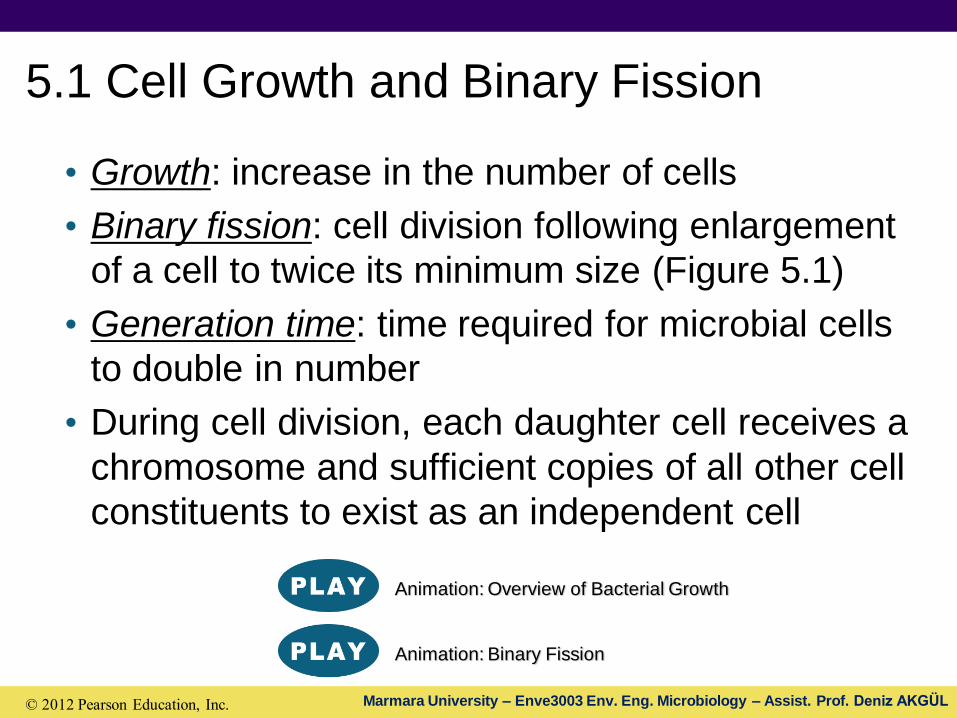
5.1 Cell Growth and Binary Fission
• Growth: increase in the number of cells
• Binary fission: cell division following enlargement
of a cell to twice its minimum size (Figure 5.1)
• Generation time: time required for microbial cells
to double in number
• During cell division, each daughter cell receives a
chromosome and sufficient copies of all other cell
constituents to exist as an independent cell
© 2012 Pearson Education, Inc.
Animation: Binary Fission
Animation: Overview of Bacterial Growth
Marmara University – Enve3003 Env. Eng. Microbiology – Assist. Prof. Deniz AKGÜL

Figure 5.1 Binary fission in a rod-shaped prokaryote
© 2012 Pearson Education, Inc.
Septum
Cellelongation
Septumformation
Completionof septum;formation ofwalls; cellseparation
On
e g
en
era
tio
n
Marmara University – Enve3003 Env. Eng. Microbiology – Assist. Prof. Deniz AKGÜL

II. Population Growth
• 5.5 The Concept of Exponential Growth
• 5.6 The Mathematics of Exponential Growth
• 5.7 The Microbial Growth Cycle
• 5.8 Continuous Culture: The Chemostat
© 2012 Pearson Education, Inc. Marmara University – Enve3003 Env. Eng. Microbiology – Assist. Prof. Deniz AKGÜL

5.5 The Concept of Exponential Growth
• Most bacteria have shorter generation times
than eukaryotic microbes
• Generation time is dependent on growth
medium and incubation conditions
© 2012 Pearson Education, Inc. Marmara University – Enve3003 Env. Eng. Microbiology – Assist. Prof. Deniz AKGÜL

5.5 The Concept of Exponential Growth
• Exponential growth: growth of a microbial
population in which cell numbers double
within a specific time interval
• During exponential growth, the increase in
cell number is initially slow but increases at a
faster rate (Figure 5.8)
© 2012 Pearson Education, Inc. Marmara University – Enve3003 Env. Eng. Microbiology – Assist. Prof. Deniz AKGÜL

Figure 5.8 The rate of growth of a microbial culture
© 2012 Pearson Education, Inc.
Time (h)
Logarithmicplot
Arithmeticplot
Nu
mb
er
of c
ell
s(a
rith
me
tic
sc
ale
)
Nu
mb
er
of c
ell
s(l
og
ari
thm
ic s
cale
)1000
500
100
0 1 2 3 4 5 1
10
102
103
Marmara University – Enve3003 Env. Eng. Microbiology – Assist. Prof. Deniz AKGÜL

5.6 The Mathematics of Exponential
Growth
• A relationship exists between the initial number of
cells present in a culture and the number present
after a period of exponential growth:
N = N02n
N is the final cell number
N0 is the initial cell number
n is the number of generations during the
period of exponential growth
© 2012 Pearson Education, Inc. Marmara University – Enve3003 Env. Eng. Microbiology – Assist. Prof. Deniz AKGÜL

5.6 The Mathematics of Exponential
Growth
• Generation time (g) of the exponentially
growing population is
g = t/n
t is the duration of exponential growth
n is the number of generations during
the period of exponential growth
© 2012 Pearson Education, Inc. Marmara University – Enve3003 Env. Eng. Microbiology – Assist. Prof. Deniz AKGÜL

5.6 The Mathematics of Exponential
Growth
• Specific growth rate (k) is
calculated as
k = 0.30/g
• Division rate (v) is
calculated as
v = 1/g
© 2012 Pearson Education, Inc.
Figure 5.9 Calculating microbial growth parameters.
Method of estimating the generation times (g) of
exponentially growing populations with generation
times of 2 h from data plotted on semilogarithmic
graphs. The slope of line is equal to 0.30/g, and n is
the number of generations in the time t.
0.152
log(2)Slopek
Marmara University – Enve3003 Env. Eng. Microbiology – Assist. Prof. Deniz AKGÜL

5.7 The Microbial Growth Cycle
• Batch culture: a closed-system microbial culture
of fixed volume
• Typical growth curve for population of cells grown
in a closed system is characterized by four
phases (Figure 5.10):
– Lag phase
– Exponential phase
– Stationary phase
– Death phase
© 2012 Pearson Education, Inc.
Animation: Bacterial Growth Curve
Marmara University – Enve3003 Env. Eng. Microbiology – Assist. Prof. Deniz AKGÜL

Figure 5.10 Typical growth curve for a bacterial population
Time
Lo
g10 v
iab
le
org
an
ism
s/m
l
Op
tical
den
sit
y (
OD
) 10
9
8
7
6
1.0
0.75
0.50
0.25
0.1
Viable count
Turbidity (optical density)
Lag Exponential Stationary Death
Growth phases
© 2012 Pearson Education, Inc.
A viable count measures the cells in the culture that are capable of
reproducing. Optical density (turbidity), a quantitative measure of light
scattering by a liquid culture, increases with the increase in cell number.
Marmara University – Enve3003 Env. Eng. Microbiology – Assist. Prof. Deniz AKGÜL

5.7 The Microbial Growth Cycle
• Lag phase
– Interval between when a culture is inoculated
and when growth begins
• Exponential phase
– Cells in this phase are typically in the
healthiest state
• Stationary phase
– Growth rate of population is zero
– Either an essential nutrient is used up or
waste product of the organism accumulates
in the medium
© 2012 Pearson Education, Inc. Marmara University – Enve3003 Env. Eng. Microbiology – Assist. Prof. Deniz AKGÜL

5.7 The Microbial Growth Cycle
• Death Phase
– If incubation continues after cells reach
stationary phase, the cells will eventually die
© 2012 Pearson Education, Inc. Marmara University – Enve3003 Env. Eng. Microbiology – Assist. Prof. Deniz AKGÜL

5.8 Continuous Culture: The Chemostat
• Continuous culture: an open-system microbial
culture of fixed volume
• Chemostat: most common type of continuous
culture device (Figure 5.11)
– Both growth rate and population density of culture
can be controlled independently and
simultaneously
• Dilution rate: rate at which fresh medium is pumped
in and spent medium is pumped out (mean cell
residence time or hydraulic retention time ‘HRT’)
• Concentration of a limiting nutrient
© 2012 Pearson Education, Inc. Marmara University – Enve3003 Env. Eng. Microbiology – Assist. Prof. Deniz AKGÜL

Figure 5.11 Schematic for a continuous culture device (chemostat)
© 2012 Pearson Education, Inc.
Fresh mediumfrom reservoir
Sterile air orother gas
Flow-rateregulator
Gaseous headspace
Culturevessel
Culture
Overflow
Effluent containingmicrobial cells
The population density is controlled by the concentration of limiting
nutrient in the reservoir, and the growth rate is controlled by the flow rate.
Both parameters can be set by the experimenter. Marmara University – Enve3003 Env. Eng. Microbiology – Assist. Prof. Deniz AKGÜL

5.8 Continuous Culture: The Chemostat
• In a chemostat
– The growth rate is controlled by dilution rate
– The growth yield (cell number/ml) is controlled
by the concentration of the limiting nutrient
• In a batch culture, growth conditions are
constantly changing; it is impossible to
independently control both growth
parameters (Figure 5.12)
© 2012 Pearson Education, Inc. Marmara University – Enve3003 Env. Eng. Microbiology – Assist. Prof. Deniz AKGÜL

Figure 5.12 The effect of nutrients on growth
© 2012 Pearson Education, Inc.
Only yield affectedG
row
th r
ate
( )
Nutrient concentration (mg/ml)
Gro
wth
yie
ld (
)
0 0.1 0.2 0.3 0.4 0.5
Rate andyield affected
Relationship between nutrient concentration, growth rate (green curve),
and growth yield (red curve) in a batch culture (closed system). Only at
low nutrient concentrations are both growth rate and growth yield affected.
Marmara University – Enve3003 Env. Eng. Microbiology – Assist. Prof. Deniz AKGÜL

5.8 Continuous Culture: The Chemostat
• Chemostat cultures are sensitive to the dilution
rate and limiting nutrient concentration
(Figure 5.13)
– At too high a dilution rate, the organism is
washed out
– At too low a dilution rate, the cells may die from
starvation
– Increasing concentration of a limiting nutrient
results in greater biomass but same growth
rate
© 2012 Pearson Education, Inc. Marmara University – Enve3003 Env. Eng. Microbiology – Assist. Prof. Deniz AKGÜL

Figure 5.13 Steady-state relationships in the chemostat
© 2012 Pearson Education, Inc.
5 Bacterial concentration
Do
ub
lin
g t
ime (
h)
Ste
ad
y-s
tate
bacte
rial
co
ncen
trati
on
(g
/l)
Steady state
Washout
4
3
2
1
00 0.25 0.5 0.75 1.0
4
6
2
0
Dilution rate (h1)
At high dilution rates, growth cannot balance dilution, and the population
washes out. Although the population density remains constant during
steady state, the growth rate (doubling time) can vary over a wide range.
Marmara University – Enve3003 Env. Eng. Microbiology – Assist. Prof. Deniz AKGÜL

III. Measuring Microbial Growth
• 5.9 Microscopic Counts
• 5.10 Viable Counts
• 5.11 Turbidimetric Methods
© 2012 Pearson Education, Inc. Marmara University – Enve3003 Env. Eng. Microbiology – Assist. Prof. Deniz AKGÜL

5.9 Microscopic Counts
• Microbial cells are enumerated by microscopic
observations (Figure 5.14)
– Results can be unreliable
© 2012 Pearson Education, Inc. Marmara University – Enve3003 Env. Eng. Microbiology – Assist. Prof. Deniz AKGÜL

Figure 5.14 Direct microscopic counting procedure using the Petroff–Hausser counting chamber
© 2012 Pearson Education, Inc. Marmara University – Enve3003 Env. Eng. Microbiology – Assist. Prof. Deniz AKGÜL

5.9 Microscopic Counts
• Limitations of microscopic counts
– Cannot distinguish between live and dead cells
without special stains
– Small cells can be overlooked
– Precision is difficult to achieve
– Phase-contrast microscope required if a stain is
not used
– Cell suspensions of low density (<106 cells/ml)
hard to count
– Motile cells need to immobilized
– Debris in sample can be mistaken for cells
© 2012 Pearson Education, Inc. Marmara University – Enve3003 Env. Eng. Microbiology – Assist. Prof. Deniz AKGÜL

5.9 Microscopic Counts
• A second method for enumerating cells in
liquid samples is with a flow cytometer
– Uses laser beams, fluorescent dyes, and
electronics
© 2012 Pearson Education, Inc. Marmara University – Enve3003 Env. Eng. Microbiology – Assist. Prof. Deniz AKGÜL

5.10 Viable Counts
• Viable cell counts (plate counts):
measurement of living, reproducing
population
– Two main ways to perform plate counts:
• Spread-plate method (Figure 5.15)
• Pour-plate method
• To obtain the appropriate colony number, the
sample to be counted should always be
diluted (Figure 5.16)
© 2012 Pearson Education, Inc. Marmara University – Enve3003 Env. Eng. Microbiology – Assist. Prof. Deniz AKGÜL

Figure 5.15 Two methods for the viable count
Sample is pipetted onto
surface of agar plate
(0.1 ml or less)
Sample is spread evenly
over surface of agar
using sterile glass
spreader
Typical spread-plate
results
Surface
colonies
Surface
colonies
Subsurface
colonies
Typical pour-plate
results Sample is pipetted into
sterile plate
Sterile medium is
added and mixed
well with inoculum
Spread-plate method
Pour-plate method
Incubation
Solidification
and incubation
© 2012 Pearson Education, Inc.
Colonies of
Escherichia coli
formed from cells
plated by the spread-
plate method (top) or
the pour-plate
method (bottom)
Colonies form within
the agar as well as
on the agar surface
Marmara University – Enve3003 Env. Eng. Microbiology – Assist. Prof. Deniz AKGÜL

Figure 5.16 Procedure for viable counting using serial dilutions of the sample and the pour-plate method
© 2012 Pearson Education, Inc.
Sample to
be counted1 ml
1 ml 1 ml 1 ml 1 ml 1 ml
9-ml
broth
Total dilution
Plate 1-ml samples
1/10
(101)
1/100
(102)
1/103
(103)
1/104
(104)
1/105
(105)1/106
(106)
159 103 1.59 105Plate
countDilution
factor
Cells (colony-forming units)
per milliliter of original sample
159
colonies
17
colonies
2
colonies0
coloniesToo many colonies
to count
The sterile liquid used for
making dilutions can simply
be water, but a solution of
mineral salts or actual
growth medium may yield a
higher recovery.
Marmara University – Enve3003 Env. Eng. Microbiology – Assist. Prof. Deniz AKGÜL

5.10 Viable Counts
• Plate counts can be highly unreliable when
used to assess total cell numbers of natural
samples (e.g., soil and water)
– Selective culture media and growth conditions
target only particular species
© 2012 Pearson Education, Inc. Marmara University – Enve3003 Env. Eng. Microbiology – Assist. Prof. Deniz AKGÜL

5.10 Viable Cell Counting
• The Great Plate Anomaly: direct microscopic
counts of natural samples reveal far more
organisms than those recoverable on plates
• Why is this?
– Microscopic methods count dead cells
whereas viable methods do not
– Different organisms may have vastly different
requirements for growth
© 2012 Pearson Education, Inc. Marmara University – Enve3003 Env. Eng. Microbiology – Assist. Prof. Deniz AKGÜL

5.11 Turbidimetric Methods
• Turbidity measurements are an indirect, rapid,
and useful method of measuring microbial
growth (Figure 5.17a)
– Most often measured with a spectrophotometer
and measurement referred to as optical density
(O.D.)
© 2012 Pearson Education, Inc. Marmara University – Enve3003 Env. Eng. Microbiology – Assist. Prof. Deniz AKGÜL

Figure 5.17a Turbidity measurements of microbial growth
© 2012 Pearson Education, Inc.
Light
Prism
Incident light, I0
Filter
Sample containing
cells ( )
Unscattered light, I
Photocell (measures
unscattered light, I )
Spectrophotometer
Optical density (OD)
LogI0
I
Measurements of turbidity
are made in a
spectrophotometer.
The photocell measures
incident light unscattered by
cells in suspension and
gives readings in optical
density units.
Marmara University – Enve3003 Env. Eng. Microbiology – Assist. Prof. Deniz AKGÜL

5.11 Turbidimetric Methods
• To relate a direct cell count to a turbidity
value, a standard curve must first be
established (Figure 5.17c)
© 2012 Pearson Education, Inc. Marmara University – Enve3003 Env. Eng. Microbiology – Assist. Prof. Deniz AKGÜL

Figure 5.17c Turbidity measurements of microbial growth
Theoretical
Actual
Cell numbers or mass
(dry weight)
Op
tical
den
sit
y
0.8
0.6
0.4
0.3
0.2
0.1
0.5
0.7
© 2012 Pearson Education, Inc.
The one-to one
correspondence between
these relationships breaks
down at high turbidities
Relationship between cell
number or dry weight and
turbidity readings.
Marmara University – Enve3003 Env. Eng. Microbiology – Assist. Prof. Deniz AKGÜL

5.11 Turbidimetric Methods
• Turbidity measurements
– Quick and easy to perform
– Typically do not require destruction or
significant disturbance of sample
– Sometimes problematic (e.g., microbes that
form clumps or biofilms in liquid medium)
© 2012 Pearson Education, Inc. Marmara University – Enve3003 Env. Eng. Microbiology – Assist. Prof. Deniz AKGÜL

IV. Temperature and Microbial
Growth
• 5.12 Effect of Temperature on Growth
• 5.13 Microbial Life in the Cold
• 5.14 Microbial Life at High Temperatures
© 2012 Pearson Education, Inc. Marmara University – Enve3003 Env. Eng. Microbiology – Assist. Prof. Deniz AKGÜL

5.12 Effect of Temperature on Growth
• Temperature is a major environmental factor
controlling microbial growth
• Cardinal temperatures: the minimum,
optimum, and maximum temperatures at
which an organism grows (Figure 5.18)
© 2012 Pearson Education, Inc. Marmara University – Enve3003 Env. Eng. Microbiology – Assist. Prof. Deniz AKGÜL

Figure 5.18 The cardinal temperatures: minimum, optimum, and maximum
© 2012 Pearson Education, Inc.
Enzymatic reactions occurringat maximal possible rate
Enzymatic reactions occurringat increasingly rapid rates
Membrane gelling; transportprocesses so slow that growthcannot occur
Protein denaturation; collapseof the cytoplasmic membrane;thermal lysis
Temperature
Gro
wth
ra
te
Minimum
Optimum
Maximum
Actual
values
may vary
greatly for
different
organisms
Marmara University – Enve3003 Env. Eng. Microbiology – Assist. Prof. Deniz AKGÜL

5.12 Effect of Temperature on Growth
• Microorganisms can be classified into groups by
their growth temperature optima (Figure 5.19)
– Psychrophile: low temperature
– Mesophile: midrange temperature
– Thermophile: high temperature
– Hyperthermophile: very high temperature
© 2012 Pearson Education, Inc. Marmara University – Enve3003 Env. Eng. Microbiology – Assist. Prof. Deniz AKGÜL

Figure 5.19 Temperature and growth response in different temperature classes of microorganisms
© 2012 Pearson Education, Inc.
Temperature (oC)
Gro
wth
ra
te
Psychrophile
Mesophile
Thermophile
Hyperthermophile Hyperthermophile
0 10 20 30 40 50 60 70 80 90 100 110 120
4°
39°
60°88° 106°
Example:Polaromonas vacuolata
Example:Escherichia coli
Example:Geobacillusstearothermophilus Example:
Thermococcus celer
Example:Pyrolobus fumarii
Marmara University – Enve3003 Env. Eng. Microbiology – Assist. Prof. Deniz AKGÜL

5.12 Effect of Temperature on Growth
• Mesophiles: organisms that have midrange
temperature optima; found in
– Warm-blooded animals
– Terrestrial and aquatic environments
– Temperate and tropical latitudes
© 2012 Pearson Education, Inc. Marmara University – Enve3003 Env. Eng. Microbiology – Assist. Prof. Deniz AKGÜL

5.13 Microbial Life in the Cold
• Extremophiles
– Organisms that grow under very hot or very cold conditions
• Psychrophiles
– Organisms with cold temperature optima
– Inhabit permanently cold environments (Figure 5.20)
• Psychrotolerant
– Organisms that can grow at 0ºC but have optima of 20ºC to 40ºC
– More widely distributed in nature than psychrophiles
© 2012 Pearson Education, Inc. Marmara University – Enve3003 Env. Eng. Microbiology – Assist. Prof. Deniz AKGÜL

5.13 Microbial Life in the Cold
• Molecular Adaptations to Psychrophily
– Production of enzymes that function optimally
in the cold; features that may provide more
flexibility
• More -helices than -sheets
• More polar and less hydrophobic amino acids
• Fewer weak bonds
• Decreased interactions between protein
domains
© 2012 Pearson Education, Inc. Marmara University – Enve3003 Env. Eng. Microbiology – Assist. Prof. Deniz AKGÜL

5.13 Microbial Life in the Cold
• Molecular Adaptations to Psychrophily (cont’d)
– Transport processes function optimally at low
temperatures
• Modified cytoplasmic membranes
– High unsaturated fatty acid content
© 2012 Pearson Education, Inc. Marmara University – Enve3003 Env. Eng. Microbiology – Assist. Prof. Deniz AKGÜL

5.14 Microbial Life at High Temperatures
• Above ~65 oC, only prokaryotic life forms exist
• Thermophiles: organisms with growth temperature
optima between 45 oC and 80 oC
• Hyperthermophiles: organisms with optima greater
than 80 oC
– Inhabit hot environments including boiling hot
springs and seafloor hydrothermal vents that can
have temperatures in excess of 100 oC
© 2012 Pearson Education, Inc. Marmara University – Enve3003 Env. Eng. Microbiology – Assist. Prof. Deniz AKGÜL

5.14 Microbial Life at High Temperatures
• Hyperthermophiles in Hot Springs
– Chemoorganotrophic and chemolithotrophic
species present (Figure 5.22)
– High prokaryotic diversity (both Archaea and
Bacteria represented)
© 2012 Pearson Education, Inc. Marmara University – Enve3003 Env. Eng. Microbiology – Assist. Prof. Deniz AKGÜL

Figure 5.22 Growth of hyperthermophiles in boiling water
© 2012 Pearson Education, Inc.
(a) Boulder Spring, a
small boiling spring in
Yellowstone National
Park. This spring is
superheated, having a
temperature 1-2 oC above
the boiling point. The
mineral deposits around
the spring consist mainly
of silica and sulfur.
(b) Photomicrograph of a
microcolony of
prokaryotes that
developed on a
microscope slide
immersed in such a
boiling spring.
Marmara University – Enve3003 Env. Eng. Microbiology – Assist. Prof. Deniz AKGÜL

5.14 Microbial Life at High Temperatures
• Studies of thermal habitats have revealed
– Prokaryotes are able to grow at higher
temperatures than eukaryotes
– Organisms with the highest temperature
optima are Archaea
– Nonphototrophic organisms can grow at
higher temperatures than phototrophic
organisms
© 2012 Pearson Education, Inc. Marmara University – Enve3003 Env. Eng. Microbiology – Assist. Prof. Deniz AKGÜL

5.14 Microbial Life at High Temperatures
• Molecular Adaptations to Thermophily
– Enzyme and proteins function optimally at high
temperatures; features that provide thermal
stability
• Critical amino acid substitutions in a few locations
provide more heat-tolerant folds
• An increased number of ionic bonds between basic
and acidic amino acids resist unfolding in the
aqueous cytoplasm
• Production of solutes (e.g., di-inositol phophate,
diglycerol phosphate) help stabilize proteins
© 2012 Pearson Education, Inc. Marmara University – Enve3003 Env. Eng. Microbiology – Assist. Prof. Deniz AKGÜL

5.14 Microbial Life at High Temperatures
• Molecular Adaptations to Thermophily (cont’d)
– Modifications in cytoplasmic membranes to
ensure heat stability
• Bacteria have lipids rich in saturated fatty acids
• Archaea have lipid monolayer rather than bilayer
© 2012 Pearson Education, Inc. Marmara University – Enve3003 Env. Eng. Microbiology – Assist. Prof. Deniz AKGÜL

V. Other Environmental Factors
Affecting Growth
• 5.15 Acidity and Alkalinity
• 5.16 Osmotic Effects on Microbial Growth
• 5.17 Oxygen and Microorganisms
• 5.18 Toxic Forms of Oxygen
© 2012 Pearson Education, Inc. Marmara University – Enve3003 Env. Eng. Microbiology – Assist. Prof. Deniz AKGÜL

5.15 Acidity and Alkalinity
• The pH of an environment greatly affects
microbial growth (Figure 5.24)
• Some organisms have evolved to grow best
at low or high pH, but most organisms grow
best between pH 6 and 8 (neutrophiles)
© 2012 Pearson Education, Inc. Marmara University – Enve3003 Env. Eng. Microbiology – Assist. Prof. Deniz AKGÜL

Figure 5.24 The pH scale
© 2012 Pearson Education, Inc.
Volcanic soils, watersGastric fluidsLemon juiceAcid mine drainageVinegar
RhubarbPeaches
Acid soilTomatoes
American cheeseCabbage
PeasCorn, salmon, shrimp
Pure water
Seawater
Very alkalinenatural soil
Alkaline lakes
Soap solutions
Household ammoniaExtremely alkaline
soda lakes
Lime (saturated solution)
Neutrality
Increasingacidity
Increasingalkalinity
107 107
Ac
ido
ph
ile
sA
lka
lip
hile
s
pH Example Moles per liter of:H OH
101
102
103
104
105
106
108
109
1010
1011
1012
1013
1014
1014
1013
1012
1011
1010
109
108
106
105
104
103
102
101
1
1
Although some
microorganisms
can live at very low
or very high pH,
the cell’s internal
pH remains near
neutrality.
Marmara University – Enve3003 Env. Eng. Microbiology – Assist. Prof. Deniz AKGÜL

5.15 Acidity and Alkalinity
• Acidophiles: organisms that grow best at low
pH (<6)
– Some are obligate acidophiles; membranes
destroyed at neutral pH
– Stability of cytoplasmic membrane critical
• Alkaliphiles: organisms that grow best at high
pH (>9)
– Some have sodium motive force rather than
proton motive force
© 2012 Pearson Education, Inc. Marmara University – Enve3003 Env. Eng. Microbiology – Assist. Prof. Deniz AKGÜL

5.15 Acidity and Alkalinity
• The internal pH of a cell must stay relatively
close to neutral even though the external pH
is highly acidic or basic
– Internal pH has been found to be as low as
4.6 and as high as 9.5 in extreme acido- and
alkaliphiles, respectively
• Microbial culture media typically contain
buffers to maintain constant pH
© 2012 Pearson Education, Inc. Marmara University – Enve3003 Env. Eng. Microbiology – Assist. Prof. Deniz AKGÜL

5.16 Osmotic Effects on Microbial Growth
• Water activity (aw): water availability;
expressed in physical terms
– Defined as ratio of vapor pressure of air in
equilibrium with a substance or solution to the
vapor pressure of pure water
© 2012 Pearson Education, Inc. Marmara University – Enve3003 Env. Eng. Microbiology – Assist. Prof. Deniz AKGÜL

5.16 Osmotic Effects on Microbial Growth
• Typically, the cytoplasm has a higher solute
concentration than the surrounding
environment, thus the tendency is for water to
move into the cell (positive water balance)
• When a cell is in an environment with a higher
external solute concentration, water will flow
out unless the cell has a mechanism to
prevent this
© 2012 Pearson Education, Inc. Marmara University – Enve3003 Env. Eng. Microbiology – Assist. Prof. Deniz AKGÜL

5.16 Osmotic Effects on Microbial Growth
• Halophiles: organisms that grow best at reduced
water potential; have a specific requirement for
NaCl (Figure 5.25)
• Extreme halophiles: organisms that require high
levels (15–30%) of NaCl for growth
• Halotolerant: organisms that can tolerate some
reduction in water activity of environment but
generally grow best in the absence of the added
solute
© 2012 Pearson Education, Inc. Marmara University – Enve3003 Env. Eng. Microbiology – Assist. Prof. Deniz AKGÜL

Figure 5.25 Effect of sodium chloride (NaCl) concentration on growth of microorganisms of different salt
tolerances or requirements.
© 2012 Pearson Education, Inc.
Example:Staphylococcusaureus
Example:Aliivibrio fischeri Example:
Halobacteriumsalinarum
Example:Escherichia coli
NaCl (%)
Gro
wth
ra
te
0 5 10 15 20
Nonhalophile
Halotolerant Halophile Extremehalophile
Optimum NaCl concentration for extreme halophiles, it is between 15-30%
Marmara University – Enve3003 Env. Eng. Microbiology – Assist. Prof. Deniz AKGÜL

5.16 Osmotic Effects on Microbial Growth
• Osmophiles: organisms that live in
environments high in sugar as solute
• Xerophiles: organisms able to grow in very
dry environments
© 2012 Pearson Education, Inc. Marmara University – Enve3003 Env. Eng. Microbiology – Assist. Prof. Deniz AKGÜL

5.16 Osmotic Effects on Microbial Growth
• Mechanisms for combating low water activity in
surrounding environment involve increasing the
internal solute concentration by
– Pumping inorganic ions from environment
into cell
– Synthesis or concentration of organic solutes
• compatible solutes: compounds used by cell to
counteract low water activity in surrounding
environment
© 2012 Pearson Education, Inc. Marmara University – Enve3003 Env. Eng. Microbiology – Assist. Prof. Deniz AKGÜL

5.17 Oxygen and Microorganisms
• Aerobes: require oxygen to live
• Anaerobes: do not require oxygen and may even
be killed by exposure
• Facultative organisms: can live with or without
oxygen
• Aerotolerant anaerobes: can tolerate oxygen and
grow in its presence even though they cannot
use it
• Microaerophiles: can use oxygen only when it is
present at levels reduced from that in air
© 2012 Pearson Education, Inc. Marmara University – Enve3003 Env. Eng. Microbiology – Assist. Prof. Deniz AKGÜL

5.17 Oxygen and Microorganisms
• Thioglycolate broth (Figure 5.26)
– Complex medium that separates microbes
based on oxygen requirements
– Reacts with oxygen so oxygen can only
penetrate the top of the tube
© 2012 Pearson Education, Inc. Marmara University – Enve3003 Env. Eng. Microbiology – Assist. Prof. Deniz AKGÜL

Figure 5.26 Growth versus oxygen (O2) concentration
© 2012 Pearson Education, Inc.
Oxic zone
Anoxic zone
(a) O2 penetrates only a short
distance into the tube, so
obligate aerobes grow only
close to the surface.
(b) Anaerobes, being sensitive to
O2, grow only away from the
surface.
(c) Facultative aerobes are able to
grow in either the presence or
the absence of O2 and thus
grow throughout the tube.
However, growth is better near
the surface because these
organisms can respire.
(d) Microaerophiles grow away
from the most oxic zone.
(e) Aerotolerant anaerobes grow
throughout the tube. Growth is
not better near the surface
because these organisms can
only ferment.
The redox dye, resazurin, which is pink when oxidized and colorless when reduced, has
been added as a redox indicator.
Aero
bes
Anaero
bes
Facultative a
ero
bes
Mic
roaero
phile
s
Aero
tole
rant
anaero
bes
Marmara University – Enve3003 Env. Eng. Microbiology – Assist. Prof. Deniz AKGÜL

5.17 Oxygen and Microorganisms
• Special techniques are needed to grow
aerobic and anaerobic microorganisms
(Figure 5.27)
• Reducing agents: chemicals that may be
added to culture media to reduce oxygen
(e.g., thioglycolate)
© 2012 Pearson Education, Inc. Marmara University – Enve3003 Env. Eng. Microbiology – Assist. Prof. Deniz AKGÜL

Figure 5.27 Incubation under anoxic conditions
© 2012 Pearson Education, Inc.
A chemical reaction in the envelope
in the jar generates H2 + CO2. The H2
reacts with O2 in the jar on the
surface of a palladium catalyst to
yield H2O; the final atmosphere
contains N2, H2, and CO2.
Anoxic jar
Anoxic glove bag for manipulating and incubating cultures under anoxic
conditions. The airlock on the right, which can be evacuated and filled
with O2-free gas, serves as a port for adding and removing materials to
and from the glove bag.
Anoxic glove bag
Marmara University – Enve3003 Env. Eng. Microbiology – Assist. Prof. Deniz AKGÜL

5.18 Toxic Forms of Oxygen
• Several toxic forms of oxygen can be formed
in the cell (Figure 5.28):
– Single oxygen
– Superoxide anion
– Hydrogen peroxide
– Hydroxyl radical
© 2012 Pearson Education, Inc. Marmara University – Enve3003 Env. Eng. Microbiology – Assist. Prof. Deniz AKGÜL

Figure 5.28 Four-electron reduction of O2 to H2O by stepwise addition of electrons
© 2012 Pearson Education, Inc.
All intermediates formed are reactive and toxic to cells, except for water
Reactants Products
Outcome:
(superoxide)
(hydrogen peroxide)
(hydroxyl radical)
(water)
Marmara University – Enve3003 Env. Eng. Microbiology – Assist. Prof. Deniz AKGÜL

5.18 Toxic Forms of Oxygen
• Enzymes are present to neutralize most of
these toxic oxygen species
– Catalase
– Peroxidase
– Superoxide dismutase
– Superoxide reductase
© 2012 Pearson Education, Inc. Marmara University – Enve3003 Env. Eng. Microbiology – Assist. Prof. Deniz AKGÜL