chapter 5 gkm - shodhgangashodhganga.inflibnet.ac.in/bitstream/10603/4353/10/10_chapter 5.pdf ·...
TRANSCRIPT
Chapter_5_GKM OI 630 nm Night Airglow Emissions During Storm.
Department of Physics, S. U. Kolhapur Page | 132
CHAPTER – 5
OI 630 nm Night Airglow Emissions During Storm.
5.1 Introduction: -
The ground-based investigation by the photometry and
spectrometry gives us a wealth of information about the behaviour
of the upper atmosphere (ionosphere-thermosphere) at different
heights [1-5]. The remote sensing of OI 630 nm nightglow
emissions provides a convenient tool to procure important
information on the ionosphere through the different phases of
geomagnetic storm. Several researchers have studied the effect of
geomagnetic storm over thermosphere-ionosphere system at low
latitude by using both radio techniques (incoherent scatter radar,
rockets, satellites and UHF/VHF scintillation, ionosonde, topside
sounder) and optical techniques (conventional tilting and scanning
photometers and wide imaging system) [1-16]. Several earlier
studies revealed that the storm-time ionosphere vary in somewhat
complicated ways. Due to their complexity, the ionospheric storms
and the underlying physical processes are still to be fully
understood, in spite of many case studies [1, 2, 8 & 9]. The
response of F-region to magnetic storm is characterized by two
phases (effects) positive phase, and negative phase. During positive
phase, electron density enhances as compared to the day time
values, whereas the electron density decreases in reference to the
day time values during the negative phase of the storm. Rajaram et
Chapter_5_GKM OI 630 nm Night Airglow Emissions During Storm.
Department of Physics, S. U. Kolhapur Page | 133
al. [17] reported that, in general, during magnetic disturbances foF2
increases at low latitude (positive effect), conversely, Danilov and
Morozova [18] pointed out that considerable changes in foF2 may
not be observed at low latitudes. However, the positive effect is
conspicuous for day time values only at low latitudes [19]. More
often, the average pattern, negative effect at mid latitude and
positive effect at low latitude, is violated [20] as the signature of
individual storm varies greatly in their behaviour.
At low latitudes during magnetic disturbances, the ionospheric
perturbations (positive or negative effects) depend on several
complex factors, including storm-induced changes in dynamics,
heating and composition [9]. The Dst or disturbance storm time
index is a measure of geomagnetic activity used to assess the
severity of a magnetic storm. Use of Dst as an index of storm
strength is possible because the strength of the surface magnetic
field at low latitudes is inversely proportional to the energy content
of the ring current, which increases during geomagnetic storms
[21].
The electric field at the equator has an immense influence on the
equatorial F-layer peak height as well as on the longitudinal
distribution of Nmax at low latitude [10]. At mid and low latitudes,
the electric field and current pattern show different observations on
and disturbed conditions. At the equator the east-west electric field
controls EIA and generates a vertical E x B drift, upward during day
Chapter_5_GKM OI 630 nm Night Airglow Emissions During Storm.
Department of Physics, S. U. Kolhapur Page | 134
time and downward at night. The upward drift uplifts ionization to
higher altitudes and it diffuses to low latitudes through magnetic
field lines thereby producing two peaks of ionization at ±15o of the
geomagnetic equator.
At low latitudes the geomagnetic storms during their main phase
cause significant decrease in the geomagnetic-H field due to the
disturbances in the ring current. The high speed plasma cloud from
the sun initiates the magnetic storm. In the initial phase, the
enhanced H-values are due to northward IMF Bz (Positive Bz).
However, the southward turning of IMF Bz (negative Bz) causes the
transfer of solar wind energy to magnetosphere, thereby energizing
ring current and leading to the large and rapid decrease of H-field
on the surface associated with the main phase [6].
Several latest studies have shown that the magnitude and
different phases of geomagnetic storm depend upon solar wind
speed, IMF magnitude and the presence of large southward IMF BZ.
In fact southward IMF BZ provides prospect for making strong
magnetic reconnection between IMF and Earth’s magnetic field. The
occurrence of large southward IMF BZ during higher solar wind
velocities can produce large geomagnetic storms. Furthermore, the
presence of higher IMF for longer durations is not necessarily more
effective for production of large magnitude geomagnetic storm [12].
The southward turning of IMF BZ component, results in a decrease
in F2 layer critical frequency (foF2) [22].

Chapter_5_GKM OI 630 nm Night Airglow Emissions During Storm.
Department of Physics, S. U. Kolhapur Page | 135
On typical quiet night condition the [OI] 630 nm nightglow
variations at low latitude show good correlations with the variations
of the electron density. However, with increase in magnetic
disturbance, low latitude ionosphere undergoes rapid height
variations. The height variations of the emitting F2 layer produce
the corresponding signature in observed nightglow in 630 nm. The
ionospheric height variations could be due to large-scale travelling
ionospheric disturbances (TIDs) with periods about 3 hours which
occur at the auroral region during intense magnetic storm [3].
During magnetic disturbances, high latitude electric field can
penetrate into low latitude ionosphere [23]. The direction of electric
field is important. It is known that the direction of the electric field
in the equatorial region is eastward during day time and westward
at night [24]. If the superposed electric field moves westward, it will
push the F-layer downwards and, as there is more recombination in
the low latitude region, sharp airglow enhancement takes place.
Generally, the correlation coefficient between the OI 630.0 nm
intensity variation and F-layer height variation on the disturbed
night are large as compared to their values on quiet nights [2, 3 &
9].
Generally, the time interval with Kp≥3+ or Ap≥18 are
considered as magnetically disturbed periods [26, 27].
Chapter_5_GKM OI 630 nm Night Airglow Emissions During Storm.
Department of Physics, S. U. Kolhapur Page | 136

Chapter_5_GKM OI 630 nm Night Airglow Emissions During Storm.
Department of Physics, S. U. Kolhapur Page | 137
5.2 Experimental Setup and Parameters
In this section we examine several different simultaneous data
sets including optical (photometer data), ionospheric and
geomagnetic data.
5.2.1 Optical Experiment (Airglow)
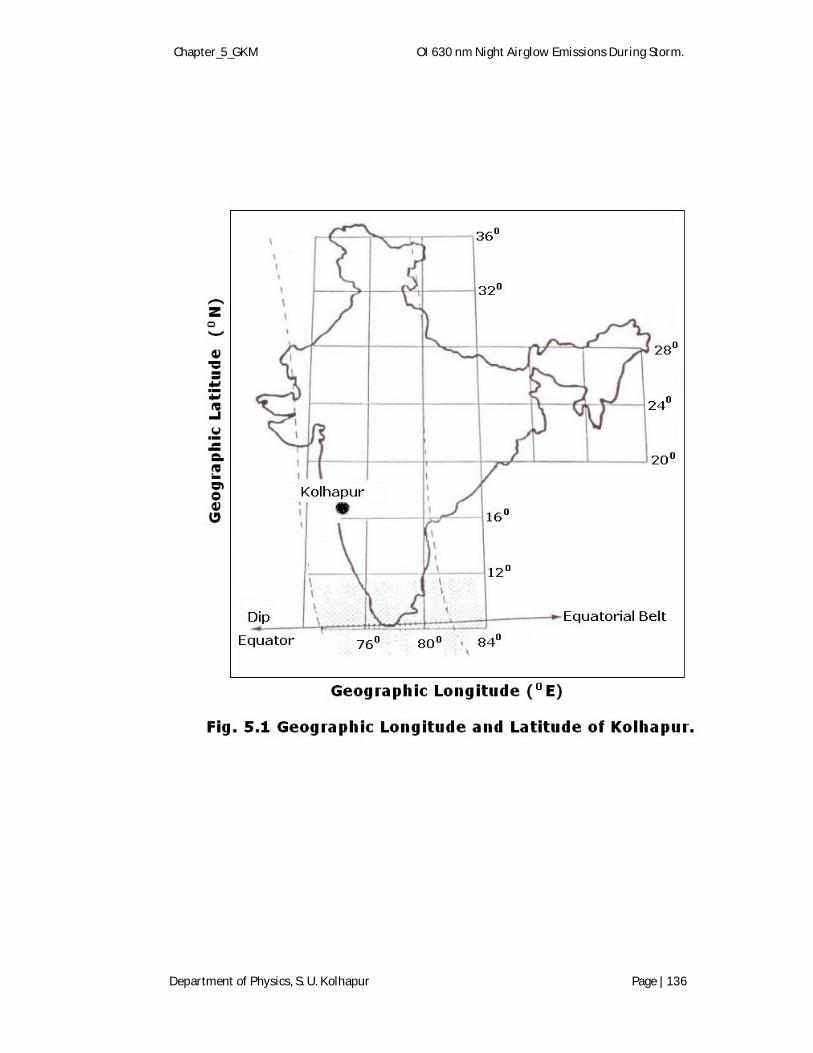
Airglow observations were made at Physics Department,
Shivaji University, Kolhapur, a low latitude station (16.8 N; 74.2
E; 10.6 N dip lat) (Fig. 5.1), using three tilting photometers
installed at the terrace of the Physics Department, Shivaji
University, by Indian Institute of Geomagnetism (IIG), Mumbai.
The three photometers were given on loan to IIG by La Trobe
University, Melbourne, Australia under scientific collaboration
between India and Australia.
The photometers are portable and can be easily mounted to
point along any desired combination of zenith and azimuth angles.
Hence, the photometers were pointed in three different directions,
thus horizontal motion in the thermosphere can be measured easily.
For the present study they are pointed to the zenith, 30 o east, and
30 o north directions (Fig. 5.2). The tilting photometer has a field of
view of 1o and gives cross section of about 5 km in the F-region
height (250 km) while looking at zenith. Each photometer consists
of an optical interference filter (kept at 30˚C)with tilting
mechanism, normal position gives the signal and background
reading, and the second tilting filter position gives only the

Chapter_5_GKM OI 630 nm Night Airglow Emissions During Storm.
Department of Physics, S. U. Kolhapur Page | 138
background reading. The difference between two readings gives the
signal of distant OI 630.0 nm airglow variations. This process was
repeated throughout the night to get the airglow intensities during
the night at two-minute interval. The ultimate form of overall
photometer was such that, not only could it be used to monitor
three different small (about 5 km in diameter at 250 km height)
volumes of the F-region ionosphere simultaneously, but also the
separation of three ionospheric volumes being monitored could be
made variable in accordance with the corresponding research
objectives.
Chapter_5_GKM OI 630 nm Night Airglow Emissions During Storm.
Department of Physics, S. U. Kolhapur Page | 139
5.2.2 Ionosonde Data
The ionospheric parameters (critical frequency) of the F2-
layer (foF2) and the virtual F-layer height (h’F) of the ionosphere
were measured from a nearby station, Ahmedabad (geog. lat.,
23.02o N, long. 72.6o E), station to know ionospheric conditions
during the time of airglow observation. However, whenever
Ahmadabad’s data is not available, ionosonde data from Kodaikanal
(geog. lat., 10.2o N, long. 77.5o E) have been used. The square of
parameter (foF2) is proportional to electron density at the peak of
F2-layer [25] and is given by, Ne(max) cm-3 = 1.24 × 10⁻²⁴ [foF2
(MHz)2].
5.2.3 Geomagnetic Indices
The magnetic data (H-component) discussed in the present
study were obtained from IIG, Mumbai’s observatory situated at
Alibag. The IIG, collects magnetic data through its network of
magnetic observatories all over India. The Kp, Ap, F10.7 cm flux are
taken from the NOAA-Space Environment Center
[http://www.ngdc.noaa.gov/stp/geomag/kp_ap.html and www.
swpc.noaa.gov] and Dst indices are obtained from the world data
center for geomagnetism, Kyoto [http://wdc.kugi.kyoto-
u.ac.jp/dstdir/]. The IMF Bz data obtained from Space Physics
Interactive Data Resource center’s data bank [SPIDR:
http://spidr.ngdc.noaa.gov/spidr/].

Chapter_5_GKM OI 630 nm Night Airglow Emissions During Storm.
Department of Physics, S. U. Kolhapur Page | 140
5.3 Results and Discussion
We use in this study ground based nocturnal observations of OI
630.0 nm emissions from Kolhapur, a low latitude station. Here, we
discuss & compare OI 630.0 nm emissions from Kolhapur with
ionospheric parameters, virtual height of the F – layer (h’F) and
critical frequency of F2 - layer ‘(foF2)’ from nearby station
Ahmedabad (23.020 N; 72.60 E). The station Ahmedabad is situated
closer to the EIA crest region. However, whenever, Ahmadabad’s
data is not available, the hourly values of the ionospheric parameter
h’F and foF2 are examined from a near equatorial station,
Kodaikanal (10.20 N; 77.50 E), situated at the same longitude
sector, to determine the condition of equatorial ionosphere during
the time of observations. The OI 630 nm night airglow data
presented in this study is of two minutes interval taken with high
resolution tilting photometers at Kolhapur. To show the magnetic
activity during the period of observations, we depict the magnetic
activity index (Ap), along with solar flux (F10.7 cm) values. The
complementary activity indices Dst and Kp for corresponding nights
are used. In addition to this, the southward turning of IMF Bz during
the period of observation was detected by the WIND satellite to see
electric field penetration from high latitude to low latitude. The
Table-5.1 shows correlation coefficient (r) between 1/I630 and h’F.

Chapter_5_GKM OI 630 nm Night Airglow Emissions During Storm.
Department of Physics, S. U. Kolhapur Page | 141
Table 5.1. Correlation coefficient (r) between 1/I630 and h’F.
Date Period of
Observations
(IST)
Correlation (r)
between
1/I630 and h’F
Remark
03-04 Feb 1997 20:00 to 05:00 0.35 Quiet
09-10 Feb 1997 20:00 to 05:00 0.25 Disturbed
27-28 Dec 1997 20:00 to 05:00 0.72 Quiet
30-31 Dec 1997 20:00 to 05:00 0.65 Disturbed
31 Dec 1997- 1
Jan 1998
20:00 to 05:00 -0.30 Quiet
23-24 April 1998 20:00 to 05:00 0.80 ---
26-27 April 1998 20:00 to 05:00 0.70 Disturbed
15-16 Jan 1999 20:00 to 05:00 No Ionosonde
Data
Disturbed
20-21 Jan 1999 20:00 to 05:00 0.04 ---
21-22 Jan 1999 20:00 to 05:00 0.45 ---
22-23 Jan 1999 20:00 to 05:00 0.19 ---
4-5 Dec 1999 20:00 to 05:00 -0.07 Disturbed
6-7 Dec 1999 20:00 to 05:00 -0.52 ---
31 Dec 1999 - 1
Jan 2000
20:00 to 05:00 0.75 Disturbed
6-7 Jan 2000 20:00 to 05:00 0.20 ---
8-9 Jan 2000 20:00 to 05:00 No Ionosonde
Data
Quiet
28-29 Jan 2000 20:00 to 05:00 0.76 Disturbed
29-30 Jan 2000 20:00 to 05:00 No Ionosonde
Data
Disturbed
6-7 March 2000 20:00 to 05:00 -0.51 ---
31 March 2000 -
1 April 2000
20:00 to 05:00 0.40 Disturbed

Chapter_5_GKM OI 630 nm Night Airglow Emissions During Storm.
Department of Physics, S. U. Kolhapur Page | 142
Zenith
9 - 10 Feb 97 OI 630 nm
F 10.7 = 73Ap = 20
230
300
h'F
(km
)
3+
4
5+
4
Kolhapur
(foF2)2
h' FKodaikanal
20 22 00 02 04 IST (Hrs)
-60
-10
Dst
(nT)
1
5
Kp
Inde
x
0
2.5O
I 630
nm
Inte
nsity
(a
rb. u
nits
)
3 - 4 Feb 97 OI 630 nm
F 10.7 = 80Ap = 07
30
60
(foF
2)2 (M
Hz)
2
0+1 1+
3 -
Zenith
Kolhapur
Kodaikanal (foF2)2
h' F
20 22 00 02 04 IST (Hrs)
-9
0
9
Bz (n
T)(a)
(b)
(c)
(d)
(e)
Fig. 5.3 Temporal variation of (b) h’F & (foF2)2 values at Kodaikanal,
(c) IMF Bz, (d) H variation at nearby low latitude station, Alibag,
(e) Kp and (f) Dst values on the night of 3/4 and 9/10 February
1997. The topmost panel (a) depicts the temporal variation of OI
630 nm intensity at Kolhapur on the above nights.

Chapter_5_GKM OI 630 nm Night Airglow Emissions During Storm.
Department of Physics, S. U. Kolhapur Page | 143
In Fig. 5.3 the top panel (a) depicts the OI 630.0 nm nocturnal
intensity variations on a set of magnetically quiet and disturbed
night, 3-4 February 1999 and 9-10 February 1999. The following
panel (b) shows the variation of h’F & (foF2)2 parameters, panel (c)
IMF BZ, panel (d) Kp index and (e) Dst index respectively. The
purpose of plotting h’F, (foF2)2, IMF BZ, Kp and Dst index in the
same figure is to find out any correlation between these parameters
with airglow intensity variations.
On the quiet night of 3-4 February-1999, the F-region height
data (h’F) shows local time variation with the lower in heights seen
at 23:00 and 02:30 IST associated with the OI 630.0 nm emission
enhancement during pre-midnight hours. The square of (foF2)2 is
proportional to the electron density at the peak of F2-layer [25].
This feature is common and perceived in the (foF2)2 variations at
Kodaikanal. No southward turning of IMF Bz and significant change
in Kp and Dst was registered. The correlation coefficient (r) between
1/I630.0 and h’F is r=0.35. A magnetic storm with a sudden
commencement occurred at 12:30 IST on 8 February 1997 and
continued for next three days.
On the magnetically disturbed (moderately disturbed) night 9-10
February,1999, OI 630.0 nm emissions showed periodic variations
(period of about 2.5 h), and ionospheric data (h’F-component) from
Kodaikanal shows similar pattern with some time difference. It is
noted that during the negative excursion of Dst (>-56 nT) two giant
Chapter_5_GKM OI 630 nm Night Airglow Emissions During Storm.
Department of Physics, S. U. Kolhapur Page | 144
peaks were observed. It is interesting to see that, the fluctuations
in h’F are in phase with 1/I630.0 especially during the negative
excursion of Dst. Mukherjee et al. [3], reported that during the
disturbed conditions, the ionospheric height variation could be due
to travelling ionospheric disturbances (TIDs). The southward turning
of IMF Bz (>-9 nT) started at 23:30 IST and lasted till 02:30 IST
during the period of observation. The disturbed ionosphere is also
influenced by the solar wind and interplanetary magnetic field,
which modulate the energy sources of the storm circulation [28].
The magnitudes and different phases of the geomagnetic storm
depend upon solar wind speed, IMF magnitude and the presence of
large southward IMF Bz [12].
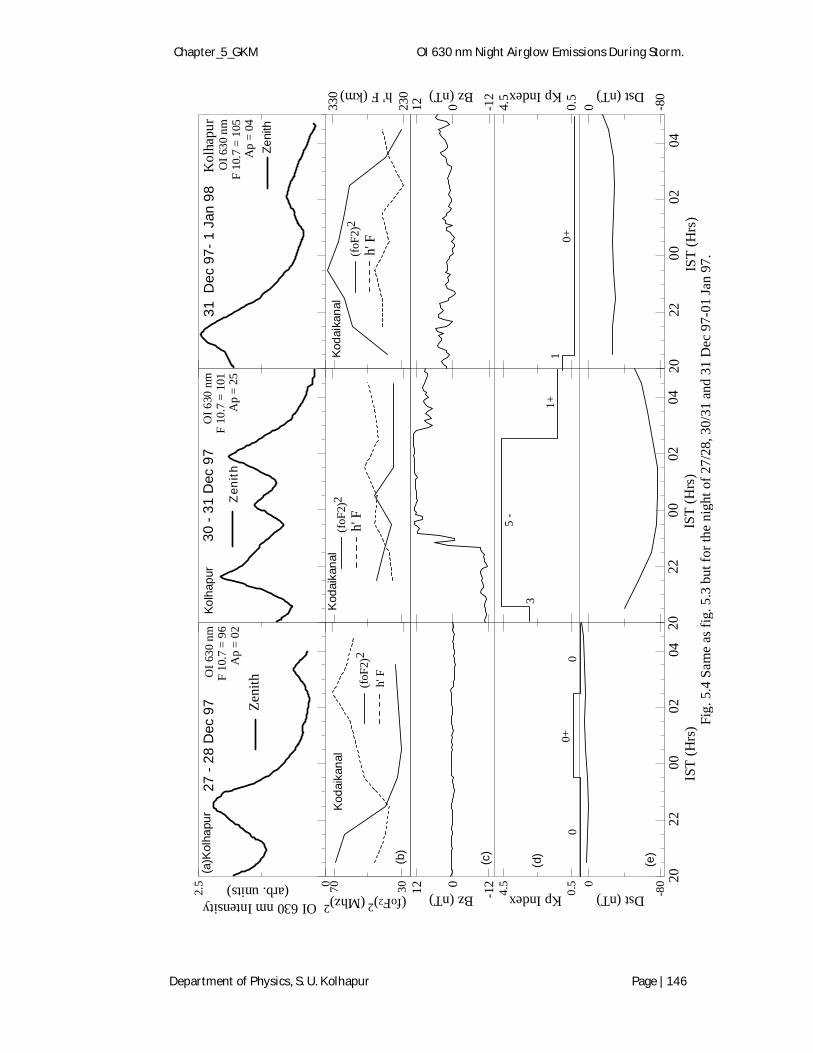
In Fig. 5.4 we present night airglow data obtained on 27-28, 30-
31 1997 and 31 Dec 1997 – 1 Jan 1998 along with h’F, foF2, BZ, KP,
and Dst parameter. The ionospheric parameters were taken from
Kodaikanal. The night of 27-28 December 1997 is typical quiet
(Ap=2) night. On this night there is remarkable rapid fall in OI 630
nm intensity from 22:30 hours IST to post midnight. This is
common feature [25] and also observed at Kodaikanal. The inverse
of 630 nm intensity variation shows good correlation (c.c. = 0.72)
with the variation of the F-region height. A sudden commencement
of magnetic storm occurred on 29-30 December 1998 at 23:30 IST

Chapter_5_GKM OI 630 nm Night Airglow Emissions During Storm.
Department of Physics, S. U. Kolhapur Page | 145
followed by main phase on the night 30-31 December 1997. During
this storm the maximum negative excursion of Dst was about -77
nT at 00:30 IST, Kp reached 5-, and Bz = -12 nT. The Kp index
reached a value of 5- during the period of main phase of the storm.
The main phase of storm started on 30 December 1997 with a
prominent southward turning of Bz for more than 8 hours (i.e. Bz
becoming negative). On 30-31 December 1998, the OI 630 nm
variation shows periodic (~3 hours) intensity variations during the
strong magnetic variations (Ap=25). Similar pattern was observed
in variations in F-region height (h’F) at Kodaikanal. The inverse of
OI 630 nm intensity variation shows good correlation (c.c. = 0.65)
with the variation of the F-region height. It is also reported that the
correlation coefficient between inverse of OI 630 nm intensity
variation and F-region height (h’F) variation were large for disturbed
nights as compared to quiet nights [3, 9]. The OI 630 nm emissions
are due to dissociative recombination and mainly depend on the
vertical movement of the F-layer, and more specifically on the
heights of the F-layer bottomside, with an inverse relation between
I630 and F-layer height [3, 29]. The third night in this figure is 31
December 1997-01 January 1998, a quiet (Ap=04) night, and
somewhat similar nature is observed.
Chapter_5_GKM OI 630 nm Night Airglow Emissions During Storm.
Department of Physics, S. U. Kolhapur Page | 146
Zen
ith
OI 6
30 n
mF
10.7
= 1
01A
p =
25
3
5 -
1+
30 -
31 D
ec 9
7
(foF
2)2
h' F
Kod
aika
nal
Kolh
apur
-8
0
0
Dst (nT)
0.5
4.5 Kp Index
OI 6
30 n
mF
10.7
= 1
05A
p =
04
31 D
ec 9
7- 1
Jan
98
1 0+
230
330 h' F (km)
Zeni
th
Koda
ikan
al
Kol
hapu
r
-8
00
Dst (nT)0.5
4.5
Kp Index
0
2.5
OI 630 nm Intensity (arb. units)
OI 6
30 n
mF
10.7
= 9
6A
p =
02
0
0+
3070 (foF2)2 (Mhz)2
27 -
28 D
ec 9
7 Zeni
th
Kod
aika
nal
(foF2
)2
h' F
0
-12012 Bz (nT)
-12
012
Bz (nT)
(a)K
olha
pur
(foF2
)2
h' F
(b)
(c)
(d)
(e)
20
22
00
02
04
IS
T (H
rs)
20
22
00
02
04
IS
T (H
rs)
20
22
00
02
04
IS
T (H
rs) Fi
g. 5
.4 S
ame
as fi
g. 5
.3 b
ut fo
r the
nig
ht o
f 27/
28, 3
0/31
and
31
Dec
97-
01 Ja
n 97
.

Chapter_5_GKM OI 630 nm Night Airglow Emissions During Storm.
Department of Physics, S. U. Kolhapur Page | 147
-60
-30
0
30
Dst
(nT)
0.5
5.5
Kp
Inde
x
1 -
5 4+
210
380
h'F
(km
)
AhmedabadWaltair
0
3O
I 630
nm
Inte
nsity
(a
rb. u
nits
)
ZenithNorth
23 - 24 April 98 OI 630 nm
F 10.7 = 90Ap = 15
5 5 -
3 4
AhmedabadWaltair
North
Zenith
Kolhapur OI 630 nmF 10.7 = 91
Ap = 31
26 - 27 April 98
20 22 00 02 04
IST (Hrs)
-14
0
14
Bz
(nT)
Kolhapur
20 22 00 02 04 IST (Hrs)
(a)
(b)
(c)
(d)
(e)
30
120
(foF
2)2 Ahmedabad Ahmedabad
(f)
Fig. 5.5 Variation of optical emission (630.0 nm) during the nights
of 23/24 April and 26/27 April 1998, compared with ionospheric
parameters [h’F and (foF2)2] at Ahmedabad, h’F at Waltair, IMF Bz
component, Kp and Dst Index.

Chapter_5_GKM OI 630 nm Night Airglow Emissions During Storm.
Department of Physics, S. U. Kolhapur Page | 148
A data set for the nights 23-24 and 26-27 April 1998 obtained at
Kolhapur is presented in Fig. 5.5 along with h’F, foF2, BZ, KP, and
Dst parameter. The values of ionospheric parameters were obtained
from Ahmedabad and Waltair (17.70 N; 83.30 E). Two photometers
(300 N and Zenith) were operative on these nights. On the night 23-
24 April, the F-layer height data (h’F) shows a lower in heights,
seen at both the stations (Ahmedabad & Waltair) at 20:45 IST and
02:30 IST, associated with the OI 630 nm emission pre-and post-
midnight enhancements. At 23:55 IST, sudden commencement of
magnetic storm occurred on 23-April 1998. After about an hour, the
Dst started decreasing and attained lowest value on the following
day i.e., 24 April 1998. In addition, the Bz turned southward almost
at the same time and attained its value of -14 nT, and remained for
prolonged time. When the Bz component turn southward, it strongly
couple with magnetosphere and most dramatic magnetospheric
effects take place. The Kp too reached to 5. Significant lower in
height (=210 km) of F-layer is observed at both stations, Waltair &
Ahmedabad after ~3-hours of commencement of storm. It shows
good correlation (0.80) between inverse of OI 630 nm intensity and
F-layer height. It is very interesting to see that, both photometers
(Zenith & North looking) observed similar structure however their
occurrence was not simultaneous, but with time delay of 18
minutes. The north looking photometer observed peak earlier than
that of zenith. This means there is velocity propagation from North

Chapter_5_GKM OI 630 nm Night Airglow Emissions During Storm.
Department of Physics, S. U. Kolhapur Page | 149
to Zenith (equatoward) direction. The airglow structure moves with
velocity 134 ms-1 before midnight. The strength of equatorial
ionization anomaly (EIA) was good. On a disturbed (Ap=31) night
26-27 April 1998, the OI 630 nm emission shows a large intensity
enhancement at about 20:30 IST, which coincides with a minimum
in h’F and maximum in foF2. On the disturbed nights OI 630 nm
emission signifies the important role of F-layer dynamics. The
inverse of OI 630 nm intensity variation shows good correlation
(c.c. =0.70) with the variation of the F-layer height and almost anti-
correlation with (foF2)2. The h’F values are low (210 km) during
occurrence time of airglow peak. The sharp descend in OI 630 nm
intensity is observed following rapid rise in h’F height variations
around midnight. It is very exciting to witness that, both
photometers (Zenith & North looking) observed similar structure
and their occurrence was almost simultaneous.
In Fig. 5.6 we show the data obtained on the nights of 15-16
January 1999 (disturbed) and 20-21 January 1999. On night of 15-
16 January 1999, the OI 630 nm emissions show periodic intensity
variations (period of about 2.5 h). Sahai et al. [8] reported that
during magnetic disturbances the OI 630 nm emission shows
periodic intensity variations associated with vertical oscillations in
the ionospheric F-layer. Our results are in good agreement with
Sahai [8]. For this night, ionosonde data was not available for
correlation.

Chapter_5_GKM OI 630 nm Night Airglow Emissions During Storm.
Department of Physics, S. U. Kolhapur Page | 150
-45
-15
Dst
(nT)
0.5
3.5
Kp
Inde
x 3+ 4 - 3
2
0
2O
I 630
nm
Inte
nsity
(a
rb. u
nits)
15-16 Jan 99
OI 630 nmF 10.7 = 143
Ap = 20
40
150
(foF2
)2 (M
Hz)
2
Zenith
-10
0
10
Bz
(nT)
200
260
h'F
(km
)
OI 630 nmF 10.7 = 172
Ap = 08
21-22 Jan 99 Kolhapur
Zenith
(foF2)2h' FAhmedabad
NO Data
(a)
(b)
(c)
(d)
(e)
Kolhapur
20 22 00 02 04 IST (Hrs)
20 22 00 02 04 IST (Hrs)
2-
1-0+
Fig. 5.6 Same as Fig. 5.3 but for the date 15/16 and 21/22 January
1999.

Chapter_5_GKM OI 630 nm Night Airglow Emissions During Storm.
Department of Physics, S. U. Kolhapur Page | 151
On the 21-22 January 1999 the enhancement observed in the OI
630 nm emission intensity is associated with decrease in the
bottomside of F-layer, as evidenced from the h’F nocturnal
variations. The rapid fall in intensity from 22:15 IST to post
midnight and this feature is common and also seen in the (foF2)2
variations at Ahmadabad. The inverse of OI 630 nm intensity
variation shows very poor correlation (c.c. =0.04).
In the Fig. 5.7 the top panel (a) portrays nocturnal variations
of 630.0 nm airglow on night of 4-5 December and 6-7 December,
1999. Three photometer (30o E, 30o N, and Zenith) were working.
The following panel (b) depicts variation of h’F & (foF2)2 parameters,
panel (c) IMF BZ, panel (d) Kp index, (e) magnetogram data, H-
component from Alibag and (f) Dst index respectively. The solar flux
(F10.7 cm), magnetic activity index Ap. The night of 4-5 December
1999 is a magnetically disturbed night with Ap=30.
It is interesting to notice that there are two prominent peaks
in 630 nm airglow intensity, one at 23:30 IST and second at 3:30
IST. It clearly shows that the peaks in the airglow intensity are
associated with lowering in the height of F-region. It is remarkable
that, all the three photometers are showing intense enhancement in
airglow intensity almost around the same time, during the period of
magnetic disturbances (Kp=5 to 4-). It shows that there is no
meridional and longitudinal change in the phase, indicating the
absence of propagation. Sahai[8] on one occasion reported absence

Chapter_5_GKM OI 630 nm Night Airglow Emissions During Storm.
Department of Physics, S. U. Kolhapur Page | 152
4 - 3
2+
(foF2)2
h' F
200
250
h' F
(km
)
ZenithNorthEast
OI 630 nmF 10.7 = 143
Ap = 16
Kolhapur
Ahmedabad
6 - 7 Dec 99
-35
-5
Dst
(nT)
2.2
5.2
Kp
Inde
x
4+ 5
4 - 3+
30
130
(foF2
)2 (M
Hz)
2
(foF2)2
h' F
0
2.5
OI 6
30 n
m In
tens
ity
(arb
. uni
ts)
East
NorthZenith
OI 630 nmF 10.7 = 148
Ap = 30
Ahmedabad
4 - 5 Dec 99
550
590
H (n
T)
-7
0
7
Bz
(nT)
Kolhapur
20 22 00 02 04 IST (Hrs)
20 22 00 02 04 IST (Hrs)
(a)
(b)
(d)
(c)
(e)
(f)
Fig. 5.7 The topmost panel (a) depicts the temporal variation of OI
630 nm intensity at Kolhapur. The panel (b) depicts temporal
variation of h’F & (foF2)2 values at Ahmedabad, (c) IMF Bz, (d) Kp
Index (e) H variation at nearby low latitude station, Alibag, and (f)
Dst values on the night of 4/5 and 6/7 December 1999.

Chapter_5_GKM OI 630 nm Night Airglow Emissions During Storm.
Department of Physics, S. U. Kolhapur Page | 153
of propagation during magnetic disturbances. This is a peculiar
behaviour on a very magnetically disturbed night, when the two
peaks are not separated. These results are in good agreement with
Mukherjee [3, 5] and Sahai [8]. This behavior of OI 630 nm
emission on a disturbed night shows the significant role played by
F-region dynamics. The night of 6-7 December 1999 is a night with
magnetic activity index Ap=16 and solar flux as 143 units. There
are two prominent peaks observed in night airglow data (OI 630
nm). The first peak occurs at 20:30 hrs and the second
enhancement takes place around 23:20 hrs, both are at pre-
midnight hours. The time of the two peaks does not coincides in all
three (Zenith, 30oE and 30o N) directions. The intensity decreases
sharply in these three directions after midnight hours. It is seen
that the peak at North appears first and then it is seen by the
Zenith photometer after 25 minutes, this gives rise to drift velocity
in meridional direction towards the equator assuming the same
structure is moving towards the equator. We determine the
apparent drift speeds simply from the time delay of common
features in the data which gave drifts as 97 m/s.
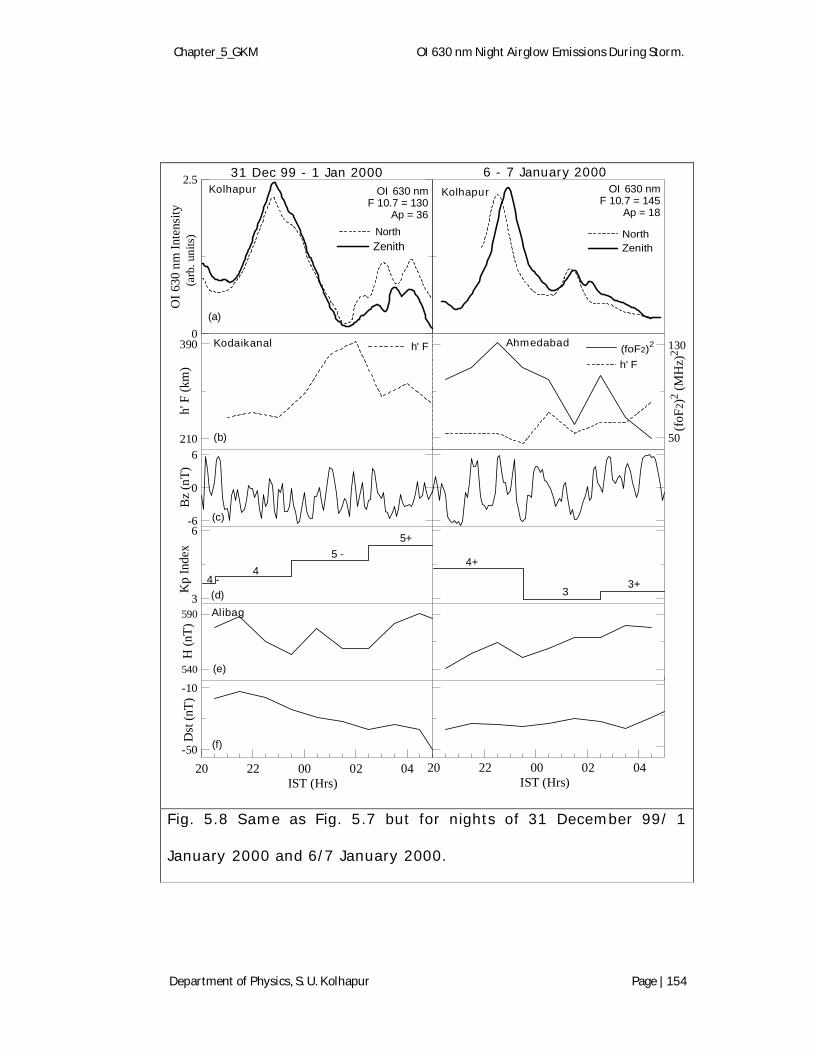
In the Fig. 5.8 we show the data obtained on 31 December
1999-1 January 2000 (magnetic storm, Ap=36) and 6-7 January
2000. On the night 31 December 1999-1 January 2000, OI 630 nm
emission does not show any periodic variations. However, both
(30oN and Zenith) the photometers shows strong enhancement in
Chapter_5_GKM OI 630 nm Night Airglow Emissions During Storm.
Department of Physics, S. U. Kolhapur Page | 154
-50
-10
Dst
(nT)
3
6
Kp
Inde
x
4 4 -
5 -5+
210
390
h' F
(km
)
h' F0
2.5O
I 630
nm
Inte
nsity
(a
rb. u
nits
)
Zenith
North
OI 630 nmF 10.7 = 130
Ap = 36
Kolhapur
Kodaikanal
31 Dec 99 - 1 Jan 2000
540
590
H (n
T)
-6
0
6
Bz
(nT)
Alibag
(foF2)2
50
130
(foF
2)2 (M
Hz)
2 h' F
Zenith
North
OI 630 nmF 10.7 = 145
Ap = 18
4+
3 3+
Ahmedabad
6 - 7 January 2000 Kolhapur
20 22 00 02 04 IST (Hrs)
20 22 00 02 04 IST (Hrs)
(a)
(b)
(c)
(d)
(e)
(f)
Fig. 5.8 Same as Fig. 5.7 but for nights of 31 December 99/ 1
January 2000 and 6/7 January 2000.

Chapter_5_GKM OI 630 nm Night Airglow Emissions During Storm.
Department of Physics, S. U. Kolhapur Page | 155
airglow intensity at the same time during the period of magnetic
disturbances (Kp=4- to 5+) indicating the absence of propagation
[5, 8]. Throughout the night the BZ component remained negative
and it is BZ=-6. It shows good correlation between 1/I630 nm and F-
region height (c.c. =0.75).
The h’F values at Kodaikanal are also low during occurrence
time of airglow peak and shows sharp fall and rise in their values
during the night. The H-component from Alibag also shows similar
structure to that of f-region height variations. The sharp descend in
OI 630 nm intensity is observed following rapid rise in h’F height
variations till 1:30 IST. Post midnight enhancement in the OI 630
nm intensity is also observed, but the peak are not on the same
time. The night of 6-7 January 2000 is a night with magnetic activity
index Ap=18 and solar flux as 145 units. The OI 630.0 nm intensity
shows monotonic decrease in intensity variation during the night.
The maxima in intensity takes place around 22:30 IST. Around the
same time h’F values are minimum and thereafter keep on
increasing and OI 630.0 nm shows inverse relationship with height
variation. It is also observed that 630.0 nm intensity and (f0F2)2
variation shows a good correlation during the night [3]. It is
generally seen that 630.0 nm intensity shows good correlation with
electron density parameter (f0F2)2 during quite period. The
photometers 30 N and Zenith are showing peaks in OI 630 nm
intensity but their occurrence is not simultaneous. During the first

Chapter_5_GKM OI 630 nm Night Airglow Emissions During Storm.
Department of Physics, S. U. Kolhapur Page | 156
peak the North looking photometer observes maxima at first around
22:20 hrs and the Zenith photometer at around 22:40 hrs. This
gives rise to drift velocity in meridional direction towards the
equator assuming the same structure is moving towards the
equator. During magnetically quiet conditions the meridional wind in
the upper thermosphere remains poleward during daytime and
equator ward during nighttime [16]. We determine the apparent
drift speeds simply from the time delay of common features in the
data which gave drifts as 161 m/s.
The Fig. 5.9 depicts the typical variations in 630.0 nm airglow
during night of 28-29 January 2000 and 29-30 January 2000. In the
subsequent panels we plot ionospheric parameters (h’f & fof2) from
Ahmedabad, BZ component, Kp-index, H-component from Alibag,
and Dst-index as a function of local time.
The night of 28-29 January 2000 is magnetically disturbed
night as the geomagnetic activity index Ap is 32. It is clear from the
figure that the airglow intensity shows three peaks, two before
midnight (20:00 & 22:30 IST) and one post midnight (02:30 IST). It
is seen that in the beginning intensity of the airglow sharply
decreases due to increase in height of F-layer (h’F). After comparing
the ionosonde data with the photometer data it is seen that,
whenever the peak occurs, the height of F-layer (h’F) is lowered due
to magnetic disturbance. This shows dependence of vertical motion
of F-layer where volume emission rate is more. The dynamical
effects are more pronounced on the disturbed nights with larger h’F
changes.

Chapter_5_GKM OI 630 nm Night Airglow Emissions During Storm.
Department of Physics, S. U. Kolhapur Page | 157
-40
-10
Dst
(nT)
4+4 - 3+ 4+
15
65
(foF2
)2 (MH
z)2
(foF2)2
h' F
0
2.5
OI 6
30 n
m In
tens
ity
(arb
. uni
ts)
Zenith
OI 630 nmF 10.7 = 126
Ap = 32
Kolhapur
Ahmedabad
28-29 Jan 2000
-6
0
6
Bz
(nT)
560
620
H (n
T)
Zenith
OI 630 nmF 10.7 = 128
Ap = 30
Kolhapur
29-30 Jan 2000
4+ 5 - 4+ 4 -
210
260
h'F
(km
)
No Data
20 22 00 02 04 IST (Hrs)
20 22 00 02 04 IST (Hrs)
(a)
(b)
(c)
(e)
(f)
0.5
4.5
Kp
Inde
x
(d)
Fig. 5.9 Same as Fig. 5.8 but for nights of 28-29 January 2000, 29-
30 January 2000.

Chapter_5_GKM OI 630 nm Night Airglow Emissions During Storm.
Department of Physics, S. U. Kolhapur Page | 158
The ionospheric height variations (positive and negative
effect) at low latitudes during magnetic storms are dependent on
factors like changes in dynamics, heating and composition of the
ionosphere which takes place depending on latitude, longitude, local
time and on the phase of the geomagnetic storm [30]. It shows
good correlation between 1/I630 nm and F-region height (c.c. =0.76).
The following night 29-30 January 2000 is also disturbed night with
Ap=30 and Kp=5- to 4- during period of observations. Unfortunately
the ionosonde data is not available for this night to see any relation
between h’F and OI 630.0 nm intensity. Two sharp peaks are
noticed around 22:00 and 03:00 hrs IST with previous enhancement
is more in intensity compared to subsequent enhancement. The
peaks are around the time of high Dst or Kp-index [2]. Mukherjee et
al. [3] also observed double maxima in OI 630 nm in connection
with magnetic disturbances and is common at the Kolhapur station,
and our results are in good agreement with it. With increase in
magnetic disturbance, low latitude ionosphere experiences rapid
height variations. This height variation in the emitting F2-layer lead
to corresponding signature in observed OI 630 nm nightglow.
Fig. 5.10 portray OI 630 nm intensity observed at Kolhapur
during magnetically disturbed night 31 March-1 April 2000, Ap=23.
The ionospheric data, BZ-component, Kp-index, H-component and
Dst indices are plotted in the following panels. Two photometers
(30o N & Zenith) are operative.

Chapter_5_GKM OI 630 nm Night Airglow Emissions During Storm.
Department of Physics, S. U. Kolhapur Page | 159
-55
0
Dst
(nT)
2.3
4.3
Kp
Inde
x
4+
3 -
3+4 -
45
130(f
oF2)
2 (MH
z)2
(foF2)2
210
310
h' F
(km
)
h' F
Zenith
0
2
OI 6
30 n
m In
tens
ity
(arb
. uni
ts)
North
OI 630 nmF 10.7 = 225
Ap = 23
Kolhapur
Ahmedabad
31 March 2000- 1 April 2000
-7
0
7
Bz
(nT)
530
600
H (n
T)
Alibag
20 22 00 02 04 IST (Hrs)
Fig. 5.10 (a) Nocturnal variation of relative airglow intensity (630 nm) 31 March -01 April 2000 observed at Kolhapur. (b) temporal variation of h’F & (foF2)2 values at Ahmedabad, (c) IMF Bz, (d) Kp Index (e) H variation at nearby low latitude station, Alibag, and (f) Dst values.

Chapter_5_GKM OI 630 nm Night Airglow Emissions During Storm.
Department of Physics, S. U. Kolhapur Page | 160
Two prominent peaks are observed by both the photometers
with similar structure. The first peak is observed before midnight
and latter after midnight. It is clear from the observations that, the
enhancements in the OI 630 nm emission intensities are associated
with decrease in the bottomside of the F-layer, as evidence from the
F-layer nocturnal variations. On the quiet nights such double
maxima in intensity of IO 630 nm have not appeared [31]. It is seen
that the peak at North appears first and the Zenith records after 45
minutes, this gives rise to drift velocity in meridional direction
towards the equator assuming the same structure is moving
towards the equator. We determine the apparent drift speeds simply
from the time delay of common features in the data which gave
drifts as 69 m/s.
5.4 Conclusions:
On the basis of above discussion and observational evidence,
the main features associated with the nightglow observations can
be summarized as follows:
a) During both magnetically quiet and disturbed conditions, the
nocturnal OI 630.0 nm airglow variations observed at low
latitude stations are well correlated with the dynamic variations
seen in the F-region ionospheric parameters. The dynamical
effects observed are more pronounced during disturbed
conditions. The time variation in OI 630.0 nm is governed by
electron density fluctuations whereas during the magnetic

Chapter_5_GKM OI 630 nm Night Airglow Emissions During Storm.
Department of Physics, S. U. Kolhapur Page | 161
disturbance variation in OI 630.0 nm is more controlled by height
variations. Mukherjee [3] and Sahai [9] reported the correlation
coefficient between 1/I630.0 and h’F is generally large for the
disturbed nights. It is possibly because of larger height changes
in F-regions during the disturbed nights.
b) Sharper intensity peak in OI 630.0 nm intensity fluctuations
with pronounced double peak observed. Such occurrence of
double maxima in 630 nm during magnetic disturbance has also
been noted by Misawa and Takeuchi [31] and Sahai [9].
c) It was also found that, the airglow structure was moving
equatoward before midnight with speed between 60 to 161 m/s.
Balan [16] during his campaign observed that under magnetically
conditions, the meridional wind is poleward during daytime and
equatoward during night.
d) The OI 630.0 nm emission shows periodic intensity variations
associated with vertical oscillations in the ionospheric F-region
plasma during magnetic disturbances. The vertical oscillations in
the ionospheric F-region plasma are possibly associated with
magnetospheric sub-storms electric fields penetrating to low
latitude, and with thermospheric neutral wind variations due to
high latitude thermospheric heating [8].
e) The enhancement of OI 630.0 nm emission correlates well with
the Kp index.

Chapter_5_GKM OI 630 nm Night Airglow Emissions During Storm.
Department of Physics, S. U. Kolhapur Page | 162
References:
1. Mukherjee, G. K, Some characteristics of the 13 March 1989
magnetic storm in the American and the Indian longitude zones.
Ind. J. of Radio & Space Phys., 29, 393-398, 1994.
2. Mukherjee, G. K, Storm-associated Variations of [OI] 630.0 nm
Emissions from low latitudes. Terres. Atmos. Ocean. Sci., 10 (1),
265-275, 1999.
3. Mukherjee, G. K, L. Carlo, S. H. Mahajan, OI 630 nm nightglow
observations from 170 N latitude. Earth Planets Space, 52, 105-
110, 2000.
4. Mukherjee, G. K., Studies of equatorial F-region depletions and
dynamics using multiple wavelength nightglow imaging. J.
Atmos. Sol. Terr. Phys., 65, 379-390, 2003.
5. Mukherjee, G. K, Airglow, and other F-layer variations in the
Indian sector during the geomagnetic storm of February 5-7,
2000. Earth Planets Space, 58, 623-632, 2006.
6. Rastogi, R. G., A new features of low latitude geomagnetic
storms. Curr. Sci., 81, 1462-1466, 2001.
7. Prasad, D. S. V. V. D., P. V. S. Rama Rao, G. Uma, S. Gopi
Krishna, and K Venkateswarlu, Geomagnetic activity control on
VHF scintillations over an Indian low latitude station, Waltair. J.
Earth Syst. Sci. 114, 437 – 441, 2005.
8. Sahai, Y., J. A. Bittencourt, H. Takahashi, N. R. Teixera, J. H. A.
Sobral, B. A. Tinsley, and R. P. Rohrbaugh, Multispectral optical

Chapter_5_GKM OI 630 nm Night Airglow Emissions During Storm.
Department of Physics, S. U. Kolhapur Page | 163
observations of ionospheric F-region storm effects at low
latitude. Planet Space Sci., 36(4), 371–381, 1988.
9. Sahai, Y., J. A. Bittencourt, H. Takahashi, N. R. Teixera, J. H. A.
Sobral, B. A. Tinsley, and R. P. Rohrbaugh, Analysis of storm
time low-latitude simultaneous ionospheric and nightglow
emission measurements. J. Atoms. Terr. Phys., 52(9), 749–757,
1990.
10. Batista Inez S., E. R. DE Paula, M. A. Abdu, and N. B. Trivedi,
Ionospheric effect of the March 13, 1989, Magnetic Storm at Low
and Equatorial Latitudes. J. Geophys. Res., 96, A8, 943-952,
1991.
11. Gonzalez W. D., J. A. Joselyn, Y. Kamide, H. W. Kroehl, G.
Rostoker, B. T. Tsurutani, and V. M. Vasyliunas, What is a
geomagnetic storm?. J. Geophys. Res. 99, 5571-5792, 1994.
12. Dubey S. C., A. P. Mishra., Solar activity, and large geomagnetic
disturbances. Current Science, 77 (2), 293, 1999.
13. Dabas, R. S., R. M. Das, V. K. Vohra, and C. V. Devasia, Space
weather impact on the equatorial and low latitude F-region
ionosphere over India. Ann. Geophys., 24, 97-105, 2006.
14. Sastri. J. H., Effect of magnetic storm and substorm on the low-
latitude/equatorial ionosphere. ILWS Workshop 2006, Goa, 2006.
15. Fejer, B. G., Low latitude storm time ionospheric
electrodynamics, J. Atmos. solar Terr. Phys., 64, 1401 – 1408,
2002.
Chapter_5_GKM OI 630 nm Night Airglow Emissions During Storm.
Department of Physics, S. U. Kolhapur Page | 164
16. Balan, N., S. Kawamura, T. Nakamura, M Yamamoto, S. Kukao,
K. Igarashi, T. Mayurama, K. Shikawa, Y. Ogawa, H. Alleyne, S.
Watanabe, and Y. Murayama, Simultaneous mesosphere/lower
thermosphere and thermospheric F region observations during
geomagnetic storms. J. Geophys. Res., 109, A04308, doi:
10.1029/2003JA009982, 2004.
17. Rajaram, G., A. C. Das, and R. G. Rastogi, Ionospheric F-region
disturbances and their possible mechanisms. Ann. Geophys. 27,
469, 1971.
18. Danilov, A. D. and L. D. Morozova, Ionospheric storms in the F
region. Morphology and physics (review). Geomagn. Aeronomy.,
25, 593, 1985.
19. Kane, R. P., Global evolution of F region storms. J. Atmos. Terr.
Phys., 35, 1953, 1973.
20. Kane, R. P., Storm effects of ionospheric total electron content
(TEC) at low latitudes. J. Geomagn. Geoelect., 33, 399, 1981.
21. Hamilton, D. C., Ring current development during the great
geomagnetic storm of February 1986. J. Geophys. Res., 93,
14343, 1988.
22. Davis, J. D., Wild, M. N., Lockwood, M., Y. Tulunay, Ionospheric
and geomagnetic responses to changes in IMF BZ: a superposed
epoch study. Ann. Geophys., 15, 217-230, 1997.

Chapter_5_GKM OI 630 nm Night Airglow Emissions During Storm.
Department of Physics, S. U. Kolhapur Page | 165
23. Kamide, Y. and S. Matsushita, Penetration of high latitude
electric field into low latitudes. J. Atoms. Terr. Phys., 43, 411-
415, 1981.
24. Balsley, B. B., Electric fields in the equatorial ionosphere: a
review of techniques and measurements. J. Atoms. Terr. Phys.,
35, 1035-1044, 1973.
25. Moore, J. G and E.J. Weber, OI 6300 A airglow measurements of
equatorial plasma depletions, J. Atmos. Terr. Phys., 43, 851-858,
1981.
26. Barlets, J., The technique of scaling indices K and Q of
geomagnetic activity. Ann. Int. Geophys. Year, 4, 215-226,
(1957).
27. Menvielle, M., and A. Berthelier, The K-derived planetary indices:
description and availability. Rev. Geophys., 289(3), 415-432,
(1991).
28. Rishbeth, H., How the thermosphere circulation affects the
ionospheric F2-layer. J. Atmos. solar Terr. Phys., 60, 1385 –
1402, 1998.
29. Sahai, Y., J. A. Bittencourt, N. R. Teixeira, and H. Takahashi,
Simultaneous observations of OI 7774-A and OI 6300-A
emissions and correlative study with ionospheric parameters. J.
Geophys. Res. 86, 3657, 1981 b.

Chapter_5_GKM OI 630 nm Night Airglow Emissions During Storm.
Department of Physics, S. U. Kolhapur Page | 166
30. Rishbeth, H., R. Gordon, D. Rees, and T. J. Fuller-Rowell
Modeling of thermospheric composition changes caused by a
severe magnetic storm, Planet. Space Sci., 1283-1301, 1985.
31. Misawa, K. and I. Takeuchi, Simultaneous observations of
progressive intensification of the oxygen red line in the four
cardinal directions. J. Atmos. solar Terr. Phys., 46, 105-108,
1984.