chapter 5 channel modeling and capacity analysis …chapter 5. channel modeling and capacity...
TRANSCRIPT

Chapter 5
Channel Modeling AndCapacity Analysis ForNanoscale CommunicationsAnd Networking
Authors:V. Musa1,2, G. Piro1,2, P. Bia3, L. A. Grieco1,2, D. Caratelli4, L. Mescia1,2,G. Boggia1,2
Affiliations:1 DEI, Politecnico di Bari. Via Orabona 4, Bari, Italy2 CNIT, Consorzio Nazionale Interuniversitario per le Telecomunicazioni3 Design Solution Department, Elettronica S.p.A., Via Tiburtina Valeria Km13,700, 00131 Rome, Italy4 The Antenna Company Nederland B.V., High Tech Campus, Eindhoven,The Netherlands

CHAPTER 5. CHANNEL MODELING AND CAPACITY ANALYSIS
Contents5.1 Introduction . . . . . . . . . . . . . . . . . . . . .
5.2 Channel models for nanoscale communicationsin human tissues . . . . . . . . . . . . . . . . . . .
5.2.1 Dielectric dispersion model . . . . . . . . . . . . .
5.2.2 FDTD modeling . . . . . . . . . . . . . . . . . . .
5.2.3 Electromagnetic simulations . . . . . . . . . . . . .
5.2.4 Path loss and noise models . . . . . . . . . . . . .
5.2.4.1 Absorption path loss . . . . . . . . . . . .
5.2.4.2 Spreading path loss . . . . . . . . . . . .
5.2.4.3 Total path loss . . . . . . . . . . . . . . .
5.2.4.4 Molecular noise temperature . . . . . . .
5.2.4.5 Noise power spectral density . . . . . . .
5.3 Transmission techniques . . . . . . . . . . . . . .
5.3.1 Transmission strategies . . . . . . . . . . . . . . .
5.3.1.1 Flat communication . . . . . . . . . . . .
5.3.1.2 Optimal communication . . . . . . . . . .
5.3.1.3 Pulse-based communication . . . . . . . .
5.4 Analysis of physical transmission rates and com-munication ranges . . . . . . . . . . . . . . . . . .
5.4.1 SNR . . . . . . . . . . . . . . . . . . . . . . . . . .
5.4.2 Channel capacity . . . . . . . . . . . . . . . . . . .
5.5 Summary . . . . . . . . . . . . . . . . . . . . . . .

5.1. INTRODUCTION
5.1 Introduction
The innovation process triggered by nanotechnology is rapidly concretizingthe idea to deploy network architectures at the nanoscale, made up by in-tegrated devices with size ranging from one to few hundred of nanometers.These devices are able to interact with each other by using novel communica-tion mechanisms, thus enabling new pioneering applications in Informationand Communication Technologies (ICT), biomedical, industrial, and militarydomains [1]. Accordingly, the time is ready to conceive innovative networkingmethodologies, protocols, and algorithms, which properly embrace the mainfacets of nanoscale communication systems, while fulfilling the requirementsof enabled applications. However, at this embryonic stage of the research,any activity focusing on nanoscale networking should ground its roots tosolid studies that carefully describe how the information is really exchangedbetween transmitter and receiver at the nanoscale. In this context, chan-nel modeling and capacity analysis become key aspects to investigate beforedeeply proceeding in this direction of research.
With reference to the healthcare domain, for instance, nanoscale commu-nications and networking could enable advanced immune systems, bio-hybridimplant solutions, drug delivering systems, pervasive health monitoring, andgenetic engineering [2] [3]. It is foreseen, in fact, that biomedical nano-devicescan be implanted, ingested, or worn by humans for collecting diagnostic in-formation (e.g., the presence of sodium, glucose, and/or other ions in blood,cholesterol, as well as cancer biomarkers and other infectious agents) and fortuning medical treatments (e.g., insulin and other drugs injection throughunder-skin actuators). In this context, while graphene-based nano-antennasgenerating electromagnetic waves in the Terahertz band (i.e., from 0.1 THzto 10 THz) make the communication feasible at the nanoscale and in humantissues [4], the actual physical transmission rates and communication rangesare significantly influenced by many aspects characterizing the communica-tion process [5]. The most important ones include propagation losses, thedispersive nature of the communication channel, the molecular noise, theadopted transmission techniques, and the positions of both transmitter andreceiver.
Starting from these premises, this book chapter aims to investigate physi-cal transmission rates and communication ranges reachable in human tissues,starting from the formulation of a sophisticated channel model that takesinto account the frequency and spatial dependence of the skin permittivity.
CHAPTER 5. CHANNEL MODELING AND CAPACITY ANALYSIS
First, the communication channel is modeled as a stratified medium, com-posed by stratum corneum, epidermis, dermis, and hypodermis. Here, theelectromagnetic field and the Poynting vector are calculated by using theFinite-Difference Time-Domain (FDTD) technique, able to directly solve theMaxwell’s equations in time domain. Second, starting from the aforemen-tioned channel model, the total path loss (expressed as the sum of spread-ing and absorption path loss), the molecular noise temperature, and thenoise power spectral density are evaluated as a function of the communica-tion frequency and the distance between transmitter and receiver. To makethe study more general as possible, two configurations are considered. Thefirst one, namely bottom-up, assumes that the transmitter is implanted inthe human body and the receiver is directly positioned on the skin surface.On the contrary, the second configuration, namely top-down, investigatesthe communication process when the position of both transmitter and re-ceiver are inverted with respect to the previous case. Third, by consideringthree different transmission mechanisms based on the Time Spread On-OffKeying (TS-OOK) modulation scheme [4] [6] (namely flat, pulse-based, andoptimal), the Signal-to-Noise Ratio (SNR) is evaluated as a function of com-munication frequency and the distance between transmitter and receiver. Allthe obtained results are finally processed for studying the upper bound ofphysical transmission rates and communication ranges achievable in humantissues when the reference communication bandwidth is delimited to the setof frequencies spanning from 0.5 THz to 1.5 THz.
The proposed study demonstrates that a physical data rate in the orderof Tbps can be only reached for transmission ranges less than 2 mm. Whenthe distance between transmitter and receiver exceeds 9 mm, communicationcapabilities are extremely impaired (i.e., the physical data rate tends to belower than 1 bps). Moreover, higher performance is measured for the bottom-up configuration, where inner layers of the communication medium producelower levels of attenuation of the propagating signal.
The rest of this book chapter is organized as in the following. Section5.2 presents the channel model formulated for the stratified media stack de-scribing human tissues. Section 5.3 describes the investigated transmissiontechniques. Section 5.4 discusses the SNR measured in the frequency do-main and illustrates physical transmission rates and communication rangesachievable in human tissues as a function of transmission techniques, distanceand position of both transmitter and receiver. Finally, Section 5.5 draws theconclusions.
5.2. CHANNELMODELS FOR NANOSCALE COMMUNICATIONS IN HUMANTISSUES
5.2 Channel models for nanoscale communi-
cations in human tissues
The modeling of the Pulsed Electric Field (PEF) propagation in biologicaltissues is a subject of increasing research activities since they are used ina number of applications in bioelectrics, a new interdisciplinary field com-bining knowledge of electromagnetic principles and theory, modeling andsimulations, physics, material science, cell biology, and medicine [7, 8, 9].Several studies are focused on the use of PEFs for reversible or irreversibleelectroporation to achieve selective killing of cancer cells, tissue ablation,gene therapy, and DNA based vaccination [10, 11]. Moreover, recent ap-plications employing PEFs technology include medical implant communica-tion service, wireless medical telemetry service, body area networks, nano-networks in a living biological environment, in-body electromagnetic com-munications [12, 13, 14, 15].
All these technologies involve the interaction of electromagnetic fieldswith complex dielectric materials. For instance, in the contest of the in-bodycommunications among the nano-devices the right evaluation of the networkperformance in term of data rate and transmission range needs of an accuratemodeling of the electromagnetic field propagation inside human tissues. As aresult, the development of theoretical models and computational techniquesto determine the propagation properties of electromagnetic pulses is funda-mental to gain insight into the several phenomena occurring within complexdielectric materials subject to an imposed PEFs. In fact, the complexityof the structure and composition of such matter produces a time-domainresponse generally non-symmetric and markedly different from that of di-electric media modeled by the simple dielectric response relationships. As aconsequence, the dielectric response in the frequency domain usually requiresempirical models exhibiting fractional powers of the angular frequency jω.Due to this, the solution of the Maxwell’s equations in the time domain isnot trivial since it involves the concept of fractional derivatives [16].
5.2.1 Dielectric dispersion model
The interaction between PEF and biological tissues takes place in differentrelaxation processes such as reorientation of dipolar molecules, interfacialpolarization, ionic diffusion due to ions of different signs of charges, conduc-

CHAPTER 5. CHANNEL MODELING AND CAPACITY ANALYSIS
tivity of surface cell structures, motion of the molecules, the non-sphericalshape as well as in different resonant phenomena due to molecular, atomic orelectronic vibrations. Their resulting behavior causes a frequency dispersionpattern of permittivity and conductivity [17].
The analytical theory modeling the frequency-dependent permittivity ofdielectric media is based on the response function through the following re-lation
φ(ω) =ε(ω)− ε∞
∆ε(5.1)
where ε(ω) is the frequency-dependent complex relative permittivity, ε∞ isasymptotic relative permittivity, ∆ε is the dielectric strength. An usefultechnique allowing the reproduction of the experimental spectra ε(ω) by ad-justing some free parameters of a mathematical expression is based on theuse of an empirical dielectric function model in conjunction with nonlinearleast square optimization. Using this method, the empirical response func-tions exhibiting a broad distribution of relaxation times has been proposed[18]
φ (ω) =1
[(jωτ)γ + (jωτ)α]β
(5.2)
where the adjusting parameters 0 ≤ α, β, γ ≤ 1 account for shape and be-havioral features of the permittivity function. The Eq. (5.2) strongly deviatefrom the conventional Debye law (γ = 0, α = β = 1) and it can be used toreproduce other empirical response functions as Cole-Cole (γ = 0, β = 1),Cole-Davidson (γ = 0, α = 1) and Havriliak-Negami (γ = 0) . However, itseffectiveness may fall when the dielectric response of more complex materi-als having heterogeneous, inhomogeneous and disordered structure at bothmicroscopic and mesoscopic scales has to be modeled. To overcome this lim-itation and to provide an extended model parametrization as well as a betterand flexible fitting of the experimental data over broad frequency ranges ageneral fractional polynomial series approximation has been proposed by theauthors [7, 8, 19]
φ (ω) =N∑i=1
∆εiQi
(5.3)
and
Qi =K∑k=0
bk,i (jωτk,i)βk,i (5.4)

5.2. CHANNELMODELS FOR NANOSCALE COMMUNICATIONS IN HUMANTISSUES
where bk,i, βk,i denote suitable real-valued parameters chosen so that i) toavoid model singularities, ii) to fulfill the consistency of the representation,and iii) to ensure the passivity condition. Applying a dedicated optimizationalgorithm employing a suitable relative error function, the free parametersbk,i, βk,i, τk,i, K,N can be evaluated [20]. This method is versatile because itscapability to deal with every data, it can reproduce fine details, and it provedto feature superior effectiveness in terms of convergence rate and accuracy.
5.2.2 FDTD modeling
The Finite Difference Time Domain (FDTD) technique is a well-known nu-merically robust and appropriate method for the computer technology oftoday. It is well know that the solution of Maxwell’s equations in dispersivemedia is a stiff problem and the development of FDTD methods to studythe transient wave propagation in such media is an area of active interest. Indetail, the FDTD implementation of the dispersion characteristics describedby Eq. (5.3)-(5.4) is difficult and it requires special treatments. However,the nature of the fractional order operators modeling the dielectric responsedescribed by Eq. (5.4) enables its incorporation into time-domain Maxwell’sequations using a non-local pseudo-differential operators of non-integer order.
For a nonmagnetic and isotropic dispersive dielectric material with re-sponse function described by Eq. (5.4) the frequency-domain Maxwell’sequations can be written as
∇×H = jωε0
(ε∞ − j
σ
ωε0
)E +
N∑i=1
Ji (5.5)
∇× E = −jωµ0H (5.6)
where σ is the static conductivity, H is the magnetic field, and the pth termof the auxiliary displacement current density J =
∑Ni=1 Ji is given by
Jp = jωε0∆εpQp
E (5.7)
where
Qp =K∑k=0
bk,p (jωτk,p)βk,p (5.8)
CHAPTER 5. CHANNEL MODELING AND CAPACITY ANALYSIS
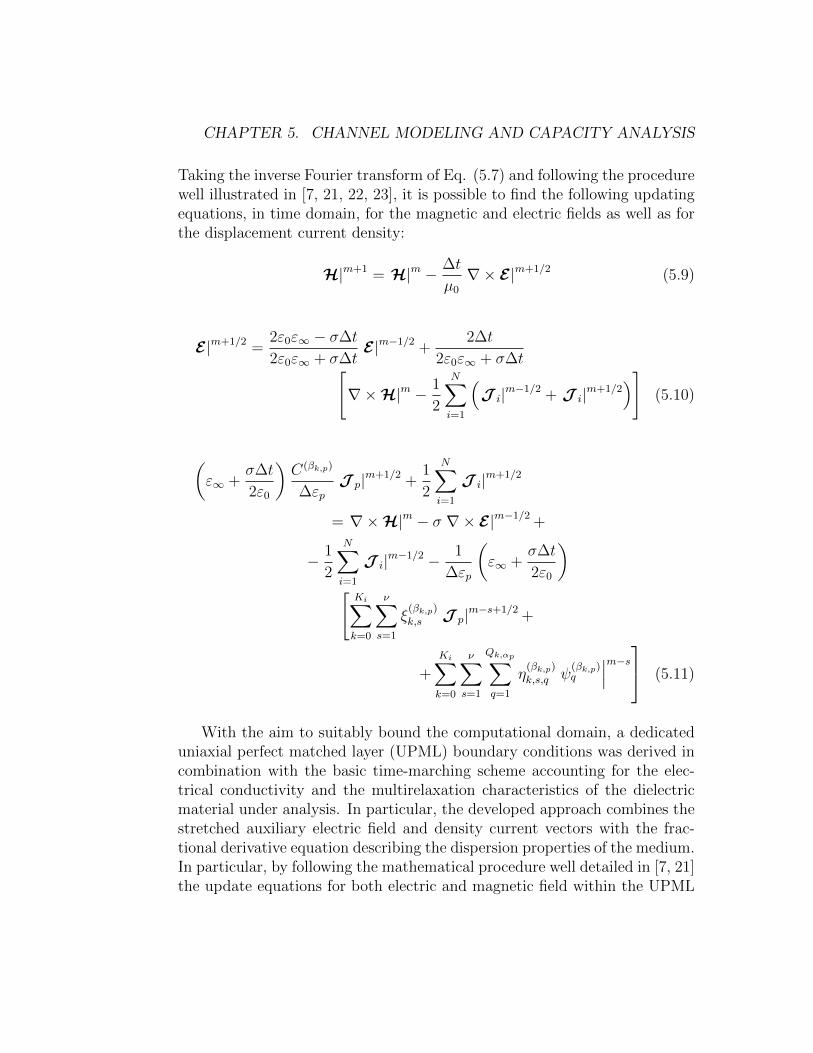
Taking the inverse Fourier transform of Eq. (5.7) and following the procedurewell illustrated in [7, 21, 22, 23], it is possible to find the following updatingequations, in time domain, for the magnetic and electric fields as well as forthe displacement current density:
H|m+1 = H|m − ∆t
µ0
∇× E|m+1/2 (5.9)
E|m+1/2 =2ε0ε∞ − σ∆t
2ε0ε∞ + σ∆tE|m−1/2 +
2∆t
2ε0ε∞ + σ∆t[∇×H|m − 1
2
N∑i=1
(J i|m−1/2 + J i|m+1/2
)](5.10)
(ε∞ +
σ∆t
2ε0
)C(βk,p)
∆εpJ p|m+1/2 +
1
2
N∑i=1
J i|m+1/2
= ∇×H|m − σ ∇× E|m−1/2 +
− 1
2
N∑i=1
J i|m−1/2 − 1
∆εp
(ε∞ +
σ∆t
2ε0
)[Ki∑k=0
ν∑s=1
ξ(βk,p)
k,s J p|m−s+1/2 +
+
Ki∑k=0
ν∑s=1
Qk,αp∑q=1
η(βk,p)
k,s,q ψ(βk,p)q
∣∣∣m−s (5.11)
With the aim to suitably bound the computational domain, a dedicateduniaxial perfect matched layer (UPML) boundary conditions was derived incombination with the basic time-marching scheme accounting for the elec-trical conductivity and the multirelaxation characteristics of the dielectricmaterial under analysis. In particular, the developed approach combines thestretched auxiliary electric field and density current vectors with the frac-tional derivative equation describing the dispersion properties of the medium.In particular, by following the mathematical procedure well detailed in [7, 21]the update equations for both electric and magnetic field within the UPML
5.2. CHANNELMODELS FOR NANOSCALE COMMUNICATIONS IN HUMANTISSUES
termination can be written as
E|m+1/2 =2ε0κx − σx∆t2ε0κx + σx∆t
E|m−1/2 +
+2ε0
2ε0κx + σx∆t
(e|m+1/2 − e|m−1/2
)(5.12)
and
H|m+1 =2ε0κx − σx∆t2ε0κx + σx∆t
H|m +
− 2Y0∆t
2ε0κx + σx∆t∇× E|m+1/2 (5.13)
where Y0 is the wave admittance in free space, σx, κx are the UPML materialparameters, and e is the auxiliary electric field vector.
5.2.3 Electromagnetic simulations
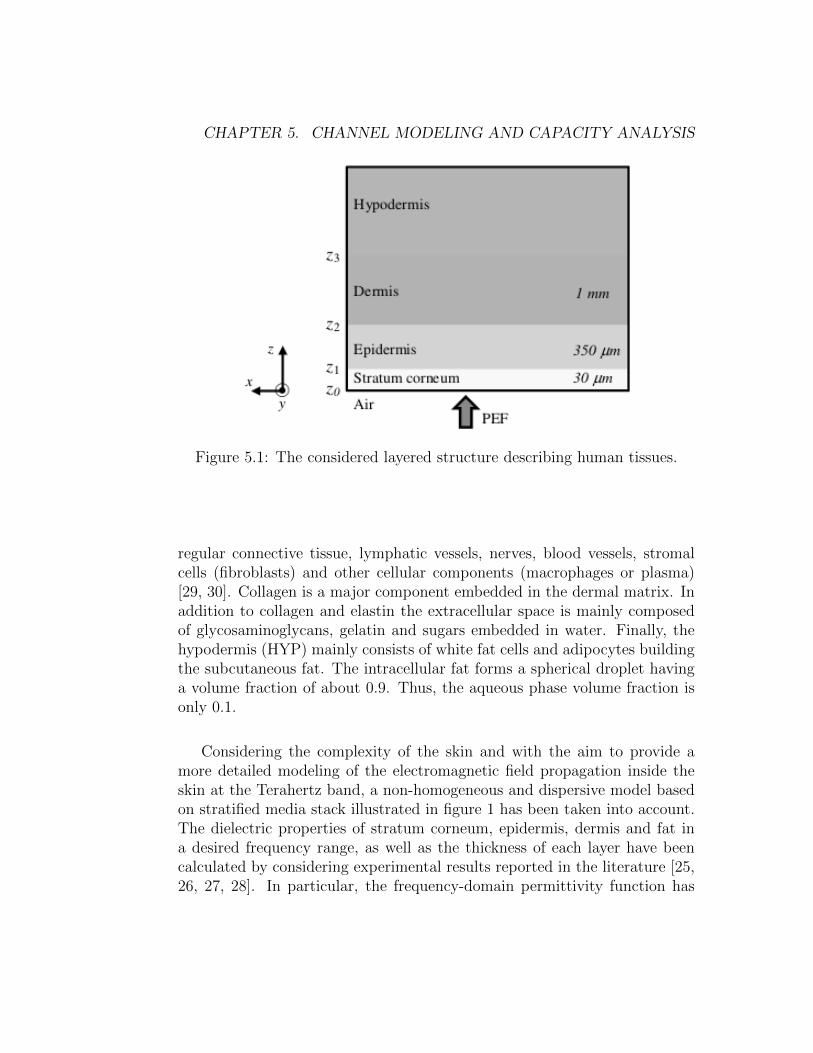
Most recent studies of electromagnetic channel at the Terahertz band forthe body-centric nano-networks treat the skin tissue as a homogeneous semi-infinite medium resulting by the binary mixture of water and biological back-ground material (bound water, keratin, lipids and collagen) [1, 24]. In gen-eral, the skin is a mosaic in which layers of laminated, inhomogeneous cellstructure pile up on top of one another. As a result, it can be modeled asa stratified media stack consisting of stratum corneum (SC), epidermis (E),dermis (D) and hypodermis (HYP) (see figure 1). The SC contains corneo-cytes embedded in a lipid matrix. The corneocyte does not contain a nucleusas well as the extracellular matrix mainly consists of lipids and proteinsand very little bound water. So, the total water volume fraction in the SC is0.15-0.25, while 90% of the water is contained within the corneocyte. The SCthickness depends on the body site and it is typically tens of micrometers. Inour modeling the SC is 20 µm thick [25, 26, 27, 28]. However, due to the highlipid and protein and low water content the SC differs significantly from theepidermis layer. In fact, the epidermis mainly consists of keratinocytes andit is characterized by an overall water volume fraction of about 0.7, equallydistributed among intra- and extracellular space. The dermis is the morecomplex and heterogeneous layer. In fact, the upper 10% consists of a densecollagen network and blood while the major part is mainly composed by ir-
CHAPTER 5. CHANNEL MODELING AND CAPACITY ANALYSIS
Figure 5.1: The considered layered structure describing human tissues.
regular connective tissue, lymphatic vessels, nerves, blood vessels, stromalcells (fibroblasts) and other cellular components (macrophages or plasma)[29, 30]. Collagen is a major component embedded in the dermal matrix. Inaddition to collagen and elastin the extracellular space is mainly composedof glycosaminoglycans, gelatin and sugars embedded in water. Finally, thehypodermis (HYP) mainly consists of white fat cells and adipocytes buildingthe subcutaneous fat. The intracellular fat forms a spherical droplet havinga volume fraction of about 0.9. Thus, the aqueous phase volume fraction isonly 0.1.
Considering the complexity of the skin and with the aim to provide amore detailed modeling of the electromagnetic field propagation inside theskin at the Terahertz band, a non-homogeneous and dispersive model basedon stratified media stack illustrated in figure 1 has been taken into account.The dielectric properties of stratum corneum, epidermis, dermis and fat ina desired frequency range, as well as the thickness of each layer have beencalculated by considering experimental results reported in the literature [25,26, 27, 28]. In particular, the frequency-domain permittivity function has

5.2. CHANNELMODELS FOR NANOSCALE COMMUNICATIONS IN HUMANTISSUES
been designed by minimizing the following error function:
err =
∫ωmax
ωmin
|εexp(ω)− ε(ω)|2dω∫ωmax
ωmin
|εexp(ω)|2dω
≤ δ, (5.14)
where δ is the maximum tolerable error, εexp is the measured permittivity, andε represents the general dielectric response. The set of parameters related toeach layer have been reported in Table 5.1. These values have been obtainedby using the relationship
ε(ω) = ε∞ +2∑i=1
∆εi
1 +∑2
k=1 bi,k (jωτi,k)βi,k− j σ
ωε0
(5.15)
in a bandwidth ranging from 0.5 THz to 1.5 THz.
Table 5.1: Parameters of the recovered complex permittivity function
Tissue b1,1 b1,2 b2,1 b2,2 β1,1 β1,2 β2,1 β2,2 ∆ε1 ∆ε1 σ (S/m) ε∞
StratumCorneum
10.11 -9.25 – – 0.9 0.88 – – 12.22 – 0.035 2.4
Epidermis 1.04 -0.02 – – 0.9 0.03 – – 89.61 – 0.01 3
Dermis 0.88 -0.17 10 -9.1 0.77 0.01 0.9 0.88 5.96 380.4 0.1 4
Hypodermis 0.89 -0.19 0.96 -0.05 0.81 0.01 0.8 0.04 1.14 9.8 0.035 2.5
The electromagnetic source is a plane wave propagating along the positivez-direction with electric field linearly polarized along the x-axis. In particular,the time-domain signal source is an electric current density J 0 placed at agiven position z = z inside the computational domain:
J 0(z, t) = exp
−a2
(t− 2
a
)2
sin
[2πf0
(t− 4
a
)]δ (z − z) x, (5.16)
where the parameters f0 = 1 THz and 1/a = 100 fs have been selected toachieve a bandwidth from 0.5 THz to 1.5 THz. The considered time andspatial steps are ∆t = 10 fs and ∆z = 6 µm, respectively. The validation

CHAPTER 5. CHANNEL MODELING AND CAPACITY ANALYSIS
Figure 5.2: Modulus of the normalized space-time distribution of electricfield.
of the developed numerical procedure has been illustrated in detail in ourprevious papers [7, 8, 19, 21, 31].
To provide a further insight, the Poynting vector, S(ω, z), is also reportedin Figure 5.4. In particular, it has been calculated as:
S(ω, z) = E×H∗,
E and H are the Fourier transform of E and H, respectively.In Figures 5.2,5.3 and 5.4, it can be observed the multiple reflected waves
generated by the stratified media stack as well as the main reflection phe-nomenon occurring at the air-skin interface. Moreover, it is evident the wavepulse spreading due to the propagation inside the dispersive biological media.
5.2.4 Path loss and noise models
To deal with nanoscale communications and networking, it is important toknow how the signal propagates across the medium. Starting from the FDTDmodel and related results reported above, this Section develops an accuratechannel model, taking into account two possible configurations. The first

5.2. CHANNELMODELS FOR NANOSCALE COMMUNICATIONS IN HUMANTISSUES
Figure 5.3: Modulus of the normalized space-time distribution of magneticfield.
Figure 5.4: Modulus of the normalized space-time distribution of Poyntingvector.

CHAPTER 5. CHANNEL MODELING AND CAPACITY ANALYSIS
one refers to the bottom-up communication, where it is assumed that thetransmitter is implanted and the receiver is positioned outside the humanbody (but attached to the skin). The second one refers to the top-downconfiguration, where the position of transmitter and receiver is inverted withrespect to the previous case. The resulting channel model embraces absorp-tion path loss, spreading path loss, molecular noise temperature, and noisepower spectral density. Such models will be used in the next Section forevaluating the communication capacity as a function of the distance betweentransmitter and receiver.
5.2.4.1 Absorption path loss
When an electromagnetic wave propagates through the medium, severalmolecules are excited and start to vibrate. In this case, part of the energycarried by the electromagnetic wave is lost or converted to kinetics energy[1]. The absorption path loss or molecular loss, i.e., Aabs(ω, z), describes theattenuation produced by the vibration of molecules as a function of bothdistance between transmitter and receiver, d, and communication frequency,f , that is:
Aabs(ω, z)
∣∣∣∣dB
= 10 logS(ω, z)
S(ω, z0)= 10k(ω)d log e, (5.17)
where S is the Poynting vectors, z0 is the z-coordinate of the reference section,d = z − z0 is the considered path length and k(ω) is the medium absorptioncoefficient.
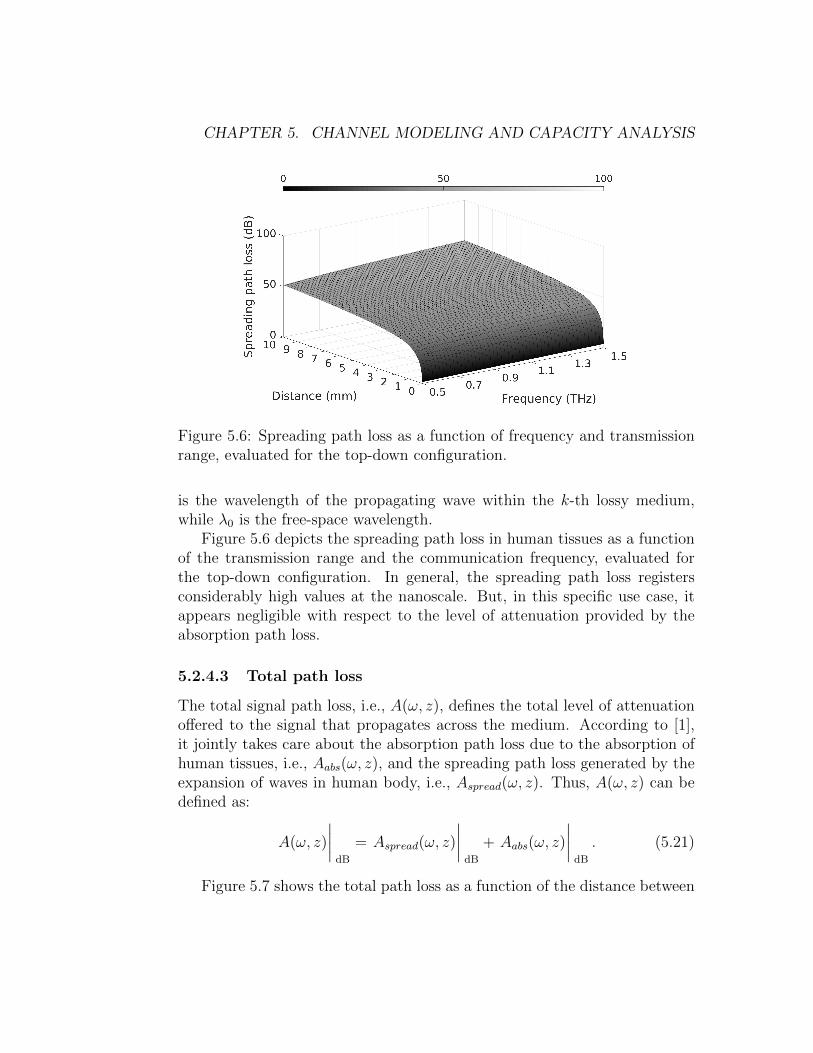
Given the stratified channel model reported in Figure 5.1, the absorptionpath loss offered by human tissues in the bandwidth from 0.5 THz to 1.5 THzis shown in Figure 5.5. Without loss of generality, the reported results con-sider the top-down configuration. The absorption path loss clearly appearsas a frequency-selective attenuation, which grows up when both transmissionrange and communication frequency increase.
5.2.4.2 Spreading path loss
The spreading path loss, i.e., Aspread(ω, z), refers to the attenuation due to theexpansion of an electromagnetic wave propagating through a given medium.

5.2. CHANNELMODELS FOR NANOSCALE COMMUNICATIONS IN HUMANTISSUES
Figure 5.5: Absorption path loss as a function of frequency and transmissionrange, evaluated for the top-down configuration.
It is defined as:
Aspread(ω, z)
∣∣∣∣dB
= 20 log
(4π
∫ z
z0
dz
λg(ω, z)
), (5.18)
where λg takes into account the stratified medium and depends on the dis-tance from the air-skin interface. Specifically, λg can be expressed as:
λg(ω, z) =
λg,1(ω, z) 0 ≤ z ≤ z1
λg,2(ω, z) z1 ≤ z ≤ z2
λg,3(ω, z) z2 ≤ z ≤ z3
λg,4(ω, z) z ≥ z3,
(5.19)
where
λg,k =λ0√√√√ε′k
2
[√1 +
(ε′′kε′k
+σk
fε0ε′k
)2
+ 1
] k = 1, 2, 3, 4 (5.20)
CHAPTER 5. CHANNEL MODELING AND CAPACITY ANALYSIS
Figure 5.6: Spreading path loss as a function of frequency and transmissionrange, evaluated for the top-down configuration.
is the wavelength of the propagating wave within the k-th lossy medium,while λ0 is the free-space wavelength.
Figure 5.6 depicts the spreading path loss in human tissues as a functionof the transmission range and the communication frequency, evaluated forthe top-down configuration. In general, the spreading path loss registersconsiderably high values at the nanoscale. But, in this specific use case, itappears negligible with respect to the level of attenuation provided by theabsorption path loss.
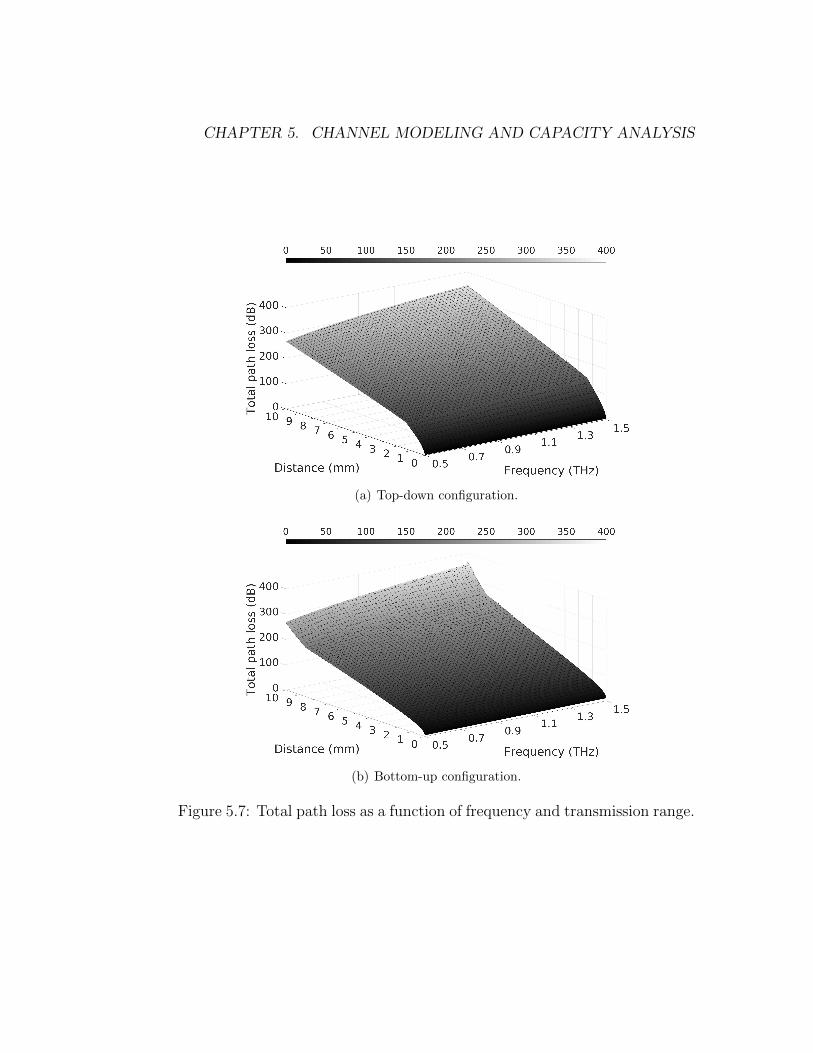
5.2.4.3 Total path loss
The total signal path loss, i.e., A(ω, z), defines the total level of attenuationoffered to the signal that propagates across the medium. According to [1],it jointly takes care about the absorption path loss due to the absorption ofhuman tissues, i.e., Aabs(ω, z), and the spreading path loss generated by theexpansion of waves in human body, i.e., Aspread(ω, z). Thus, A(ω, z) can bedefined as:
A(ω, z)
∣∣∣∣dB
= Aspread(ω, z)
∣∣∣∣dB
+ Aabs(ω, z)
∣∣∣∣dB
. (5.21)
Figure 5.7 shows the total path loss as a function of the distance between
5.2. CHANNELMODELS FOR NANOSCALE COMMUNICATIONS IN HUMANTISSUES
transmitter and receiver and the communication frequency, by taking intoaccount both top-down and bottom-up configurations. Generally, the totalpath loss grows up when the communication frequency and the transmissionrange increase. However, the comparison between Figure 5.7 (a) and Figure5.7 (b) shows how the outer skin layers introduce higher attenuation levelsthan the inner ones. Moreover, by comparing Figure 5.7 (a) with both Figure5.5 and Figure 5.6, it is evident how the total path loss is mainly influencedby the molecular absorption, which generates a loss up to 6 times higherthan the one introduced by the expansion phenomenon. Just to provide anexample, with reference to the considered communication bandwidth, themaximum value of the spreading path loss is 60.3 dB, while the absorptionpath loss registers a maximum value equal to 287.2 dB. Moreover, reportedresults fully confirm that the Terahertz band is strongly frequency-selective:in fact, the propagation loss significantly increases with both communicationfrequency and transmission range.
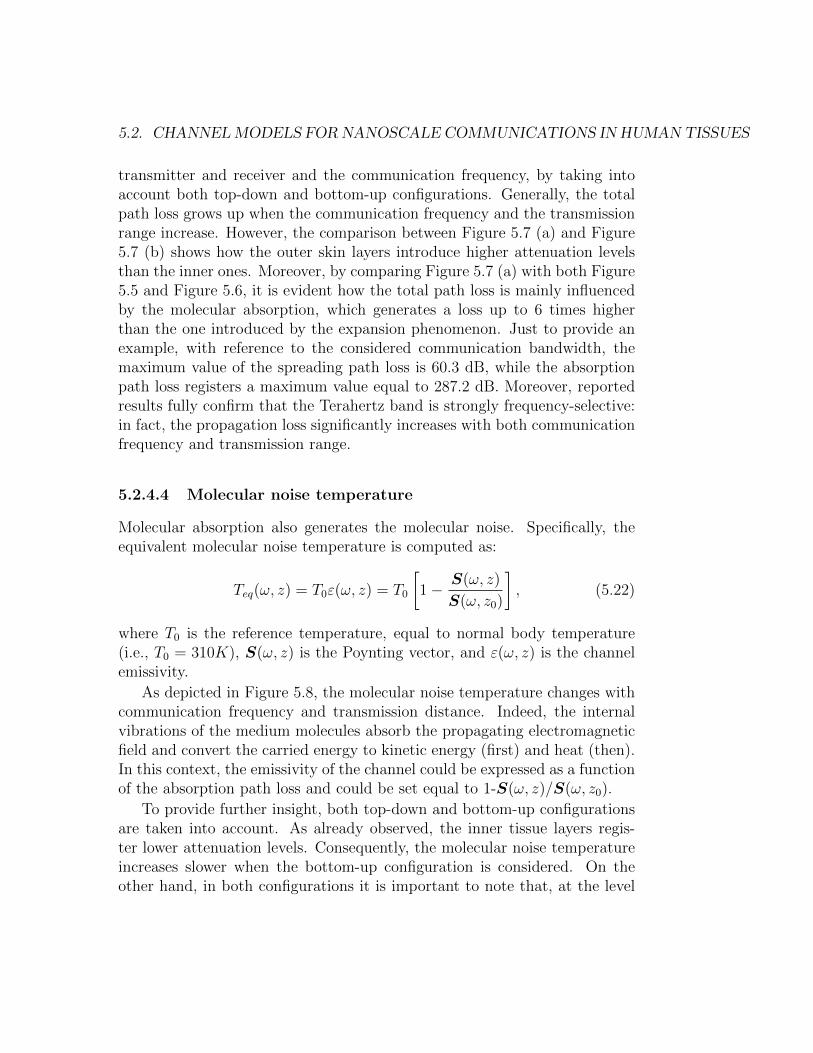
5.2.4.4 Molecular noise temperature
Molecular absorption also generates the molecular noise. Specifically, theequivalent molecular noise temperature is computed as:
Teq(ω, z) = T0ε(ω, z) = T0
[1− S(ω, z)
S(ω, z0)
], (5.22)
where T0 is the reference temperature, equal to normal body temperature(i.e., T0 = 310K), S(ω, z) is the Poynting vector, and ε(ω, z) is the channelemissivity.
As depicted in Figure 5.8, the molecular noise temperature changes withcommunication frequency and transmission distance. Indeed, the internalvibrations of the medium molecules absorb the propagating electromagneticfield and convert the carried energy to kinetic energy (first) and heat (then).In this context, the emissivity of the channel could be expressed as a functionof the absorption path loss and could be set equal to 1-S(ω, z)/S(ω, z0).
To provide further insight, both top-down and bottom-up configurationsare taken into account. As already observed, the inner tissue layers regis-ter lower attenuation levels. Consequently, the molecular noise temperatureincreases slower when the bottom-up configuration is considered. On theother hand, in both configurations it is important to note that, at the level
CHAPTER 5. CHANNEL MODELING AND CAPACITY ANALYSIS
(a) Top-down configuration.
(b) Bottom-up configuration.
Figure 5.7: Total path loss as a function of frequency and transmission range.

5.2. CHANNELMODELS FOR NANOSCALE COMMUNICATIONS IN HUMANTISSUES
(a) Top-down configuration.
(b) Bottom-up configuration.
Figure 5.8: Molecular absorption noise temperature as a function of fre-quency and transmission range.

CHAPTER 5. CHANNEL MODELING AND CAPACITY ANALYSIS
of millimeters, the equivalent molecular noise temperature is not very high,reaching maximum values approximately equal to 310 K (see Figure 5.8).The bounded level of the equivalent noise temperature suggests that a com-munication link, with a tolerable signal to noise ratio, can be establishedamong transmitter and receiver located inside and outside the human tissuesat the Terahertz band.
5.2.4.5 Noise power spectral density
Starting from the equivalent noise temperature Teq(ω, z), it is possible toevaluate the noise power spectral density, i.e., N(ω, z), as reported below:
N(ω, z) = kBTeq(ω, z), (5.23)
where kB is the Boltzmann constant (i.e., kB = 1.380658× 10⁻²³J/K).Now, by assuming a transmission bandwidth equal to B, the noise power
registered at the receiver side, i.e., Pn(ω, z), is evaluated as:
Pn(ω, z) =
∫B
N(ω, z)df = kB
∫B
Teq(ω, z)df (5.24)
It is evident how the molecular noise increases with communication frequencyand transmission distance. This also suggests that it is highly frequency-selective, therefore non-white.
5.3 Transmission techniques
At the nanoscale, the communication capacity is strictly influenced by thetransmission strategy and the adopted configuration (i.e., top-down andbottom-up configurations). Regarding the transmission strategies, this bookchapter considers three approaches that differently distribute the transmit-ted power in the frequency domain. They are: flat, pulse-based, and optimaltransmission schemes.
Thanks to the strong selectivity of the nanoscale communication chan-nel, the SNR and the resulting upper bound of the channel capacity canonly be evaluated by dividing the total bandwidth B into many narrow sub-bands lasting ∆f , where the channel is non-selective in the frequency domain.Let S(ωi, z) be the transmitted signal power spectral density of the generic
5.3. TRANSMISSION TECHNIQUES
transmission in the i-th sub-band centered at the frequency ωi at a distancez from the transmitter. The SNR for the i-th sub-band at a distance d, i.e.,SNR(ωi, z), can be computed as:
SNR(ωi, z) =S(ωi, z)
A(ωi, z)N(ωi, z), (5.25)
where A(ωi, z) is the total channel path loss and N(ωi, z) is the noise powerspectral density.
According to the Shannon theorem, the upper bound of the resultingchannel capacity is equal to:
C(z) =∑i
∆f log2 [1 + SNR(ωi, z)] =
=∑i
∆f log2
[1 +
S(ωi, z)
A(ωi, z)N(ωi, z)
]. (5.26)
As demonstrated before, the total path loss A(ωi, z) and the noise powerspectral density N(ωi, z) are influenced by the communication frequency andthe distance between transmitter and receiver. On the contrary, the sig-nal power spectral density S(ωi, z) is influenced by the adopted transmis-sion strategy. As a result, the channel capacity is strictly influenced by theadopted transmission strategy as well.
5.3.1 Transmission strategies
In nanoscale communications, the information is generally encoded by usingshort pulses spread over a large bandwidth. The scientific literature con-siders the TS-OOK as a promising modulation technique for the nanoscale,able to ensure both high energy and communication efficiency [4] [6]. WithTS-OOK, a logical 1 is encoded as a short pulse and a logical 0 is encoded asa silence. Moreover, the time interval between two consecutive pulses is muchlonger than the pulse duration. Consequently, two important advantages areensured: the nano-devices have not to be synchronized; the medium can beshared among multiple users without risk of collisions.
In what follows, let B = fM−fm be the total available bandwidth, wherefm and fM are the lower and the higher operative frequencies, respectively.When a pulse is transmitted, an amount of power Ptx is distributed in the

CHAPTER 5. CHANNEL MODELING AND CAPACITY ANALYSIS
frequency domain according to the three transmission strategies describedbelow.
5.3.1.1 Flat communication
Flat communication represents the simplest technique, where the transmittedpower Ptx is uniformly distributed in the frequency domain. In this case, thetransmitted power spectral density is:
Sflat(ω, z) =
S0 =PtxB
fm ≤ f ≤ fM
0 otherwise(5.27)
5.3.1.2 Optimal communication
Differently from the previous case, the optimal communication scheme op-timally distributes the transmission power within the operative bandwidthin order to maximize the channel capacity. Specifically, the signal powerspectral density is computed by solving the optimization problem:
maximize
∑i
∆f log2
[1 +
Sopt(ωi, z)
A(ωi, z)N(ωi, z)
](5.28)
by jointly taking into account the following three constraints:
1. The total transmission power, expressed as the sum of the signal powerspectral density for each sub-bands multiplied by the sub-channel width∆f , cannot exceed the maximum available power over the entire band-width Ptx: ∑
i∈Ω
Sopt(ωi, z)∆f ≤ Ptx; (5.29)
2. The power in a single sub-band should be a fraction, γ, of the totaltransmission power:
Sopt(ωi, z)∆f ≤ γPtx ∀i ∈ Ω, γ ∈ ]0, 1] ; (5.30)
3. The chosen transmission sub-channels must be adjacent:
Ω = i|iminΩ≤ i ≤ imaxΩ
. (5.31)

5.3. TRANSMISSION TECHNIQUES
The optimization problem formulated in Eq. (5.28) can be solved byusing the method of Lagrange multipliers. First of all, by considering thefirst constraint, the optimization problem can be expressed as:
max
∑i
∆f
(log2
[1 +
Sopt(ωi, z)
A(ωi, z)N(ωi, z)
]+ λSopt(ωi, z)
)− Ptx
(5.32)
where λ is the Lagrange multiplier. To find the maximum value, the deriva-tive of the argument of Eq. (5.32) with respect to Sopt(ωi, z) is put equal tozero, thus obtaining:
ln(2)[Sopt(ωi, z) + A(ωi, z)N(ωi, z)] = λ−1 ∀i (5.33)
As a consequence, the overall channel capacity is maximized when:
Sopt(ωi, z) = β − A(ωi, z)N(ωi, z), (5.34)
where β is a constant value which can be computed by means of an iterativeprocedure, following the water-filling principle. In particular, at the n-thstep, β is equal to:
β(n) =1
L(n)
[Ptx∆f
+∑i
A(ωi, z)N(ωi, z)
], (5.35)
where L(n) is the number of sub-bands at the n-th step. In details, to eval-uate L(n) value, the signal power spectral density Sopt(ωi, z) is computed byconsidering Eq. (5.34): if Sopt(ωi, z) ≤ 0, the corresponding value is set to0 and the considered sub-band is excluded for the following iterative cycles.The procedure can be stopped when there are no other sub-bands with a neg-ative Sopt(ωi, z) value. At the end, the total signal power appears optimallydistributed in the sub-bands which experience better channel conditions.
It is important to remark that, due to the monotonic behavior of the totalpath loss, as demonstrated in the previous Section, the selected sub-bandsare already adjacent and, consequently, the third constraint is intrinsicallyrespected.

CHAPTER 5. CHANNEL MODELING AND CAPACITY ANALYSIS
5.3.1.3 Pulse-based communication
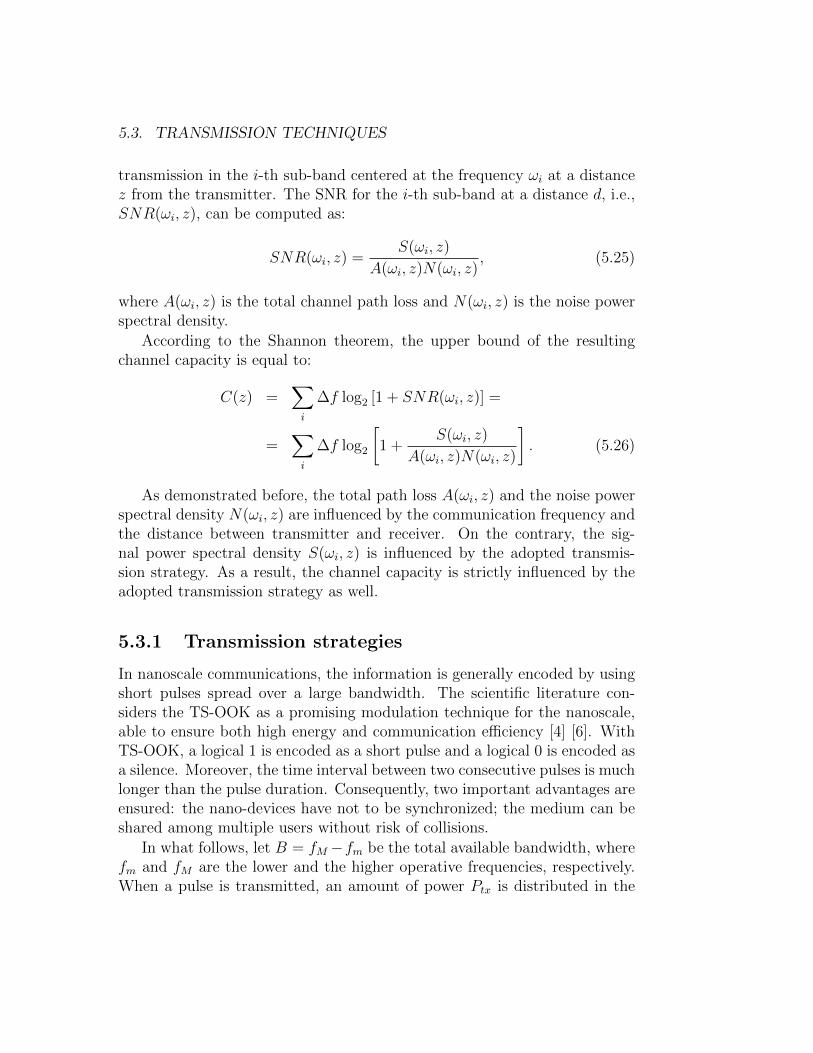
Flat and optimal transmission schemes are ideal approaches. Nanotechnol-ogy (and in particular graphene-based nano-antennas), instead, allows thetransmission of pulses having gaussian shapes in the time domain. Let
p(t) =1
s√
2πe−(t−µ)2/(2s2) be a Gaussian-based pulse, where µ is its mean
value and s is the related standard deviation. The pulse-based communica-tion approach models the transmitted pulse through the n-th derivative ofp(t), whose representation in the frequency domain is:
φ(n)(ω, z) = (2πf)2ne(−2πsf)2
(5.36)
Thus, the signal power spectral density of the n-th time derivative is stillGaussian-shaped and could be described as:
S(n)pulse(ω, z) = a2
0φ(n)(ω, z) = a2
0(2πf)2ne(−2πsf)2
, (5.37)
where a0 is a normalizing constant to adjust the pulse total energy, which isobtained as a2
0 = Ptx/∫ fMfm
φ(ω, z)df .
Figure 5.9 shows examples of Gaussian-based pulses, obtained by settingn in the range from 1 to 3. Note that, while the pulse duration remainsconstant (i.e., equal to 100fs), the number of oscillations grows up with thederivative order n.
5.4 Analysis of physical transmission rates and
communication ranges
In line with [1, 3, 4, 32, 33], and [34], the performance of a nanoscalecommunication system are evaluated by assuming that the pulse energyand the pulse duration are equal to 500 pJ and 100 fs, respectively. Thus,the resulting amount of power for each transmitted pulse is set to Ptx =500 pJ/100 fs = 5 kW. When the pulse-based communication strategy isevaluated, the derivative order n of the Gaussian pulse is chosen in the rangefrom 1 to 3 (as already shown before). Whereas, its standard deviation s isset to 0.15.
5.4. ANALYSIS OF PHYSICAL TRANSMISSION RATES AND COMMUNICATION RANGES
0 50 100 150
Time [fs]
-200
-150
-100
-50
0
50
100
150
200
Am
plit
ud
e [
V]
(a) n=1
0 50 100 150
Time [fs]
-200
-150
-100
-50
0
50
100
150
200
Am
plit
ud
e [
V]
(b) n=2
0 50 100 150
Time [fs]
-200
-150
-100
-50
0
50
100
150
200
Am
plit
ud
e [
V]
(c) n=3
Figure 5.9: Examples of pulses generated with the Pulse-based communica-tion scheme.
CHAPTER 5. CHANNEL MODELING AND CAPACITY ANALYSIS
5.4.1 SNR
Figure 5.10 and Figure 5.11 show the SNR estimated for top-down andbottom-up configurations, respectively. First of all, it is possible to ob-serve that these configurations show a common behavior. In both cases,accordingly to the total path loss trend, the SNR grows up when the com-munication frequency and the distance between source and destination nodedecrease. On the other hand, given the distance from the source node, thebottom-up configuration registers higher values of SNR than the top-downapproach. This is again justified through the total path loss behavior: the in-ner layers of the stratified medium introduce lower path loss than the outerones. This anticipates that the direction of the communication in humantissues influences the resulting link capacity.
Furthermore, by taking into account different communication schemes,the behavior of flat and pulse-based transmission strategies is not completelythe same, and this will bring to different values of the communication capacity(as illustrated later). Moreover, the study of the optimal transmission schemebrings to two important considerations. First, it is possible to note that theSNR can be evaluated only for a limited portion of the bandwidth, based onthe power profile solution of the optimization problem. Second, the adoptionof the optimal power profile brings to SNR values that slightly reduces withthe distance between communicating nodes, while maintaining similar valuesin the frequency domain.
5.4.2 Channel capacity
The upper bound of the channel capacity, obtained according to Eq. (5.26),is depicted in Figure 5.12 and Figure 5.13. Also in this case, several differ-ences can be observed between top-down and bottom-up configurations. Asalready envisioned, given the distance from the source node, the bottom-updirection ensures higher channel capacity. On the other hand, in any case,the channel capacity decreases with the transmission range. This clearlyhighlights the destroying effect of the path loss, which is even more evidentwhen the distance between transmitter and receiver increases.
As expected, the optimal transmission scheme reaches optimal perfor-mance. At the same time, the more realistic approach, based on the trans-mission of Gaussian-based pulses, generally achieves the lowest performance,which in turn get worse when the derivative order n of the Gaussian-based

5.4. ANALYSIS OF PHYSICAL TRANSMISSION RATES AND COMMUNICATION RANGES
(a) Flat transmission (b) Pulse-based transmission, n=1
(c) Pulse-based transmission, n=2 (d) Pulse-based transmission, n=3
(e) Optimal transmission
Figure 5.10: SNR obtained for the top-down configuration, by varying thetransmission strategies.

CHAPTER 5. CHANNEL MODELING AND CAPACITY ANALYSIS
(a) Flat transmission (b) Pulse-based transmission, n=1
(c) Pulse-based transmission, n=2 (d) Pulse-based transmission, n=3
(e) Optimal transmission
Figure 5.11: SNR obtained for the bottom-up configuration, by varying thetransmission strategies.

5.5. SUMMARY
0 2 4 6 8 10
Distance [mm]
100
102
104
106
108
1010
1012
1014
Capacity [bps]
FlatPulse-based, n=1Pulse-based, n=2Pulse-based, n=3Optimal
Figure 5.12: Channel capacity as a function of the transmission range, eval-uated for the top-down configuration.
pulse increases. In summary, it is possible to conclude that a channel ca-pacity in the order of Tbps can be only reached for transmission rangesless than 2 mm and 4 mm when the top-down and the bottom-up configu-ration are considered, respectively. Furthermore, when the distance betweenthe source node and the destination device exceeds 9 mm (top-down) and9.5 mm (bottom-up), communication capabilities are extremely injured (i.e.,the channel capacity becomes lower than 1 bps).
5.5 Summary
This book chapter investigated physical transmission rates and communica-tion ranges reachable in human skin. To this end, a sophisticated channelmodel taking into account the spatial dependence of the skin permittivityhas been formulated. Indeed, electromagnetic field and the Poynting vectorwere calculated by using the FDTD technique, while path loss, noise powerspectral density, and SNR were evaluated as a function of the communicationfrequency and the distance between transmitter and receiver. Starting fromthese models, physical transmission rates and communication ranges havebeen calculated by varying the transmission techniques and the positionsof both transmitter and receiver. The obtained results demonstrate that aphysical data rate in the order of Tbps can be only reached for transmission

CHAPTER 5. CHANNEL MODELING AND CAPACITY ANALYSIS
0 2 4 6 8 10
Distance [mm]
100
102
104
106
108
1010
1012
1014
Capacity [bps]
Flat
Pulse-based, n=1
Pulse-based, n=2
Pulse-based, n=3
Optimal
Figure 5.13: Channel capacity as a function of the transmission range, eval-uated for the bottom-up configuration.
ranges less than 2 mm. When the distance between transmitter and receiverexceeds 9 mm, communication capabilities are extremely impaired (i.e., thephysical data rate tends to be lower than 1 bps). These important findingsare extremely useful to drive future research activities devoted to the designof innovative networking methodologies, protocols, and algorithms for thenanoscale.

References
[1] J. M. Jornet and I. F. Akyildiz, “Channel modeling and capacity analysisfor electromagnetic wireless nanonetworks in the terahertz band,” IEEETransactions on Wireless Communications, vol. 10, no. 10, pp. 3211–3221, Oct. 2011.
[2] B. Atakan, O. Akan, and S. Balasubramaniam, “Body area nanonet-works with molecular communications in nanomedicine,” IEEE Com-munications Magazine, vol. 50, no. 1, pp. 28–34, Jan. 2012.
[3] G. Piro, G. Boggia, and L. A. Grieco, “On the design of an energy-harvesting protocol stack for Body Area Nano-NETworks,” Nano Com-munication Networks Journal, Elsevier, vol. 6, no. 2, pp. 74–88, Jun2015.
[4] J. M. Jornet and I. F. Akyildiz, “Graphene-based plasmonic nano-antenna for terahertz band communication in nanonetworks,” IEEEJournal on Selected Areas in Communications, vol. 31, no. 12, pp. 685–694, Dec. 2013.
[5] I. F. Akyildiz, C. Han, and S. Nie, “Combating the distance problem inthe millimeter wave and terahertz frequency bands,” IEEE Communi-cations Magazine, vol. 56, no. 6, pp. 102–108, June 2018.
[6] J. M. Jornet and I. F. Akyildiz, “Information capacity of pulse-basedwireless nanosensor networks,” in Proc. of IEEE Conf. on Sensor, Meshand Ad Hoc Communications and Networks, SECON, Jun. 2011, pp. 80–88.
[7] D. Caratelli, L. Mescia, P. Bia, and O. V. Stukach, “Fractional-calculus-based FDTD algorithm for ultrawideband electromagnetic characteriza-
REFERENCES
tion of arbitrary dispersive dielectric materials,” IEEE Trans. AntennasPropag., vol. 64, pp. 3533–3544, 2016.
[8] P. Bia, D. Caratelli, L. Mescia, R. Cicchetti, G. Maione, and F. Pru-denzano, “A novel FDTD formulation based on fractional derivativesfor dispersive Havriliak-Negami media,” Signal Processing, vol. 107, pp.312–318, 2015.
[9] H. Akiyama and R. Heller, Bioelectrics. Springer, Berlin, 2016.
[10] M. L. Yarmush, A. Golberg, G. Sersa, T. Kotnik, and D. Miklavcic,“A novel fdtd formulation based on fractional derivatives for dispersivehavriliak-negami media,” Annu. Rev. Biomed. Eng., vol. 16, pp. 295–320, 2014.
[11] M. Sustarsic, A. Plochowietz, L. Aigrain, Y. Yuzenkova, N. Z. N, andA. Kapanidis, “Optimized delivery of fluorescently labeled proteins inlive bacteria using electroporation,” Histochemistry and Cell Biology,vol. 142, pp. 113–124, 2014.
[12] S. Movassaghi, M. Abolhasan, J. Lipman, D. Smith, and A. Jamalipour,“Wireless body area networks: A survey,” IEEE Communications Sur-veys Tutorials, vol. 16, no. 3, pp. 1658–1686, 2014.
[13] T. Nakano, M. Moore, F. Wei, A. Vasilakos, and J. Shuai, “Molecularcommunication and networking: Opportunities and challenges,” IEEETransactions on NanoBioscience, vol. 11, no. 2, pp. 135–148, Jun. 2012.
[14] G. Piro, P. Bia, G. Boggia, D. Caratelli, L. A. Grieco, and L. Mes-cia, “Terahertz electromagnetic field propagation in human tissues: astudy on communication capabilities,” Nano Communication Networks,Elsevier, vol. 10, pp. 51–59, 2016.
[15] S. Canovas-Carrasco, A. J. Garcia-Sanchez, and J. Garcia-Haro, “Ananoscale communication network scheme and energy model for a hu-man hand scenario,” Nano Communication Networks, Elsevier, vol. 15,pp. 17–27, 2018.
[16] R. Magin, Fractional Calculus in Bioengineering. Begell House, 2006.
REFERENCES
[17] C. Polk and E. Postow, Biological Effects of Electromagnetic Fields. CrcPress, Boca Raton, USA, 19966.
[18] V. Raicu, “Dielectric dispersion of biological matter: Model combiningdebye-type and ”universal” responses,” Physical review. E, Statisticalphysics, plasmas, fluids, and related interdisciplinary topics, vol. 60, pp.4677–80, 1999.
[19] L. Mescia, P. Bia, M. A. Chiapperino, and D. Caratelli, “Fractionalcalculus based fdtd modeling of layered biological media exposure towideband electromagnetic pulses,” Electronics, vol. 6, p. 106, 2017.
[20] P. Bia, D. Caratelli, L. Mescia, and J. Gielis, “Analysis and synthesisof supershaped dielectric lens antennas,” IET Microwaves, Antennas &Propagation, vol. 9, pp. 1497–1504, 2015.
[21] L. Mescia, P. Bia, and D. Caratelli, “Fractional derivative based FDTDmodeling of transient wave propagation in Havriliak-Negami media,”IEEE Trans. Microwave Theory and Techniques, vol. 62, pp. 1920–1929,2014.
[22] P. Bia, L. Mescia, and D. Caratelli, “Fractional calculus-based model-ing of electromagnetic field propagation in arbitrary biological tissue,”Mathematical Problems in Engineering, vol. 2016, pp. 1–11, 2016.
[23] L. Mescia, P. Bia, and D. Caratelli, “Fractional-calculus-based electro-magnetic tool to study pulse propagation in arbitrary dispersive di-electrics,” Physica Status Solidi A, 2018.
[24] K. Yang, A. Pellegrini, M. Munoz, A. Brizzi, A. Alomainy, and Y. Hao,“Numerical Analysis and Characterization of THz Propagation Channelfor Body-Centric Nano-Communications,” IEEE Transactions on Tera-hertz Science and Technology, vol. 5, no. 3, pp. 419–426, May 2015.
[25] K. Sasaki, M. Mizuno, K. Wake, and S. Watanabe, “Measurement ofthe dielectric properties of the skin at frequencies from 0.5 GHz to 1THz using several measurement systems,” in Proc. of International Con-ference on Infrared, Millimeter, and Terahertz waves (IRMMW-THz),Hong Kong, August 2015.
REFERENCES
[26] M. Ney and I. Abdulhalim, “Does human skin truly behave as an arrayof helical antennae in the millimeter and terahertz wave ranges ?” OpticsLetters, vol. 35, pp. 3180–3182, 2010.
[27] S. Naito, M. Hoshi, and S. Yagihara, “Microwave dielectric analysis ofhuman stratum corneum in vivo,” Biochimica et Biophysica Acta, vol.1381, pp. 293–304, 1998.
[28] P. Hasgall, F. D. Gennaro, C. Baumgartner, E. Neufeld, M. Gosselin,D. Payne, A. Klingenbock, and N. Kuster. (2015) IT-IS database forthermal and electromagnetic parameters of biological tissues. [Online].Available: http://www.itis.ethz.ch/database, access done 18/04/2019.
[29] S. Huclova, D. Erni, and J. Frohlich, “Modeling and validation of dielec-tric properties of human skin in the mhz region focusing on skin layermorphology and material composition,” Journal of Physics D AppliedPhysics, vol. 45, 2012.
[30] P. Zakharov, F. Dewarrat, A. Caduff, and M. Talary, “The effect ofblood content on the optical and dielectric skin properties,” Physiologicalmeasurement, vol. 32, pp. 131–149, 2011.
[31] L. Mescia, P. Bia, and D. Caratelli, “Fractional-calculus-based FDTDmethod for solving pulse propagation problems,” in Proc. of IEEE In-ternational Conference on Electromagnetics in Advanced Applications(ICEAA), Sep. 2015, pp. 460–463.
[32] G. Piro, K. Yang, G. Boggia, N. Chopra, L. A. Grieco, and A. Alo-mainy, “Terahertz communications in human tissues at the nano-scalefor healthcare applications,” IEEE Transactions on Nanotechnology,vol. 14, no. 3, pp. 404–406, May 2015.
[33] Bush, J. Paluh, G. Piro, V. Rao, V. Prasad, and A. Eckford, “Definingcommunication at the bottom,” IEEE Transactions on Molecular, Bio-logical, and Multi-Scale Communications (T-MBMC), vol. 1, no. 1, pp.90–96, Aug. 2015.
[34] J. M. Jornet and I. F. Akyildiz, “Joint energy harvesting and com-munication analysis for perpetual wireless nanosensor networks in theterahertz band,” IEEE Transactions on Nanotechnology, vol. 11, no. 3,pp. 570–580, May 2012.