chapter 5 business sector investment in r&d · chapter 5: business sector investment in r&d...
TRANSCRIPT

107 analysis | part i: investment and performance in r&d - investing for the future
Business sector investment in R&D
chaptEr 5
HIGHlIGHTSAt EU aggregate level, R&D expenditure financed by business enterprise has remained almost unchanged since 2000 at around 1.05 % of GDP. Additional business sources from abroad can be estimated at around 0.12 % of GDP, and private-non-profit funding of R&D amounts to 0.03 % of GDP in the EU, which brings R&D expenditure financed by private sources to 1.20 % of GDP at EU-27 aggregate level, far from the 2 % target.
Among Member States, with the exception of Austria and Slovenia, the sharpest increases between 2000 and 2009 are observed in countries that were at a very low level of business financed R&D (0.5 % of GDP and less). However, in addition to Austria and Slovenia, non-negligible increases also occurred in Denmark, Finland and Germany, which shows that further increases are still possible in Member States which already have high intensities of R&D financed by business.
Business R&D is more concentrated than GDP in Europe. Business R&D intensity is above 1 % of GDP in barely more than one quarter of NUTS 2 regions. However, innovation is more than R&D: other intangible assets create value. Different structures of intangibles investment — in particular the respective weights of R&D investment and organisational investment in total investment in intangibles — point to different innovation models across countries.
In 2007, R&D expenditure by affiliates of foreign parent companies represented between 20 % and 70 % of domestic business R&D expenditure in European countries113. In each of them, this share has not changed much since 2000, except in Poland, the Czech Republic and Slovakia where it increased substantially.
In the manufacturing sector, which performs most of total business R&D, foreign R&D expenditure is predominantly intra-European. In addition, despite a rising share of emerging countries in overseas R&D expenditures of US multinationals, Europe remains by far the most important location for US overseas R&D.
113 A large part of R&D expenditure by foreign affiliates in a country is financed locally, i.e. without funds coming from abroad. This high share of domestic business R&D performed by foreign affiliates in Europe is therefore consistent with a much lower share of domestic business R&D funded by business abroad.
Altogether, in the four economies — the EU, the United States, South Korea and Japan — the main R&D performing sectors are manufacturing high-tech and medium high-tech sectors that make more than 70 % of total BERD in each economy. Manufacturing high-tech sectors, in particular, largely determine the overall level of business R&D intensity in a country.
In the EU, most of the sectors that perform the vast majority (80 %) of the EU BERD — in particular the manufacturing high-tech sectors — have become more research intensive since 1995. However, at the same time, the weight of these sectors in the EU economy has decreased, counterbalancing the research intensification observed at sector level. Overall, the result is a limited increase in the EU business R&D intensity since 1995 and stagnation since 2000.
Important conclusions can be drawn about the relationship between a country’s R&D investment in the business sector and its economic structure, by comparison with countries outside the EU:
� The main reason for the R&D gap between the EU and the
United States in manufacturing industry is the larger and
more research intensive American high-tech industry;
� The very high business R&D intensity of South Korea is linked
to the structure of its economy, clearly less dominated by
services than the EU or the United States (the weight of
the main high-tech and medium high-tech sectors in South
Korea’s economy is almost twice as large as in the EU or
US economy).
� The very high business R&D intensity of Japan (and its
growth) highlights an exceptionally high and growing
research intensity in particular in the high-tech sector ‘office
machinery and computers’, and in large, medium high-tech
sectors that are more research-intensive than in the other
economies. In addition, the weight of the high-tech sectors in
Japan’s economy is one third larger than in the EU’s economy.
Within the high-tech industry, ICT sectors play a prominent role in business R&D. Worldwide, the ICT industry occupies and maintains its position as a leading R&D investing sector by R&D expenditure and patenting activity.

chaptEr 5: businEss sEctor invEstmEnt in r&d 108
The chapter shows that:
� Europe has been, and is still, lagging behind its main
competitors in terms of ICT R&D investment and ICT R&D
patenting, with significant differences between the Member
States. There are significant differences across ICT sub-sectors
indicating regional specialisation and also differentiating
dynamics between the EU, US and Asian countries.
� This lag is largely due to the share of the EU ICT sector in
the economy, its industrial composition and the size of its
companies. For example, large EU ICT companies are smaller
than their US equivalents, and did not grow as quickly in the
last few decades. This is a particular weakness in the most
promising segments, for example in the ‘computer services
and software’ sub-sector, where EU Internet companies have
failed so far to achieve a truly global scale. A growing part of
the R&D gap can be observed in this sector.
� Europe is an important location for foreign ICT R&D
investment, but international cooperation in R&D is evolving
from a dominant EU–US relationship to global networking
where the US–Asia relationship is taking a growing
share. Here too, it seems that US companies are grasping
opportunities more rapidly than EU ones.
These findings point to the need for structural change in the EU's economy to ensure its competitiveness in an increasingly knowledge-based world economy. A broader analysis of the EU's structural change is presented in Part V.
5.1. is the business sector increasing its funding to r&d?
In the Europe 2020 Strategy, the EU has maintained its objective to devote 3 % of its GDP to R&D without specifying the relative efforts of the public and private sectors to reach this objective.
The 2002 Barcelona Objectives targeted an increase in both the overall expenditure on R&D (to approach 3 % of EU GDP allocated to R&D by 2010) and the share of R&D expenditure funded by the public and private sectors. According to the Barcelona Objectives, one third of total R&D expenditure should be funded by the public sector, two thirds by the private sector. Chapter 3 focused on public funding of R&D. This chapter looks at private funding of R&D, i.e. funding by the business sector.
The evolution of R&D expenditure financed by business sector varies across Member States
At EU aggregate level, R&D expenditure financed by business sector has remained stable at around 1.05 % of GDP since 2000. Additional business sources from abroad can be estimated at around 0.12 % of GDP, and private-non-profit funding of R&D amounts to 0.03 % of GDP in the EU, which brings R&D expenditure financed by private sources to 1.20 % of GDP at EU-27 aggregate level, far from the 2 % target. In only two Member States, Finland and Sweden, business-financed R&D intensity is above 2 % of GDP114. All other Member States are below 1.5 % of GDP, except Denmark, Germany and Austria115 (see Box I.5.1).
Between 2000 and 2009116, R&D expenditure financed by business sector as % of GDP increased in 16 Member States (Figure I.5.1). It grew by more than 200 % in Estonia and Portugal, by 50 % to 80 % in Cyprus, Hungary and Austria, and by 7 % to 50 % in Slovenia, Spain, Latvia, Italy, Denmark, Ireland, Bulgaria, Finland, Czech Republic, Germany and Malta. In contrast, the sharpest decreases (by 20 % and more) of R&D expenditure financed by the business sector are observed in Luxembourg, Sweden and Slovakia.
With the exception of Austria and Slovenia (see Box I.1.2 on Austria in Chapter 1 of this Part), the sharpest increases between 2000 and 2009 are observed in countries that were at a very low level of business-financed R&D (0.5 % of GDP and less). This is in part due to the simple statistical fact that absolute changes have different importance relative to the level of starting point, so that a very low starting point makes it possible to reach very high growth rates more easily. However, in addition to Austria and Slovenia, non-negligible increases also occurred in Denmark, Finland and Germany, which shows that further increases are still possible in Member States which already have high intensities of R&D financed by business.
A particular focus on the evolution of business-financed R&D expenditure in 2009 during the economic crisis is to be found in Chapter 2 of this Part.
114 Below the national private target of 3 % set by each of these two countries.
115 In Austria, abroad-business financed R&D expenditure at the level of 0.41 % of GDP in 2007. If this value has been maintained until 2010, added to the 1.21 % of GDP financed by business enterprise in 2010 (Figure I.5.1 and footnote (2) to this figure) and with the addition of 0.01 % of GDP by private-non-profit sector, R&D financed by private sources amounted to 1.63 % of GDP in 2010 in Austria.
116 For data availability reasons, the actual period covered differs across countries, see footnote to Figure I.5.1.

3.80
2.70
2.69
2.46
2.12
2.04
1.86
1.82
1.80
1.33
1.21
1.20
1.16
1.10
1.08
1.07
1.05
0.90
0.88
0.85
0.75
0.72
0.70
0.61
0.56
0.55
0.53
0.35
0.33
0.31
0.28
0.18
0.18
0.18
0.17
0.17
0.17
0.14
0.08
Israel(3)
Finland
Japan
South Korea(4)
Sweden(4)
Switzerland
United States(5)
Denmark(4)
Germany
Iceland
Austria
Luxembourg
Belgium
China
Slovenia(4)
France(4)
EU
Ireland
Netherlands(4)
United Kingdom
Norway
Portugal
Czech Republic
Spain
Italy
Estonia
Hungary
Turkey
Croatia
Russian Federation
Malta
Greece
Poland
Lithuania
Latvia
Slovakia
Romania
Bulgaria
Cyprus
Innovation Union Competitiveness Report 2011Source: DG Research and InnovationData: Eurostat, OECDNotes: (1) DK, EL, SE, IS, NO: 2001; HR: 2002; IT, MT: 2005. (2) EL: 2005; BE, LU, NL, NO, IL: 2007; EU, BG, DE, ES, FR, IT, CY, PT, IS, CH, US, JP, CN, KR : 2008; AT: 2010. (3) IL: GERD does not include defence. (4) DK, FR, NL, SI, SE, KR: Breaks in series occur between 2000 and 2009. (5) US: GERD does not include most or all capital expenditure.
0.0 0.5 1.0 1.5 2.0 2.5 3.0 3.5 4.0%
2000(1) 2009(2)
109 analysis | part i: investment and performance in r&d - investing for the future
FIGURE I.5.1 GERD financed by business enterprise as % of GDP, 2000(1) and 2009(2)

0.0 0.5 1.0 1.5 2.0 2.5 3.0%
Business enterprise (domestic) Abroad (business enterprise)
Finland
Sweden
Denmark
Austria
Belgium
France
Slovenia
Norway
Czech Republic
Portugal
Spain
Estonia
Croatia
Malta
Turkey
Slovakia
Poland
Greece
Lithuania
Romania
Cyprus
Innovation Union Competitiveness Report 2011Source: DG Research and InnovationData: EurostatNotes: (1) EL: 2005; BE, DK, AT, SE, NO: 2007; SK: 2009. (2) BG, DE, IE, IT, LV, LU, HU, NL and UK are not included on the graph because GERD financed by abroad (business enterprise) is not available for these Member States.
chaptEr 5: businEss sEctor invEstmEnt in r&d 110
Box I.5.1 – Business sources of funds for GERD: adding business funding from abroad to domestic business funding
FIGURE I.5.2GERD financed by business enterprise (domestic and abroad) as % of GDP, 2008(1)
When monitoring progress towards the EU 2 % target for private sources of funds for R&D, (domestic) business sector funding is used as a proxy for all private funding of R&D in a Member State. However, in any Member State, a ‘business sector abroad’ also finances R&D expenditure. Adding the business funding from abroad to domestic business funding gives a better account of the intensity of business funding for R&D in a Member State (Figure I.5.2). However, this data is not available in all Member States.
To exhaustively account for all private sources (beyond business sources), R&D financed by Private-Non-Profit (PNP) sector should also be added, to account for all private sources of funding for R&D. This source of funds is, however, very small on average in the EU (0.03 % of GDP) and not added in Figure I.5.2. Denmark, Sweden and the United Kingdom are the Member States with by far the largest amount of R&D financed by PNP, namely 0.08–0.09 % of GDP. Most Member States are around or below 0.03 % of GDP.

Canarias
Guyane GuadeloupeMartinique
Réunion
Açores Madeira
< 0.1
0.1 - 0.4
0.4 - 0.7
0.7 - 1.3
> 1.3
< 0.1
0.1 - 0.4
0.4 - 0.7
0.7 - 1.3
> 1.3
% of regional GDP
R&D expenditure in the business enterprise sector, as % of GDP - 2007
EU-27 = 1.19GR, IT: 2005; FR: 2004; NL: 2003Source: Eurostat
© EuroGeographics Association for the administrative boundaries
0 500 Km
REGIOgis
111 analysis | part i: investment and performance in r&d - investing for the future
Business R&D intensity is above 1 % of GDP in barely more than one quarter of NUTS 2 regions
Out of the 268 EU NUTS 2 regions, only around 50 had in 2007 a business R&D intensity above 1.3 % of GDP, 32 had above 2% and 72 above 1%. These regions are located in Nordic countries, in France, and in a central
band from Austria across the south of Germany, the Netherlands and Belgium to the South East of the United Kingdom. The business R&D intensity in most eastern and southern regions of the EU is below 0.4 % of GDP. R&D activities in these regions are often still dominated by public R&D activities.
FIGURE I.5.3 Business R&D expenditure as % of GDP by NUTS 2 regions, 2007

chaptEr 5: businEss sEctor invEstmEnt in r&d 112
However, a slight convergence was observed between 2000 and 2007, as many of the very low business R&D intensive regions, in particular in Southern, Central and Eastern Europe, have had a higher growth rate of business R&D intensity than the more business R&D intensive regions over that period.
Innovation is more than R&D: other intangibles matter in creating value
Firms’ efforts to create innovations require R&D, human capital (education) and skills (training), organisational capital, design and ICT along with tangible capital and adequate financial sources117. Investment in intangible assets is innovation-related investment.
The intensity of innovation efforts can be measured by investment in intangible assets (see Box I.5.2) in relation to GDP. Figure I.5.4 presents investment in intangibles (R&D, organisational competence, and other factors) as a share of conventional GDP in 2005, based on national accounts in Europe118. Investment in intangibles ranges from 9.1 % of GDP in Sweden and the United Kingdom to around 2 % of GDP in Greece. This is considerably higher than the scientific R&D investment (2.5 % of GDP in Sweden and 0.1 % of GDP in Greece, see Figure I.5.4)119, which demonstrates the importance of intangibles for innovation and competitiveness in each country.
117 The chain-link model of innovation and the national-innovation approaches stress these elements and their interactions.
118 In Luxembourg new financial product share is set at five times the EU27 average.
119 GDP measures come from national accounts which do not include the new intangibles. The capitalisation of intangibles implies an average increase of 5.5 per cent of the GDP for the EU-27 over the period 1995-2005 (See INNODRIVE Policy Brief February 2011).
Box I.5.2 – Measuring investment in intangibles: the INNODRIVE project120
The European political agenda recognises the importance of investment in innovation as a driver of ‘smart growth’. A central theme for the smart-growth strategy is that intangible assets need to be considered as innovation-related investment creating future value. Presently, intangibles are considered as cost and have not been included as investment in National Accounts; they are imprecisely valued in company-level balance of accounts. This means that their contribution to growth and productivity is not measured adequately.
INNODRIVE-project produces new estimates of intangibles for EU-27 countries and Norway following the Corrado, Hulten and Sichel (2006) typology121: computerised information (mainly software); innovative property (mainly scientific and non-scientific R&D, mineral exploration, copyright and licence costs, spending for artistic originals); economic/firm competences (spending on reputation, advertising, firm specific training and organisational capital).
All R&D-intensive countries (Sweden, Finland, Germany) tend also to rank above average in terms of their investment in intangibles. However, some countries that are not particularly R&D-intensive rank very high on this broader measure of innovation intensity (Belgium 8.3 %; the Czech Republic 8 %; the Netherlands 7.7 %; France 7.6 %, Hungary 7.5 %). This result points to a type of innovation model which emphasises organisational competence as one of the key drivers of growth. Sweden, the United Kingdom and France are also intensive in other types of intangibles (training, non-scientific capital, and database and software)122.
120 Project funded by the FP7 SSH cooperation programme, Grant no. 214 576.
121 Corrado/Hulten/ Sichel (2006), Intangible Capital and Economic Growth, NBER Working Paper No 11 948, National Bureau of Economic Research, Cambridge, MA.
122 See INNODRIVE Policy Brief February 2011.

0.1
0.2
0.1
0.1
0.1
0.5
0.6
0.3
0.5
0.2
0.2
0.8
0.3
0.6
1.6
1.6
0.2
1.3
0.8
2.2
0.4
1.2
0.9
0.8
1.1
2.5
0.9
1.1
1.2
2.2
2.6
2.6
1.6
2.2
1.7
1.7
2.6
2.4
2.1
3.3
2.6
1.8
2.7
3.3
1.9
2.5
2.5
3.9
2.3
2.5
2.9
4.4
1.8
5.2
0.9
0.8
1.0
1.3
1.5
2.3
1.7
2.8
2.5
1.9
2.2
2.2
1.5
2.5
3.0
2.2
2.9
3.9
3.9
2.6
3.2
4.1
4.3
4.3
2.8
4.8
3.0
Greece
Romania
Cyprus
Lithuania
Bulgaria
Spain
Norway
Portugal
Italy
Latvia
Poland
Malta
Estonia
Ireland
Germany
Austria
Slovakia
Denmark
Slovenia
Finland
Hungary
France
Netherlands
Czech Republic
Belgium
Sweden
United Kingdom
Scientific R&D investment Economic competence (not including training) Other
0 2 4 6 8 10
%
Innovation Union Competitiveness Report 2011Source: DG Research and InnovationData: INNODRIVE project
113 analysis | part i: investment and performance in r&d - investing for the future
FIGURE I.5.4 Investment in intangibles as % of GDP, 2005

Intangible investment Tangible investment
2.1
4.7
3.2
5.7
4.7
4.1
5.2
4.4
7.5
4.7
7.2
4.7
7.3
7.6
7.7
7.1
6.5
8.6
6.4
6.4
9.2
5.1
8.2
9.1
8.0
4.5
4.3
2.9
4.5
2.7
4.3
5.3
4.6
5.5
3.8
6.8
4.4
7.4
5.6
5.8
6.0
7.1
8.1
6.2
8.5
8.6
5.9
10.1
7.1
7.3
11.4
15.6
Greece
Latvia
Cyprus
Ireland
Poland
Lithuania
Estonia
Spain
Hungary
Portugal
Slovenia
Italy
Finland
France
Netherlands
Denmark
Slovakia
Luxemburg
Austria
Germany
United Kingdom
Malta
Belgium
Sweden
Czech Republic
Norway
0 5 10 15 20 25
%
Innovation Union Competitiveness Report 2011Source: DG Research and InnovationData: INNODRIVE project
chaptEr 5: businEss sEctor invEstmEnt in r&d 114
FIGURE I.5.5 Intangible and tangible investment as % of GDP, 2005
Figure I.5.5 shows the relative importance of intangibles in overall investment, which can be seen as an indication of the degree of transition towards a knowledge economy in 2005.

2000 2002 2003 2004 2005 2006 20072001
Innovation Union Competitiveness Report 2011Source: DG Research and Innovation Data: INNODRIVE project, based on data from the Confederation of Finnish Industries, Asiakastieto company information database.Note: (1) The data refer to the non-farm market sector. NACE 1.1 sections CA, DF, E, F, J are not included.
5
4
3
2
1
0
%
R&D investment
Organizational investment (performance based)
Organizational investment (expenditure based)
ICT investment
115 analysis | part i: investment and performance in r&d - investing for the future
Different structures of intangible investment point to different innovation models across countries
The different structures of intangibles across countries point to different innovation models related to technological and non-technological innovations. The structure of intangibles differs considerably in the United Kingdom and Finland, which can be taken as two opposite examples of organisational-capital-driven and R&D-driven economies respectively123.
Figures I.5.6 and I.5.7 show how the structure of intangible capital has evolved over the period 2000–2007 in Finland and 2000-2006 in the United Kingdom, based on firm-level data124. In Finland, according to the expenditure-based approach125, the investment rate in all intangibles (R&D, ICT and organisational-capital investment) was around 6 % of the new value added126 in 2000 and 8 % in 2007. The corresponding figures for the United Kingdom are
123 INNODRIVE project collects firm-level data on intangibles for six European countries: Czech Republic, Finland, Germany, Norway, Slovenia and the United Kingdom.
124 The data collection methodology of INNODRIVE allows the aggregation of micro-level firms’ data to national measures of intangible capital formation (expenditure-based approach to measure firms’ investments). This methodology is a great advantage for various types of economic analysis.
125 The expenditure-based approach gives only part of the picture regarding the value of intangibles when they are owned by the firm and when employees are not fully compensated for the value of intangible production.
126 New value-added figures are generated in the respective business sectors to include investment in intangibles.
10 % (2000) and almost 11 % (2006). While the totals are close in these two countries, the composition is, however, very different: the total is dominated by organisational investment in the United Kingdom, but largely dominated by R&D investment in Finland.
When using a performance-based approach127 the importance of organisational investment increases in both countries. This is explained by the widely observed gap between productivity and the wage costs of organisational workers. Using the performance-based approach, organisational investment is now closer to R&D investment in Finland. In the United Kingdom, organisational investment exceeds R&D investment regardless of the estimation method, although the difference seems to fade out in 2005–2006.
However, over the years 2000–2007, organisational investment (the largest component of organisational competence in the national estimates) decreased in both countries when the productivity of organisational-type work is used to construct these estimates. This decline may call for new types of innovation policy measures which go beyond R&D investment.
127 The performance-based approach with productivity estimate replacing wage costs gives a better understanding about the value of intangibles when they are owned by the firm and employees are not fully compensated for the value of intangible production. This is explained by the widely observed gap between productivity and wage costs of organisational workers.
FIGURE I.5.6 Finland - investment in intangibles as % of new value added, 2000-2007(1)

2000 2002 2003 2004 2005 20062001
Innovation Union Competitiveness Report 2011Source: DG Research and InnovationData: INNODRIVE project, based on Annual Survey of Hours and Earnings, Labour Force Survey, Annual Business Inquiry.Note: (1) The data refer to the non-farm market sector. NACE 1.1 sections CA, DF, E, F, J are not included.
7
6
5
4
3
2
1
0
% R&D investment
Organizational investment (performance based)
Organizational investment (expenditure based)
ICT investment
chaptEr 5: businEss sEctor invEstmEnt in r&d 116
5.2. is Europe attracting foreign funding to r&d?
A large part of business R&D in the world is performed by a small group of companies operating on a global scale. Multinational enterprises (MNEs) play a major role in the internationalisation of R&D and innovation with their growing investment in R&D abroad. While the majority of the R&D investment is still concentrated in the home countries, often close to the MNEs’ headquarters, foreign affiliates of MNEs play an important role within the multinational network when organising their R&D and innovation activities on a global scale.
In this section, a foreign affiliate is an enterprise resident in a country over which an institutional unit not resident in this country has control128.
128 Control is determined according to the concept of ‘ultimate controlling institutional unit (UCI)’. The UCI is the institutional unit, proceeding up a foreign affiliate’s chain of control, which is not controlled by another institutional unit. Foreign affiliates in a country can be created through greenfield investments of the parent foreign company or through acquisition of, or merger with, a domestic firm by a foreign firm. This definition includes affiliates of foreign affiliates.
In 2007, foreign R&D expenditure represented between 20 % and 70 % of domestic business R&D expenditure in European countries
In five of the sixteen European countries that provide this data, more than 50 % of domestic business R&D expenditure is performed by affiliates of foreign companies (inward R&D, figure I.5.8). For the eleven other European countries, the share of foreign affiliates in domestic business R&D ranges from 20 % (slightly less in Finland) to 45 %, compared to 14.3 % and 5.1 % in the United States and Japan respectively. Except for Ireland, the higher values observed in European countries are due to the intra-European cross-border business R&D investment which prevails (see below).
In the majority of the European countries that provide the data, the share of foreign affiliates in domestic business R&D increased between 2000 and 2007. The increase in Poland, Czech Republic, Slovakia and the United Kingdom is particularly pronounced.
FIGURE I.5.7United Kingdom - investment in intangibles as % of new value added, 2000-2006(1)

0 10 20 30 40 50 60 70 80%
Ireland
Belgium
Hungary
Czech Republic
Austria(4)
United Kingdom
Slovakia
Sweden
EU(5)
Poland
Norway
Spain
Germany
Italy
Portugal
France(4)
Finland
United States
Japan
Netherlands
Turkey
2000(2) 2007(3)
Innovation Union Competitiveness Report 2011Source: DG Research and Innovation Data: Eurostat, OECDNotes: (1) R&D expenditure of foreign affiliates. (2) DE, IE, ES, FR, IT, PT, SE: 2001; BE, HU, NO: 2003; AT: 2004. (3) ES: 2005; FI: 2006; FR, IT, HU, UK, US: 2008; NL, TR: data are not available. (4) FR, AT: Breaks in series occur between 2000 and 2008. (5) EU does not include BG, DK, EE, EL, ES, CY, LV, LT, LU, MT, NL, RO, SI, FI.
117 analysis | part i: investment and performance in r&d - investing for the future
FIGURE I.5.8Inward R&D expenditure(1) as % of R&D expenditure by business enterprise, 2000(2) and 2007(3)

Europe United States Rest of the World
Source: DG Research and Innovation Innovation Union Competitiveness Report 2011 Data: OECD Note: (1) IE: 2005; FI: 2006.
Innovation Union Competitiveness Report 2011Source: DG Research and InnovationData: OECDNote: (1) IE: 2005; FI: 2006.
0 10 20 30 40 50 60 70 80 90 100%
16.3
58.0
58.2
58.3
60.3
71.1
79.3
85.6
90.5
93.1
76.7
31.3
34.0
38.9
35.6
27.3
9.6
14.4
6.4
6.0
7.0
10.7
7.8
2.8
4.0
1.6
11.1
3.1
0.8
Ireland
Finland
France
Sweden
Germany
Poland
Austria
Slovakia
Norway
Portugal
chaptEr 5: businEss sEctor invEstmEnt in r&d 118
Foreign R&D expenditure in the manufacturing sector is predominantly intra-European
Intra-European foreign R&D expenditure contributes significantly to the high shares of foreign R&D investment in European countries (Figure I.5.9). With the exception of Ireland, in all European countries for which this data is available, more than 58 % (and up to 93 %) of R&D expenditure by foreign affiliates in the manufacturing sector is performed by affiliates of a European parent company. In contrast, in Ireland, US firms are by far the largest foreign R&D investors.
Although rising fast, R&D expenditure by affiliates of US companies in emerging countries is much smaller than their R&D expenditures in European countries
Figure I.5.10 below shows that Europe is still a very attractive location for overseas R&D activities for US companies. In contrast to the period 1995–2001,
when the EU share of foreign US R&D investment dropped by almost 10 percentage points (from 70.4 % to 61 %)129, the EU share remained stable between 2000 and 2007. In 2007, more than 60 % of US companies’ overseas R&D expenditures were still located in EU-27.
The share of emerging countries (Brazil, Russia, India and China) and South Korea is rising, but the gap between the EU and these countries remains large. In absolute terms, inflows of US R&D expenditures to the EU are increasing. Therefore, despite having a slightly decreasing share in overseas R&D expenditures of US multinationals, Europe remains by far the most important location for US overseas R&D.
129 OECD, The internationalisation of business R&D: evidence, impacts and implications, DSTI/STP(2007)28, October 2007.
FIGURE I.5.9 Inward R&D investment in manufacturing - % shares by investing region(1)

18 000
16 000
14 000
12 000
10 000
8 000
6 000
4 000
2 000
0
US
$ (m
illio
ns)
Japan
EU-4 (DE+FR+SE+UK) (2)
2000 2002 2003 2004 2005 20062001
BRICs (BR+IN+RU+CN) Israel
South Korea
Innovation Union Competitiveness Report 2011Source: DG Research and InnovationData: Austrian Institute of Technology based on the OECD FATS databaseNotes: (1) 2006 and 2007: Only majority-owned foreign affiliates. (2) The four EU Member States in receipt of the most R&D expenditure of overseas subsidiaries of US multinational firms.
119 analysis | part i: investment and performance in r&d - investing for the future
FIGURE I.5.10R&D expenditure of overseas subsidiaries of United States multinational firms, 2001-2007(1)
When examining company-level data, the share of R&D conducted by companies headquartered in the EU outside has increased slowly but steadily during recent years and is expected to continue to do so, particularly in India and China130. Not only do larger companies engage much more internationally, but the tendency for faster growth of R&D investment outside the EU has also been found in smaller companies131. Those companies that have been increasing their R&D over the period 2005–2011 invested predominantly within the EU (but also in China, India and the US), while those which decreased their R&D investment between 2005 and 2008 have done so exclusively in the EU (with R&D in the other three macro regions remaining stable or slightly increasing).
130 The 2009 EU Survey on R&D Investment Business Trends is part of the Industrial Research Investment Monitoring Activity of the Joint research Centre and DG RTD.
131 Cincera, M., Cozza, C., Tübke, A. and Voigt, P.: ‘Doing R&D or not, that is the question (in a crisis…), JRC-IPTS Working Papers on Corporate R&D and Innovation, 12/2010.
Both patterns suggest that an increasing share of the global BERD is being taken by emerging countries. From a policy-makers’ point of view, concerns may arise if the structure of R&D investment in the EU is seriously affected, e.g. when critical mass of R&D for a certain sector is gradually lost. Yet, the trend for EU firms to locate R&D activities abroad should not be seen as a trend to be reversed, as the study shows that the EU firms that exploit global technological expertise are also the companies that manage to maintain the strongest production activities in the EU. In fact, the absolute amount of R&D investment in the EU is expected to increase by around 40 % between 2005 and 2012. This reveals that R&D internationalisation is not a zero-sum game but also a way to enrich the R&D activity at home.

chaptEr 5: businEss sEctor invEstmEnt in r&d 120
5.3. what is the link between the business r&d deficit and economic structure in Europe?
In the research-intensive economies, the business sector is the main funder of R&D (see Figure I.3.1) as well as the main performer of R&D. In the EU, the R&D intensity of the business sector was equal to 1.25 % of GDP in 2009, barely higher than in 2000 (1.21 % of GDP). In comparison, business R&D intensity amounted to 2.01 % of GDP in 2008 in the United States (as in 2000).
In each economy, the overall level of business R&D intensity results from the relative sizes of its economic sectors and their respective research intensities. About 85 % of business R&D is performed by the manufacturing industry in the EU. Combining the manufacturing industrial composition of the EU and the United States together with R&D intensity by type of manufacturing industry gives the industrial composition of manufacturing R&D expenditure and its overall level in the EU and the United States.
A larger and more research-intensive high-tech industry in the United States explains a large part of the R&D gap between the EU and the United States in manufacturing industry
In manufacturing industry, R&D intensity — measured as R&D expenditure as a % of value added — varies greatly across sectors. The manufacturing sectors are usually grouped into four types of industry by decreasing order of R&D intensity132: high-tech, medium high-tech, medium low-tech and low-tech.
Figure I.5.11 (b) shows the average R&D intensity by type of industry for both the EU and the United States. The difference in R&D intensity across the four types of industry is clear-cut: in both economies, going from high-tech to low-tech, each industry type is several times less research-intensive than the one above and the research intensity is of a comparable order of magnitude (although not identical) on both sides of the Atlantic. Figure I.5.11 (b), therefore, highlights how strong an influence the research intensity in high-tech and medium high-tech industries has on the overall level of business R&D intensity in an economy.
132 Sectors included in each of these four types of industry are listed in the Methodological annex.
The following observations can be made from Figure I.5.11:
� In both the EU and the United States, high-tech
and medium high-tech sectors alone make up
about 90 % of all manufacturing R&D (Panel c).
� Manufacturing R&D is largely dominated by
high-tech sectors in the United States, while in
the EU, the high-tech and medium high-tech
sectors contribute to the same extent to total
manufacturing R&D (Panel c).
� Relative to GDP, high-tech sectors perform R&D
almost twice as much in the United States (0.87 %
of GDP) as in the EU (0.46 % of GDP) (Panel c).
� This is because (i) the share of high-tech sectors in
the US manufacturing industry is more than 40 %
larger than the share of high-tech sectors in the
EU manufacturing industry (17.7 % against 12.4 %,
Panel a) and (ii) high-tech sectors are 60 % more
research-intensive in the United States than in the
EU (Panel b).
� The medium high-tech and low-tech sectors are
also more research-intensive in the United States
than in the EU (Panel b). Quantitatively, the higher
research intensity of low-tech sectors in the United
States has a limited impact on the overall level
of business R&D expenditure. However, this may
have important consequences on the innovative
capacity and the productivity gains in low-tech
sectors.
Among high-tech sectors, Information and Communication Technology (ICT) plays a central role in the EU business R&D deficit (see section I.5.5 below).

(12.4%)
(32.0%)
(26.1%)
(29.5%)
(17.7%)
(24.9%)
(23.6%)
(33.8%)
EU-27(2) US(4)
6.5
1.0
1.8
8.5
24.1
0 5 10 15 20 25 30 35 40 45%
10.1
1.6
1.7
9.2
38.4
0 5 10 15 20 25 30 35 40 45%
0.0 0.2 0.4 0.6 0.8 1.0 1.2%
0.46 0.42 0.07 0.04 0.87 0.30 0.05 0.07
0.0 0.2 0.4 0.6 0.8 1.0 1.2%
1.4
High-Tech
High-Tech
Medium-High-Tech
Medium-High-Tech
Medium-Low-Tech
Medium-Low-Tech
Low-Tech
Low-Tech
Total
Total Manufacturing Total Manufacturing
High-Tech
Medium-High-Tech
Medium-Low-Tech
Low-Tech
Innovation Union Competitiveness Report 2011Source: DG Research and InnovationData: Eurostat, OECDNotes: (1) See Methodological Annex for the list of sectors included in each type of industry. (2) EU-27 does not include BG, EE, IE, EL, CY, LV, LT, LU, MT, PT, RO and SK. The 15 Member States included in the EU-27 aggregate account for more than 90% of Manufacturing Value Added and Manufacturing BERD in the EU. (3) The Manufacturing BERD data for BE, FR, FI, SE, UK were classified by product field; the data for all other countries were classified by main activity. (4) US: Building and repairing of ships and boats was included in medium high-tech rather than medium-low-tech.
Low-Tech Low-Tech
High-TechHigh-Tech
Medium-High-TechMedium-High-Tech
Medium-Low-TechMedium-Low-Tech
121 analysis | part i: investment and performance in r&d - investing for the future
FIGURE I.5.11(a) Manufacturing value added -
% distribution by type of industry(1), 2006
(b) Manufacturing BERD(3) as % of manufacturing value added by type of industry(1), 2006
(c) Manufacturing BERD(3) by type of industry(1) as % of total GDP, 2006

Young firms (created after 1975) Old firms (created before 1975)
Source: DG Research and Innovation, JRC-IPTS Data: The 2010 EU Industrial R&D Investment Scoreboard
Innovation Union Competitiveness Report 2011
3.3 2.8
3.6
6.1
4.4
11.8
0
2
4
6
8
10
12
14
R&
D In
ten
sity
(R&
D e
xpen
dit
ure
as
% o
f n
et s
ales
)
EU United StatesWorld
chaptEr 5: businEss sEctor invEstmEnt in r&d 122
Box I.5.3 – The role of ‘young’ innovative firms in research-intensive sectors
FIGURE I.5.12 R&D Intensity of the EU and US Scoreboard companies by age of company
The 2010 EU Industrial R&D Investment Scoreboard (referred to as the Scoreboard in this section) presents information on the world’s top 1400 companies (1000 non-EU and 400 EU) ranked by their investment in R&D. The Scoreboard finds that the sectoral composition of EU and US companies explains the R&D intensity gap between EU and US companies133. In addition, it highlights the role played by ‘young’ companies (created after 1975) in the gap:
� Young companies on the Scoreboard are on average almost twice as research-intensive as old companies (3.3 % vs 6.1 % respectively, figure below). This suggests that young companies are more likely to be found in research-intensive sectors.
� Young companies on the Scoreboard represent 17.8 % of EU companies, while they represents
133 The Scoreboard analyses R&D investments by top R&D-investing EU-based firms and US-based firms whatever the location of these investments. It therefore demonstrates the R&D intensity gap between top R&D- investing companies based on both sides of the Atlantic, which is not exactly the business R&D intensity gap between the EU and the US (which is about the R&D performed in the business sector on the territories of the EU and the US, whatever the nationality of the companies).
54.4 % of US companies (Figure I.5.13). This difference matters because young firms are more research-intensive than old firms.
� The EU-based young companies are much less research-intensive than their US counterparts (4.4 % vs 11.8 %, Figure I.5.12). This suggests that young companies are more concentrated in research-intensive sectors in the US.
� Altogether, a large part of the business R&D intensity gap between EU and US companies comes from a smaller number of young innovative companies in the most research-intensive sectors. The EU business R&D gap is a consequence of its industrial structure, in which new firms fail to play a significant role in the dynamics of the industry, in particular in high-tech sectors.

Source: DG Research and Innovation, JRC-IPTS Data: The 2010 EU Industrial R&D Investment Scoreboard.
Innovation Union Competitiveness Report 2011
17.8%
82.2%
54.4%
45.6%
EU US
Young firms (created after 1975) Old firms (created before 1975)
123 analysis | part i: investment and performance in r&d - investing for the future
FIGURE I.5.13 Shares of young and old Scoreboard companies
The evolution of overall business R&D intensity and structural change were very much tied together in the three largest Member States between 1995 and 2006
The business R&D intensity is to a large extent determined by the structure of the economy. Statistically, an increase in value on this indicator can be caused by two possible phenomena: the weight of the research-intensive sectors grows in the economy (structural change) and/or the research intensity of individual economic sectors grows.
In Germany, France and the United Kingdom, 79 %, 73 % and 70 % of total BERD in 2001–2006 was performed in the high-tech and medium high-tech sectors respectively. Between the two periods 1995–2000 and 2001–2006,
business R&D intensity increased in the only country where these sectors gained some weight in the economy, namely Germany (Table I.5.1). This increased weight of high-tech and medium high-tech sectors in Germany’s economy even out-weighted a general decline in research intensity of these sectors (Table I.5.2).
In contrast, increased research-intensity in a number of individual high-tech and medium high-tech sectors did not allow France and the United Kingdom to compensate for the decrease in economic weight of these sectors. This observation highlights the close link between the evolution of overall business R&D intensity and structural change in the three large Member States since 1995134.
134 The R&D intensity of an economy is mathematically related to the share of research-intensive sectors in the economy. Structural change can be driven by many factors, including R&D activities themselves.
TABLE I.5.1Evolution of structural change and business R&D Intensity in Germany, France and the United Kingdom, 1995-2006
High-Tech Value Added as % of total Value
Added(1)
High-Tech + Medium-High-Tech(2) Value Added as %
of total Value Added(1)
BERD as % of GDP
1995-2000 2001-2006 1995-2000 2001-2006 1995-2000 2001-2006
Germany 2.2 2.5 11.7 12.4 1.6 1.7 France 2.2 2.0 6.5 5.7 1.4 1.4 United Kingdom(3) 2.6 2.2 7.5 5.6 1.2 1.1
Source: DG Research and InnovationData: Rindicate consortium, based on the OECD ANBERD and STAN databasesNotes: (1) The total value added of the economy. (2) Medium-high-tech does not include 'Manufacture of other transport equipment'. (3) UK: 'Office machinery and computers' is not included in high-tech (0.2% and 0.1% of total value added in DE and FR respectively).
Innovation union Competitiveness report 2011increasedecrease between 1995-2000 and 2001-2006

chaptEr 5: businEss sEctor invEstmEnt in r&d 124
5.4. which are the top ten performing economic sectors in r&d?135
This section gives an overview of the main features that characterise the evolution of business R&D intensity in the EU and its main competitors, in terms of the evolution of both the research intensity of the different economic sectors and their respective weights in the economy.
The two tables below show the research intensity and the weight in terms of value added (VA) of the 7 to 10 main R&D performing sectors in each economy (the EU, the United States, Japan, South Korea). These 7 to 10 sectors make 70 % to 80 % of total BERD in each economy. These sectors are almost exclusively
135 This section is based on the study ‘Sectoral analysis of the long-term dynamics of business R&D intensity’, commissioned by DG Research and conducted by the Rindicate consortium in 2009.
manufacturing high-tech and medium high-tech sectors, but some are services sectors whose importance in an economy’s BERD — despite their low R&D intensity — comes from their large size in the economy.
Comparability of BERD data at industry level across countries is not fully ensured, as methods and practices to allocate business R&D expenditures to the different sectors differ across countries. Therefore, it is preferable to compare the parallel evolutions (of the sectoral research intensities and of the sectoral composition) over time in each economy rather than the actual values of sectoral R&D intensities in the different economies.
TABLE I.5.2Evolution of the R&D Intensity of high-tech and medium-high-tech(1) industrial sectors in Germany, France and the United Kingdom, 1995-2006
Nace code
IndustryGermany France
United Kingdom(2)
1995-2000
2001-2006
1995-2000
2001-2006
1995-2000
2001-2006
Hig
h-Te
ch
24.4Pharmaceuticals, medicinal chemicals and botanical products
24.2 22.2 32.9 32.2 45.5 45.0
30 Office machinery and computers 18.3 15.0 32.7 23.1 :(2) :(2)
32Radio, television and communication equipment and apparatus
37.2 32.0 35.3 44.9 12.8 23.4
33Medical, precision and optical instruments, watches and clocks
11.7 14.1 21.1 17.6 8.2 9.3
35.3 Aircraft and spacecraft 54.2 31.2 44.4 41.1 21.9 29.8
Med
ium
-Hig
h-Te
ch
24 less 24.4
Chemicals and chemical products, excluding pharmaceuticals
11.4 10.0 9.4 12.0 6.7 6.5
29 Machinery and equipment 5.7 5.8 5.0 5.9 4.9 6.0
31 Electrical machinery and apparatus 4.1 3.6 7.5 9.9 8.2 8.2
34Motor vehicles, trailers and semi-trailers
16.6 18.2 13.4 22.0 10.2 9.9
Source: DG Research and InnovationData: Rindicate consortium, based on the OECD ANBERD and STAN databasesNotes: (1) Medium-high-tech does not include 'Manufacture of other transport equipment'. (2) UK: 'Office machinery and computers' is not among the top R&D performing sectors in the UK.
Innovation union Competitiveness report 2011
increasedecrease between 1995-2000 and 2001-2006no significant change between 1995-2000 and 2001-2006

125 analysis | part i: investment and performance in r&d - investing for the future
The research intensity of most of the main R&D performing sectors, in particular the manufacturing high-tech sectors, grew between 1995 and 2006 in the EU, the United States, Japan and South Korea
Table I.5.3 shows that 8 out of the 10 sectors that make the bulk of EU BERD have become more research intensive (green) over the decade 1995–2006. In particular, the manufacturing high-tech and medium high-tech sectors, which are the most R&D-intensive in the economy, have become more research-intensive, apart from Aerospace and Chemicals (red).
In comparison, in the United States the high-tech sectors have seen a much more dramatic increase of their R&D
intensity than in Europe, apart from Aerospace, whose R&D intensity declined even more sharply than in Europe. The R&D intensity of high-tech sectors is markedly higher in the United States than in the EU over the period 2001–2006136. Particularly astonishing is the difference in R&D intensity of the sector Medical, precision and optical instruments, which is almost three times more research intensive in the United States.
In South Korea, research intensity increased in all the main high-tech and medium high-tech sectors of that country, but the different high-tech sectors remain markedly less research-intensive than in the EU and the United States, while the medium high-tech sectors are of comparable research intensity. What makes the difference in the case of South Korea is that high-tech
136 It is to be noted that the fact that the intensity of the services sectors in the United States is markedly higher than the EU is partly due to the method used in the US to classify R&D expenditures into sectors.
TABLE I.5.3Evolution of the R&D intensity of the most important R&D performing industries in each country(1)
Nace code
IndustryEU United States South Korea Japan Highest
value1995-2000 2001-2006 1995-2000 2001-2006 1995-2000 2001-2006 1995-2000 2001-2006
Total BERD intensity (expenditure / value added) 1.36 1.41 1.93 1.86 1.92 2.44 1.99 2.34 2.44 (KR)
Man
ufac
turin
g
Hig
h-Te
ch
24.4 Pharmaceuticals, medicinal chemicals and botanical products 25.4 26.4 25.3 31.9 3.1 5.3 20.5 27.5 45.0 (UK)
30 Office machinery and computers : : : : 10.6 11.4 36.0 115.6 115.6 (JP)
32 Radio, television and communication equipment and apparatus 27.8 31.3 22.8 39.8 17.6 22.7 16.8 16.4 44.9 (FR)
33 Medical, precision and optical instruments, watches and clocks 12.2 13.0 39.9 48.9 : : : : 48.9 (US)
35.3 Aircraft and spacecraft 37.3 33.4 32.8 22.4 : : : : 41.1 (FR)
Med
ium
-Hig
h-Te
ch
24 less 24.4 Chemicals and chemical products excluding pharmaceuticals 7.8 7.4 : : 4.7 6.2 14.8 16.8 16.8 (JP)
29 Machinery and equipment 5.0 5.4 : : 3.6 5.1 7.8 8.8 8.8 (JP)
31 Electrical machinery and apparatus 5.0 5.0 : : : : 18.1 21.0 21.0 (JP)
34 Motor vehicles, trailers and semi-trailers 13.7 16.0 15.2 14.9 16.0 14.5 13.1 15.5 22.0 (FR)
Ser
vice
s 60-64 Transport, storage and communications 0.6 0.7 : : 1.7 0.6 : : :
72 Software services 2.8 3.8 12.5 14.7 : : : : :
50-52 Wholesale and retail trade : : 1.5 1.0 : : : : :
45 Construction : : : : 0.8 0.9 : : :
Source: DG Research and InnovationData: Rindicate consortium, based on the OECD ANBERD and STAN databases
and on the EU KLEMS databaseNote: (1) Only the top R&D performing sectors that account
for more than 70% of R&D are considered for each country.
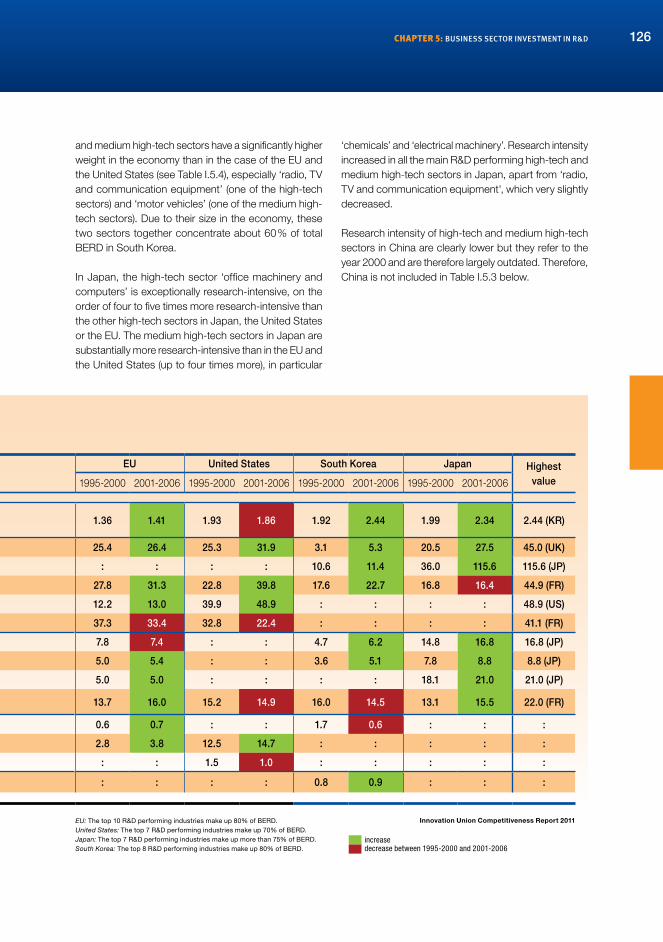
chaptEr 5: businEss sEctor invEstmEnt in r&d 126
and medium high-tech sectors have a significantly higher weight in the economy than in the case of the EU and the United States (see Table I.5.4), especially ‘radio, TV and communication equipment’ (one of the high-tech sectors) and ‘motor vehicles’ (one of the medium high-tech sectors). Due to their size in the economy, these two sectors together concentrate about 60 % of total BERD in South Korea.
In Japan, the high-tech sector ‘office machinery and computers’ is exceptionally research-intensive, on the order of four to five times more research-intensive than the other high-tech sectors in Japan, the United States or the EU. The medium high-tech sectors in Japan are substantially more research-intensive than in the EU and the United States (up to four times more), in particular
‘chemicals’ and ‘electrical machinery’. Research intensity increased in all the main R&D performing high-tech and medium high-tech sectors in Japan, apart from ‘radio, TV and communication equipment', which very slightly decreased.
Research intensity of high-tech and medium high-tech sectors in China are clearly lower but they refer to the year 2000 and are therefore largely outdated. Therefore, China is not included in Table I.5.3 below.
Nace code
IndustryEU United States South Korea Japan Highest
value1995-2000 2001-2006 1995-2000 2001-2006 1995-2000 2001-2006 1995-2000 2001-2006
Total BERD intensity (expenditure / value added) 1.36 1.41 1.93 1.86 1.92 2.44 1.99 2.34 2.44 (KR)
Man
ufac
turin
g
Hig
h-Te
ch
24.4 Pharmaceuticals, medicinal chemicals and botanical products 25.4 26.4 25.3 31.9 3.1 5.3 20.5 27.5 45.0 (UK)
30 Office machinery and computers : : : : 10.6 11.4 36.0 115.6 115.6 (JP)
32 Radio, television and communication equipment and apparatus 27.8 31.3 22.8 39.8 17.6 22.7 16.8 16.4 44.9 (FR)
33 Medical, precision and optical instruments, watches and clocks 12.2 13.0 39.9 48.9 : : : : 48.9 (US)
35.3 Aircraft and spacecraft 37.3 33.4 32.8 22.4 : : : : 41.1 (FR)
Med
ium
-Hig
h-Te
ch
24 less 24.4 Chemicals and chemical products excluding pharmaceuticals 7.8 7.4 : : 4.7 6.2 14.8 16.8 16.8 (JP)
29 Machinery and equipment 5.0 5.4 : : 3.6 5.1 7.8 8.8 8.8 (JP)
31 Electrical machinery and apparatus 5.0 5.0 : : : : 18.1 21.0 21.0 (JP)
34 Motor vehicles, trailers and semi-trailers 13.7 16.0 15.2 14.9 16.0 14.5 13.1 15.5 22.0 (FR)
Ser
vice
s 60-64 Transport, storage and communications 0.6 0.7 : : 1.7 0.6 : : :
72 Software services 2.8 3.8 12.5 14.7 : : : : :
50-52 Wholesale and retail trade : : 1.5 1.0 : : : : :
45 Construction : : : : 0.8 0.9 : : :
Innovation union Competitiveness report 2011EU: The top 10 R&D performing industries make up 80% of BERD.United States: The top 7 R&D performing industries make up 70% of BERD.Japan: The top 7 R&D performing industries make up more than 75% of BERD.South Korea: The top 8 R&D performing industries make up 80% of BERD.
increasedecrease between 1995-2000 and 2001-2006

127 analysis | part i: investment and performance in r&d - investing for the future
The economic weight of most of the main R&D-performing sectors declined between 1995 and 2006 in the EU, United States and Japan but increased in South Korea
Table I.5.4 shows that, with the exception of Pharmaceuticals and the two services sectors, all the sectors that perform most of the BERD in the EU saw a decline or a stagnation of their weight in the EU economy in terms of VA. The same holds in the United States. The decrease of the weight of high-tech sectors is more marked in the United States than in the EU, although it remains higher137.
137 See also the analysis of structural change in the EU in Part Part III, chapter 3.
What is remarkable is that the main R&D performing high-tech and medium high-tech sectors in South Korea account for 14 % of total VA in the economy, while the main R&D performing high-tech and medium high-tech sectors in the EU account for 7.8 % of total VA in the EU. Compared to the 1995–2000 period, this weight of high-tech and medium high-tech sectors in South Korea even increased (from 12.8 % of total VA). Although smaller than in South Korea, the share of the main R&D performing high-tech and medium high-tech sectors in Japan (9.6 % of total VA) is also higher than in the EU (7.8 % of total VA). However, this weight slightly declined between 1995 and 2006, as in the EU. In South Korea, and to a lesser extent in Japan, the very high weight of high-tech sectors in the economy plays a determinant role in the high overall level of business R&D.
TABLE I.5.4Evolution of the share in value added(1) of the most important R&D performing industries in each country(2)
Nace code IndustryEU United States South Korea Japan Highest
value1995-2000 2001-2006 1995-2000 2001-2006 1995-2000 2001-2006 1995-2000 2001-2006
Man
ufac
turin
g Hig
h-Te
ch
24.4 Pharmaceuticals, medicinal chemicals and botanical products 0.60 0.68 0.54 0.66 0.89 0.91 0.63 0.68 0.91 (KR)
30 Office machinery and computers : : : : 0.63 0.46 0.56 0.26 0.46 (KR)
32 Radio, television and communication equipment and apparatus 0.63 0.52 1.07 0.61 3.85 4.90 2.04 1.92 4.90 (KR)
33 Medical, precision and optical instruments, watches and clocks 0.60 0.61 0.44 0.36 : : 0.33 0.31 0.90 (DE)
35.3 Aircraft and spacecraft 0.28 0.28 0.53 0.49 : : : : 0.60 (UK)
Total high-Tech manufacturing 2.11 2.09 2.58 2.12 5.37 6.27 3.56 3.17 6.27 (Kr)
Med
ium
-Hig
h-Te
ch 24 less 24.4 Chemicals and chemical products, excluding pharmaceuticals 1.49 1.28 1.21 1.00 2.14 2.03 1.19 1.00 2.03 (KR)
29 Machinery and equipment 2.24 2.06 1.18 0.91 2.05 2.27 2.26 2.17 3.40 (DE)
31 Electrical machinery and apparatus 0.99 0.85 : : 0.98 1.07 1.14 0.94 1.07 (KR)
34 Motor vehicles, trailers and semi-trailers 1.58 1.50 1.25 0.94 2.22 2.36 1.91 2.30 3.20 (DE)
Total medium-high-Tech manufacturing 6.30 5.69 3.64 2.85 7.39 7.73 6.50 6.41 7.73 (Kr)
Ser
vice
s
60-64 Transport, storage and communications 6.68 6.85 : : 6.86 7.35 : : :
72 Software services 1.53 1.98 1.37 1.62 : : : : :
50-52 Wholesale and retail trade : : 13.07 12.60 : : : : :
Total services : : : : : : : : :
45 Construction : : : : 10.54 9.06 : : :
Source: DG Research and InnovationData: Rindicate consortium, based on the OECD ANBERD and STAN databases and on the EU KLEMS databaseNotes: (1) Share in the total value added of the economy. (2) Only the top R&D performing sectors that account for more than 70% of R&D are considered for each country.

chaptEr 5: businEss sEctor invEstmEnt in r&d 128
Several of the sectors with the largest R&D intensity gains and losses are the same in the EU and the United States
Figure I.5.13 presents the four sectors whose R&D intensity grew the fastest between the two periods 1995–2000 and 2001–2006 in the EU138. Two of them, ‘Radio, TV and communication equipment and apparatus’ and ‘Pharmaceuticals’, are high-tech sectors whose R&D intensity (R&D expenditures over value added) reached 31.2 % and 26.4 % respectively on average over the period 2001–2006 (from 27.8 % and 25.4 % respectively over 1995–2000). The medium high-tech sector ‘Motor vehicles’ progressed from
138 The EU includes 11 Member States covering more than 90 % of EU BERD: Germany, France, the United Kingdom, Italy, Sweden, Spain, the Netherlands, Belgium, Finland, Denmark and Ireland.
13.7 % to 16 %, while the service sector ‘Computer and related services’ progressed from 2.8 % to 3.8 %. The sector which experienced the largest fall in R&D intensity in the EU is the high-tech sector ‘Aerospace’ from 37.3 % to 33.4 %.
The trends in sectoral R&D intensity in the United States are similar to those of the EU, with ‘Radio, TV and communication equipment and apparatus’ and ‘Pharmaceuticals’ as top winners in R&D intensity, while ‘Aerospace’ and ‘Chemicals (excluding “Pharmaceuticals”)’ saw their R&D intensity decline significantly between 1995 and 2006.
Nace code IndustryEU United States South Korea Japan Highest
value1995-2000 2001-2006 1995-2000 2001-2006 1995-2000 2001-2006 1995-2000 2001-2006
Man
ufac
turin
g Hig
h-Te
ch
24.4 Pharmaceuticals, medicinal chemicals and botanical products 0.60 0.68 0.54 0.66 0.89 0.91 0.63 0.68 0.91 (KR)
30 Office machinery and computers : : : : 0.63 0.46 0.56 0.26 0.46 (KR)
32 Radio, television and communication equipment and apparatus 0.63 0.52 1.07 0.61 3.85 4.90 2.04 1.92 4.90 (KR)
33 Medical, precision and optical instruments, watches and clocks 0.60 0.61 0.44 0.36 : : 0.33 0.31 0.90 (DE)
35.3 Aircraft and spacecraft 0.28 0.28 0.53 0.49 : : : : 0.60 (UK)
Total high-Tech manufacturing 2.11 2.09 2.58 2.12 5.37 6.27 3.56 3.17 6.27 (Kr)
Med
ium
-Hig
h-Te
ch 24 less 24.4 Chemicals and chemical products, excluding pharmaceuticals 1.49 1.28 1.21 1.00 2.14 2.03 1.19 1.00 2.03 (KR)
29 Machinery and equipment 2.24 2.06 1.18 0.91 2.05 2.27 2.26 2.17 3.40 (DE)
31 Electrical machinery and apparatus 0.99 0.85 : : 0.98 1.07 1.14 0.94 1.07 (KR)
34 Motor vehicles, trailers and semi-trailers 1.58 1.50 1.25 0.94 2.22 2.36 1.91 2.30 3.20 (DE)
Total medium-high-Tech manufacturing 6.30 5.69 3.64 2.85 7.39 7.73 6.50 6.41 7.73 (Kr)
Ser
vice
s
60-64 Transport, storage and communications 6.68 6.85 : : 6.86 7.35 : : :
72 Software services 1.53 1.98 1.37 1.62 : : : : :
50-52 Wholesale and retail trade : : 13.07 12.60 : : : : :
Total services : : : : : : : : :
45 Construction : : : : 10.54 9.06 : : :
Innovation union Competitiveness report 2011EU: The top 10 R&D performing industries make up slightly less than 17% of value added.United States: The top 9 R&D performing industries make up slightly more than 19% of value added.Japan: The top 8 R&D performing industries make up slightly less than 10% of value added.South Korea: The top 9 R&D performing industries make up slightly more than 30% of value added.
increasedecreaseno change between 1995-2000 and 2001-2006

Source: DG Research and Innovation Data: Rindicate consortium, based on OECD ANBERD and STAN databases and EU KLEMS database. Notes: (1) EU includes 11 Member States covering more than 90% of EU BERD: BE, DK, DE, IE, ES, FR, IT, NL, FI, SE, UK. (2) The difference in average R&D Intensity between the two periods 2001-2006 and 1995-2000, in percentage points.
Innovation Union Competitiveness Report 2011
-3.9
-1.0
-0.8
-0.5
1.0
1.0
2.3
3.4
-4 -3 -2 -1 0 1 2 3 4
Aerospace
Coke and petroleum
Other transport equipment
Chemicals excluding pharmaceuticals
Pharmaceuticals
Computer and related services
Motor vehicles
Radio, TV and communication
equipment
Percentage points of sectoral R&D intensity
129 analysis | part i: investment and performance in r&d - investing for the future
In Japan, an extraordinary increase in R&D intensity occurred in the high-tech sector ‘Office machinery and computers’ between the two periods 1995–2000 and 2001–2006. The atypical evolution of this sector is responsible for a large part of the overall increase in business R&D intensity in Japan. The R&D intensity of ‘Pharmaceuticals’ is also among the top winners in R&D intensity in Japan. However, in contrast to the EU and the United States, no economic sector experienced a decline in R&D intensity in Japan between 1995 and 2006.
Overall, the slight increase in business R&D intensity in the EU in 2001–2006 compared to 1995–2000 is linked to a research intensification of most of the sectors that perform the vast majority (80 %) of the EU BERD, in particular the high-tech sectors, while the weight of these sectors in the economy tended to decrease
The above tables show that the slight increase in business R&D intensity overall in the EU in the period 2001–2006 compared to 1995–2000 is due to a research intensification of most of the sectors that perform the vast majority (80 %) of the EU BERD, in particular the high-tech sectors, while the weight of these sectors in the economy tended to decrease, with the notable exception of ‘Pharmaceuticals’.
In the United States, the same decline in the weight of high-tech and medium high-tech sectors is observed, while the increase in research intensity of the high-tech sectors is much larger than in the EU. However, in the United States in total, the decline in weight slightly over-compensates the gain in research intensity so that the overall business R&D intensity slightly declined in the United States.
The high business R&D intensity of South Korea comes from its economy’s composition, which is clearly less dominated by services than the EU or the United States, with the main South Korean high-tech and medium high-tech sectors being almost twice as important in the South Korean economy as in the EU or US economy. In contrast, high-tech sectors in South Korea are clearly less research-intensive than in the EU or the United States.
The high business R&D intensity of Japan (and its growth) comes from the exceptionally high and growing research intensity of the high-tech sector ‘Office machinery and computers’ and from very research-intensive medium high-tech sectors. In addition, the weight of high-tech sectors in Japan’s economy is one third larger than in the EU’s economy, although it suffered from a decline between 1995 and 2006 as in the EU and the United States. In total, the high growth in research intensity of the above-mentioned sectors in Japan largely overcompensates their decline in economic weight.
FIGURE I.5.14R&D Intensity gains and losses in the EU(1) - sectors with the most significant gains and losses, 1995-2006(2)

chaptEr 5: businEss sEctor invEstmEnt in r&d 130
Altogether, in the four economies of the EU, the United States, South Korea, and Japan, the main R&D performing sectors are manufacturing high-tech and medium high-tech sectors that make more than 70 % of total BERD in each economy. The research intensity of these sectors generally grew in the four economies between 1995 and 2006, while their weight in the economy declined, except in Korea where their already high weight grew still greater. This increase in sectoral research intensity is more pronounced in the high-tech and medium high-tech of Japan and in the high-tech sectors of the United States than in the EU.
Among high-tech sectors, ‘manufacture of office machinery and computers’ (hereafter ‘IT equipment’), ‘manufacture of radio, television and communication equipment’ (hereafter ‘ IT components, telecom and multimedia equipment’) and ‘manufacture of medical, precision and optical instruments, watches and clocks’ (hereafter ‘measurement instruments’)139 play a particularly important role in the EU business R&D deficit. Together with the two services sectors ‘post and telecommunications’ and ‘computer and related activities’140, they form what is called the ‘Information and Communication Technologies’ (ICT) industry. Section 5.5 offers a further insight in the R&D dynamics of that industry.
5.5. what is the role of the ict industry in the European research landscape?141
The ICT industry, and the ICT-enabled innovation in non-ICT industries and services, makes an important contribution to the economic growth of advanced economies. The ICT sector was highlighted in the EU Lisbon Objectives, and has retained its prominence in the Europe 2020 Strategy. The ICT sector is a significant contributor to the ambition of achieving the target of investing 3 % of GDP in R&D in the EU. This section presents an analysis of ICT R&D over the period 2002-2007142, i.e. the period of ICT sector growth that took place between two important financial events (the ‘dot.com’ crisis and the current financial and economic crisis).
139 Codes 30, 32 and 33 in NACE Rev.1.1.140 Codes 64 and 72 in NACE Rev. 1.1.141 In this section, ICT industry includes economic activities with
codes 30, 32, 33, 64 and 72 of NACE Rev. 1.1.142 This analysis was carried out by the JRC-IPTS in the context of
PREDICT, a research project co-financed by JRC-IPTS and the Information Society & Media Directorate General of the European Commission. Further information, including details on the study methodology can be found at http://is.jrc.ec.europa.eu/pages/ISG/PREDICT.html.
The ICT sector is by far the largest R&D investing sector of the economy
ICT technologies are highly pervasive technologies and the ICT sector underpins growth in all sectors of the economy. In the EU, the US and Japan, the ICT sector is by far the largest R&D-investing sector of the economy. In 2007, while the ICT sector represented 4.8 % of GDP and 3 % of total employment in the EU (6.1 million employees), it accounted for 25 % of overall business expenditure in R&D (BERD)143 and employed 32.4 % of all business-sector researchers.
The EU ICT BERD remained stable during the period of analysis (see blue line in Figure I.5.15144, left) with an ICT BERD intensity between 6 and 6.5 % of ICT sector value added, well below US ICT BERD intensity (see Table I.5.5). It does, however, demonstrate the importance of the sector when it comes to observing and understanding R&D expenditure, dynamics and performance in the EU. Not only does the ICT sector lead other economic sectors in terms of BERD, it also provides them with productivity-enhancing technology. Hence it contributes directly and indirectly to increasing labour productivity and overall EU competitiveness.145
Between two economic crises, the dynamics of the ICT sector was underpinned by structural change towards ICT services
In 2007, total ICT sector employment exceeded for the first time its previous peak level in 2001, accompanied by an important redistribution of jobs from ICT manufacturing to ICT services sub-sectors. In 2007, the share of ICT services employment reached 68 % of the total ICT sector. ICT Services accounted for more than 75 % of total ICT value added (42 % in the ‘computer services and software’ sub-sector alone). The ‘computer services and software’ sub-sector is also the only EU ICT sub-sector with a strong and sustained increase in both BERD and the employment of researchers: from 2002–2007, BERD increased by 40 % (see dotted line in Figure I.5.15, left) and employment of researchers by 56 %. In 2007, the ‘computer services and software’ sub-sector became for the first time the leading ICT sub-sector in terms of employment of researchers (see dotted line in Figure I.5.15, right).
143 Followed by ‘automotive’ (16 %) and ‘pharmaceutical/biotechnology’ (13.3 %) in 2007.
144 Source: JRC-IPTS estimates, based on data from Eurostat, OECD, EU KLEMS and national statistics..
145 See the March 2009 European Commission Communication: ‘A Strategy for ICT R&D and Innovation in Europe: Raising the Game’, COM(2009)116, available at: http://ec.europa.eu/information_society/tl/research/documents/ict-rdi-strategy.pdf.

Source: DG Research and Innovation, JRC-IPTS Data: The 2010 report on R&D in ICT in the European Union Note: (1) Real growth.
Innovation Union Competitiveness Report 2011
70
80
90
100
110
120
130
140
150
2002 2003 2004 2005 2006 2007
BERD (2002 = 100)
IT equipment
IT Components, telecom and multimedia equipment
Measurement instruments
170
175
180
185
190
195
200
205
210
215
220
0
10
20
30
40
50
60
70
80
90
2002 2003 2004 2005 2006 2007
000s
(to
tal I
CT
)
000s
(IC
T s
ecto
rs)
Researchers (FTE)
Telecom Services
Computer services and Software
Total ICT (right hand scale)
Source: DG Research and Innovation, JRC-IPTS Data: The 2010 report on R&D in ICT in the European Union
Innovation Union Competitiveness Report 2011
0.30
0.72
0.89
1.17
0.0
0.2
0.4
0.6
0.8
1.0
1.2
1.4
1.6
1.8
2.0
BE
RD
Inte
nsi
ty (B
ER
D a
s %
of
GD
P)
EU United States
non-ICT sectors ICT sectors
131 analysis | part i: investment and performance in r&d - investing for the future
FIGURE I.5.15EU - Evolution of BERD(1) and researchers (FTE) by ICT sub-sector, 2002-2007
FIGURE I.5.16 Contribution of ICT and non-ICT sectors to total BERD Intensity, 2007

chaptEr 5: businEss sEctor invEstmEnt in r&d 132
In 2007, ICT accounted for 63 % of the business R&D intensity gap between the United States and the EU
Although impressive, the contribution of the European ICT industry to total BERD (24.9 %) is much lower than in Japan and the United States, where ICT drives 32.4 % and 39.2 % of total R&D, respectively. As shown in the figure below, ICT explains most (63 %) of the business R&D gap between the United States and the EU: in 2007, the ICT business R&D intensity gap explained 0.44 out of the 0.7 percentage points of GDP that constitute the total EU–US business R&D intensity gap (Figure I.5.16).
The weight and research intensity of ICT industry in the EU economy are smaller than in its main competitors
The United States, Japan, Taiwan and South Korea are investing significantly more in ICT R&D than the EU (when comparing ICT R&D business expenditure over GDP ratios). Although the EU and the US have roughly equivalent GDPs, the US levels of both business ICT R&D expenditure (ICT BERD) and public ICT R&D funding are twice as large as those of the EU.
These points can be further elaborated from three perspectives:
� In 2007, ICT BERD intensity was 0.30 % of GDP for the EU, compared to 0.72 % for the United States. This difference can be attributed to both a smaller relative size of the ICT sector in the economy and to a lower R&D intensity of the ICT sector (Table I.5.5). This difference is even bigger
when comparing the EU to Japan, South Korea and Taiwan. Company-level data analysis of global R&D investments of the 2008 ICT Scoreboard companies146 produces similar results.
� Public funding figures also indicate that, compared to the United States, EU governments fund a smaller share of ICT R&D in relation to total public funding for R&D. In 2007, EU ICT GBOARD represented 6 % of total public funding for R&D in the EU, while it was close to 9 % in the United States. In addition, available (incomplete) data indicates a substantial ‘gap’ between the EU and the United States in terms of ICT R&D public procurement147 and dual-use research148.
� R&D output, proxied by patenting activity also appears to be notably more specialised in ICT in the United States than it is in the EU. In 2006, 50 % of all patents applied for by US-based inventors149 were in ICT technologies, compared to only 20 % of all patents applied for by EU-based inventors.
146 The JRC-IPTS ICT Scoreboard includes the 453 ICT companies with the largest R&D budgets globally. It is extracted from the EU Industrial R&D Investment Scoreboard, (http://iri.jrc.ec.europa.eu/research/scoreboard_2008.htm). In the Scoreboard, the term ‘EU company’ concerns companies whose ultimate parent has its registered office in a Member State of the EU. For more methodological details, see: http://ipts.jrc.ec.europa.eu/publications/pub.cfm?id=3239.
147 See December 2007 EC Communication on pre-commercial procurement, COM(2007) 799, available at: http://ec.europa.eu/information_society/tl/research/priv_invest/pcp/documents/pcp_brochure_en.pdf.
148 Dual-use research refers to tools or techniques, developed originally for military or related purposes, which are sufficiently commercially viable to support adaptation and production for industrial or consumer uses. The United States Department of Defense (DOD) has an important dual-use research program. Adapted from: http://www.answers.com/topic/dual-use-technology.
149 Patent priority applications by inventors physically based (residing) in the US.
TABLE I.5.5ICT BERD as % of GDP, size of the ICT sector in the economy and ICT R&D Intensity, 2007
ICT BERD as % of total GDP 2007
ICT value added as % of total GDP 2007
ICT R&D Intensity (ICT BERD as % of ICT
value added) 2007
EU 0.30 4.8 6.2 United States 0.72 6.4 11.2 Japan 0.87 6.8 12.8 South Korea 1.30 7.9 16.5 Chinese Taipei 1.31 10.6 12.3
Source: DG Research and Innovation, JRC-IPTSData: The 2010 report on R&D in ICT in the European Union
Innovation union Competitiveness report 2011

Source: DG Research and Innovation, JRC-IPTS Data: The 2010 report on R&D in ICT in the European Union
Innovation Union Competitiveness Report 2011
0 5 10 15 20 25
EU
Japan
RoW
United States
EU
Japan
RoW
United States
EU
Japan
RoW
United States
EU
Japan
RoW
United States
EU
Japan
RoW
United States
EU
Japan
RoW
United States
euro (billions)
2004 2005 2006 2007
IT c
om
po
nen
tsC
om
pu
ter s
ervi
ces
and
so
ftw
are
Tel
eco
m e
qu
ipm
ent
IT e
qu
ipm
ent
Mu
ltim
edia
eq
uip
men
tT
elec
om
ser
vice
s
133 analysis | part i: investment and performance in r&d - investing for the future
FIGURE I.5.17R&D investment in ICT sub-sectors by ICT Scoreboard companies, 2004-2007

Source: DG Research and Innovation, JRC-IPTS Data: The 2010 report on R&D in ICT in the European Union
Innovation Union Competitiveness Report 2011
9.6
36.9
20.7
7.7
22.0
11.8
29.0
31.7
13.3
31.7
26.8
37.1
13.4
26.1
16.5
4.3
10.3
7.4
10.6
4.5
1.8 0.82.5
1.2 1.0
6.2
11.2
5.6
16.5
12.3
0
5
10
15
20
25
30
35
40
%
EU United States Australia South Korea Chinese Taipei
ICT equipment Measurement instruments Components, telecom and multimedia equipment Computer services and software Telecom services Total ICT
chaptEr 5: businEss sEctor invEstmEnt in r&d 134
Further company-level data analysis of R&D, invested in ICT sub-sectors for the period 2004–2007 by ICT Scoreboard companies, shows that R&D investment by EU companies has been growing, in some cases strongly, in all ICT sub-sectors150. At the same time, the ICT Scoreboard shows that US companies clearly outperform the EU ones in several ICT sub-sectors that are key to the competitiveness of the EU industry, notably ‘computer services and software’ (Figure I.5.17).
Company data analysis also indicates that the EU does not generate as many large new and innovative ICT companies as the United States (and may additionally be threatened by emerging competitors from China and India). This appears particularly true in a key growth segment: ‘computer services and software’. The lack of large innovation clusters in the EU may partly explain these difficulties, but market fragmentation, difficult access to financial capital, and other market rigidities are often cited151 as other possible causes. The lack of large ICT companies in high-growth sectors and slower
150 With the unique exception of Multimedia Equipment.151 See also: Information and Communication Technologies, Market
Rigidities and Growth: Implications for EU Policies at http://ipts.jrc.ec.europa.eu/publications/pub.cfm?id=1508.
industrial growth clearly have a negative impact on the R&D investment indicators.
A cross-country comparison also needs to take into account the fact that ICT R&D is increasingly distributed globally. Analyses of a combination of indicators (global distribution of corporate R&D sites of major ICT companies152, and international patents in ICT technologies153) indicate that the EU remains an important location for ICT R&D — for both EU and non-EU companies — but it is also observed that Asia is gaining importance in this respect. Such analysis further indicates that US companies have taken a ‘first mover’ advantage in developing ICT R&D collaborations with Asia. For example, the share of the ICT inventions developed in Asia and owned by US patent applicants grew from almost zero in the early 1990s to 1.5 % in 2006, while the share owned by EU patent applicants merely started growing in the late 1990s and reached only 0.5 % in 2006.
152 Based on the JRC-IPTS ICT R&D Location Database. This dataset includes location information for over 1 800 R&D sites that, in 2007 and 2008, belonged to 80 major multinational companies.
153 Based on priority applications analysis from the PATSTAT database of EPO.
FIGURE I.5.18 R&D Intensity (BERD as % of value added) by ICT sub-sector, 2007

135 analysis | part i: investment and performance in r&d - investing for the future
ICT sub-sectors are less research intensive in the EU than in its main competitors, with the exception of ‘Post and telecommunications’
Figure I.5.18 shows the R&D intensity (BERD/value added) of the ICT sub-sectors in an international perspective154, and indicates that the overall lower R&D intensity of the ICT sector in the EU relative to the United States is reflected in all the sub-sectors, except the Telecom Services.
The comparative analysis of R&D intensities reveals different patterns of R&D specialisation. The EU’s highest R&D intensity is in ‘components, telecom and multimedia equipment’, at the same value as South Korea. The US ICT manufacturing sector seems the least specialised in terms of R&D investments/value added. From the countries in our sample, the fast-growing ‘computer services and software’ sector is most R&D intensive in South Korea and the United States.
The best performing countries in ICT R&D in the EU are the Nordic countries
In absolute terms, quite expectably, the EU’s three largest economies (Germany, France and the United Kingdom), and to some extent the next two (Italy and Spain), dominate and set the average EU trend. When the size of the respective economies is taken into account, the best relative performers in ICT are the Nordic countries. In 2007, Germany, France, the United Kingdom, Italy and Spain accounted for more than 70 % of total ICT sector value added and two thirds of its employment. In ICT manufacturing, Germany alone contributed 27 % of EU employment and 30 % of value added. In ICT services, the United Kingdom remains the leading country for employment (19 % of EU employment) and a clear leader in value-added terms (25 % of EU value added). These five countries together contribute more than two thirds of EU ICT BERD, and they generate more than 75 % of all ICT patents (Germany generates almost 45 % of these).
Finland and Sweden invest the largest amount in ICT BERD in relation to their GDP (and above the US level). In 2007, Finland and Sweden were also (with Spain) the countries with highest levels of ICT R&D public funding in relation to their GDP (comparable to US level).
154 The sectoral disaggregation presented in this chapter does not include data for Canada and Japan due to the unavailability of comparable data at this level of disaggregation.
Finland, Germany, the Netherlands and Sweden are the only four Member States with ratios of ICT patent applications in relation to GDP either above or close to the US ratio. The Member States that have experienced the largest increases in ICT BERD in recent years are the new EU Member States along with Portugal and Spain. In spite of strong ICT BERD increase, however, the new EU Member States still have very low ICT BERD in relation to their GDP. They also have very low ratios of ICT GBAORD to GDP. Although several new Member States, such as Hungary, the Czech Republic and Poland, recorded spectacular increases in ICT manufacturing employment, deeper analysis shows that these countries are still hosting rather low-value-added activities.
A lot of ICT R&D is also performed in non-ICT sectors of the economy
Substantial ICT R&D is carried out in other sectors of the economy (for example, automotive or aeronautics). The size of this additional ICT R&D expenditure cannot be readily measured with current statistics. However, OECD has estimated that the magnitude of ICT R&D carried out outside of the ICT sector could be as large as an additional one third of the R&D carried out in the ICT sector itself155. After further statistical analysis and estimation, taking this additional R&D into account may eventually deepen our understanding of the nature of the EU–US gap in R&D investment. More importantly, it may also provide further evidence of the pervasive impact of ICT and ICT R&D investment on the overall economy.
155 Estimated by OECD in a sample of countries: Czech Republic, Denmark, Norway, Finland and Japan (OECD, 2008 b).