chapter-4_gr.pdf
TRANSCRIPT

Chapter-4 GR Log (Gamma Ray Log)
By
Dr. Jorge Salgado Gomes
3/4/2013 1 Chap -4 Duration of this chapter: 3 classes (135’) Core Gamma

Educational Outcomes
• Review the concepts of formation radioactivity
• Review the most radioactive lithologies/minerals
• Use of GR log for correlations
• Use of GR to match logs with cores
• The use of GR log in sequence stratigraphy
• The use of GR to detect water entries in cased holes across perforation
– NORM – Natural Occurring Radioactive Minerals
3/4/2013 Chap -4 2

Electromagnetic Radiation Spectrum

Use of GR Log
• Detect pay from non-pay zones – Pay = reservoir; non-pay= shales (non reservoir)
• Correlations between wells (sequence stratigraphy) • Indication of lithology and source rock type (marine,
continental) • Picking coring points • Useful for geosteering with MWD-Gamma • Determine the net to gross ratio for volumetric calculations • If faults are present, the fault throw detection is easier than
other conventional logs. • Detect water breakthroughs in cased holes • Detect casing leaks (cross-flow behind pipe)
3/4/2013 Chap -4 4

How the tool works ?
3/4/2013 Chap -4 5
detector
K U Th
1,3 ... 1,6 ... 2,4 ... 2,8 MeV
E (MeV)
n spectral
selective
integral
all impulses above a treashold of energy
channels
Condition:
open or cased
hole
water/mud or
dry hole
Unit: MeV (Million electron Volts) Recording speed: 1800 ft/hr – satisfactory definition of a 4 ft bed

Schematic Scintillation Detector

API GR Calibration Pit UNIVERSITY of HOUSTON

Integral Gamma Measurement
3/4/2013 Chap -4 8
by Lecturer
Integral activity is effect of 3 contributions
I = (K + U + Th)
Unit: API-unit
API facility is constructed of concrete with an admixture of radium to
provide 238U decay series, monazite ore as a source of thorium, and
mica as a source of potassium.

The complex GR response
• Determine different minerals
• For complex mineral identification
3/4/2013 Chap -4 9

TYPICAL GAMMA-RAY RESPONSE TO
SEDIMENTARY ROCKS

Mineral - ray Ref
(API)
Quartz, Dolomite, Calcite (clean) 0 H; S
Plagioclase (Albite, Anorthite) 0 S
Alcali feldspar 220 S
(Orthoclase, Anorthoclase, Microcline)
Micas (Muscovite, Biotite) 270 S
Shale 80 …150 H
Kaolinite 80 …130 S
Chlorite 180 … 250 S
Illite 250 … 300 S
Montmorillonite 150 … 200 S
Sylvite 500 H; S
Carnallite 200 H; S
(S - data from Schlumberger 1989; H - data from a Table of Hearst, Nelson, 1985, made on the basis of values from Brom and Driedonks 1981, Edmundson, Raymer, 1979, Fertl , Frost 1980, Patchett 1975, Reeves 1981, Tixier, Alger 1970)
Gamma-ray API Values for Minerals
3/4/2013 Chap -4 12
by Lecturer
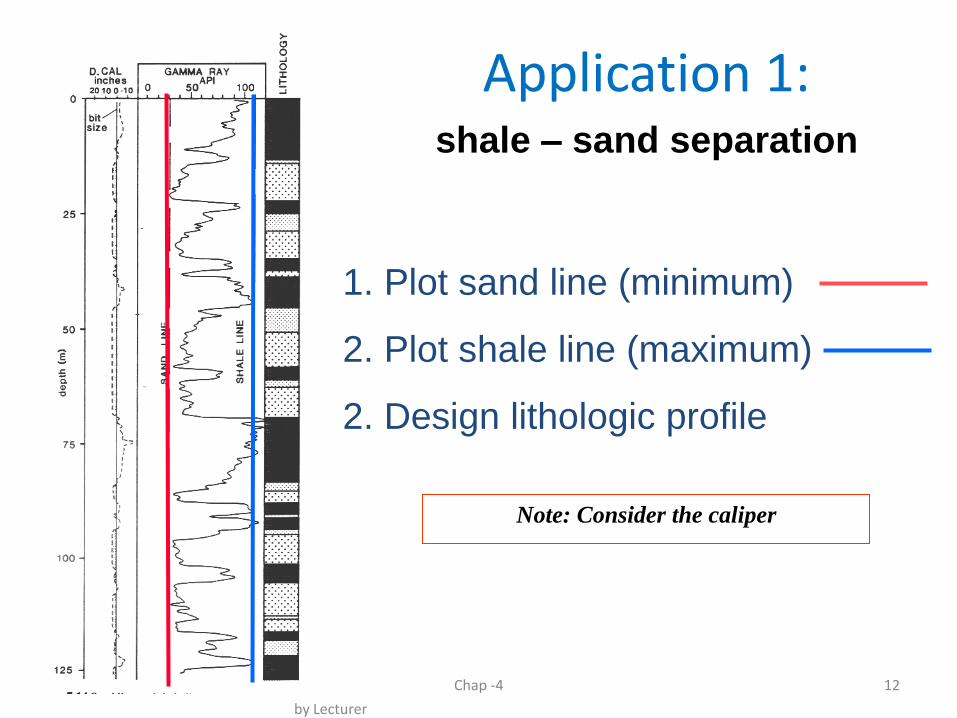
Application 1:
1. Plot sand line (minimum)
2. Plot shale line (maximum)
2. Design lithologic profile
shale – sand separation
Note: Consider the caliper

3/4/2013 Chap -4 13
• Basis: correlation between shale content and gamma activity
• Assumption: only shale and clay are radioactive components in rock,
no other radioactive minerals
First step: Calculation of “gamma ray shale index”
log response in
zone of interest
log response in a
zone considered
clean (shale free)
log response in a
shale zone sh
cn
GR
GR
GR
Application 2: Shale content calculation
cnsh
cnGR
GRGR
GRGRI
GR

3/4/2013 Chap -4 14
by Lecturer
Second step: Select & apply a relationship IGR vs. Vsh
)12(33.0
)12(083.0
2
7.3
GR
GR
I
I
GR
Vsh
Vsh
IVsh Linear relationship (upper limit)
Tertiary clastics (Larionov, 1969)
Mesozoic & older rocks (Larionov, 1969)
Application 2: Shale content calculation

3/4/2013 Chap -4 15
Second step: Select & apply a relationship IGR vs. shale content Vsh
Application 2: Shale content calculation

3/4/2013 Chap -4 16
Note: Sand with Mica or Feldspar - "radioactive sandstone"
Baker Atlas, 2002

3/4/2013 Chap -4 17
Application 3: Clay Mineral Identification
• Clay minerals show different Th/K ratios for different mineral composition
• Used for clay mineral identification
• Combination with other properties (Pe, neutron) recommended

3/4/2013 Chap -4 18
Mineral Identification from Spectral gammalog
0 5 15 10 25 20 30
2
10
12
6
8
4
K (
%)
Th (ppm)
100% Illite Ave. Feldspar Line
Ave. 100% Clay Line
Potassium Evaporites
Micas
Glauconite
Feldspars
Smectites and Mixed Layer Clays
Illite Clays
Kaolinite
Heavy Thorium Minerals
Chlorite
Baker Atlas, 2002
Baker Atlas, 2002

3/4/2013 Chap -4 19
4.65 ppm Uranium in acid igneous rocks
• forms soluble salts (uranyle), transported in water (sea water 3ppb dissolved
Uranium)
• three ways passes into sediments (Serra, 1979):
- chemical precipitation in acid (pH 2.5 - 4.0) reducing environment
- adsorption by organic matter, or living plants and animals
- chemical reaction in phosphorites
Stagnant, anoxic waters, low rate of sediment deposition,
which typically produce black shales
(North Sea Jurassic „hot shales‘)
Note: Uranium Content of Source Rocks

NGS Response to Trace Uranium in Clean Sand

3/4/2013 Chap -4 21
Th/U indications Th/U indicator for environment:
• Th/U > 7 continental, oxydizing
• Th/U < 7 marine, grey ... green shales
• Th/U < 2 marine, black shales, phosphates.
Source rock
indication from
spectral gammalog,
Baker Atlas
document

3/4/2013 Chap -4 22
Influences and corrections
• absorption of radiation
– influence of caliper, mud density, casing
– influence of tool position (centralized or sidewall)
• bed thickness (thin beds show reduced effect)
• formation density (influences depth of investigation)
• logging speed
– influences statistics
– influences vertical resolution

3/4/2013 Chap -4 23
QC - Quality Control Gammalog The gamma curve should agree with other shale indicators (except in
„radioactive beds“)
Shale values should be similar to those in nearby wells
Repeatability: curves should have the same shape and character as those
from previous runs or repeated sections
Cross-check the curve character with other logs from the same logging run.
Adapted after Krygowski, 2004

3/4/2013 Chap -4 24
3.6.2.6 Natural Radioactivity - Summary
Natural Gamma-activity controlled by U-, K- and Th- content
Two techniques are applied
– integral measurement
– spectral measurement
Gammalog is a typical „lithology log“ based on the measurement of the natural gamma-radioactivity of a formation.

Summary
3/4/2013 Chap -4 25
• K, Th, and U as source of radioactivity are concentrated in shale
shale has high gamma reading.
• Shale-free („clean“) rocks (sandstones and carbonates) usually have
low gamma intensity.
• Gammalog can be applied for lithologic profile design, shale content
estimate, and well-to-well-correlation.
• Other shale indicators: Spontaneous potential, Density-Neutron-
Combination
• Attention: Feldspathic, glauconitic, or micaceous sandstone show
high gamma radiation (K); organic matter shows high radiation (U)

Running GR Log along cores
• To be able to match core-log depth mismatch
3/4/2013 Chap -4 26 Core Gamma
Baker Atlas, D. Georgi
Core inside

Core-Log Gamma Ray Correlation Top of Core
Core GR
Example from Core Labs
Open Hole GR Core Gamma
Ray is best
correlation
curve for
Clastics.
Core porosity
is best
correlation
curve for
Carbonates ?
Let’s think
about this !
Baker Atlas, D. Georgi

3/4/2013 Chap -4 28
Gamma-Gamma Log
Interaction of incident radiation (source) with
electrons
- gives information about density porosity
- gives information about lithology
source
detector

3/4/2013 Chap -4 29
3 effects of
interaction
energy loss
Photoelectric effect
Compton effect
Pair production
probability depends on
• energy of radiation and
• atomic number of target material
Gamma Ray Interactions with Rocks

3/4/2013 Chap -4 30
An incident low-energy gamma photon (< 0.2 MeV) collides with an atom
If the energy of the gamma photon equals or exceeds the "binding energy" of
an orbital electron, then
• the gamma photon gives up all of its energy
• the electron leaves its orbit,
• and has a kinetic energy
Ekin= gamma ray energy - electron binding energy
e-
Photoelectric Effect

3/4/2013 Chap -4 31
An incident intermediate-energy gamma photon (gamma ray) collides with
an atom:
• it ejects an electron (“Compton or recoil electron”) from an outer shell
and leaves with a lower energy;
• the scattered gamma energy is a function of the angle of scattering
Compton electron
Compton Effect

3/4/2013 Chap -4 32
An incident high-energy gamma photon (gamma ray energy > 1.02 MeV)1
can be converted into a electron - positron pair when it is near a nucleus.
The electron slows down
The positron interacts with an ordinary electron. They annihilate one another
and produce two gamma-rays.
11.02 MeV is exactly twice the rest mass of an electron (mc2)
nucleus
e-
e+
electron
positron
Pair Production

3/4/2013 Chap -4 33
Gamma-ray energy as result of scattering (Photoeffect and Compton effects)
Gamma
radiation
cps
Energy of
gamma
radiation
Photoelectric effect Pe Z
Compton effect electron density
mineralogy
density
increasing
Z
Pe density
measurement
r1
r2 < r1

3/4/2013 Chap -4 34
Gamma Ray Absorption Mechanisms
Cs Co
Rock
forming
elements
In the energy range between 0.5 and 5 MeV
for most abundant elements the COMPTON-effect dominates.

3/4/2013 Chap -4 35
Interactions result in attenuation (absorption) of radiation, described by
absorption coefficient a
I0 I(x) IGG(x) = I0 exp (-a x)
x
The absorption coefficient is
• connected with the absorption cross section
• related to the effect of interaction:
Absorption of Radiation
ac - absorption coefficient for Compton effect
aPe - absorption coefficient for Photoelectric effect (Pe)

3/4/2013 Chap -4 36
For many elements the photoelectric cross section shows the
proportionality to atomic number Z3.6
sPe Z 3.6
on this basis a effective photoelectric index Pe (average
photoelectric cross section per electron) is defined:
Pe = (Z/10) 3.6 Pe depends on elemental composition (lithology) - see table.
Pe - unit: b/e barns per electron
Photoelectric Effect

3/4/2013 Chap -4 37
Mean values for density r, electron density re , ratio Z/A, and photoelectric absorption index Pe
Substance r (g/cm3) re (g/cm3) Z/A Pe (b/e)
quartz 2.654 2.650 0.499 1.806
calcite 2.710 2.708 0.500 5.084
dolomite 2.870 2.864 0.499 3.142
halite 2.165 2.074 0.479 4.65
gypsum 2.320 2.372 0.511 3.420
anhydrite 2.97 2.96 0.499 5.05
kaolinite 2.44 2.44 0.50 1.83
illite 2.64 2.63 0.499 3.45
barite 4.48 4.09 0.446 266.8
water (fresh) 1.000 1.110 0.555 0.358
oil 0.850 0.948 0.558 0.125

3/4/2013 Chap -4 38
note
• Pe can help to discriminate between Quartz, Calcite, and Dolomite,
• Pe is one component in mineralogy-porosity crossplot technique
• Pe is extremely sensitive with respect to barite (mud!)

3/4/2013 Chap -4 39
Compton effect Bulk density and electron density
+ + + +
+
-
-
-
-
-
Number of orbiting electrons e control
probability of Compton effect
But bulk density is
controlled by
A = Z + N
e = Z
Z/A 0.5
Compton effect controlled by bulk density

3/4/2013 Chap -4 40
Probability for Compton
scattering is proportional
the number of electrons
per unit volume
density -
number mass atomic - number atomic -
)10 (6.026number sAvogadro' - N
where
23
r
r
AZ
A
ZNe
For practical purposes we define an
„electron density“ rr A
Ze 2
Compton Effect

3/4/2013 Chap -4 41
Electron density is related to the number of electrons per molecule (Z), and bulk density is related to the total atomic mass per molecule (A).
For most common Earth minerals, the ratio is constant
and thus
5.0A
Z
eebA
Zrr
r 2

3/4/2013 Chap -4 42
Mean values for density r, electron density re , ratio Z/A, and photoelectric absorption index Pe
Substance r (g/cm3) re (g/cm3) SZ/SM Pe (b/e)
quartz 2.654 2.650 0.499 1.806
calcite 2.710 2.708 0.500 5.084
dolomite 2.870 2.864 0.499 3.142
halite 2.165 2.074 0.479 4.65
gypsum 2.320 2.372 0.511 3.420
anhydrite 2.97 2.96 0.499 5.05
kaolinite 2.44 2.44 0.50 1.83
illite 2.64 2.63 0.499 3.45
barite 4.48 4.09 0.446 266.8
water (fresh) 1.000 1.110 0.555 0.358
oil (med. gr.) 0.79 0.80 0.57 0.125

3/4/2013 Chap -4 43
For practical log applications two effects
are important
Compton effect
Photoelectric effect
Density determination by nuclear measurements applies Compton effect;
the correlation between density and electron density bases on a nearly
constant ratio Z/A.
Determination of Pe applies Photoelectric effect and gives an information
about mineral composition by the strong correlation to atomic number Z
Gamma Ray Interactions - Summary

3/4/2013 Chap -4 44
Gamma-Gamma-Measurement: Tool and Calibration
source
Detector 1
Detector 2
density
Count
rate
count rate axis logarithmic
density axis linear
Short spacing
Long spacing

3/4/2013 Chap -4 45
Gamma-Gamma-Density
• Caliper and rugosity
• Mud density
• Deviation from Z/A = 0.5 (mineralogy)
• Barite
Corrections:
Primary calibration of density tools usually freshwater saturated limestones of
high purity,
Secondary calibration aluminium, sulfur, concrete blocks

SUPPORT MATERIAL
3/4/2013 Chap -4 46

Geiger-Muller Tube