chapter #4all rights reserved1 chapter 4 evaluating portfolio performance
TRANSCRIPT

Chapter #4Chapter #4 All Rights ReservedAll Rights Reserved 11
Chapter 4
Evaluating Portfolio Evaluating Portfolio PerformancePerformance

Chapter #4Chapter #4 All Rights ReservedAll Rights Reserved 22
Student Learning Objectives
Issues in Measuring PerformanceIssues in Measuring Performance Three measures of investment Three measures of investment
performance based on MPTperformance based on MPT Past performance as a predictor of Past performance as a predictor of
future performancefuture performance Applying MPT to investment Applying MPT to investment
decisionsdecisions Applying the Treynor-Black modelApplying the Treynor-Black model

Chapter #4Chapter #4 All Rights ReservedAll Rights Reserved 33
Issues in Measuring Issues in Measuring PerformancePerformance
Cash inflows and outflows mean that Cash inflows and outflows mean that different, legitimate methods of computing different, legitimate methods of computing returns will provide different performance returns will provide different performance results.results. Time-weighted (Geometric Average)Time-weighted (Geometric Average) dollar weighted (Arithmetic average)dollar weighted (Arithmetic average) Internal Rate of Return (IRR; makes NPV = 0)Internal Rate of Return (IRR; makes NPV = 0)
NN
N
1tt
t0
r1
Value
r1
CFValue0

Chapter #4Chapter #4 All Rights ReservedAll Rights Reserved 44
Issues in Measuring Issues in Measuring PerformancePerformance
Additions of cash to or removals of cash from a portfolio Dividends or interest payments left in
portfolio are not interim cash flows Charges in a margin account added to
the debit balance, or offset against a cash position are not interim cash flows

Chapter #4Chapter #4 All Rights ReservedAll Rights Reserved 55
BenchmarkingBenchmarking
Selection of market indexSelection of market index DJIA: Price-weightedDJIA: Price-weighted SP500: Value-weighted (price * shares)SP500: Value-weighted (price * shares) NASDAQ: Value-weightedNASDAQ: Value-weighted Bond IndexesBond Indexes Foreign Market indexesForeign Market indexes

Chapter #4Chapter #4 All Rights ReservedAll Rights Reserved 66
BenchmarkingBenchmarking
Selection of comparison methodSelection of comparison method Should be risk-adjusted comparisonShould be risk-adjusted comparison Can adjust risk based on:Can adjust risk based on:
BetaBeta Variance (or standard deviation)Variance (or standard deviation)
Chapter #4Chapter #4 All Rights ReservedAll Rights Reserved 77
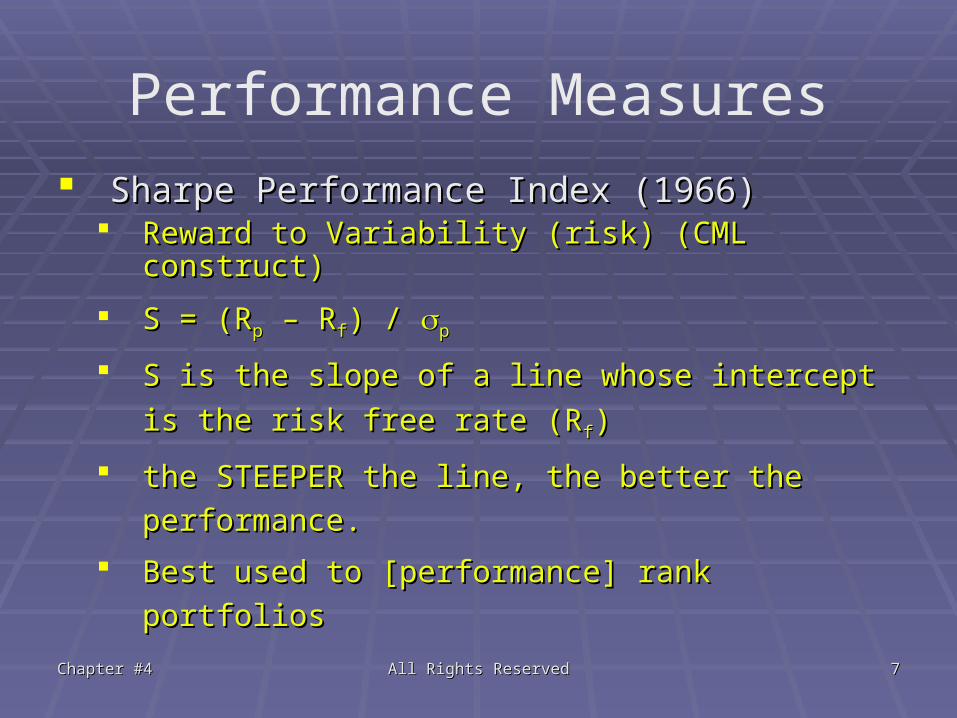
Performance Measures
Sharpe Performance Index (1966)Sharpe Performance Index (1966) Reward to Variability (risk) (CML Reward to Variability (risk) (CML
construct)construct)
S = (RS = (Rpp – R – Rff) / ) / pp
S is the slope of a line whose intercept is S is the slope of a line whose intercept is
the risk free rate (Rthe risk free rate (Rff))
the STEEPER the line, the better the the STEEPER the line, the better the
performance.performance.
Best used to [performance] rank portfoliosBest used to [performance] rank portfolios

Chapter #4Chapter #4 All Rights ReservedAll Rights Reserved 88
Source:
Investments, Haim Levy & Thierry Post
Prentice-Hall (2005).
Chapter 22, page 771.

Chapter #4Chapter #4 All Rights ReservedAll Rights Reserved 99
Performance Measures
Treynor Performance IndexTreynor Performance Index Reward per Beta Risk (SML construct)Reward per Beta Risk (SML construct) T = (RT = (Rpp – R – Rff) / ) / pp
Beta computed using historical rates of Beta computed using historical rates of returnreturn
How well did the investment portfolio do How well did the investment portfolio do in terms of percentage return on a in terms of percentage return on a risk-risk-adjustedadjusted basis. basis.

Chapter #4Chapter #4 All Rights ReservedAll Rights Reserved 1010
Source:Investments, Haim Levy & Thierry PostPrentice-Hall (2005). Chapter 22, page 774.

Chapter #4Chapter #4 All Rights ReservedAll Rights Reserved 1111
Performance Measures
Jensen’s Alpha: Jensen’s Alpha: Mean Excess Return minus the CAPM returnMean Excess Return minus the CAPM return
Excess return = RExcess return = Rpp – R – Rff
CAPM Return = CAPM Return = (R (Rmm – R – Rff))
= (R= (Rp – R – Rf) – ) – (R (Rmm – R – Rff)) One problem with Jensen’s measure is that One problem with Jensen’s measure is that
we do not know the magnitude of non-we do not know the magnitude of non-systematic risk incurred in order to achieve systematic risk incurred in order to achieve the excess.the excess.

Chapter #4Chapter #4 All Rights ReservedAll Rights Reserved 1212
Performance Measures
Information Ratio A portfolio’s alpha divided by the
standard deviation of the error term from the estimation of a portfolio’s characteristic line IR = /
The larger the value of the ratio, the more attractive the performance of the portfolio

Chapter #4Chapter #4 All Rights ReservedAll Rights Reserved 1313
Supplemental MaterialSupplemental Material
Gauging impact of MPT on Investor Gauging impact of MPT on Investor BehaviorBehavior How do investors implement efficient How do investors implement efficient
market theory?market theory? True BelieversTrue Believers DoubtfulDoubtful Percentage playersPercentage players

Chapter #4Chapter #4 All Rights ReservedAll Rights Reserved 1414
MPT and Investor Decisions
Different groups of investors apply MPT Different groups of investors apply MPT differently depending on how strongly differently depending on how strongly they believe in market efficiencythey believe in market efficiency Group 1 MPT investors believe the market is Group 1 MPT investors believe the market is
strong-form efficientstrong-form efficient and will invest in any and will invest in any naïve diversified portfolionaïve diversified portfolio
Passive or Passive or naïve strategy invests in a well-naïve strategy invests in a well-diversified portfoliodiversified portfolio because one cannot because one cannot “beat the market” – index portfolio“beat the market” – index portfolio

Chapter #4Chapter #4 All Rights ReservedAll Rights Reserved 1515
MPT and Investor Decisions Group 2 MPT investors believe in Group 2 MPT investors believe in
Semistrong market efficiencySemistrong market efficiency and and invest in a well-diversified portfolio of invest in a well-diversified portfolio of growth stocks to gain both benefitsgrowth stocks to gain both benefits Group 2 investors will analyze securities Group 2 investors will analyze securities
to determine which stock to include in a to determine which stock to include in a well-diversified portfoliowell-diversified portfolio
Group 2 investors will also analyze Group 2 investors will also analyze optimal allocation of the portfoliooptimal allocation of the portfolio

Chapter #4Chapter #4 All Rights ReservedAll Rights Reserved 1616
MPT and Investor Decisions Third group is somewhere between Third group is somewhere between
group 1 and group 2group 1 and group 2 They believe the market offers They believe the market offers
undervalued and overvalued stocks, undervalued and overvalued stocks, but that finding them is nearly but that finding them is nearly impossible, so they may act as group impossible, so they may act as group 1 investors1 investors
Other investors scorn MPTOther investors scorn MPT Technicians may fall in this groupTechnicians may fall in this group

Chapter #4Chapter #4 All Rights ReservedAll Rights Reserved 1717
Treynor-Black Portfolio Combination Model Mathematical Model to determine Mathematical Model to determine
optimal combinations between optimal combinations between undervalued stocks and the well-undervalued stocks and the well-diversified diversified naïvenaïve portfolio portfolio
Shows the tradeoff between buying Shows the tradeoff between buying growth stocks and the naïve portfoliogrowth stocks and the naïve portfolio
Finds the optimal allocation of the Finds the optimal allocation of the stocksstocks
Appeals to group 2 MPT investorsAppeals to group 2 MPT investors

Chapter #4Chapter #4 All Rights ReservedAll Rights Reserved 1818
Applying the Treynor-Black Portfolio Combination Model Determine a well-diversified portfolio Determine a well-diversified portfolio
on the efficient frontier - a market on the efficient frontier - a market portfolioportfolio
Identify a group of undervalued stocks Identify a group of undervalued stocks using security analysisusing security analysis
Optimize the market portfolio using Optimize the market portfolio using the undervalued portfoliothe undervalued portfolio
Select the proportion of allocations Select the proportion of allocations using the Sharpe measureusing the Sharpe measure

Chapter #4Chapter #4 All Rights ReservedAll Rights Reserved 1919
Implications for investors Diversify by investing in several Diversify by investing in several
securities or in mutual fundssecurities or in mutual funds Measure performance using reward per Measure performance using reward per
risk to determine fund performancerisk to determine fund performance Measure performance over a long period Measure performance over a long period
of time, perhaps five years or moreof time, perhaps five years or more Understand the tradeoffs between Understand the tradeoffs between
picking high growth stocks over a well-picking high growth stocks over a well-diversified portfoliodiversified portfolio