chapter 47 part 1. goal: to evaluate fractional causation ...9 part 1. goal: to evaluate fractional...
TRANSCRIPT
CHAPTER 47 Evaluating Fractional Causation in the Post-1940 Decades: How We Start
Part 1. Goal: To Evaluate Fractional Causation in the Post-1940 Decades Part 2. Must Fractional Causation Change, If MortRates Rise or Fall? Part 3. Post-1940 Behavior of PhysPop, and the Three "Trios" Part 4. Cigarette-Smoking: Another Twentieth Century Carcinogen
Table 47-A. Averaged PhysPops, 1940-1990, and Ranking of the Census Divisions. Table 47-B. Change-Factors for Averaged (Mean) PhysPops, by Census Trios.
9 Part 1. Goal: To Evaluate Fractional Causation in the Post-1940 Decades
Studies in Section Five of this book will cover the SECOND half of the Twentieth Century. Section Two of this book uncovered extremely high and positive correlations between PhysPop and the 1940 cancer mortality-rates, by Census Divisions. Section Four of this book uncovered equally strong and positive correlations between the 1940-1950 PhysPops and the 1950 Ischemic Heart Disease MortRates. In dramatic contrast, Section Three uncovered an INVERSE correlation between PhysPop and all NonCancer NonIHD causes of death combined.
la. Three Sets of Facts ... and a Single Explanation
Those three sets of findings are facts --- not interpretations --- and we have said that such facts "demand" an explanation.
We say the explanation is the proportionality of PhysPop with average accumulated per capita dose of MEDICAL RADIATION, by Census Divisions. In other words, the correlations are causal in nature --- they are dose-RESPONSES. Cancer is well-established as a disease inducible by ionizing radiation, at low doses as well as at high doses (Chapter 2, Parts 4c, 5b, 6). Our findings provide the first powerful epidemiologic evidence that Ischemic Heart Disease is also a radiation-inducible disease. Other than Cancer, there are very few well-established radiation-inducible causes of death (Chapter 23, Part 1). This being the case, we would expect NOT to find a positive correlation between PhysPop and NonCancer NonIHD causes of death --- and the real-world data support this expectation, by a relationship which is even inverse between PhysPop and such MortRates.
lb. Fractional Causation by Medical Radiation 1940-1950, and Beyond
Sections Two and Four of the book have used the Constants, generated by the mid-century dose-responses, to estimate Fractional Causation by medical radiation of the 1940 Cancer MortRates and of the 1950 IHD MortRates. By Fractional Causation, we mean the percentage of the MortRates which would have been absent in the absence of medical radiation. We emphatically do not mean that medical radiation was the only cause contributing to such cases (Introduction, Parts 4 and 5; Chapter 6, Part 6). Best estimates of Fractional Causation by medical radiation:
Male All-Cancer Mortality, 1940: 90% Female All-Cancer Mortality, 1940: 58% Male IHD Mortality, 1950: 79% Female IHD Mortality, 1950: 97% Now, Section Five evaluates Fractional Causation in subsequent decades. Our analyses indicate that very high Fractional Causations occur in every decade, including the decade ending in approximately 1990. With respect to Cancer, these findings are fully consistent with other evidence
cited in Chapter 2:
(a) Ionizing radiation is a proven cause of almost every major type of human Cancer (Chapter 2, Part 4), and the carcinogenic properties of ionizing radiation persist even at the lowest possible dose
- 355 -
Chap.47 Radiation (Medical) in the Pathogenesis of Cancer and lschemic Heart Disease John W. Gofman
and dose-rates (Chapter 2, Part 6, and Appendix-B).
(b) Medical xrays (including CT scans and fluoroscopy) are at least as carcinogenic per dose-unit as higher-energy gamma rays --- and probably are several times MORE carcinogenic per dose-unit (Chapter 2, Part 7).
(c) Radiation exposure of mixed-age populations causes radiation-induced Cancer in such
populations for at least the subsequent forty-five years (Chapter 2, Part 8) --- probably longer.
(d) Nearly 93 % of the 1990 cancer MortRate (USA) occurred in people old enough to have
experienced now-obsolete practices in medical irradiation (Chapter 2, Part 3).
(e) Radiation doses from various current practices --- especially CT scans, fluoroscopy, and
some nuclear medical procedures --- are very far from negligible, especially if repeated (Chapter 2, Parts 3 and 7e).
* Part 2. Must Fractional Causation Change, If MortRates Rise or Fall?
Fractional Causation of a disease by medical radiation is not automatically altered by changes in
the National age-adjusted MortRate. Suppose that Fractional Causation of cancer mortality in 1940 is
75 %. Then suppose, for illustrative purposes, that better treatments for Cancer, or better underlying health, cut the National age-adjusted MortRate in HALF by the year 2000. Medical radiation could still account for 75 % of the cancer deaths which DO occur in the year 2000. Change (up or down) in a
National MortRate, by itself, reveals nothing about Fractional Causation.
By contrast, there is a phenomenon which would definitely mean a decline in Fractional Causation, by medical radiation, of Cancer and IHD MortRates. If all use of ionizing radiation in medicine had CEASED in 1941 forever, then Fractional Causation of Cancer and IHD mortality by
medical radiation would be truly NEGLIGIBLE in the year 2030 --- for nearly everyone who could have received medical radiation, before its 1941 cessation, would have died before the year 2030. In reality, of course, use of radiation in medicine has never ceased. While several aspects of its use have decreased since 1940, several other aspects of its use since 1940 have increased (Chapter 2, Part 3).
Fractional Causation by medical radiation of a National MortRate (Cancer, IHD) is determined by the relative size of the MortRate's two fractions: The radiation-induced cases (cases which would not have occurred in the absence of medical radiation), and the cases which occurred without help from radiation. The sum of the two fractions, of course, can not exceed 1.0 (100%). Thus, if either fraction increases between 1940 and 1990, the other must decrease.
e Part 3. Post-19 4 0 Behavior of PhysPop, and the Three "Trios"
As we initiated our analyses of post- 1940 Fractional Causation, we were mindful that no law of history establishes that the path leading to 1990 must be just like the path leading to 1940. And there is certainly no biological law requiring that the 1940 set of nine PhysPop values must be well correlated with the SUBSEQUENT sets for a half-century. Chaotic changes in post-1940 PhysPop values could eradicate meaningful differences, between populations of the Nine Census Divisions, in accumulated per capita radiation dosage from medical procedures (Chapter 3, Part 2c).
Existence of reliable dose-differences is, of course, the first requirement for dose-response studies. And when dose is accumulating over many decades in nine populations, such studies require reasonably STEADY proportions and rankings between the nine dose-levels. So, as we begin the post-1940 analyses, we need to demonstrate how well the PhysPop data meet this requirement.
3a. Calculation of the Averaged PhysPops: Table 47-A
Exposures to medical radiation in 1940, 1950, 1960, 1970, and 1980 all contribute to radiation-induced cancer-deaths in 1990 (Chapter 2, Part 8), and exposures received between 1980 and 1989 make some contribution too (Chapter 5, Part 4). Therefore, we will regress the 1990 cancer MortRates (or the very similar 1988 rates) upon the Averaged 1940-1990 PhysPops ... the 1980 cancer MortRates upon the Averaged 1940-1980 PhysPops ... and so forth.
- 356 -
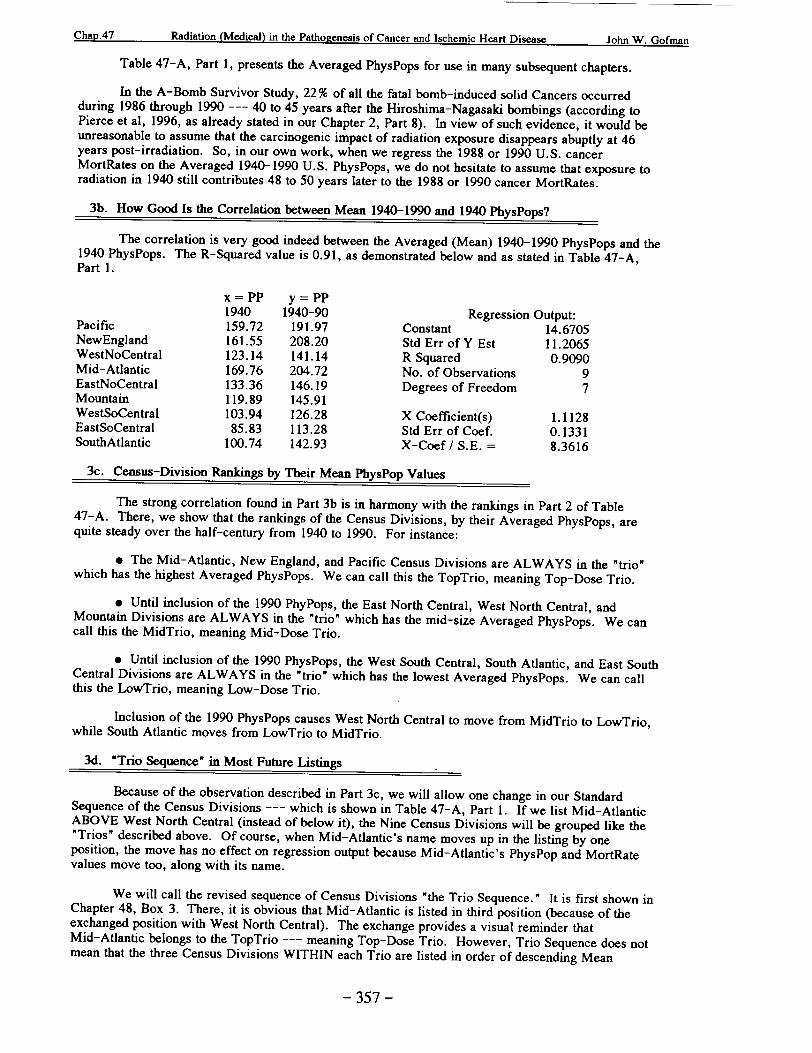
Chart47. r .. ~ *.C.... -*S-I .0 c" r ut Is chm IcjHart Dsease John W. Giofman
Table 47-A, Part 1, presents the Averaged PhysPops for use in many subsequent chapters.
In the A-Bomb Survivor Study, 22 % of all the fatal bomb-induced solid Cancers occurred during 1986 through 1990 --- 40 to 45 years after the Hiroshima-Nagasaki bombings (according to Pierce et al, 1996, as already stated in our Chapter 2, Part 8). In view of such evidence, it would be unreasonable to assume that the carcinogenic impact of radiation exposure disappears abuptly at 46 years post-irradiation. So, in our own work, when we regress the 1988 or 1990 U.S. cancer MortRates on the Averaged 1940-1990 U.S. PhysPops, we do not hesitate to assume that exposure to radiation in 1940 still contributes 48 to 50 years later to the 1988 or 1990 cancer MortRates.
3b. How Good Is the Correlation between Mean 1940-1990 and 1940 PhysPops?
The correlation is very good indeed between the Averaged (Mean) 1940-1990 PhysPops and the 1940 PhysPops. The R-Squared value is 0.91, as demonstrated below and as stated in Table 47-A, Part 1.
x = PP y = PP 1940 1940-90 Regression Output:
Pacific 159.72 191.97 Constant 14.6705 NewEngland 161.55 208.20 Std Err of Y Est 11.2065 WestNoCentral 123.14 141.14 R Squared 0.9090 Mid-Atlantic 169.76 204.72 No. of Observations 9 EastNoCentral 133.36 146.19 Degrees of Freedom 7 Mountain 119.89 145.91 WestSoCentral 103.94 126.28 X Coefficient(s) 1.1128 EastSoCentral 85.83 113.28 Std Err of Coef. 0.1331 SouthAtlantic 100.74 142.93 X-Coef / S.E. = 8.3616
3c. Census-Division Rankings by Their Mean PhysPop Values
The strong correlation found in Part 3b is in harmony with the rankings in Part 2 of Table 47-A. There, we show that the rankings of the Census Divisions, by their Averaged PhysPops, are quite steady over the half-century from 1940 to 1990. For instance:
& The Mid-Atlantic, New England, and Pacific Census Divisions are ALWAYS in the "trio" which has the highest Averaged PhysPops. We can call this the TopTrio, meaning Top-Dose Trio.
e Until inclusion of the 1990 PhyPops, the East North Central, West North Central, and Mountain Divisions are ALWAYS in the "trio" which has the mid-size Averaged PhysPops. We can call this the MidTrio, meaning Mid-Dose Trio.
e Until inclusion of the 1990 PhysPops, the West South Central, South Atlantic, and East South Central Divisions are ALWAYS in the "trio" which has the lowest Averaged PhysPops. We can call this the LowTrio, meaning Low-Dose Trio.
Inclusion of the 1990 PhysPops causes West North Central to move from MidTrio to LowTrio, while South Atlantic moves from LowTrio to MidTrio.
3d. "Trio Sequence" in Most Future Listings
Because of the observation described in Part 3c, we will allow one change in our Standard Sequence of the Census Divisions --- which is shown in Table 47-A, Part 1. If we list Mid-Atlantic ABOVE West North Central (instead of below it), the Nine Census Divisions will be grouped like the "Trios" described above. Of course, when Mid-Atlantic's name moves up in the listing by one position, the move has no effect on regression output because Mid-Atlantic's PhysPop and MortRate values move too, along with its name.
We will call the revised sequence of Census Divisions "the Trio Sequence." It is first shown in Chapter 48, Box 3. There, it is obvious that Mid-Atlantic is listed in third position (because of the exchanged position with West North Central). The exchange provides a visual reminder that Mid-Atlantic belongs to the TopTrio --- meaning Top-Dose Trio. However, Trio Sequence does not mean that the three Census Divisions WITHIN each Trio are listed in order of descending Mean
- 357 -
- 358 -
John W. Gofmanr•l...-- A"7%r1L A' Ioh W. I ImF2 PhysPop Values. For example, Trio Sequence does not put Mid-Atlantic into the Trio's first position,
even though Mid-Atlantic has the highest Averaged PhysPops until 1990 (Table 47-A, Part 2).
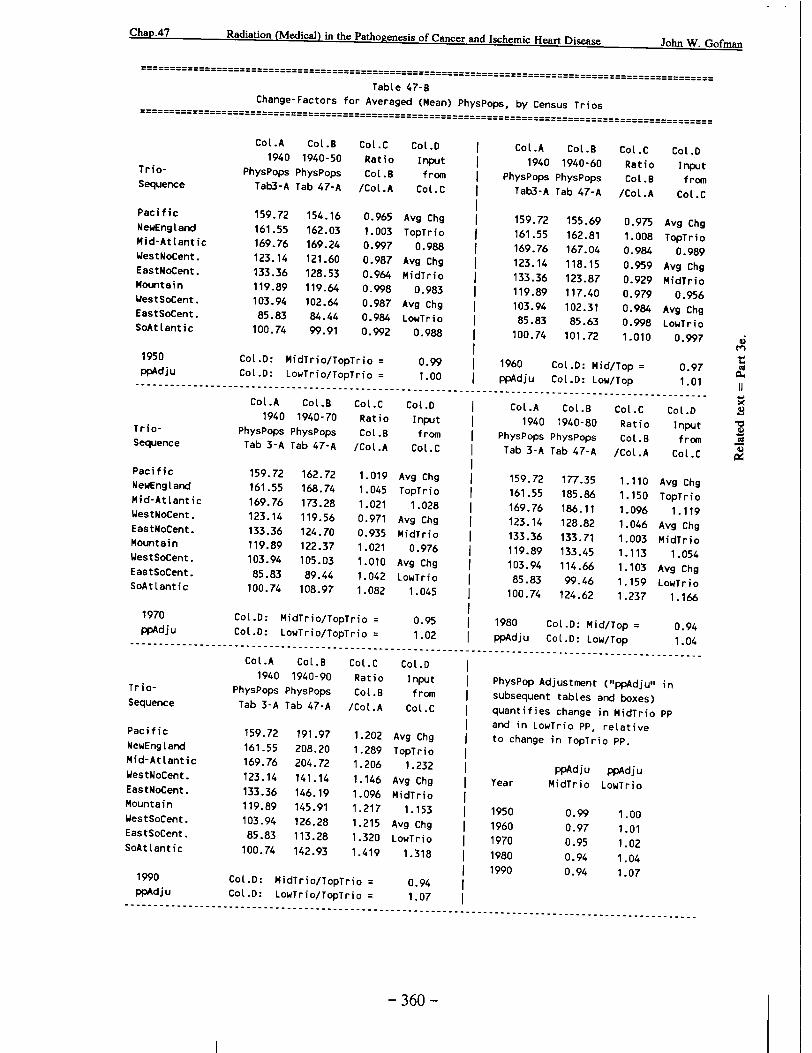
3e. Table 47-B: Change-Factors in Mean PhysPops over Time, by Trios
It is evident from Table 47-A, Part 1, that the Mean 1940-1990 PhysPop values are appreciably higher in every Census Division than the corresponding PhysPop values of 1940. If the 1940 values change by the SAME FACTOR in all three Trios, increments in MortRates will remain proportional to increments in Mean PhysPops regardless of these changes (Chapter 5, Part 6c) --- provided that the Census Divisions are well-matched for co-actors, of course.
Table 47-B examines the change-factors in Mean PhysPops over time. Column C shows the change-factor for each individual Census Division. Column D shows the average change-factor for each TRIO.
Then Table 47-B COMPARES the average change-factors in the MidTrio and the LowTrio with the average change-factor in the TopTrio. These ratios are summarized in the lower righthand corner of Table 47-B. We name these ratios "PhysPop Adjustment" factors (abbreviated "ppAdju"). No "ppAdju" is very different from 1.00, which means that the Mean PhysPop values change over time by very nearly the SAME FACTOR in all three Trios.
Summary of Part 3: Preservation of Dose-Differences
As we undertake the post-1940 analyses, the findings in Parts 3b, 3c, and 3e provide assurance that differences in accumulated radiation dose, between the Census Divisions, are quite well preserved between 1940 and 1990.
* Part 4. Cigarette-Smoking: Another Twentieth Century Carcinogen
At the very start of the Twentieth Century, a new carcinogen called medical radiation was widely introduced into the lives of males and females. Soon thereafter, a second new carcinogen (and a contributing cause of Ischemic Heart Disease) became very popular among males: Cigarette smoking. Females joined later.
Has cigarette-smoking occurred with equal intensity in all Nine Census Divisions?
As every epidemiologist well knows, the true correlation between a dose and its effect can be obscured --- or even appear to be a negative correlation when it is truly positive --- due to poor matching of the dose-groups for other agents which also contribute to the disease-rate. We illustrated the potential consequences of poor matching in Chapter 5, Part 7 (especially Figures 5-D and 5-E).
By contrast with Figures 5-D and 5-E, the very high and positive correlations of PhysPop, with the 1940 cancer MortRates, indicate that the Nine Census Divisions were probably well matched for the 1940 impact of carcinogenic co-actors. It should be noted that, during a period of time such as 1900 to 1940, exposure to any co-actor can be similar in all Census Divisions, even while such exposure is rising alike in all the Divisions or falling alike in all the Divisions.
But there is no law of history, we repeat, which guarantees that the path leading to 1990 must be just like the path leading to 1940. And there is certainly no law guaranteeing that the approximate matching of Census Divisions, for the impact of any carcinogenic co-actor up to 1940, will persist until 1990.
Cigarette smoking is a proven and powerful carcinogen. If its post-1940 impact is NOT well matched across the Census Divisions, cigarette smoking could degrade the observed post-1940 correlations between PhysPop and cancer MortRates. So, at the start of our post-1940 analyses, we needed to ascertain whether or not the post-1940 impact of cigarette smoking occurred with approximately equal intensity in all Nine Census Divisions. It did not. Therefore, cigarette smoking is the topic of the next chapter.
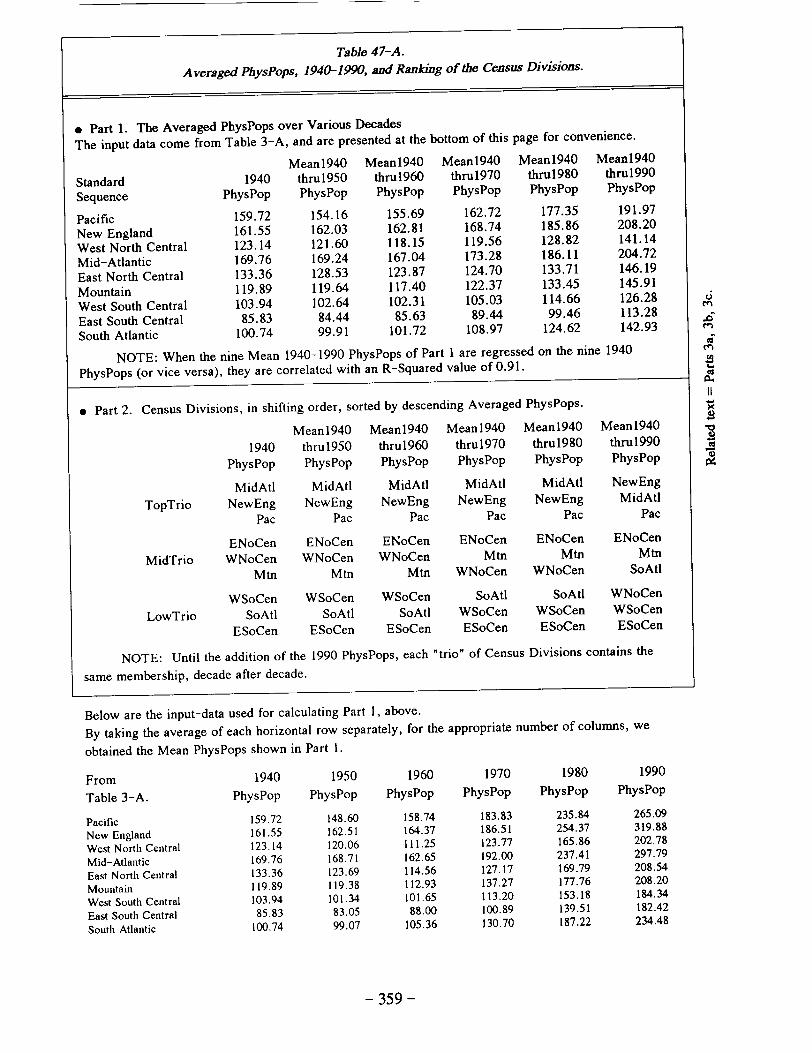
Table 47-A. Averaged PhysPops, 1940-1990, and Ranking of the Census Divisions.
e Part 1. The Averaged PhysPops over Various Decades The input data come from Table 3-A, and are presented at the bottom of this page for convenience.
Mean1940 Mean1940 Mean1940 Mean19 4 0 Mean1940
Standard 1940 thru1950 thru1960 thru1970 thrul980 thru1990
Sequence PhysPop PhysPop PhysPop PhysPop PhysPop PhysPop
Pacific 159.72 154.16 155.69 162.72 177.35 191.97
New England 161.55 162.03 162.81 168.74 185.86 208.20
West North Central 123.14 121.60 118.15 119.56 128.82 141.14
Mid-Atlantic 169.76 169.24 167.04 173.28 186.11 204.72
East North Central 133.36 128.53 123.87 124.70 133.71 146.19
Mountain 119.89 119.64 117.40 122.37 133.45 145.91
West South Central 103.94 102.64 102.31 105.03 114.66 126.28 6
East South Central 85.83 84.44 85.63 89.44 99.46 113.28 en
South Atlantic 100.74 99.91 101.72 108.97 124.62 142.93
NOTE: When the nine Mean 1940-1990 PhysPops of Part I are regressed on the nine 1940 I
PhysPops (or vice versa), they are correlated with an R-Squared value of 0.91. cc
* Part 2. Census Divisions, in shifting order, sorted by descending Averaged PhysPops.
Mean1940 Mean1940 Mean1940 Mean1940 Mean1940
1940 thru19SO thru1960 thru1970 thru1980 thru1990 PhysPop PhysPop PhysPop PhysPop PhysPop PhysPop
MidAtl MidAtl MidAtl MidAtl MidAtl NewEng
TopTrio NewEng NewEng NewEng NewEng NewEng MidAtl Pac Pac Pac Pac Pac Pac
ENoCen ENoCen ENoCen ENoCen ENoCen ENoCen
MidTrio WNoCen WNoCen WNoCen Mtn Mtn Mtn Mtn Mtn Mtn WNoCen WNoCen SoAtl
WSoCen WSoCen WSoCen SoAtl SoAtl WNoCen
LowTrio SoAtl SoAtl SoAtl WSoCen WSoCen WSoCen ESoCen ESoCen ESoCen ESoCen ESoCen ESoCen
NOTE: Until the addition of the 1990 PhysPops, each "trio" of Census Divisions contains the
same membership, decade after decade.
Below are the input-data used for calculating Part 1, above.
By taking the average of each horizontal row separately, for the appropriate number of columns, we
obtained the Mean PhysPops shown in Part 1.
From 1940 1950 1960 1970 1980 1990
Table 3-A. PhysPop PhysPop PhysPop PhysPop PhysPop PhysPop
Pacific 159.72 148.60 158.74 183.83 235.84 265.09
New England 161.55 162.51 164.37 186.51 254.37 319.88
West North Central 123.14 120.06 111.25 123.77 165.86 202.78
Mid-Atlantic 169.76 168.71 162.65 192.00 237.41 297.79
East North Central 133.36 123.69 114.56 127.17 169.79 208.54
Mountain 119.89 119.38 112.93 137.27 177.76 208.20
West South Central 103.94 101.34 101.65 113.20 153.18 184.34
East South Central 85.83 83.05 88.00 100.89 139.51 182.42
South Atlantic 100.74 99.07 105.36 130.70 187.22 234.48
- 359 -
Chap.47 Radiation (Medical) in the Pathogenesis of Cancer and Ischemic Heart Disease John W. Gofman
Table 47-B Change-Factors for Averaged (Mean) PhysPops, by Census Trios
CoL.A Cot.B 1940 1940-50
PhysPops PhysPops Tab3-A Tab 47-A
159.72 161.55 169.76 123.14 133.36 119.89 103.94 85.83
100.74
154.16 162.03 169.24 121.60 128.53 119.64 102.64 84.44 99.91
CoL.C Ratio
.B /Cot.A
0.965 1.003 0.997 0.987 0.964 0.998 0.987 0.984 0.992
CoL .D Input from
Coi.C
Avg Chg TopTrio
0.988 Avg Chg MidTrio
0.983 Avg Chg LowTrio
0.988
TrioSequence
Pacific NewEng Land Mid-AtLantic WestNoCent. EastNoCent. Mountain WestSoCent. EastSoCent. SoAttantic
1950 ppAdju
TrioSequence
Pacific NewEngtand Mid-At Lantic WestNoCent. EastNoCent. Mountain WestSoCent. EastSoCent. SoAttantic
1970 ppAdju
TrioSequence
Pacific NewEng Land Mid-AtLantic WestNoCent. EastNoCent. Mountain WestSoCent. EastSoCent. SoAttantic
1990 ppAdju
159.72 161.55 169.76 123.14 133.36 119.89 103.94 85.83
100.74
162.72 168.74 173.28 119.56 124.70 122.37 105.03 89.44
108.97
1.019 1.045 1.021 0.971 0.935 1.021 1.010 1.042 1.082
Cot.D: MidTrio/TopTrio = Cot.D: LowTrio/TopTrio =
Cot.A Cot.B 1940 1940-90
PhysPops PhysPops Tab 3-A Tab 47-A
159.72 161.55 169.76 123.14 133.36 119.89 103.94 85.83
100.74
191.97 208.20 204.72 141.14 146.19 145.91 126.28 113.28 142.93
Cot.C Ratio Cot.B
/Cot.A
1.202 1.289 1.206 1.146 1.096 1.217 1.215 1.320 1.419
Avg Chg TopTrio
1.028 Avg Chg MidTrio
0.976 Avg Chg LowTrio
1.045
0.95 1.02
Av To
Av Mi
Av Lo•
Cot.D: MidTrio/TopTrio = Cot.D: LowTrio/TopTrio =
.A 1940
PhysPops Tab3-A
159.72 161.55 169.76 123.14 133.36 119.89 103.94 85.83
100.74
Col.B 1940-60
PhysPops Tab 47-A
155.69 162.81 167.04 118.15 123.87 117.40 102.31 85.63
101.72
Cot .C Ratio
.B /Cot.A
0.975 1.008 0.984 0.959 0.929 0.979 0.984 0.998 1.010
CoL.A Co1.B 1940 1940-80
PhysPops PhysPops Tab 3-A Tab 47-A
159.72 161.55 169.76 123.14 133.36 119.89 103.94 85.83
100.74
177.35 185.86
128.82 133.71 133.45 114.66 99.46
124.62
Cot .C Ratio Cot.B
/Cot .A
1.110 1.150 1.096 1.046 1.003 1.113 1.103 1.159 1.237
1980 Cot.D: Mid/Top ppAdju Cot.D: Low/Top
Co[.D Input from
CoL.C
g Chg pTrio 1.232
Chg dTrio 1.153 g Chg wTrio 1.318
0.94 1.07
Cot .D Input from
Cot .C
Avg Chg TopTrio
0.989 Avg Chg MidTrio
0.956 Avg Chg LowTrio
0.997
I0.97 1.01
Cot.D Input from
Cot.C
Avg Chg TopTrio
1.119 Avg Chg MidTrio
1.054 Avg Chg LowTrio
1.166
0.94 1.04
PhysPop Adjustment ("ppAdju,, in subsequent tables and boxes) quantifies change in MidTrio PP and in LowTrio PP, relative to change in TopTrio PP.
Year
1950 1960 1970 1980 1990
ppAdju ppAdju MidTrio LowTrio
0.99 0.97 0.95 0.94 0.94
1.00 1.01 1.02 1.04 1.07
- 360 -
Cot.D: MidTrio/TopTrio = 0.99 CoL.D: LowTrio/TopTrio = 1.00
. . . . . . . . . . . . . . . . . . . . . . . . . . . . . . . . . . . . . . CoL.A Cot.B CoL.C Cot.D
1940 1940-70 Ratio Input PhysPops PhysPops Cot.B from
Tab 3-A Tab 47-A /Cot.A Cot.C
1960 Cot.D: Mid/Top : :pAdju Cot.D: Low/Top