chapter 4.2 soil management and conservation
TRANSCRIPT
Agricultural Resources and Environmental Indicators, Chapter 4.2, page 1
Chapter 4.2 Soil Management and Conservation
Crop production depends largely on soil and is affected greatly by the quality of that soil. Soil quality alsoplays a role in the environmental effects of crop production. Traditional measures of soil quality include landcapability and suitability, prime land, productivity, erodibility, and vulnerability to leach pesticides andnitrates. More comprehensive measures are needed that consider physical, chemical, and biological properties,and also economic factors. Soil management involves actions by land managers that affect soil quality andproductivity and alter soil's effects on environmental quality. Examples of these actions include land use orcropping pattern, type and extent of tillage, amount of cover or residue left on the soil, and use of conservationbuffers and structures.
Contents Page
Why Manage Soil? .............................................................................................................................................1Quality of Soils in U.S. Agriculture ...................................................................................................................3
Traditional measures of quality .............................................................................................................3Broadening the measures of soil quality..............................................................................................10Maintaining and improving soil quality ..............................................................................................10
Farmers’ Use of Rotational Cropping Systems ...............................................................................................12Extent of rotation cropping..................................................................................................................15Trends in rotation cropping.................................................................................................................15Use of cover crops ...............................................................................................................................15Economic factors affecting rotational cropping..................................................................................17Policies and programs affecting cropping pattern use........................................................................19
Farmers' Use of Crop Residue Management...................................................................................................19Why manage residue? ..........................................................................................................................19National and regional CRM use ..........................................................................................................21CRM use on major crops .....................................................................................................................31Economic incentives for CRM adoption ..............................................................................................32Policies and programs promoting CRM adoption...............................................................................37Barriers to CRM adoption ...................................................................................................................40
Farmers' Use of Conservation Buffers and Structures ....................................................................................41National and regional use of buffers and structures ...........................................................................41Economic and program factors affecting adoption of conservation structures ..................................43
Characteristics of Conservation Adopters.......................................................................................................43References ........................................................................................................................................................47
Why Manage Soil?
Soil, as a plant-growing medium, is the key resource in crop production. Soil supports the fundamentalphysical, chemical, and biological processes that must take place in order for plants to grow; it regulates waterflow between infiltration, root-zone storage, deep percolation, and runoff; and it acts as a buffer betweenproduction inputs and the environment. Soil can also function as a "degrader" or "immobilizer" of agriculturalchemicals, wastes, or other potential pollutants, and soil can mitigate climate change by sequestering carbonfrom the atmosphere (when the rate of organic matter production exceeds the rate of oxidation) (Kemper et al.,1997). How well soil performs these functions depends on soil quality.
Agricultural Resources and Environmental Indicators, chapter 4.2, page 2
A simple definition of soil quality is the capacity of soil to function (Karlen and Andrews, 2000). Soil qualityrefers to the attributes that characterize a particular soil. Important soil attributes are texture, structure, bulkdensity and rooting depth, permeability and water storage capacity, carbon content, organic matter andbiological activity, pH, and electrical conductivity (National Research Council, 1993). Soil quality can bemaintained or enhanced through the use of appropriate crop production technologies and related resourcemanagement systems. Inappropriate farming practices, on the other hand, can lead to soil degradation—loss oftopsoil through erosion; loss of organic matter through oxidation; soil compaction; acidification; loss of nitrates,phosphorous, and pesticides; and accumulation of salts and trace elements. Inappropriate practices can alsoincrease runoff of fertilizers and pesticides to surface and groundwater systems. Thus, soil degradation can haveboth direct and indirect negative effects on agricultural productivity and the environment. Even on high-qualitysoils, overuse of chemical inputs can result in soil toxicity and water pollution. Soil management, therefore, isan important component of all crop production systems because it can affect output levels as well as foodquality and safety, environmental pollution, and global climate change.
Land and soil quality is not only important to agriculture but also to other plant and animal systems. These areall loosely defined as ecosystems, where agriculture is an agroecosystem. An ecosystem encompasses thefunctional links between soil, water, and air. Public concern about the environment has led to a changingconcept of management from a single-resource, single-species management approach to multiple managementapproaches that involve the composition, structure, and function of entire ecosystems (CEQ, 1993). Soil qualitycan be defined as the capacity of soil to function within ecosystem boundaries to sustain biological productivity,maintain environmental quality, and promote plant and animal health (Doran and Parkin, 1994). Similarly, theNational Research Council (NRC) lists three functions of soil. The first is to provide the physical, chemical,and biological processes for plants to grow. The second is to store, regulate, and partition water flow throughthe environment. The third is to buffer environmental change by providing for the decomposition of organicwastes, nitrates, pesticides, and other substances that can become pollutants in water or air (NRC, 1993). Thefirst function relates to the long-run maintenance of soil for crop production while the other two indicate the roleof soil in maintaining environmental quality through the protection of water and air. Other researchers areexpanding the emerging concepts of ecosystems and soil quality and their relationships to the environment(Björklund et al., 1999; Daily, Matson, and Vitousek, 1997; Daily et al., 1997; Groot, 1992).
How soil is managed also has significant offsite economic effects that are increasingly being evaluated andconsidered in policy and program decisionmaking (see Chapters 3.3, Wildlife Resources Conservation, and 6.4Water Quality Programs, and Pretty et al., 2000).
Beneficial farm-level soil management practices are those designed to maintain the quality and long-termproductivity of the soil and reduce potential environmental damages from crop production. These practicesinclude rotational cropping, tillage and crop residue management, and various field/landscape scale engineeringstructures and buffer zones, e.g., grass waterways, terraces, contour-farming, strip-cropping, undergrounddrainage outlets, and surface diversion and drainage channels. Also beneficial to soil are certain nutrient, pest,and irrigation practices (see Chapters 2.2, Irrigation Water Management, 4.3, Pest Management, and 4.4,Nutrient Management). For the most part, multiple practices in the right proportion must be used for bestresults, depending upon topographic and agro-climatic conditions. However, in any given context, the extent towhich particular soil management technologies are carried out depends on site-specific technical, economic, andfinancial feasibility considerations, as well as farmer attitudes, perceptions, and resources. Also, to the extentthat there are offsite negative impacts, land and soil management practices may be influenced by society's

Agricultural Resources and Environmental Indicators, Chapter 4.2, page 3
willingness or intolerance to accept those impacts (Ruhl, 2000).
Quality of Soils in U.S. Agriculture
Maintaining and improving the quality of the Nation's soils can increase farm productivity, minimize the use ofnutrients and pesticides, improve water and air quality, and help sequester greenhouse gases. While the soilquality measures of land capability, productivity, and erodibility are well known, there is an increasing emphasison measures, including economic measures, that incorporate dynamic soil properties more fully reflecting asoil's potential for long-term agricultural production without negative environmental impacts.
Developing economic measures of soil quality requires a better understanding of the multiple functions of soilsand of the interaction between agricultural activities and soil quality. For example, productivity measures oftenreflect the private concerns surrounding soil quality. But other broader concerns, such as surface-waterpollution from runoff, soil productivity for future generations, and the health of agricultural and ruralecosystems, may be of greater economic importance and need to be reflected in new measures of land and soilquality. Combining the many physical attributes of land and soil quality into meaningful indicators is difficult,as is assigning economic values to these indicators.
Traditional measures of qualityLand and soil quality has been viewed conceptually in two different ways (Jawson, 2001). First, there is themore traditional approach that focuses on inherent soil properties and the suitability of land for various usessuch as crop production. Second, there is another more recent concept that focuses on the dynamic properties ofsoil and the effects of soil management. The former concept is more applicable for differentiating between soilswhile the latter is more useful for evaluating the effects of various practices on a particular soil (Karlen andAndrews, 2000; Karlen et al., 1997; Seybold et al., 1997). The term "soil quality" is used more often, but notalways, to refer to the effects of soil management. The definitions used for soil quality, therefore, address the"capacity of the soil to function" (Doran and Parkin, 1994) or the "fitness for use" (Pierce and Larson, 1993;Acton and Gregorich, 1995; Jaenicke, 1998). These are dynamic concepts and relate to the influence of humanuse and management of soil. This concept is often termed soil health. The more traditional measurements ofsoil properties found in soil surveys (texture, structure, slope, color, etc.) focus on inherent properties of soilformation, which include vegetation and patent material (USDA, SCS, 1993).
Measures of soil quality such as capability and prime farmland are thought to reflect the inherent properties ofsoil in relation to crop production. Other soil quality criteria are needed for other uses of land. The potentialcapacity of a soil to function must be assessed before a soil's fitness for use can be measured (Mausbach, 1997). Measures of land and soil quality should also account for differences in scale, both spatial and temporal(Halvorson, Smith, and Papendick, 1997). Scale variation is important because soil quality changes over timeand is different by region. To examine the relationships and services of land and soil in ecosystems, and ofspatial and temporal differences, some researchers have explored other soil quality evaluation approaches.Gottfried, Wear, and Lee (1996) point out that no one evaluation approach may be suitable to achieve optimalland use. Söderbaum (1987) proposes "positional analysis" to replace conventional benefit-cost analysis. Someof the more traditional measures of land quality are discussed in the next six sections.
Land capability and suitability. Some measures of land quality are used to monitor the capability or suitabilityof land for a particular purpose, such as growing crops or trees, grazing animals, or nonagricultural uses. Dataon two commonly used measures—land capability classes (LCC) and the prime farmland designation—have
Agricultural Resources and Environmental Indicators, chapter 4.2, page 4
been collected in the National Resources Inventory (NRI), conducted by USDA's Natural ResourcesConservation Service (NRCS) every 5 years (USDA, 1994, 1989b, and 2000). (See Appendix: AgriculturalResource Surveys and Data for a description of the NRI.)
Land capability classes (LCCs) range from I to VIII (USDA, 1973). Class I, about 7 percent of U.S. cropland,has no significant limitations for raising crops (table 4.2.1). Classes II and III make up just over three-fourths ofU.S. cropland and are suited for cultivated crops but have limitations such as poor drainage, limited root zones,climatic restrictions, or erosion potential. Class IV is suitable for crops but only under selected croppingpractices. Classes V, VI, and VII are best suited for pasture and range while Class VIII is suited only forwildlife habitat, recreation, and other nonagricultural uses (USDA, 1989a). Land capability classes I-III total337 million acres, or 82 percent of U.S. cropland including land in the Conservation Reserve Program (CRP)but excluding Alaska (fig. 4.2.1, table 4.2.1).
Prime farmland. Another measure of land suitability is USDA prime farmland, which is based on physical andmorphological soil characteristics such as depth of the water table in relation to the root zone, moisture-holdingcapacity, the degree of salinity, permeability, frequency of flooding, soil temperature, erodibility, and soilacidity. Land classified as prime farmland has the growing season, moisture supply, and soil quality needed tosustain high yields when treated and managed according to modern farming methods (USDA, 1989a). Primefarmland totals 222 million acres, or 54 percent of U.S. cropland, excluding Alaska (fig. 4.2.2, table 4.2.1).
These measures of land quality are often confused with the capability of land to produce economic returns. Land in capability classes I-III—prime farmland—does not necessarily have the highest value of cropproduction per acre (Vesterby and Krupa, 1993). Alternatively, lands earning high economic returns may not beclassified as prime farmland or in LCC I-III. For example, prime and LCC are based on characteristics thatreflect suitability for row crop production. Florida and Arizona have little prime farmland or land in LCC I-III,but these areas rank among the most economically productive in the Nation. (New irrigation will sometimeschange a classification from nonprime to prime if other soil characteristics needed for a prime classification arepresent.)
Productivity. Soil productivity, which measures output per unit of input, is often the primary reason formonitoring soil erosion (or other degradation processes) and is itself a measure of soil quality. Productivity isoften measured as crop yield per acre. Another indicator of land quality is the expected dollar returns per acrefrom production. Highest dollar values are in coastal areas where climate, soil, location, and irrigation favorproduction of high-value crops (fruits and vegetables), or where intensive livestock production takes place (fig.4.2.3). The least productive lands, in terms of agricultural sales per acre, are in bands across the Northern andCentral Plains. Productivity can reflect soil degradation if yields decline as soils become degraded and if inputuse increases to compensate for declines in soil quality. However, productivity may mask environmental orhealth components of soil quality; lands of poor physical quality (as measured by erosion, texture, and organicmatter) can sometimes produce very high yields without large increases in input use (Vesterby and Krupa,1993).
Erodibility. Highly erodible land (HEL) is a measure of soil quality of particular importance for USDAconservation policy (see Chapter 6.1, Conservation and Environmental Programs Overview). Because theestimated tons of wind- and water-eroded soil do not measure the erosion potential on particular soils, USDAuses the erodibility index (EI) to inventory and classify erosion potential and to determine conservation programeligibility. Highly erodible soils have the potential for erosion because of relatively unchanging physical

Agricultural Resources and Environmental Indicators, Chapter 4.2, page 5
Table 4.2.1–Cropland and soil quality, selected measures, 1992 and 19971
Measure Cropland CRP Total Cropland CRP Total1,000 acres Percent of acres
Land capability class in 1997
I (highest land quality) 26,567 229 26,796 7 0.7 6.5II 174,950 7,274 182,224 46.4 22.3 44.5III 114,963 13,485 128,448 30.5 41.2 31.4IV and above (lowest quality) 60,518 11,709 72,227 16.1 35.8 17.6 Total 376,998 32,697 409,695 100 100 100
Prime farmland in 1997 212,281 9,277 221,558 56.3 28.4 54.1
Erodibility in 1992:2
Highly erodible from water only 51,924 na na 13.5 na naHighly erodible from wind only 48,933 na na 13 na naHighly erodible from both 3,516 na na 0.9 na na Subtotal highly erodible 104,373 19,796 124,169 27.4 58.2 29.8Not highly erodible 277,944 14,244 292,188 72.3 41.8 70.2 Total 382,317 34,040 416,357 100 100 100 1Includes cultivated and noncultivated cropland and land enrolled in the Conservation Reserve Program (CRP) in thecontiguous States, Hawaii, and the U.S. Caribbean islands (less than 0.75 million acres). 2Highly erodible land has an erodibility index for sheet and rill erosion or for wind erosion of 8 or greater. Not availablefor 1997.Source: USDA, ERS, based on NRCS 1992 and 1997 National Resources Inventory data

Agricultural Resources and Environmental Indicators, chapter 4.2, page 6

Agricultural Resources and Environmental Indicators, Chapter 4.2, page 7
attributes. Associated with sheet and rill erosion are rainfall pattern, soil texture, and topography; associatedwith wind erosion are climatic and soil erodibility factors. Erosion rates can be reduced if hay or close-growncrops are grown, if tillage methods are used with appropriate crop residue management, and if conservationpractices are employed. An assessment of erosion needs to consider both the physical potential for erosion andthe erosion rate resulting from management choices.
Highly erodible lands are generally more vulnerable to soil quality problems, but soil may be productive iferosion is controlled. Eroding soils are usually considered to have lower quality than similar soils that areprotected from erosion. Soil quality suffers on eroding soils, but simply controlling erosion does not necessarilytranslate to high-quality soils since compaction, acidity, salinization, and biological factors play a part in thequality of the soil (Mausbach, 1997).
The HEL determination is based on physical soil factors relating to sheet, rill and wind erosion. Soils are said tobe highly erodible if the EI is greater than or equal to 8 (EI>8). The EI is found by dividing the potential erosion(sheet and rill, or wind) by the soil-loss tolerance factor (T-level, the rate of soil erosion above which long-termsoil productivity may be depleted) to reflect erosion potential relative to vulnerability to productivity loss(Heimlich and Bills, 1989; McCormack and Heimlich, 1985). USDA defines HEL as cropland with an erosionpotential of at least eight times its T-level. According to the 1992 NRI, 124 million acres of cropland and CRPland are highly erodible from water, wind, or both (table 4.2.1). However, for purposes of administering theconservation compliance provision of the 1985, 1990, and 1996 Farm Acts (Nelson and Schertz, 1996), USDA'sNRCS has classified 146 million acres as HEL. This includes some 22 million acres of other soils in fields thatare primarily highly erodible soils (for more information see Chapter 6.4, Conservation Compliance). Highlyerodible soils are found in all States (fig. 4.2.4).

Agricultural Resources and Environmental Indicators, chapter 4.2, page 8
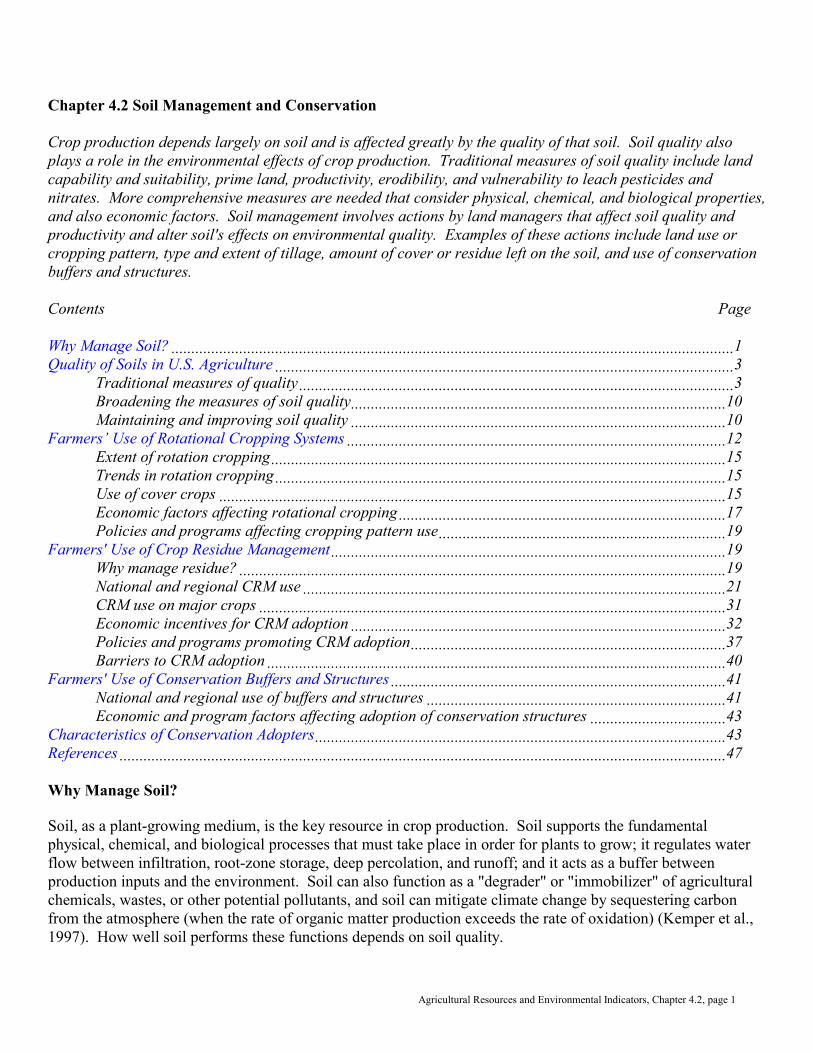
Erosion productivity loss. Another measure of productivity loss due to erosion converts total erosion from tonsper acre per year to inches per year. The rate of expected soil loss in inches is divided into the topsoil depth (the"A" horizon) recorded in the Soil Interpretation Record (SOILS 5) (USDA, 1983). This is a measure of howmany years it would take to remove the topsoil at the current rate of erosion (on the extreme assumption that allthe eroded soil is removed from the field). Multiplying the inverse of this measure by the cash rental rate forcropland reflects the relative economic value of soil productivity loss due to erosion (USDA, 1997) (see box"Calculation of Erosion Productivity Loss"). Three factors are reflected in this measure: erosion rates, soildepth, and rental values of land. Low erosion rates on deep, long-lasting topsoil are given less weight, andhighly productive (high rental rate) but vulnerable soils (thin topsoil, high erosion rate) are given more weight(fig. 4.2.5). This indicator shows five major concentrations of vulnerable soils; with the largest centered onIowa, Illinois, and Missouri in the Corn Belt. This area's index values are largely driven by relatively high rentalrates. While erosion rates are moderate in this area, the soil is more valuable relative to other regions such asthe Plains States. A second concentration of vulnerable soils is in eastern North Dakota and western and south-central Minnesota. The third concentration is the eastern bluffs of the Mississippi River in western Kentucky,Tennessee, and along the eastern edge of the Mississippi Delta. A fourth concentration is the eastern edge ofColorado. The final concentration is a band of highly erodible and highly valued land in eastern Washingtonand Oregon around the Palouse and Central Plateau areas.
The major onsite effect of soil erosion is the impact on soil productivity. Research conducted in the 1980s hasimproved our understanding of the long-term relationship between erosion and productivity (AAEA, 1986). The 1987 Resources Conservation Appraisal (RCA) estimated that, under 1982 management conditions,agricultural productivity on the average would decline about 3 percent over the next 100 years due to soilerosion. Productivity loss would be concentrated on soils eroding at high tolerance values or on very fragilesoils where even slight erosion can result in large declines in yields (USDA, 1989a). Soil erosion alsocontributes to off-farm damage when sediment enters streams, rivers, lakes, and other water bodies and damagesmunicipal water systems, fills reservoirs and streams interfering with navigation, and contributes to flooding. The rate at which eroded soil enters water bodies is called the erosion/sediment delivery ratio and varies greatlydepending on type of soil, slope, distance from water, and many other factors. Ribaudo (1986) estimated off-farm sediment damages at $2-$8 billion annually.
Vulnerability. Interest in soil erosion and its associated costs has been coupled with an increasing interest in theloss of nutrients, pesticides, and salts from farming systems to surface and ground water (National ResearchCouncil, 1993). For example, indices to assess the potential for groundwater contamination related toagricultural chemical use (Kellogg, Maizel, and Goss, 1992) incorporate variables that reflect the propensity ofsoils to leach pesticides and nitrates. The Ground Water Vulnerability Indices for Pesticides and Nitrogen are
Calculation of Erosion Productivity Loss
Erosion productivity loss (EPL) estimates in figure 4.2.5 take into account an erosion factor, depth of soil,and an economic factor. The formula is: ERL = (1/years of life) * rent. Years of life = inches of sheet, rill,and wind erosion per year/inches of topsoil in the "A" horizon. Rent = average rental rate for cropland in aspecific county, based on U.S Census data. For example, suppose a soil is expected to erode at 0.1 inches peracre per year and the soil depth is 10 inches and the average rent is $20/acre. The soil would have 100 yearsof life. The erosion productivity loss is $20/100, or 20 cents/acre/year. Productivity loss is greater when soildepth is less, the erosion rate is greater, or average rent is higher.
Agricultural Resources and Environmental Indicators, Chapter 4.2, page 9
functions of soil leaching potential, pesticide and nitrogen properties, precipitation, and chemical use. The CornBelt, Southeast, and Lake States have large areas vulnerable to pesticide leaching and with high potential fornitrate leaching (see figs. 2.3.3 and 2.3.8 in Chapter 2.3, Water Quality Impacts of Agriculture).
Land capability classes, prime farmland, and highly erodible land designations are useful in determining howland might be used or the degree and location of erosion, but they are limited in that they exclude otherimportant characteristics of soils and pertain mostly to cropland. Productivity measures, such as yields per acre,or profitability measures, such as cash rents, provide fairly direct indicators of the utility of land for production.Net income is another productivity measure for producers wishing to maximize the return on their landinvestments that can be used as an indicator of soil quality. But, such measures are limited to private interestsand do not reflect the environmental vulnerability or degradation for alternative or future uses. Vulnerabilityindices are useful measures of potential environmental impacts and provide a needed link between soilcharacteristics and water quality. All these measures can provide policymakers and natural resource managerswith information for beginning to design and target policies for resource management. But, as we broaden ourunderstanding of land as a fundamental base for the environment, broader measures are needed to capture themultiple dimensions of soil and land quality.
Agricultural Resources and Environmental Indicators, chapter 4.2, page 10
Broadening the measures of soil qualityAmong the first to suggest developing a broader concept of soil quality were Warkentin and Fletcher (1977). They stressed the importance of expanding the concept of soil definition to include more than just "pure soil." They noted that soil was being called upon for recycling and waste assimilation, aesthetics and leisure use, aswell as food and fiber production. Larson and Pierce (1991) functionally defined soil quality and suggestedways to evaluate it with changes in management practices. Other researchers have expanded our knowledge ofsoil quality concepts and are developing methods of combining information on a variety of soil properties intosoil quality indexes (Karlen and Andrews, 2000).
Instead of focusing on the capability to support specific activities, such as crop production, or a single soildegradation process, such as erosion or chemical leaching, researchers are focusing on how a broad range ofphysical, chemical, and biological properties determine soil quality. Physical properties include soil structureand aggregate stability, and wind and water erosion. Chemical properties include pH, total plant nutrients, andsalinity. Biological properties include root microbial and other organism-driven processes such as respiration,mineralization, immobolization, and denitrification (Jawson, 2001).
Most definitions of soil quality include both environmental factors and measures of crop productivity. Forexample, soil quality has been defined as the ability of a soil to produce safe and nutritious crops in a sustainedmanner over the long term and to enhance human and animal health without impairing the natural resourcesbase or harming the environment (Parr et al., 1992). Similarly, soil quality can be defined as the sustainingcapacity of a soil to accept, store, and recycle water, minerals, and energy for production of crops at optimumlevels while preserving a healthy environment (Arshad and Coen, 1992). The NRC (1993) recommends that theconcept of soil quality should be the principle guiding the recommendations for use of conservation practicesand the targeting of programs and resources. Currently, conservation compliance plans rely primarily on onesoil quality indicator—soil erosion potential as measured by the EI.
A soil's quality is determined by many static and dynamic properties such as soil depth, water-holding capacity,bulk density, nutrient availability, organic matter, microbial biomass, carbon and nitrogen content, soil structure,water infiltration, and crop yield. Because of the correlation among these properties, a few key attributes can beselected as soil quality indicators (Olson, 1992; Hornsby and Brown, 1992; Alexander and McLaughlin, 1992;and Arshad and Coen, 1992). Parr et al. (1992) suggest a soil quality index that includes such factors as soilproperties, productivity potential, environmental factors, health (human/animal), erodibility, biological diversity,food quality/safety, and management inputs. Many of these factors, such as food quality or biological diversity,are complex indicators themselves but may be important contributors to the full breadth of soil quality. Andwhile the components of soil quality appear quite complex, some soil properties can be estimated withoutcollecting detailed information of attributes. For example, Larson and Stewart (1992) use crop residue data anda simple regression model to estimate changes in soil organic matter for several U.S. soils.
Maintaining and improving soil qualitySoil quality is a function of many factors, including agroclimatic factors, hydrogeology, andcropping/production practices. Soil quality can be degraded through three processes: (1) physical degradationsuch as wind and water erosion and compaction; (2) chemical degradation such as toxification, salinization, andacidification; and (3) biological degradation, which includes declines in organic matter, carbon, and the activityand diversity of soil fauna (NRC, 1993). Slowing down or stopping these processes will help maintain soilquality. Reversing the processes will improve soil quality over time.
Agricultural Resources and Environmental Indicators, Chapter 4.2, page 11
Physical degradation. Indicators of physical soil properties include bulk density, porosity, structure, roughness,and aggregate characteristics or soil tilth (Karlen et al., 1992). Erosion has long been considered the majoragent of soil degradation worldwide (NRC, 1993). Another form of soil degradation is compaction, typicallycaused by heavy machinery and cattle trampling. Soil texture, compactive effort, soil moisture, and soilmineralogy are determining factors of vulnerability to compaction (Lewis, 2001). Compaction can make tillagecostly, impede the emergence of seedlings, and decrease water infiltration, causing higher runoff of rainwaterand increasing water erosion (World Resources Institute, 1992). Oskoui and Voorhees (1991) examined theeffects of soil compaction on yield loss, energy costs, capital costs, timeliness costs, air pollution costs, anderosion costs. They estimated that the increased fuel cost due to compacted soil, alone, could be as high as$5.70/hectare ($2.31/acre).
Chemical degradation. While salinity problems are often associated with irrigation, they can also occur indryland areas where rainfall is insufficient to leach salts from the soil. More than 48 million acres of croplandand pastureland are affected by varying degrees of salinity (USDA, 1989a). Irrigated areas are particularlysubject to salinization because irrigation water contains dissolved salts, which become more concentrated in thesoil as water is consumed by crops or lost by evaporation (USDA, 1989a). Crops such as corn, soybeans, rice,and some fruits and vegetables are quite sensitive to salinity and an increase in salinity can lead to a significantyield reduction.
Acidification, another chemical degradation process, can occur when bases (such as calcium, magnesium,potassium, and sodium) are leached from the soil. Aluminum toxicity is often a problem in acid soils, causingshallow rooting and susceptibility to drought (Foy et al., 1999). Pesticide toxicity also affects soil quality (NRC,1993). Sorption rates and persistence, measured in half-life, determine pesticide impacts (Rao and Hornsby,1989). Highly persistent pesticides are more subject to leaching and runoff, causing water quality problems (seeChapter 2.3 Water Quality Impacts of Agriculture). Pesticide toxicity effects are complex, but in general, higherquality soils tend to be more efficient at degrading pesticides through chemical and biological processes (NRC,1993). Acidity may be reduced by the application of basic material, such as limestone. Acidic soil conditionscan limit plant growth by supplying insufficient calcium or magnesium, altering the decomposition rates oforganic matter, and reducing the amount of nitrogen fixed by legumes (NRC, 1993).
Biological degradation. Biological degradation affects the health of the soil and organic matter, which affectsthe physical and chemical properties of soils (NRC, 1993). Currently, little is known about how agriculturalactivities change a soil's biological properties, and what the potential cost is to the food and fiber system. Asmall fraction of the microbial portion of the soil has been isolated and characterized. It is estimated that lessthan 1 percent of all bacterial species are presently known and there may be up to 1 million different species onearth (ASM, 1994). The number of bacterial species in a gram of soil may exceed 10,000 (Torsvik and Daae,1990).
Soil organisms contribute to the maintenance of soil quality and control many key processes such asdecomposition of plant residue and organic material, nitrogen fixation, and nutrient availability (Kennedy andPapendick, 1995). Biological degradation is important because if the soil's food web is disrupted, the soil maynot be able to cycle nutrients and transform harmful chemicals or substances to nontoxic waste or to combatplant pests and diseases (Mausbach, 1997). The assessment of soil health is thus important in determining thesustainability of land management systems (Doran, Sarrantonio, and Janke, 1996).
Agricultural Resources and Environmental Indicators, chapter 4.2, page 12
The microbial community is continually adapting to the environment, and can function as an indicator ofchanges in soil quality. Methods to assess soil microbial status need to be explored as indicators to furtherdefine and measure soil quality. Microbial populations can provide evidence of subtle changes in soil beforeorganic matter or other parameters can measure it (Kennedy and Papendick, 1995).
NRCS has recognized the importance of soil quality and has established the Soil Quality Institute to acquire anddevelop soil quality technology. In addition, many Federal programs address specific soil quality factors such aswind and water erosion and nutrient loss (see Chapter 6.1, Overview of Conservation Programs andExpenditures). USDA programs and other research are directed at conducting research on the relationshipbetween farming practices and soil quality, developing new technologies and practices that conserve and protectsoil resources, providing technical and financial assistance to adopt soil conserving practices, and protectingfarmland through land retirement and conservation easements.
Government conservation programs and farmers’ increased use of soil management and conservation practiceshave substantially reduced erosion and induced degradation of soil quality. In 1997, cropland sheet, rill, andwind erosion together averaged 5 tons/acre/year, down 44 percent from the late 1930s and 32 percent from 1982(table 4.2.2). At the same time there has been a drop in cropland eroding above the tolerance level where it canlose productivity. In 1997, only 17 percent of cropland was above the tolerance level for sheet and rill erosion,down from 24 percent in 1982 (table 4.2.3). A similar drop also occurred in cropland with wind erosion abovethe tolerance level.
The following sections address conservation management systems that help maintain and improve the soilresource, bringing about multiple societal benefits such as cleaner water, cleaner air, and improved wildlifehabitat.
Farmers’ Use of Rotational Cropping Systems
Cropping systems which involve a rotation of crops (see box, "Cropping Pattern Definitions") can playsignificant roles in conserving soil, maintaining soil fertility, controlling pests, and reducing agriculture=s
Cropping Pattern Definitions
The following definitions were applied to 3-year crop sequence data reported in the Cropping Practices and AgriculturalManagement Study surveys to identify a cropping pattern for each sample field. The data were limited to the currentyear=s crop plus the crops planted the previous 2 years on the sample field.Monoculture or continuous same cropCA crop sequence where the same crop is planted for 3 consecutive years. Smallgrains (wheat, oats, barley, flax, rye, etc.) or other close-grown crops may be planted in the fall as a cover crop. Therotation excludes soybeans double-cropped with winter wheat.Corn/soybean rotationCA crop sequence that alternates between corn and soybeans.Other row crops in rotationCA crop sequence, excluding continuous same crop, where only row crops (corn, sorghum,soybeans, cotton, peanuts, vegetables, etc.) are planted for 3 consecutive years. Small grains or close-grown crops may beplanted in the fall as a cover crop.Row crop/small grain rotationCA crop sequence where some combination of row crops and small grains are planted overthe 3-year period. The rotation excludes soybeans double-cropped with winter wheat.Rotation with meadow cropsCA crop sequence that includes hay, pasture, or other use in 1 or more previous years. Therotation excludes any of the above rotations and any area that was idle or fallow in one of the previous years.Idle or fallow in rotationCA crop sequence that includes idle, diverted, or fallowed land in 1 or more of the previousyears.Double-cropped soybeans and wheatCA crop sequence, limited to soybean and wheat acreage, where winter wheat isplanted the previous fall, harvested the following summer, and then soybeans seeded and harvested.

Agricultural Resources and Environmental Indicators, Chapter 4.2, page 13
Table 4.2.2—Estimated acreage and erosion in the contiguous United States, selected years, 1938-97Item 1938 1967 1977 1982 1987 1992 1997
Million acresAcreage:Cropland and CRP combined 398.81 438.2 413.3 421 406.6 382.3 377CRP land - - - - 3.8 34 32.7Pasture na na na 131.9 127.6 125.9 120Range na na na 408.9 402.8 398.9 406
Total erosion: Billion tons/yearCropland and CRP combined– Sheet and rill na 2.602 1.93 1.69 1.52 1.21 1.06 Wind na na na 1.38 1.4 0.95 0.84Pasture– Sheet and rill3 na na na 1.45 1.28 1.26 1.08 Wind3 na na na 0.13 0.13 0.13 0.12Range– Sheet and rill3 na na na 0.49 0.48 0.48 na Wind3 na na na 1.92 1.77 1.76 naTotal cropland, pasture, range na na na 7.12 6.46 5.76 na
Erosion per acre: Tons/acre/yearCropland Sheet and rill na 5.9 4.7 4 3.7 3.1 2.8 Wind na na 5.3 3.3 3.2 2.4 2.2 Subtotal 8.94 na na 7.3 6.9 5.5 5CRP– Sheet and rill - - - - 2 0.6 0.4 Wind - - - - 6.8 0.7 0.3 Subtotal - - - - 8.8 1.3 0.7Pasture– Sheet and rill na na na 1.1 1 1 0.9 Wind na na na 0.1 0.1 0.1 0.1Range– Sheet and rill na na na 1.2 1.2 1.2 na Wind na na na 4.7 4.4 4.4 nana = not available.1 Based on 1939 census estimate of cropland.2 Kimberlin (1976), based on 1967 Conservation Needs Inventory.3 Based on multiplying published per acre erosion estimates times acreage.4 Based on dividing sum of sheet, rill, and wind erosion by total U.S. cropland acres.Source: USDA, ERS, based on NRCS’ National Resources Inventories of 1977, 1982, 1987, 1992, and 1997, except asnoted.
negative effects on the environment. For example, row crops on erosive soils can be rotated with soil-conserving crops to reduce average annual loss of soil. Closely sown field grain crops such as wheat, barley,and oats, as well as hay and forage crops, provide additional vegetative cover to reduce soil erosion and addorganic matter. In addition, these crops also compete with broadleaf weeds and may help control the weedinfestation in subsequent crops since they are usually harvested before weeds reach maturity and produce seed.

Agricultural Resources and Environmental Indicators, chapter 4.2, page 14
Table 4.2.3—Changes in cropland eroding above and below the tolerance level, 1982-97Erosion level relativeto tolerance (T) 1982 1987 1992 1997 1982 1987 1992 1997 Cropland area (million acres) 1 Percent of cropland area1
Sheet and rill erosionT level or less 319 316 310 312 76 78 81 83Between T and 2T 54 49 42 40 13 12 11 11Between 2Tand 3T 19 17 14 12 4 4 4 3Over 3T 29 25 16 13 7 6 4 3Total U.S. 421 407 382 377 100 100 100 100
Wind erosionT level or less 343 329 329 329 82 81 86 87Between T and 2T 35 36 25 23 8 9 7 6Between 2Tand 3T 18 17 11 10 4 4 3 3Over 3T 25 25 15 15 6 6 4 4Total U.S. 421 407 382 377 100 100 100 1001 Includes cultivated and noncultivated cropland. Estimates for 1987-97 exclude land in the Conservation ReserveProgram, most of which had erosion below the T level in 1997 with conservation cover in place.Source: USDA, ERS, based on NRCS National Resources Inventory data as reported in the 1997 Summary Report(revised December 2000).
Table 4.2.4—Cropping patterns on land in major field crops, major producing States, 1999 or latest yearavailable
Cropping pattern
Corn in1999
Soybeansin 1999
Cotton in1999
Peanuts in1999
Sunflowersin 1999
Winterwheat in
1998
Potatoes in1997
(15 States) (17 States) (10 States) (4 States) (3 States) (18 States) (3 States)Percent of total crop
No rotation:Continuous same crop 16 8 61 - - 38 2Rotation with:Corn/soybeans 59 58 na na na na naOther row crops 10 15 31 80 7 na 13Wheat/soybeans double crop
na 6 na na na 2 na
Other row crops and small grains
2 6 2 1 72 31 45
Meadow 6 1 1 3 1 2 3Fallow or idle 7 6 5 16 20 18 37Other small grains na na na na na 9 naSubtotal rotation 84 92 39 100 100 62 98Total 100 100 100 100 100 100 100
Fall cover crop 2 6 8 28 2 na ndna = not applicable. - = less than 0.5 percent. nd = no dataSource: USDA, ERS, 1998 and 1999 Agricultural Resource Management Study (ARMS) surveys.

Agricultural Resources and Environmental Indicators, Chapter 4.2, page 15
Rotating crops helps break disease and insect cycles. Cover crops planted in the fall help reduce erosion fromwinter and spring storms, hold nutrients that might otherwise be lost, and increase carbon sequestration. Leguminous crops increase nitrogen levels in the soil.
This section reviews the extent to which farmers use rotational cropping and cover crops of various types, andhow economic factors and policies and programs affect that use.
Extent of rotational croppingRotational cropping in some form dominates major crop production in the United States, with the exception ofcotton (39 percent, table 4.2.4). In major growing States, 98 percent or more of peanut, sunflower, and potatoacreage is in rotations, with soybeans and corn slightly lower at 92 and 84 percent, respectively.
Most rotational cropping of corn and soybeans is with each other, whereas that of cotton and peanuts is withother row crops. Row crop rotations help in disease control but are generally less soil-conserving than rotationsthat include small grains or meadow or hay crops. Only 4-8 percent of corn, soybean, cotton, or peanut acreagein 1999 was rotated with small grains or meadow.
Farmers rotate corn and soybeans on around 60 percent of the acreage in these crops. Because the corn cropleaves more residue after harvest than soybeans, a corn/soybean rotation reduces erosion more than doescontinuous soybeans, but less than continuous corn. A corn/soybean rotation has other advantages. It aidsdisease control on the corn and soybeans, while the soybeans fix nitrogen for use by the subsequent corn crop.
Winter wheat was rotated with a row crop and another small grain on 40 percent of the acreage in 1998. Aboutone-fifth of winter wheat was rotated with fallow, using fallow to conserve moisture and reduce disease for thesubsequent wheat crop. Two percent of winter wheat was double cropped with soybeans, a common practice insome Southern States.
About three-fourths of the sunflower acreage in 1999 and 45 percent of the potatoes in 1997 were in rotationwith other row crops and small grains. An additional 1-6 percent of these crops was rotated with meadow orhay crops.
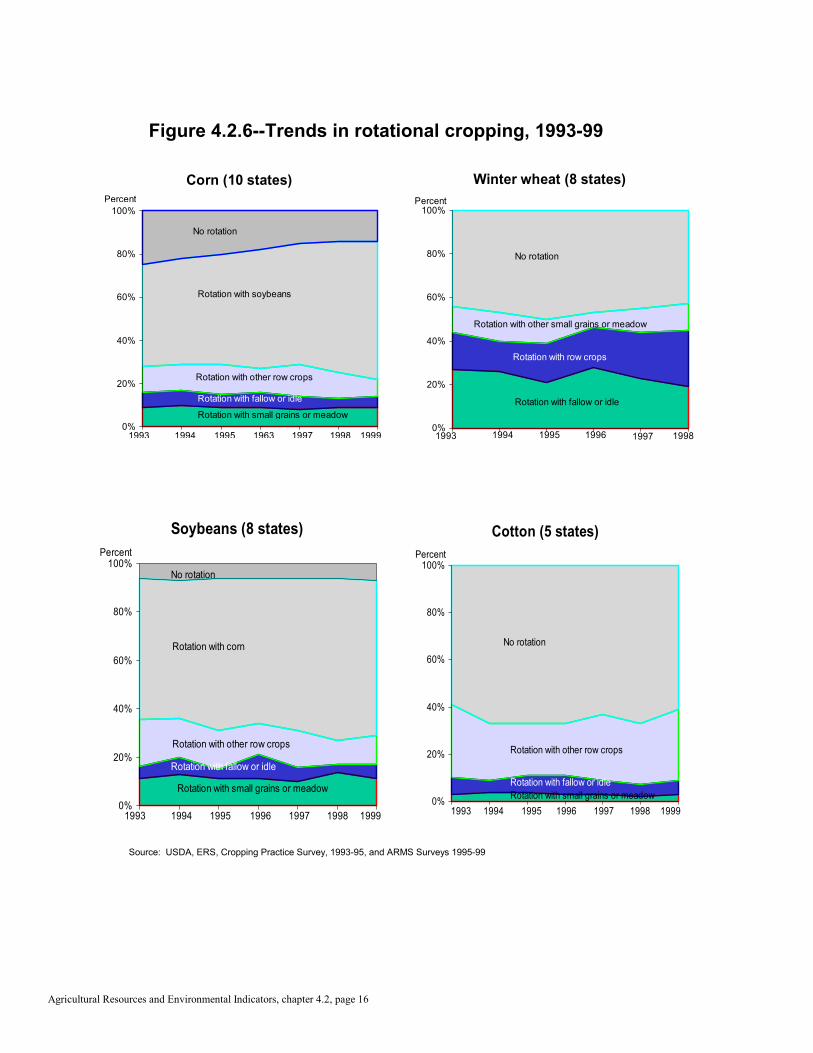
Trends in rotational croppingRotating corn with other crops, particularly soybeans, has increased, based on time-series data available formajor growing States (fig. 4.2.6). The increase for corn comes from greater rotation with soybeans. Cornfarmers in 10 major corn growing States reported a corn/soybean rotation on 64 percent of the corn acreage in1999, up from 47 percent in 1993. Rotational cropping of cotton in 1999 was up slightly from 1993.
Some shifts among rotational patterns are also noticeable for soybeans and winter wheat. Since 1993, relativelymore soybean acreage in the eight major growing States is in rotation with corn while less is being rotated withother row crops. For winter wheat, the shift is toward more rotation with row crops and less rotation withfallow.
Use of cover cropsA cover crop of small grains, meadow, or hay planted in the fall after harvest of a row crop provides vegetativecover to reduce soil loss, hold nutrients, add organic matter to the soil, and sequester carbon. Except for winterwheat, the cover crop is usually not harvested, but is sometimes grazed by livestock. The highest relative use of
Agricultural Resources and Environmental Indicators, chapter 4.2, page 16
Figure 4.2.6--Trends in rotational cropping, 1993-99
Corn (10 states)
0%
20%
40%
60%
80%
100%
No rotation
Rotation with fallow or idle
Rotation with other row crops
Rotation with soybeans
Rotation with small grains or meadow
1993 1994 1995 1963 1997 1998 1999
Percent
Soybeans (8 states)
0%
20%
40%
60%
80%
100%
Rotation with corn
Rotation with small grains or meadow
Rotation with fallow or idle
Rotation with other row crops
No rotation
19961993 199819971995 19991994
Percent
Winter wheat (8 states)
0%
20%
40%
60%
80%
100%Percent
No rotation
Rotation with fallow or idle
Rotation with row crops
Rotation with other small grains or meadow
199819971996199519941993
Cotton (5 states)
0%
20%
40%
60%
80%
100%
1993 1994 1995 1996 1997 1998 1999
No rotation
Rotation with small grains or meadowRotation with fallow or idle
Rotation with other row crops
Percent
Source: USDA, ERS, Cropping Practice Survey, 1993-95, and ARMS Surveys 1995-99

Agricultural Resources and Environmental Indicators, Chapter 4.2, page 17
cover crops in major growing States occurred prior to planting peanuts, with over 28 percent of 1999 acreagebenefiting from a 1998 fall planted cover crop (table 4.2.4). Prior cover crops also benefited 8 percent of cotton,6 percent of soybean (mostly winter wheat/soybean double cropping), and 2 percent of corn and sunfloweracreage. No data are available on cover crop planting prior to potatoes.
Economic factors affecting rotational croppingThe primary factor determining farmers= choice of a cropping pattern is the relative rate of return resulting fromdifferences in yields, costs and returns, and government policy. Research shows higher yields usually resultfrom crop rotations compared with those achieved with continuous cropping under similar conditions (Heichel,1987; Power, 1987). Yields following legumes are often 10 to 20 percent higher than continuous grainregardless of the amount of fertilizer applied (NRC, 1989). Corn yields reported by farmers surveyed by USDAin 1990-96 averaged 4-18 bushels per acre higher on dryland in a corn-soybean rotation than on dryland incontinuous corn (table 4.2.5). Corn following wheat, which is not a legume,
Table 4.2.5—Yields, costs, and returns to corn by cropping pattern and region, 1996Region and croppingpattern
Averageyield per
acre
Averageprice perbushel
Grossreceipts
Pre-harvestcost per
acre
Returnsabove
preharvestcosts
Difference inreturns
1990-96 1996 2 1996 3 1996 4 1996Bushels 1 Dollars/acre Percent
Dryland Areas Eastern Corn Belt Corn-corn 129 2.71 350 169 181 Corn-soybean rotation 138 2.71 374 164 210 Rotation effect 9 24 -5 29 16 Western Corn Belt Corn-corn 124 2.71 336 167 169 Corn-soybean rotation 130 2.71 352 146 206 Rotation effect 6 16 -21 37 22 Lake States Corn-corn 115 2.71 312 150 162 Corn-soybean rotation 119 2.71 322 152 170 Rotation effect 4 10 2 8 5 Plains States Corn-corn 82 2.71 222 121 101 Corn-soybean 100 2.71 271 118 153 Rotation effect 18 49 -3 52 51
Irrigated Areas Plains States Corn-corn 146 2.71 396 248 148 Corn-soybean rotation 146 2.71 396 232 164 Rotation effect 0 0 -16 16 111 Estimated from Cropping Practices Surveys for 1990-96, see McBride (1999).2 U.S. average price, marketing year Sept. 1996-Aug. 1997.3 Average yield times the 1996 average U.S. price of $2.71 bushel.4 Estimated from the 1996 ARMS, see McBride (1999). Includes thepre-harvest costs of seed, fertilizer, chemicals, energy, labor, and capital.Source: USDA, ERS, see table footnotes above.
Agricultural Resources and Environmental Indicators, chapter 4.2, page 18
produces greater yield than continuous corn when the same amount of fertilizer is applied (Power, 1987). Rotations that add organic matter can improve soil tilth and water-holding capacity, and in turn crop yields.
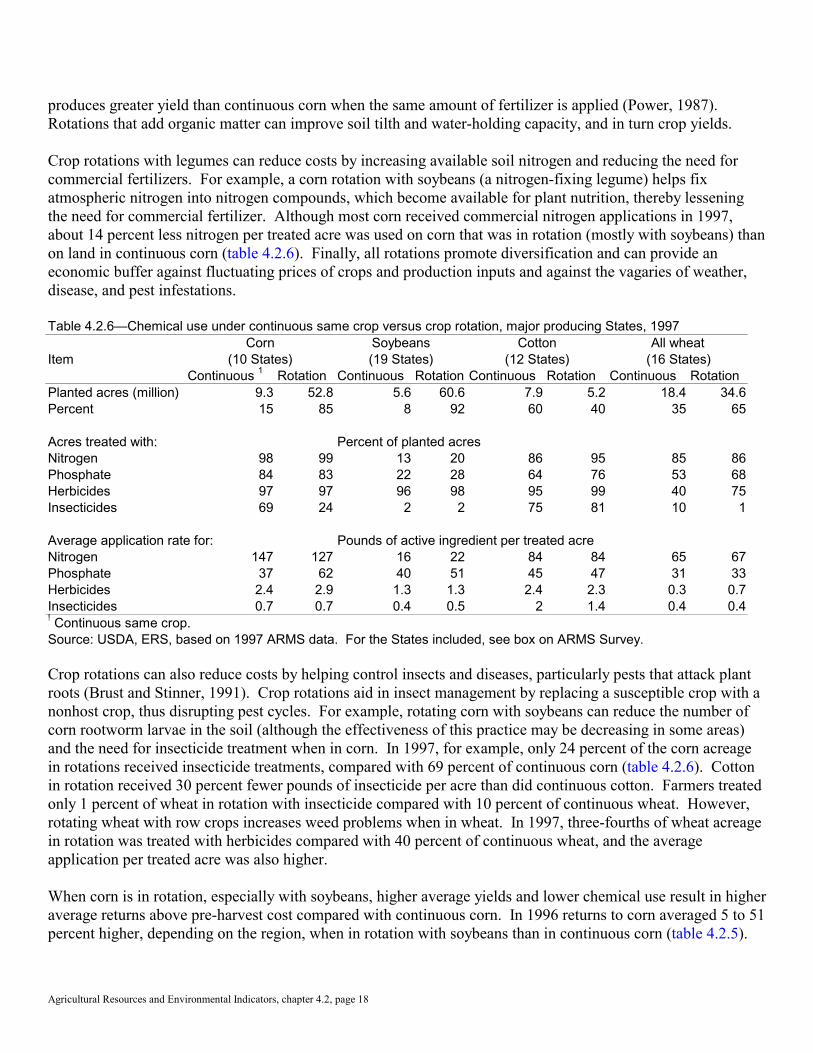
Crop rotations with legumes can reduce costs by increasing available soil nitrogen and reducing the need forcommercial fertilizers. For example, a corn rotation with soybeans (a nitrogen-fixing legume) helps fixatmospheric nitrogen into nitrogen compounds, which become available for plant nutrition, thereby lesseningthe need for commercial fertilizer. Although most corn received commercial nitrogen applications in 1997,about 14 percent less nitrogen per treated acre was used on corn that was in rotation (mostly with soybeans) thanon land in continuous corn (table 4.2.6). Finally, all rotations promote diversification and can provide aneconomic buffer against fluctuating prices of crops and production inputs and against the vagaries of weather,disease, and pest infestations.
Table 4.2.6—Chemical use under continuous same crop versus crop rotation, major producing States, 1997Corn Soybeans Cotton All wheat
Item (10 States) (19 States) (12 States) (16 States)Continuous 1 Rotation Continuous Rotation Continuous Rotation Continuous Rotation
Planted acres (million) 9.3 52.8 5.6 60.6 7.9 5.2 18.4 34.6Percent 15 85 8 92 60 40 35 65
Acres treated with: Percent of planted acresNitrogen 98 99 13 20 86 95 85 86Phosphate 84 83 22 28 64 76 53 68Herbicides 97 97 96 98 95 99 40 75Insecticides 69 24 2 2 75 81 10 1
Average application rate for: Pounds of active ingredient per treated acreNitrogen 147 127 16 22 84 84 65 67Phosphate 37 62 40 51 45 47 31 33Herbicides 2.4 2.9 1.3 1.3 2.4 2.3 0.3 0.7Insecticides 0.7 0.7 0.4 0.5 2 1.4 0.4 0.4! Continuous same crop.Source: USDA, ERS, based on 1997 ARMS data. For the States included, see box on ARMS Survey.
Crop rotations can also reduce costs by helping control insects and diseases, particularly pests that attack plantroots (Brust and Stinner, 1991). Crop rotations aid in insect management by replacing a susceptible crop with anonhost crop, thus disrupting pest cycles. For example, rotating corn with soybeans can reduce the number ofcorn rootworm larvae in the soil (although the effectiveness of this practice may be decreasing in some areas)and the need for insecticide treatment when in corn. In 1997, for example, only 24 percent of the corn acreagein rotations received insecticide treatments, compared with 69 percent of continuous corn (table 4.2.6). Cottonin rotation received 30 percent fewer pounds of insecticide per acre than did continuous cotton. Farmers treatedonly 1 percent of wheat in rotation with insecticide compared with 10 percent of continuous wheat. However,rotating wheat with row crops increases weed problems when in wheat. In 1997, three-fourths of wheat acreagein rotation was treated with herbicides compared with 40 percent of continuous wheat, and the averageapplication per treated acre was also higher.
When corn is in rotation, especially with soybeans, higher average yields and lower chemical use result in higheraverage returns above pre-harvest cost compared with continuous corn. In 1996 returns to corn averaged 5 to 51percent higher, depending on the region, when in rotation with soybeans than in continuous corn (table 4.2.5).

Agricultural Resources and Environmental Indicators, Chapter 4.2, page 19
Similar results were found in Iowa, where corn-soybeans-corn yielded $40 per acre more than continuous corn(Duffy, 1996).
Regional differences such as climate, rainfall, and other conditions can affect farmers= decisions to rotate crops. Legumes in a rotation are most effective in humid and subhumid climates where they don=t decrease sub-soilmoisture for subsequent crops (Meisenbach, 1983; NRC,1989).
Policies and programs affecting cropping pattern useFederal Government agricultural policies influence farmers= selection of crops and choice of managementpractices. Past commodity programs that restricted base acreage to one or two crops encouraged monoculture orcontinuous planting of the same crop. To reduce this effect, the 1990 Farm Act eliminated deficiency paymentson 15 percent of participating crop base acres known as Normal Flex Acreage (NFA), regardless of the cropplanted on them (with exception of dry beans and a few fruits and vegetables). As a result, many farmers“flexed” (shifted) out of monoculture or idled the marginal acreage. The extent of flexing out varied by type ofcrop base, depending on expected relative economic return. For example, oats appeared to be the leastprofitable program crop during 1991-94 as almost half of its NFA was flexed to another crop. The 1996 FarmAct allowed 100 percent flexing, with a few exceptions, and eliminated set-aside requirements. This allowedfarmers to shift land previously dedicated to corn or cotton into other crops (usually soybeans) or rotations withother crops in response to changes in prices and loan deficiency payments (Lin et al., 2000).
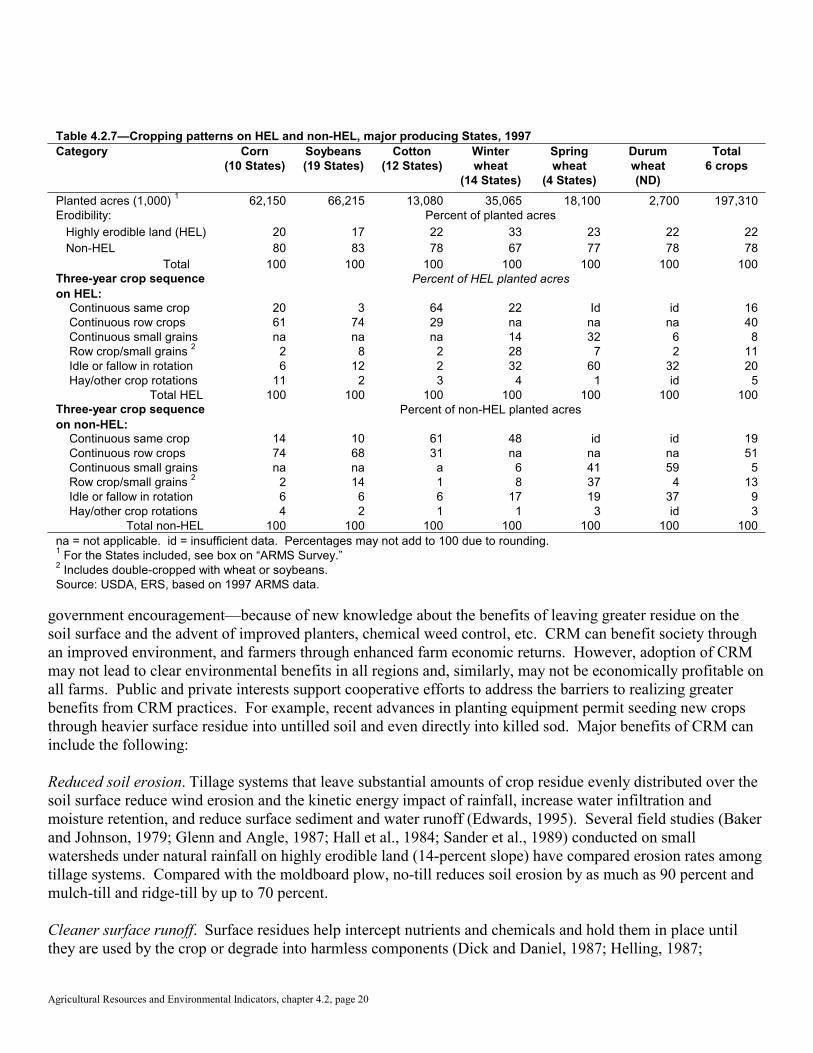
Under the 1985 and subsequent Farm Acts, highly erodible land (HEL) used for crops required implementationof a conservation plan in order to be eligible for USDA farm program benefits (see Chapter 6.3, ConservationCompliance, for more detail). Rotating the more erosive row crops with less erosive crops such as small grainsand hay or pasture, is a key part of some conservation plans for HEL, usually in combination with crop residueuse and conservation tillage (see table 6.3.3 in Chapter 6.3, Conservation Compliance). In major corn-growingStates, rotations of corn with small grains, hay, or pasture were more prevalent on HEL (13 percent) than onnon-HEL (6 percent) in 1997 (table 4.2.7). Such greater frequencies were not apparent for other major crops. More winter and spring wheat on HEL was in a rotation with fallow or idle (32 and 60 percent, respectively)than on non-HEL (17-19 percent), probably reflecting moisture conservation needs more than soil conservation.
Farmers= Use of Crop Residue Management
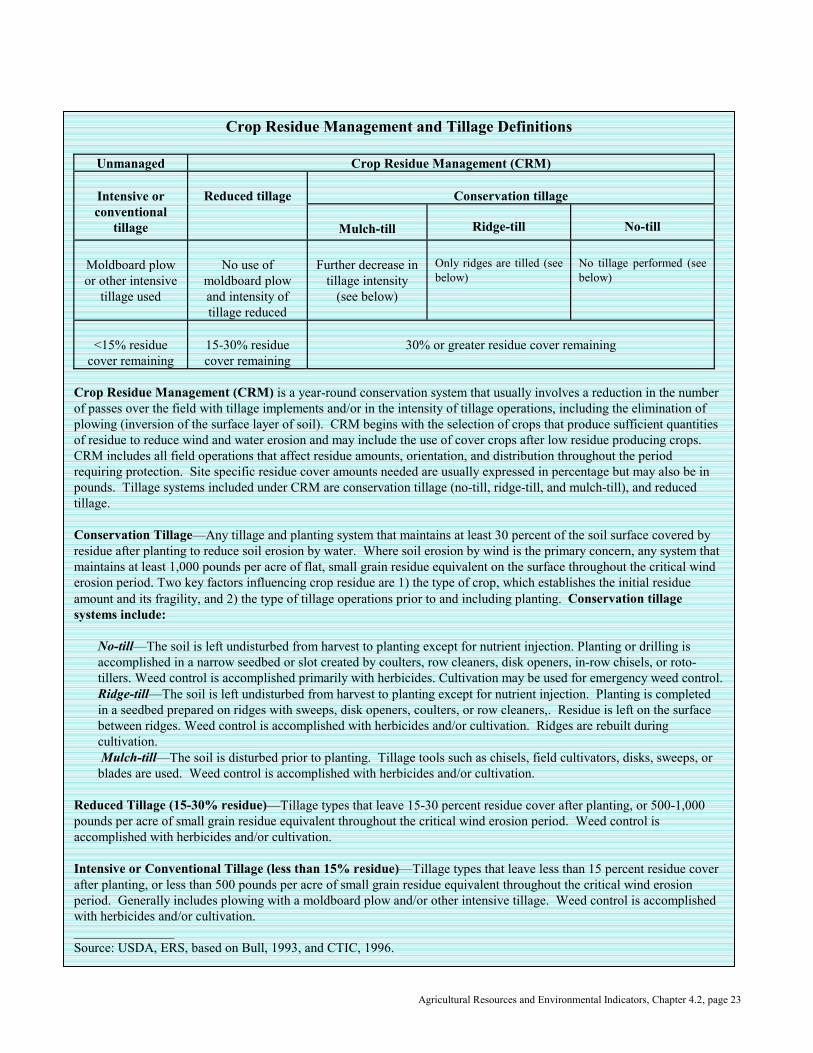
Crop residue management (CRM) maintains additional crop residue on the soil surface through fewer and/orless intensive tillage operations. CRM is generally cost-effective in protecting soil and water resources and canlead to higher farm economic returns by reducing fuel, machinery, and labor costs while maintaining orincreasing crop yields. CRM systems include reduced tillage, conservation tillage (no-till, ridge-till, and mulch-till), and the use of cover crops and other conservation practices that leave sufficient residue to protect the soilsurface from the erosive effects of wind and water (see box, "Crop Residue Management and TillageDefinitions"). This section discusses reasons for managing residue on the soil surface, describes extent of CRMuse, and reviews economic, policy, and other factors that affect CRM adoption.
Why manage residue?Historically, crop residues were removed from farm fields for livestock bedding and feed. Any residues thatremained on the soil surface after harvest were burned off to control pests, plowed under, or tilled into the soil. Culturally, some farmers take pride in having their fields "clean" of residue and intensively tilled to obtain asmooth surface in preparation for planting. More recently, farmers have adopted CRM practices—with
Agricultural Resources and Environmental Indicators, chapter 4.2, page 20
Table 4.2.7—Cropping patterns on HEL and non-HEL, major producing States, 1997Category Corn
(10 States)Soybeans(19 States)
Cotton(12 States)
Winterwheat
(14 States)
Springwheat
(4 States)
Durumwheat(ND)
Total6 crops
Planted acres (1,000) 1 62,150 66,215 13,080 35,065 18,100 2,700 197,310Erodibility: Percent of planted acres Highly erodible land (HEL) 20 17 22 33 23 22 22 Non-HEL 80 83 78 67 77 78 78 Total 100 100 100 100 100 100 100Three-year crop sequenceon HEL:
Percent of HEL planted acres
Continuous same crop 20 3 64 22 Id id 16 Continuous row crops 61 74 29 na na na 40 Continuous small grains na na na 14 32 6 8 Row crop/small grains 2 2 8 2 28 7 2 11 Idle or fallow in rotation 6 12 2 32 60 32 20 Hay/other crop rotations 11 2 3 4 1 id 5 Total HEL 100 100 100 100 100 100 100Three-year crop sequenceon non-HEL:
Percent of non-HEL planted acres
Continuous same crop 14 10 61 48 id id 19 Continuous row crops 74 68 31 na na na 51 Continuous small grains na na a 6 41 59 5 Row crop/small grains 2 2 14 1 8 37 4 13 Idle or fallow in rotation 6 6 6 17 19 37 9 Hay/other crop rotations 4 2 1 1 3 id 3 Total non-HEL 100 100 100 100 100 100 100na = not applicable. id = insufficient data. Percentages may not add to 100 due to rounding.1 For the States included, see box on “ARMS Survey.”2 Includes double-cropped with wheat or soybeans.Source: USDA, ERS, based on 1997 ARMS data.
government encouragement—because of new knowledge about the benefits of leaving greater residue on thesoil surface and the advent of improved planters, chemical weed control, etc. CRM can benefit society throughan improved environment, and farmers through enhanced farm economic returns. However, adoption of CRMmay not lead to clear environmental benefits in all regions and, similarly, may not be economically profitable onall farms. Public and private interests support cooperative efforts to address the barriers to realizing greaterbenefits from CRM practices. For example, recent advances in planting equipment permit seeding new cropsthrough heavier surface residue into untilled soil and even directly into killed sod. Major benefits of CRM caninclude the following:
Reduced soil erosion. Tillage systems that leave substantial amounts of crop residue evenly distributed over thesoil surface reduce wind erosion and the kinetic energy impact of rainfall, increase water infiltration andmoisture retention, and reduce surface sediment and water runoff (Edwards, 1995). Several field studies (Bakerand Johnson, 1979; Glenn and Angle, 1987; Hall et al., 1984; Sander et al., 1989) conducted on smallwatersheds under natural rainfall on highly erodible land (14-percent slope) have compared erosion rates amongtillage systems. Compared with the moldboard plow, no-till reduces soil erosion by as much as 90 percent andmulch-till and ridge-till by up to 70 percent.
Cleaner surface runoff. Surface residues help intercept nutrients and chemicals and hold them in place untilthey are used by the crop or degrade into harmless components (Dick and Daniel, 1987; Helling, 1987;

Agricultural Resources and Environmental Indicators, Chapter 4.2, page 21
Wagenet, 1987). Increased organic matter in the top layer of soil results in cleaner runoff by reducingcontaminants such as sediment and adsorbed or dissolved chemicals, and thus benefits water quality in lakes andstreams (Onstad and Voorhees, 1987; CTIC, 1996). Studies under field conditions indicate that while thequantity of water runoff from no-till fields was variable depending on the frequency and intensity of rainfall,clean-tilled soil surfaces produce substantially more runoff (Edwards, 1995). Runoff from no-till and mulch-tillfields averaged about 30 and 40 percent of the amounts from moldboard-plowed fields (Baker and Johnson,1979; Glenn and Angle, 1987; Hall et al., 1984; Sander et al., 1989). Average herbicide runoff losses fromtreated fields with no-till and mulch-till systems for all products and all years were about 30 percent of therunoff levels from moldboard-plowed fields (Fawcett et al., 1994). Under normal production conditions, thepresence of increased crop residue reduces the volume of contaminants associated with runoff to surface watersby constraining sediment losses and enhancing infiltration (Edwards, 1995; Fawcett, 1987).
Higher Soil Moisture and Water Infiltration. Crop residues on the soil surface slow water runoff by creatingtiny dams, reducing surface crust formation, and enhancing infiltration (Edwards, 1995). The channels(macropores) created by earthworms and old plant roots, when left intact with no-till, improve infiltration tohelp reduce or eliminate field runoff. This raises the prospect of increased water infiltration carryingagricultural chemicals into the groundwater in specific situations (see box, AEffects of CRM on GroundwaterQuality@). Combined with reduced water evaporation from the top few inches of soil and with improved soilcharacteristics, the higher level of soil moisture can contribute to higher crop yields in many cropping andclimatic situations (CTIC, 1996). However, in some areas, soil moisture levels can also be too high for optimalcrop growth or leave soils too cool and wet at planting time, thereby reducing yields.
Improved long-term soil productivity. Less intensive tillage reduces breakdown of crop residue and loss of soilorganic matter. Also with less tilling, net carbon sequestration may improve to build soil organic matter,enhance biological (including earthworm) activity, and maintain long-term productivity. Conservation tillage,particularly no-till, improves soil structure by increasing soil particle aggregation (small soil clumps), aidingwater movement through the soil so plants expend less energy to establish roots. No-till also reduces soilcompaction through fewer trips over the field and reduced weight and horsepower requirements (CTIC, 1996).
Reduced release of carbon dioxide and air pollution. Intensive tillage contributes to the conversion of soilcarbon to carbon dioxide, which in the atmosphere can combine or react with other gases to affect globalwarming (Pretty et al., 2000). Increased crop residue and reduced tillage enhance the level of naturallyoccurring carbon in the soil and may contribute to lower carbon dioxide emissions (Lal, et al., 1998). Inaddition, CRM requires fewer trips across the field and less horsepower, which reduces fossil fuel emissions.Crop residues reduce wind erosion and the generation of dust-caused air pollution (CTIC, 1996).
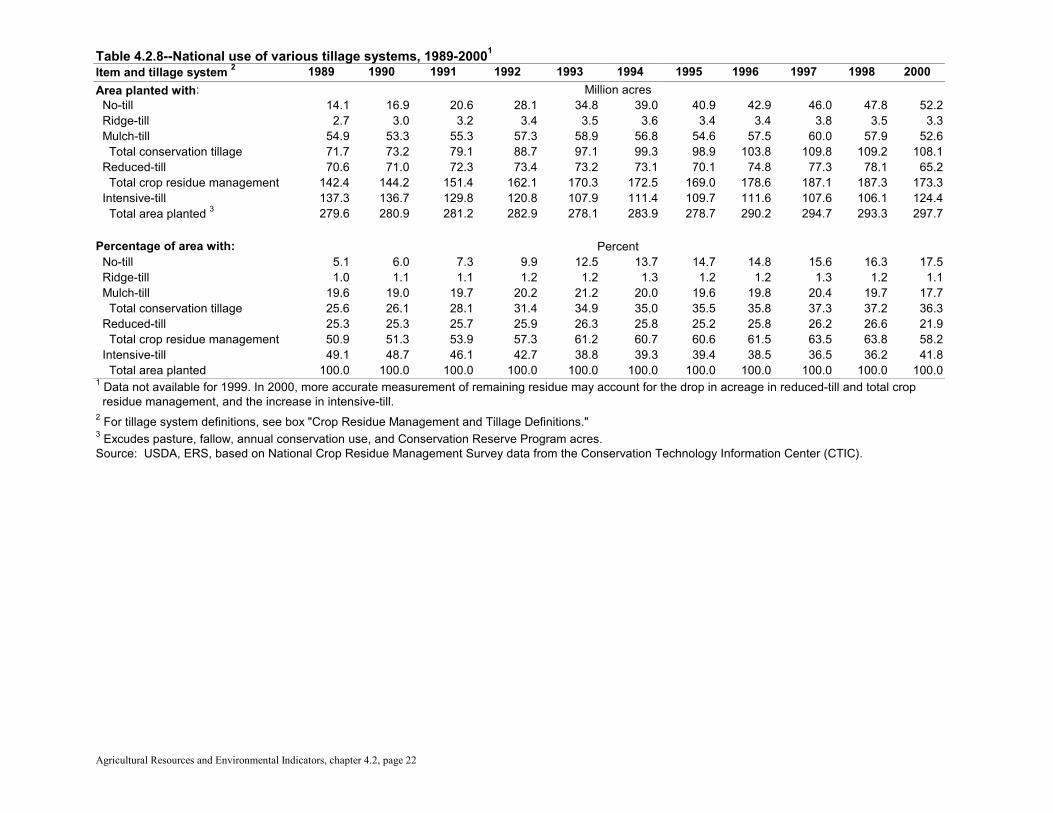
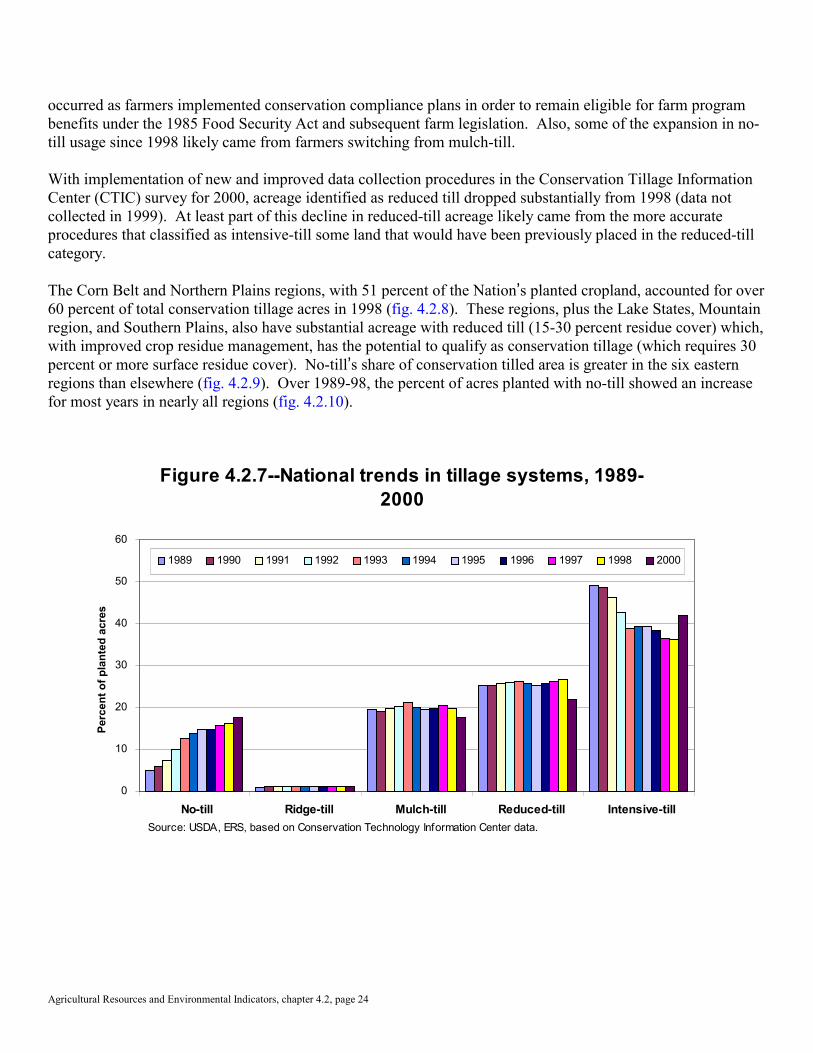
National and regional CRM useAccording to the CTIC National Crop Residue Management Survey, U.S. farmers practiced CRM on about 173million acres in 2000, or 58 percent of planted acreage, up from 142 million acres in 1989 (table 4.2.8). Theconservation tillage component of CRM accounted for 36 percent of U.S. planted crop acreage in 2000,compared with 26 percent in 1989. Most of the growth in conservation tillage since 1989 has come fromexpanded adoption of no-till (fig. 4.2.7), which can leave as much as 70 percent or more of the soil surfacecovered with crop residue. U.S. crop area planted with no-till more than tripled from 14 to 52 million acresbetween 1989 and 2000, increasing from 5 to over 17 percent of planted acres. Some of the rise in no-till use
Agricultural Resources and Environmental Indicators, chapter 4.2, page 22
Table 4.2.8--National use of various tillage systems, 1989-20001
Item and tillage system 2 1989 1990 1991 1992 1993 1994 1995 1996 1997 1998 2000Area planted with: Million acres No-till 14.1 16.9 20.6 28.1 34.8 39.0 40.9 42.9 46.0 47.8 52.2 Ridge-till 2.7 3.0 3.2 3.4 3.5 3.6 3.4 3.4 3.8 3.5 3.3 Mulch-till 54.9 53.3 55.3 57.3 58.9 56.8 54.6 57.5 60.0 57.9 52.6 Total conservation tillage 71.7 73.2 79.1 88.7 97.1 99.3 98.9 103.8 109.8 109.2 108.1 Reduced-till 70.6 71.0 72.3 73.4 73.2 73.1 70.1 74.8 77.3 78.1 65.2 Total crop residue management 142.4 144.2 151.4 162.1 170.3 172.5 169.0 178.6 187.1 187.3 173.3 Intensive-till 137.3 136.7 129.8 120.8 107.9 111.4 109.7 111.6 107.6 106.1 124.4 Total area planted 3 279.6 280.9 281.2 282.9 278.1 283.9 278.7 290.2 294.7 293.3 297.7
Percentage of area with: Percent No-till 5.1 6.0 7.3 9.9 12.5 13.7 14.7 14.8 15.6 16.3 17.5 Ridge-till 1.0 1.1 1.1 1.2 1.2 1.3 1.2 1.2 1.3 1.2 1.1 Mulch-till 19.6 19.0 19.7 20.2 21.2 20.0 19.6 19.8 20.4 19.7 17.7 Total conservation tillage 25.6 26.1 28.1 31.4 34.9 35.0 35.5 35.8 37.3 37.2 36.3 Reduced-till 25.3 25.3 25.7 25.9 26.3 25.8 25.2 25.8 26.2 26.6 21.9 Total crop residue management 50.9 51.3 53.9 57.3 61.2 60.7 60.6 61.5 63.5 63.8 58.2 Intensive-till 49.1 48.7 46.1 42.7 38.8 39.3 39.4 38.5 36.5 36.2 41.8 Total area planted 100.0 100.0 100.0 100.0 100.0 100.0 100.0 100.0 100.0 100.0 100.01 Data not available for 1999. In 2000, more accurate measurement of remaining residue may account for the drop in acreage in reduced-till and total crop residue management, and the increase in intensive-till.2 For tillage system definitions, see box "Crop Residue Management and Tillage Definitions."3 Excudes pasture, fallow, annual conservation use, and Conservation Reserve Program acres.Source: USDA, ERS, based on National Crop Residue Management Survey data from the Conservation Technology Information Center (CTIC).
Agricultural Resources and Environmental Indicators, Chapter 4.2, page 23
Crop Residue Management and Tillage Definitions
Unmanaged Crop Residue Management (CRM)
Conservation tillageIntensive orconventional
tillage
Reduced tillage
Mulch-till Ridge-till No-till
Moldboard plowor other intensive
tillage used
No use ofmoldboard plowand intensity oftillage reduced
Further decrease intillage intensity
(see below)
Only ridges are tilled (seebelow)
No tillage performed (seebelow)
<15% residuecover remaining
15-30% residuecover remaining
30% or greater residue cover remaining
Crop Residue Management (CRM) is a year-round conservation system that usually involves a reduction in the numberof passes over the field with tillage implements and/or in the intensity of tillage operations, including the elimination ofplowing (inversion of the surface layer of soil). CRM begins with the selection of crops that produce sufficient quantitiesof residue to reduce wind and water erosion and may include the use of cover crops after low residue producing crops. CRM includes all field operations that affect residue amounts, orientation, and distribution throughout the periodrequiring protection. Site specific residue cover amounts needed are usually expressed in percentage but may also be inpounds. Tillage systems included under CRM are conservation tillage (no-till, ridge-till, and mulch-till), and reducedtillage.
Conservation Tillage—Any tillage and planting system that maintains at least 30 percent of the soil surface covered byresidue after planting to reduce soil erosion by water. Where soil erosion by wind is the primary concern, any system thatmaintains at least 1,000 pounds per acre of flat, small grain residue equivalent on the surface throughout the critical winderosion period. Two key factors influencing crop residue are 1) the type of crop, which establishes the initial residueamount and its fragility, and 2) the type of tillage operations prior to and including planting. Conservation tillagesystems include:
No-till—The soil is left undisturbed from harvest to planting except for nutrient injection. Planting or drilling isaccomplished in a narrow seedbed or slot created by coulters, row cleaners, disk openers, in-row chisels, or roto-tillers. Weed control is accomplished primarily with herbicides. Cultivation may be used for emergency weed control.Ridge-till—The soil is left undisturbed from harvest to planting except for nutrient injection. Planting is completedin a seedbed prepared on ridges with sweeps, disk openers, coulters, or row cleaners,. Residue is left on the surfacebetween ridges. Weed control is accomplished with herbicides and/or cultivation. Ridges are rebuilt duringcultivation. Mulch-till—The soil is disturbed prior to planting. Tillage tools such as chisels, field cultivators, disks, sweeps, orblades are used. Weed control is accomplished with herbicides and/or cultivation.
Reduced Tillage (15-30% residue)—Tillage types that leave 15-30 percent residue cover after planting, or 500-1,000pounds per acre of small grain residue equivalent throughout the critical wind erosion period. Weed control isaccomplished with herbicides and/or cultivation.
Intensive or Conventional Tillage (less than 15% residue)—Tillage types that leave less than 15 percent residue coverafter planting, or less than 500 pounds per acre of small grain residue equivalent throughout the critical wind erosionperiod. Generally includes plowing with a moldboard plow and/or other intensive tillage. Weed control is accomplishedwith herbicides and/or cultivation._______________Source: USDA, ERS, based on Bull, 1993, and CTIC, 1996.
Agricultural Resources and Environmental Indicators, chapter 4.2, page 24
occurred as farmers implemented conservation compliance plans in order to remain eligible for farm programbenefits under the 1985 Food Security Act and subsequent farm legislation. Also, some of the expansion in no-till usage since 1998 likely came from farmers switching from mulch-till.
With implementation of new and improved data collection procedures in the Conservation Tillage InformationCenter (CTIC) survey for 2000, acreage identified as reduced till dropped substantially from 1998 (data notcollected in 1999). At least part of this decline in reduced-till acreage likely came from the more accurateprocedures that classified as intensive-till some land that would have been previously placed in the reduced-tillcategory.
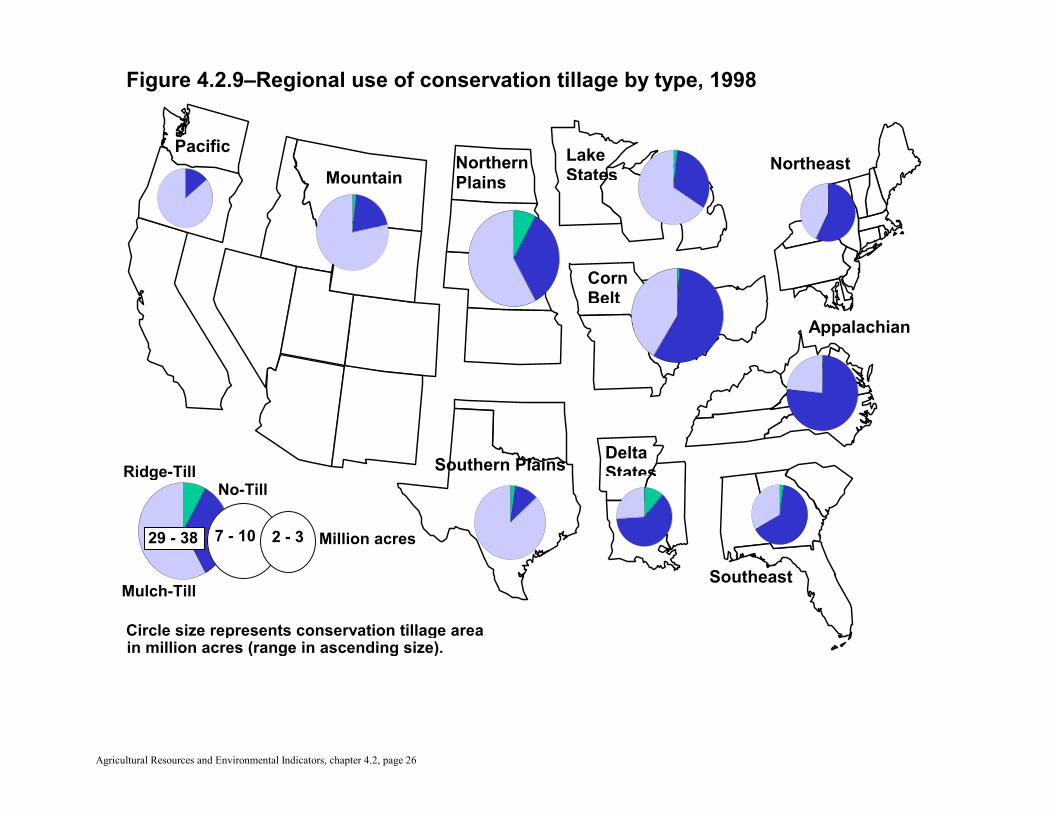
The Corn Belt and Northern Plains regions, with 51 percent of the Nation=s planted cropland, accounted for over60 percent of total conservation tillage acres in 1998 (fig. 4.2.8). These regions, plus the Lake States, Mountainregion, and Southern Plains, also have substantial acreage with reduced till (15-30 percent residue cover) which,with improved crop residue management, has the potential to qualify as conservation tillage (which requires 30percent or more surface residue cover). No-till=s share of conservation tilled area is greater in the six easternregions than elsewhere (fig. 4.2.9). Over 1989-98, the percent of acres planted with no-till showed an increasefor most years in nearly all regions (fig. 4.2.10).
Figure 4.2.7--National trends in tillage systems, 1989-2000
0
10
20
30
40
50
60
No-till Ridge-till Mulch-till Reduced-till Intensive-till
Perc
ent o
f pla
nted
acr
es
1989 1990 1991 1992 1993 1994 1995 1996 1997 1998 2000
Source: USDA, ERS, based on Conservation Technology Information Center data.

Agricultural Resources and Environmental Indicators, Chapter 4.2, page 25
Pacific
Mountain
NorthernPlains
LakeStates
CornBelt
Northeast
Appalachian
Southeast
Southern PlainsDeltaStates
Figure 4.2.8–Regional use of tillage systems, 1998
Reduced tillage
Conservation tillage
Intensive tillage
Million acres planted
Source: USDA, ERS, based on Conservation Technology Information Center data.
3
1
2
2
1
18
1
79
1
7 86
7
2
6
31
4
3 4
9
3 3
6
2 25
Agricultural Resources and Environmental Indicators, chapter 4.2, page 26
Pacific
MountainNorthernPlains
LakeStates
CornBelt
Northeast
Appalachian
Southeast
Southern Plains DeltaStates
7 - 10 2 - 3
Ridge-TillNo-Till
Mulch-Till
29 - 38 Million acres
Circle size represents conservation tillage areain million acres (range in ascending size).
Figure 4.2.9–Regional use of conservation tillage by type, 1998

Agricultural Resources and Environmental Indicators, Chapter 4.2, page 27
Figure 4.2.10--Conservation tillage adoption by Farm Production Region, 1989-98
0 10 20 30 40 50 60
Percent of acres planted
No-till Ridge-till Mulch-till
Corn Belt
Northern Plains
Lake States
Mountain States
Southern Plains
1989
1998

Agricultural Resources and Environmental Indicators, chapter 4.2, page 28
0 10 20 30 40 50 60
Percent of acres planted
Appalachian
Northeast
Delta States
Pacific
Southeast
Source: USDA, ERS, based on CTIC
1989
1998
Agricultural Resources and Environmental Indicators, Chapter 4.2, page 29
Effects of CRM on Groundwater Quality
Greater infiltration of water under crop residue management (CRM) raises concerns about whether there are greateradverse effects on groundwater than with intensive tillage. The issue continues to be researched, but the difficulty oftracking a pesticide once it has been applied complicates attempts to find an answer. While conservation tillage systemscan change weed and insect problems and the kinds of herbicides and insecticides used, average pounds of pesticidesapplied does not change greatly when farmers convert to conservation tillage (Fawcett, 1987; Fawcett et al., 1994;Hanthorn and Duffy, 1983). Analyses of tillage systems generally conclude that appropriate conservation tillage systemsare no more likely to degrade water quality through chemical contamination than are intensive or conventional tillagesystems, and do not increase the risk of undesirable impacts from pesticides on human health and aquatic life (Baker,1980; Baker, 1987; Baker et al., 1987; Baker and Laflen, 1979; Edwards et al., 1993; Fawcett et al., 1994; Melvin, 1995;Wagenet, 1987). For a specific site, the effects depend on a complex set of factors besides the infiltration rate, includingproperties of the chemicals applied, quantities applied, timing of application, method of application, and a variety of sitespecific factors (climatic, hydrologic, geologic, soil, and topographic) (Onstad and Voorhees, 1987; Wagenet, 1987). Also, one has to consider what the cropping pattern and chemical use would be in the absence of CRM. In any situation,some of the factors may contribute to lesser effect and others to greater effect, with detailed analysis required to determinethe net result. Some observations on these factors follow.
The potential for higher infiltration with conservation tillage creates an opportunity for groundwater degradation in somecircumstances, such as for highly permeable sandy soils over shallow groundwater aquifers (Baker, 1987; CTIC, 1996;Wauchope, 1987). However, increased infiltration also normally dilutes the concentration of contaminants in thepercolate to ground water (Bengtson et al., 1989; USDA, ERS, 1993).
A recent report reviews and summarizes the findings of more than 30 North American studies of pesticide transport intosubsurface agricultural drains (Kladivko and Brown, 2001). The presence of a subsurface drainage system generallyincreases the volume of infiltration and consequently decreases the volume of surface runoff water and sedimentcompared to similar soils where subsurface drainage systems are not installed. These findings suggest that whenconsidering pesticide contamination of surface waters, the highest priority should be placed on managing surface pesticiderunoff. The evidence indicates that surface runoff contributions are usually the most significant of the pesticide inputs tosurface water, with subsurface drains adding relatively small amounts. The presence of subsurface drainage decreasessurface runoff losses of sorbed compounds such as pesticides, because of lower runoff volumes and often also because oflower concentrations in the runoff resulting from the delayed initiation of runoff. Pesticide concentrations and mass lossesare usually much lower in subsurface drainage than in surface runoff, often by an order of magnitude. However, increasedinfiltration has the potential to increase losses of more mobile compounds such as nitrate-nitrogen through subsurfacedrainage system discharge water.
Management practices involving tillage systems or crop rotations appear to have only minor impact on the concentrationsand losses of pesticides in tile drainflow (Kladivko and Brown, 2001). Rainfall timing, duration, intensity, and volumesrelative to pesticide application timing and amount, in combination with soil type, seem to be the most important factors indetermining pesticide transport to subsurface drains. In the medium- and fine-textured soils where subsurface drainage iscommon, the dominant mechanism for pesticide transport to the drain tiles is most likely preferential flow duringrainfall/drainage events occurring soon after pesticide application. The longer-term studies show that concentrations andmass losses in subsurface drains are highly variable from year to year, depending on weather patterns.
The fate of applied chemicals is particularly dependent on the respective properties of the active ingredients, such as theiradsorption, persistence, solubility, and volatility (Dick and Daniel, 1987; Fawcett, 1987; Melvin, 1995; Wauchope et al.,1992). Chemicals with high water solubility and low adsorption characteristics are highly mobile and possess thepotential for loss through surface runoff or subsurface drainage (leachate) (Moldenhauer et al., 1995; USDA, ERS, 1993).(continued)
Agricultural Resources and Environmental Indicators, chapter 4.2, page 30
Effects of CRM on Groundwater Quality (continued)
Pesticides that are strongly adsorbed to soil, sediment particles, or organic matter are protected from chemical orbiological degradation and volatilization while adsorbed to these materials. Pesticides that are tightly held will not readilyleach to ground water and will be found in surface-water runoff only under erosive conditions where the particles to whichthey are attached are washed off the fields. The soil adsorption property is a major factor affecting the pollution potentialof a particular pesticide (Melvin, 1995; Wauchope et al., 1992; Weber and Warren, 1993).
The behavior of chemical compounds in the environment is also influenced by the application method. For example,whether a pesticide is applied to foliage or the soil or is incorporated into the soil makes a big difference in how easily theapplication deposits can be dislodged by rain, and thus leached into the soil or transported in surface runoff. Soilincorporation physically lowers the susceptibility of a pesticide to volatilization and thereby increases its persistence(Wauchope et al., 1992).
Early pre-plant (EPP) herbicides are applied several weeks or months prior to crop planting. Their advantages includeprevention of weed establishment, elimination of the need for burndown treatments at planting, reduction in the potentialfor herbicide carryover from one crop season to the next, and the spreading out of labor related to planting. However,there are disadvantages to EPP herbicides particularly on sloping or highly erodible cropland. Occasional heavy rains onunprotected sloping fields can cause soil erosion and high rates of surface runoff even with no-till systems, and chemicals(attached to soil particles or dissolved in runoff water) could enter waterways. Use of EPP herbicides should be avoidedon sandy soils or other soil types with high leaching potential (CTIC, 1996). Pre-plant/pre-emergence herbicides dependon rainfall to trigger the active ingredients soon after application. Once in the soil, they must be mobile and persistent fora sufficient period of time to make contact with and destroy weed seedlings throughout the expected weed germinationperiod. These enhanced mobility and persistence properties also facilitate the migration of such chemicals in theenvironment through surface-water runoff or percolation to ground water.
Burndown herbicides, more important in no-till systems, are nonselective and are used before or just after planting butprior to crop emergence. Post-emergence herbicides are successful in controlling problem weeds or escapees well into thegrowing season without damaging the crop or reducing yield potential and are generally unaffected by soil type or amountof crop residue on the surface. However, post-emergent application does depend on proper timing and correctidentification of the target weeds. Post-emergence and burndown herbicides frequently have short-lived or no residualsoil effects (CTIC, 1996). They are generally less mobile and less persistent than pre-emergence herbicides and,therefore, less likely to migrate from their target. Pesticides applied to plant foliage, for instance, leave pesticide depositsthat are highly vulnerable to photolysis and other degradation processes that reduce persistence and the potential for waterpollution (Wauchope et al., 1992). For example, glyphosate and paraquat, although highly soluble, are strongly adsorbedto the targeted material or the soil and rapidly converted to relatively harmless degradation products that reduce theirpotential for contaminating ground water (Melvin, 1995; Moldenhauer et al., 1995).
The difference in chemical properties among classes of herbicides is important when considering the environmentalimpacts of herbicide use among tillage systems. Tillage systems that employ herbicides with lower mobility and shorterpersistence are preferable from a water-quality standpoint to tillage systems that require herbicides with greater mobilityand longer persistence (Melvin, 1995; Wauchope et al., 1992).
The inherent toxicity of the active ingredients and their degradation, the impact of these products on nontarget species,and their mobility and persistence in soil and water determine their relative impact on the environment. In addition, aspecific active ingredient can be converted by environmental processes including hydrolysis, photolysis, and otherprocesses into an important degradation product with different chemical properties (Wauchope et al., 1992). Tillagesystems employing newer pesticides that are highly toxic to targeted species but are used at much lower rates may be moreenvironmentally desirable. For a given chemical, the amount of active ingredient being dissipated into the environment isgenerally proportionate to the amount applied; as a result, lower application rates translate into reduced exposure ofnontarget species to the side effects of these chemicals (Wauchope et al., 1992).

Agricultural Resources and Environmental Indicators, Chapter 4.2, page 31
CRM use on major cropsFarmers apply conservation tillage mainly to corn, soybeans, and small grains. CTIC data for 2000, whichinclude all States, show that over 56 percent of the soybean acreage, 36 percent of the corn, and 30 percent ofthe small grains were conservation-tilled (table 4.2.9). This contrasts with only 12 percent of cotton acreage. Also, the CTIC data indicate that use of no-till has expanded more rapidly than other forms of conservationtillage for all four crops (fig. 4.2.11). Sandretto and Bull (1996) found that conservation tillage was usedrelatively more on double-cropped fields than on single-cropped fields. The use of no-till with double-croppingfacilitates getting the second crop planted quickly and limits potential moisture losses from the germinationzone in the seedbed, allowing greater flexibility in cropping sequence or rotation.
No-till
Ridge-till
Mulch-till
Reduced-till
Intensive-till
Corn
0102030405060708090
100
1989
1990
1991
1992
1993
1994
1995
1996
1997
1998
2000
Soybeans
0102030405060708090
100
1989
1990
1991
1992
1993
1994
1995
1996
1997
1998
2000
Small grains
0102030405060708090
100
1989
1990
1991
1992
1993
1994
1995
1996
1997
1998
2000
Cotton
0102030405060708090
100
1989
1990
1991
1992
1993
1994
1995
1996
1997
1998
2000
Figure 4.2.11--Tillage trends on major crops

Agricultural Resources and Environmental Indicators, chapter 4.2, page 32
Other sources of data on CRM use on major crops are the 1988-95 Cropping Practices Surveys (CPS) and 1996-99 Agricultural Resource Management Study (ARMS). These surveys provide more detailed data than doesCTIC on residue levels and tillage systems, but only for the major producing States (for more discussion ofthese surveys, see Appendix: Agricultural Resource Surveys and Data). The advantages of the CPS and ARMSfor analysis of CRM come from linking CRM practices to other relevant details about the farm productionsystem, such as the type of tillage equipment used, the number of trips made over a field, and farm chemicaluse. These annual surveys of major producing States indicate a decline in the use of the moldboard plow andother intensive tillage systems and an increase in the use of all types of conservation tillage for most of themajor field crops. Only 11 percent or less of the surveyed area in any major field crop was moldboard plowedin 1997-99, down from 22 percent in 1988 (table 4.2.10). The reduction in use of the moldboard plow and theincrease in CRM use resulted in average residue levels after planting increasing for all major crops.
Economic incentives for CRM adoption The trend toward adoption of conservation tillage and a corresponding decline in intensive tillage has beenstimulated by the prospect of higher economic returns with conservation tillage and by public policies andprograms promoting conservation tillage for its conservation benefits. Higher economic returns with CRMresult primarily from increased or stable crop yields and an overall reduction in input costs, with both heavilydependent on characteristics of the resource base and appropriate management (Clark et al., 1994).
Differences in yield. Yield response with soil-conserving tillage systems varies with location, site-specific soilcharacteristics, climate, cropping patterns, and level of management skills. In general, long-term field trials onwell-drained to moderately well-drained soils or on sloping land show slightly higher no-till yields, particularlywith crop rotations, compared with intensive tillage (Hudson and Bradley, 1995; CTIC, 1996). Experienced no-till farmers claim greater yields from increased infiltration and improved soil properties such as reduced erosionand soil compaction, increased soil organic matter and earthworm activity, and improved soil structure in 4-7years from when the system becomes established (CTIC, 1996). A mulch-till system may be more appropriatewhere soil characteristics vary greatly within a field, where pre-plant incorporated herbicides are used for weedcontrol, or where equipment or management limitations preclude the use of no-till or ridge-till (CTIC, 1996).
The benefits from improved moisture retention in the root zone—that derive from reduced water runoff,increased infiltration, and suppressed evaporation from the soil surface—usually increase crop yields, especiallyunder dry conditions. In some areas of the northern Great Plains, these benefits permit a change in the croppingpattern to reduce the frequency of moisture-conserving fallow periods (Clark et al., 1994). Increased cropresidue on the soil surface tends to keep soils cooler, wetter, and less aerated (Mengel et al., 1992). Thesecharacteristics under cool, wet planting conditions, especially in some Northern States, have been blamed fordelayed plantings, uneven stands, and lower corn yields (Griffith et al., 1988). However, with hot, dry weatherlater in the growing season, the effects of increased organic matter, improved moisture retention andpermeability, and reduced nutrient losses from erosion all benefit crop yields.
The crop grown in the previous year can have a great influence on the success of conservation tillage systems,especially no-till. The kind, amount, and distribution of previous crop residue can influence soil temperature,seed germination, and early growth. Lower seed germination and lack of early growth sometimes result due toplacing seed under or near decaying residue from the same crop or a closely related species (Griffith et al., 1992;CTIC, 1996). No-till, mulch-till, and even intensive tillage systems are more likely to be successful with croprotation than with monoculture. Ridge-till is best suited to row crops, and therefore is often used withmonoculture (Bull and Sandretto, 1995).

Agricultural Resources and Environmental Indicators, Chapter 4.2, page 33
Table 4.2.9—Tillage systems used on major crops, contiguous 48 States, 1989-2000Crop and year1 No-till Ridge-till Mulch-till Reduced-till Intensive-till
PercentCorn
1989 7.4 2.4 22.4 24.6 43.21990 8.7 2.6 21.0 24.4 43.31991 10.2 2.8 21.9 25.1 40.11992 13.8 2.8 22.3 25.1 35.91993 17.1 3.1 23.2 25.0 31.61994 18.2 3.1 19.3 23.1 36.41995 18.1 3.1 20.1 22.6 36.21996 17.0 3.0 20.3 24.3 35.51997 17.5 3.1 20.9 24.2 34.31998 16.6 2.9 19.5 25.0 36.02000 17.9 2.1 16.5 23.2 40.3
Soybeans1989 7.7 1.2 20.7 24.5 45.91990 9.6 1.4 19.4 24.2 45.41991 12.6 1.4 19.8 25.1 41.11992 18.5 1.4 21.5 23.2 35.51993 24.7 1.3 22.7 21.7 29.51994 27.2 1.2 19.8 21.7 30.11995 30.0 1.0 19.4 20.8 28.81996 29.7 0.8 20.2 20.3 28.91997 30.5 1.0 22.1 20.2 26.21998 31.9 0.9 21.3 21.4 24.62000 32.8 0.9 22.4 18.8 25.1
Small Grains1989 2.6 0.0 21.6 30.0 45.81990 3.0 0.0 21.4 30.4 45.11991 3.7 0.0 22.9 30.9 42.41992 4.1 0.0 23.0 32.3 40.51993 5.0 0.0 24.2 34.0 36.81994 5.5 0.1 25.3 34.2 34.91995 6.6 0.0 24.6 33.7 35.01996 7.5 0.0 24.0 34.1 34.41997 8.3 0.1 23.8 35.0 32.91998 8.9 0.1 23.5 34.7 32.82000 9.8 0.1 20.5 27.1 42.5
Cotton1989 0.2 0.1 2.9 6.5 90.31990 0.4 0.4 4.0 8.0 87.21991 0.7 0.6 4.8 7.6 86.21992 2.0 0.7 4.9 8.3 84.01993 2.6 0.8 6.7 10.8 79.21994 3.2 1.2 6.3 11.8 77.51995 3.4 1.4 5.1 11.6 78.41996 3.4 1.4 5.4 11.5 78.21997 3.7 2.0 4.1 11.8 78.51998 4.9 2.2 5.3 13.1 74.52000 8.0 2.2 2.2 9.7 77.9
Numbers may not add due to rounding. 1 No data were gathered in 1999Source: USDA, ERS, based on CTIC data.
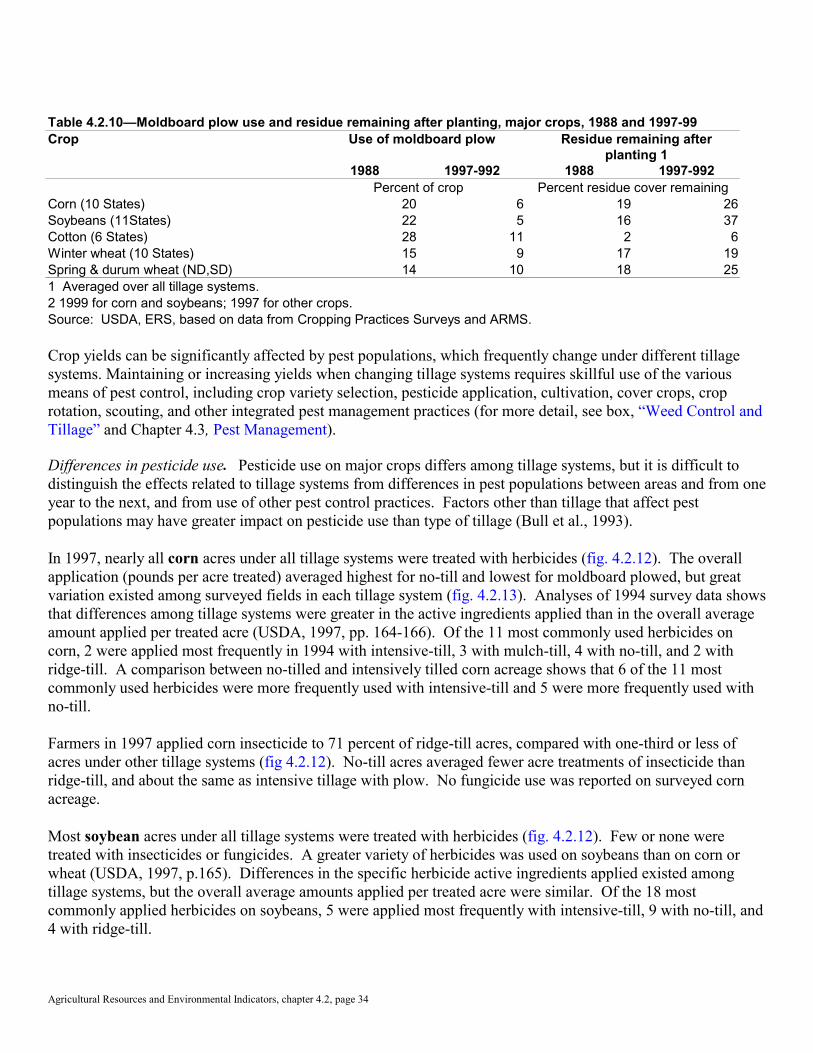
Agricultural Resources and Environmental Indicators, chapter 4.2, page 34
Table 4.2.10—Moldboard plow use and residue remaining after planting, major crops, 1988 and 1997-99Use of moldboard plow Residue remaining after
planting 1Crop
1988 1997-992 1988 1997-992Percent of crop Percent residue cover remaining
Corn (10 States) 20 6 19 26Soybeans (11States) 22 5 16 37Cotton (6 States) 28 11 2 6Winter wheat (10 States) 15 9 17 19Spring & durum wheat (ND,SD) 14 10 18 251 Averaged over all tillage systems. 2 1999 for corn and soybeans; 1997 for other crops.Source: USDA, ERS, based on data from Cropping Practices Surveys and ARMS.
Crop yields can be significantly affected by pest populations, which frequently change under different tillagesystems. Maintaining or increasing yields when changing tillage systems requires skillful use of the variousmeans of pest control, including crop variety selection, pesticide application, cultivation, cover crops, croprotation, scouting, and other integrated pest management practices (for more detail, see box, “Weed Control andTillage” and Chapter 4.3, Pest Management).
Differences in pesticide use. Pesticide use on major crops differs among tillage systems, but it is difficult todistinguish the effects related to tillage systems from differences in pest populations between areas and from oneyear to the next, and from use of other pest control practices. Factors other than tillage that affect pestpopulations may have greater impact on pesticide use than type of tillage (Bull et al., 1993).
In 1997, nearly all corn acres under all tillage systems were treated with herbicides (fig. 4.2.12). The overallapplication (pounds per acre treated) averaged highest for no-till and lowest for moldboard plowed, but greatvariation existed among surveyed fields in each tillage system (fig. 4.2.13). Analyses of 1994 survey data showsthat differences among tillage systems were greater in the active ingredients applied than in the overall averageamount applied per treated acre (USDA, 1997, pp. 164-166). Of the 11 most commonly used herbicides oncorn, 2 were applied most frequently in 1994 with intensive-till, 3 with mulch-till, 4 with no-till, and 2 withridge-till. A comparison between no-tilled and intensively tilled corn acreage shows that 6 of the 11 mostcommonly used herbicides were more frequently used with intensive-till and 5 were more frequently used withno-till.
Farmers in 1997 applied corn insecticide to 71 percent of ridge-till acres, compared with one-third or less ofacres under other tillage systems (fig 4.2.12). No-till acres averaged fewer acre treatments of insecticide thanridge-till, and about the same as intensive tillage with plow. No fungicide use was reported on surveyed cornacreage.
Most soybean acres under all tillage systems were treated with herbicides (fig. 4.2.12). Few or none weretreated with insecticides or fungicides. A greater variety of herbicides was used on soybeans than on corn orwheat (USDA, 1997, p.165). Differences in the specific herbicide active ingredients applied existed amongtillage systems, but the overall average amounts applied per treated acre were similar. Of the 18 mostcommonly applied herbicides on soybeans, 5 were applied most frequently with intensive-till, 9 with no-till, and4 with ridge-till.

Agricultural Resources and Environmental Indicators, Chapter 4.2, page 35
A smaller share of wheat acreage than corn or soybeans in 1997 was treated with herbicides, ranging down from71 percent of no-till acreage to 53 percent of acres intensively tilled with plow (fig. 4.2.12). Also the averageamount of herbicide applied per treated acre was lower for wheat than for corn or soybeans. Application ratesaveraged higher on mulch-till and no-till acres than on land intensively tilled with plow (fig. 4.2.13).
94
95
97
100
100
14
32
33
20
71
93
97
97
98
100
53
63
66
71
0 50 100 150
Corn herbicideIntensive-till with plow
Intensive-till without plow
Mulch till
No-till
Ridge-till
Corn insecticideIntensive-till with plow
Intensive-till without plow
Mulch till
No-till
Ridge-till
Soybean InsecticideIntensive-till with plow
Intensive-till without plow
Mulch till
No-till
Ridge-till
Wheat herbicideIntensive-till with plow
Intensive-till without plow
Mulch till
No-till
Figure 4.2.12 Pesticide use by tillage system, 1997
Source: USDA, ERS, 1997 ARMS, and Padgitt (2000)
2.4
2.7
2.9
3.0
2.9
1.1
1.3
1.3
1.1
1.7
2.6
2.8
2.6
3.4
2.9
2.6
2.5
2.8
2.6
0 2 4
Average number of pesticidetreatments per acre
Percent of crop acres treated

Agricultural Resources and Environmental Indicators, chapter 4.2, page 36
Impacts on production costs. Choice of tillage system affects machinery, chemical, fuel, and labor costs. Ingeneral, decreasing the intensity of tillage or reducing the number of operations results in lower machinery, fuel,and labor costs. These cost savings may be offset somewhat by increases in chemical costs depending on theherbicides selected for weed control and the fertilizers required to attain optimal yields (CTIC, 1996 andSiemens and Doster, 1992). The cost of pesticides with alternative tillage systems is not simply related to thetotal quantity of all pesticides used. Alternative pesticides (active ingredients) and/or different quantities of thesame or similar pesticides are often used with different tillage systems. Newer pesticides are often applied at amuch lower rate but are often more expensive. This complicates the comparison of costs among tillage systems(Bull et al., 1993).
The reduction in labor requirements per acre for higher residue tillage systems can be significant and can resultin immediate cost savings. Less hired labor results in direct savings, while less operator or family labor leavesmore time to generate additional income by expanding farm operations or working at off-farm jobs. However,the benefits from tillage systems that reduce labor and time requirements may be greater than perceived fromjust the cost savings per acre. Consideration must be given to the opportunity cost of the labor and time saved. Farmers who spend less time in the field have more time for financial management, improved marketing, orother activities to improve farm profitability (Sandretto and Bull, 1996). Making fewer trips over the field alsomeans that equipment lasts longer or can cover more acres. In either case, machinery ownership costs per acreare reduced (Monson and Wollenhaupt, 1995). In addition, the size and number of machines required decline asthe intensity of tillage or the number of operations is reduced. This can result in significant savings in capital,operation, and maintenance costs. Fewer trips alone can save an estimated $5 per acre on machinery wear andmaintenance costs (CTIC, 1996).
Figure 4.2.13—Average herbicide application, 1997
0 0.5 1 1.5 2 2.5 3 3.5
Wheat
Corn
Soybeans
Cotton
Lbs. per treated acre
No-till
Mulch-till
Other intensive
Moldboard plowed
Source: USDA, ERS, based on ARMS survey data.

Agricultural Resources and Environmental Indicators, Chapter 4.2, page 37
While new or retrofitted machinery may be required to adopt conservation tillage practices, machinery costsusually decline in the long run because a smaller complement of machinery is needed for high-residue no-tillsystems. Conservation tillage equipment designs have improved over the last decade and these improvementsenhance the opportunity for successful conversion to a CRM system. Farm equipment manufacturers are nowproducing a wide range of conservation tillage equipment suitable for use under a variety of field conditions(Sandretto and Bull, 1996). Reducing the intensity or number of tillage operations also lowers fuel andmaintenance costs. Fuel costs, like labor costs, can drop nearly 60 percent per acre by some estimates (Monsonand Wollenhaupt, 1995; Weersink et al., 1992). When fuel prices increase, conservation tillage practicesbecome relatively more profitable.
Several studies report that on a range of soil types, higher residue tillage systems such as no-till and ridge-tillresult in greater economic returns for a given crop than lower residue systems. Even in some northern areaswith heavy wet soils where no-till yields have sometimes been slightly lower, net returns have often been betterbecause per-acre costs were lower (Doster et al., 1994; Fox et al., 1991). For corn production, McBride (1999)found the potential benefits of reduced and conservation tillage to be largest for dryland production in the PlainsStates, probably due to moisture conservation (table 4.2.11). Reduced-till, mulch-till, and no-till all had lowercosts and higher returns than intensive tillage in the four major producing regions studied, except on irrigatedland. With no-till in the Lake States and Corn Belt, lower costs more than offset slightly lower average yields toproduce returns 4-13 percent higher than intensive tillage.
Adoption of conservation tillage may increase net returns on the entire farming operation even if returns for aparticular crop on a farm do not. For example, a tillage system that requires substantially less labor per acre andreduces returns per acre slightly but that permits application of the labor savings to more acres could result inlarger total returns (Sandretto and Bull, 1996).
Policies and programs promoting CRM adoptionConservation compliance provisions of the 1985 Food Security Act gave farmers an additional incentive toadopt CRM on highly erodible land (HEL). Under the program, farmers who produce crops on HEL and fail toimplement an approved conservation plan forfeit eligibility for most USDA farm program benefits. Cropresidue management (including conservation tillage) is a key component in the conservation plans for around 75percent of the cultivated HEL subject to compliance (see Chapter 6.3, Compliance Provisions for Soil andWetland Conservation). The 1990 and 1996 Farm Acts further strengthened the Federal role of protecting soiland water resources. Besides increasing penalties for noncompliance, the Acts established other programs thatoffer incentives to adopt practices such as CRM to improve water quality or control erosion (see Chapter 6.1,Overview of Conservation and Environmental Programs).
In 1991, USDA developed the Crop Residue Management Action Plan to assist producers with highly erodiblecropland in implementing conservation systems that met the requirements of their approved conservation plansby the 1995 deadline. The plan increased the timely delivery of information, provided technical assistance tohelp land users install conservation systems, helped producers better understand the conservation provisions offarm legislation, and assisted them in maintaining their conservation plans and thus their eligibility for USDAprogram benefits. Crop Residue Management (CRM) alliances were established at the National, State, and locallevels. The 20 State alliances, some of which remain active, included USDA agencies, agricultural supplyindustries, farm media, grower associations, commodity groups, conservation and environmental organizations,universities, et al., interested in promoting the conservation of soil and water resources. USDA continues toprovide assistance to farmers to meet conservation compliance requirements.

Agricultural Resources and Environmental Indicators, chapter 4.2, page 38
Weed Control and Tillage
Crop yields can be significantly affected by weeds. Traditional tools for controlling weeds have included crop rotations,crop or cover crop competition, and row crop cultivation. Each of these tools can play an important role in combinationwith modern pesticides to achieve effective pest control. These tools combined with scouting comprise the core of whathas become known as integrated pest management (IPM). IPM is a systematic way of controlling pests (weeds, insects,and diseases) using a variety of techniques. The results from an effective IPM program often include higher profits due tosavings from reduced pesticide applications and improved protection of the environment (CTIC, 1996).
Weed control problems vary among tillage systems because the nature of the weed population changes. An understandingof the response of weed species to tillage systems is essential in designing effective weed management programs (Martin,1995). Actively tilling the soil before planting (and cultivating during the growing season for row crops) helps provideweed control in conjunction with herbicides. However, tillage also brings up dormant weed seeds and prepares a seedbednot only for the crop, but for weed seeds as well (Monson and Wollenhaupt, 1995). Tillage can also expand the perennialweed problem of some species by spreading their rhizomes and tubers (Kinsella, 1993). A challenge with no-till in someareas involves a gradual shift from annual weeds to several hard-to-control perennial weeds, including woody species andvolunteer trees after 7-10 years (CTIC, 1996).
Mechanical cultivation for weed control is only feasible on the share of the cropland acreage planted with a row planter. The reported Cropping Practices Survey incidence of mechanical cultivation was fairly consistent across tillage systemsexcept for higher use with ridge-till and considerably lower (one-third to one-half of the share of acres treated for othertillage systems) use with no-till. Ridge-till systems normally use mechanical cultivations during the season to rebuild andmaintain the ridges in addition to controlling weeds.
Crop rotation can be an important tool for weed control because certain weeds are easier or more economical to control inone crop than another. For example, perennial grasses that are difficult to control in corn can be managed effectively inbroadleaf crops such as cotton and soybeans (CTIC, 1996). Conversely, some broadleaf weeds are much easier to controlin corn than in soybeans. A competitive crop that can achieve early shading of weeds can greatly improve weed control. The success of this system depends on obtaining a quick-closing crop canopy to shade emerging weeds and good standestablishment since skips allow some weeds to escape. Cover crops can accomplish this goal by reducing the amount ofsunlight that reaches emerging weed seedlings (CTIC, 1996). In addition, crop rotations can often reduce the areaneeding treatment with pesticides and also decrease reliance on annual applications of the same pesticide; the latter patterncan increase pesticide resistant species and reduce pesticide effectiveness.
Herbicide effectiveness depends on spraying at the right stage of growth and of plant stress, and under favorable weatherconditions. Recommendations on the type and combination of herbicides and method of application for efficient weedcontrol vary among tillage systems. The effective use of post-emergence herbicides most commonly employed in highresidue situations requires careful and regular scouting and better knowledge of weed identification to facilitateappropriate herbicide selection. Herbicide application rates for ridge tillage were consistently lower than for othersystems due to more prevalent banding, which uses smaller amounts of chemicals and more mechanical cultivation. Because no-till employs limited (or no) mechanical tillage, proper application of herbicides is essential for effective weedcontrol. In addition, during the transition to higher residue systems, farmers often tend to increase slightly the amount ofherbicide used as a risk aversion measure. The reported Cropping Practices Survey increase by no-till users in herbicideapplication (by weight) is due in part to the inclusion of an additional "burndown" herbicide treatment prior to planting asa substitute for mechanical weed control. However, successful no-till users find that herbicide costs generally decreaseand become competitive with intensive tillage systems in 3-5 years (CTIC, 1996). Also, different management skills arerequired to control weeds with no-till or other high-residue tillage systems than with intensive tillage systems (CTIC,1996). Crop residue management systems do not necessarily increase agricultural chemical requirements or applicationcosts.
The trend toward precision farming means that increasingly agricultural chemicals, including fertilizers and pesticides,will be carefully managed in a manner tailored to the site-specific conditions and the problems to be corrected. Improvedinput management is necessary to ensure economic viability, maintain long-term productivity, and protect environmentalquality.
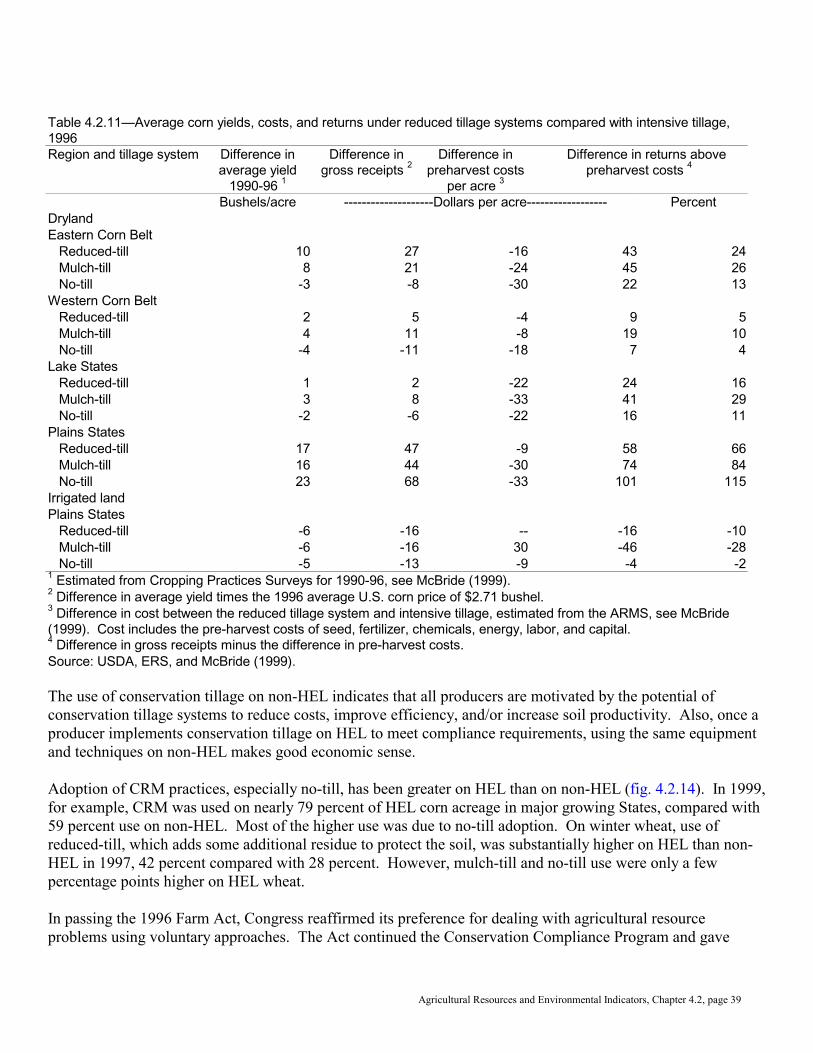
Agricultural Resources and Environmental Indicators, Chapter 4.2, page 39
Table 4.2.11—Average corn yields, costs, and returns under reduced tillage systems compared with intensive tillage,1996Region and tillage system Difference in
average yield1990-96 1
Difference ingross receipts 2
Difference inpreharvest costs
per acre 3
Difference in returns abovepreharvest costs 4
Bushels/acre --------------------Dollars per acre------------------ PercentDrylandEastern Corn Belt Reduced-till 10 27 -16 43 24 Mulch-till 8 21 -24 45 26 No-till -3 -8 -30 22 13Western Corn Belt Reduced-till 2 5 -4 9 5 Mulch-till 4 11 -8 19 10 No-till -4 -11 -18 7 4Lake States Reduced-till 1 2 -22 24 16 Mulch-till 3 8 -33 41 29 No-till -2 -6 -22 16 11Plains States Reduced-till 17 47 -9 58 66 Mulch-till 16 44 -30 74 84 No-till 23 68 -33 101 115Irrigated landPlains States Reduced-till -6 -16 -- -16 -10 Mulch-till -6 -16 30 -46 -28 No-till -5 -13 -9 -4 -21 Estimated from Cropping Practices Surveys for 1990-96, see McBride (1999).2 Difference in average yield times the 1996 average U.S. corn price of $2.71 bushel.3 Difference in cost between the reduced tillage system and intensive tillage, estimated from the ARMS, see McBride(1999). Cost includes the pre-harvest costs of seed, fertilizer, chemicals, energy, labor, and capital.4 Difference in gross receipts minus the difference in pre-harvest costs.Source: USDA, ERS, and McBride (1999).
The use of conservation tillage on non-HEL indicates that all producers are motivated by the potential ofconservation tillage systems to reduce costs, improve efficiency, and/or increase soil productivity. Also, once aproducer implements conservation tillage on HEL to meet compliance requirements, using the same equipmentand techniques on non-HEL makes good economic sense.
Adoption of CRM practices, especially no-till, has been greater on HEL than on non-HEL (fig. 4.2.14). In 1999,for example, CRM was used on nearly 79 percent of HEL corn acreage in major growing States, compared with59 percent use on non-HEL. Most of the higher use was due to no-till adoption. On winter wheat, use ofreduced-till, which adds some additional residue to protect the soil, was substantially higher on HEL than non-HEL in 1997, 42 percent compared with 28 percent. However, mulch-till and no-till use were only a fewpercentage points higher on HEL wheat.
In passing the 1996 Farm Act, Congress reaffirmed its preference for dealing with agricultural resourceproblems using voluntary approaches. The Act continued the Conservation Compliance Program and gave
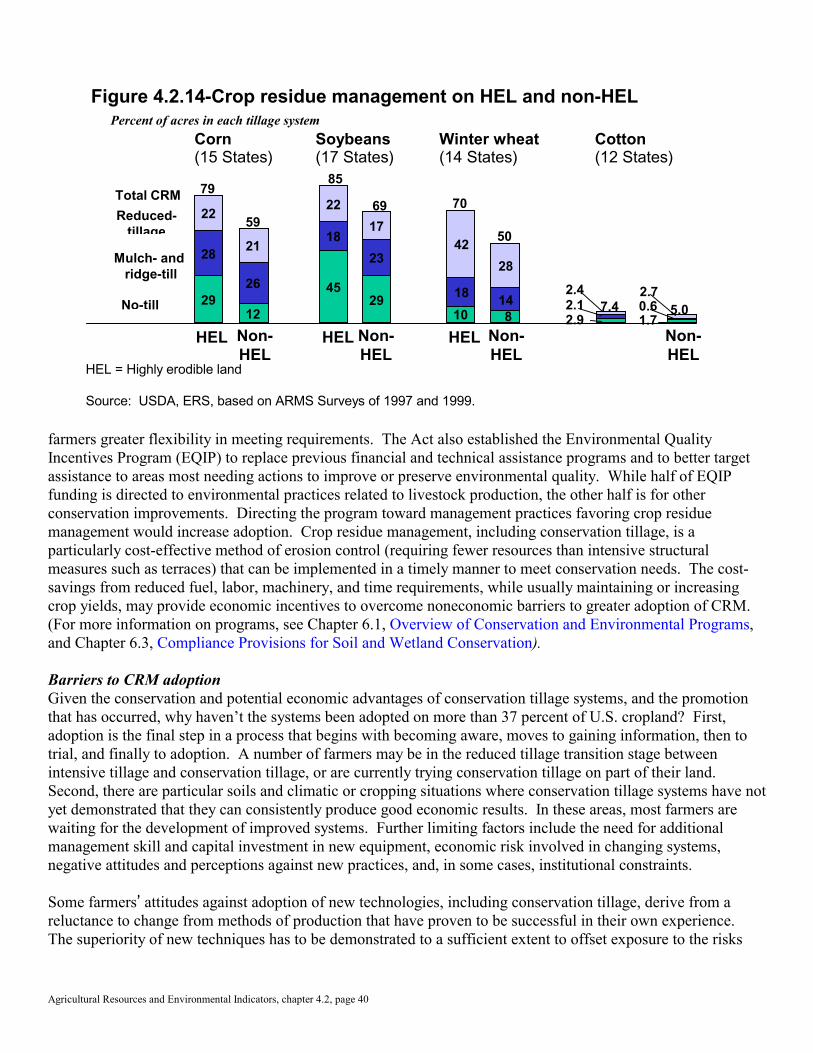
Agricultural Resources and Environmental Indicators, chapter 4.2, page 40
farmers greater flexibility in meeting requirements. The Act also established the Environmental QualityIncentives Program (EQIP) to replace previous financial and technical assistance programs and to better targetassistance to areas most needing actions to improve or preserve environmental quality. While half of EQIPfunding is directed to environmental practices related to livestock production, the other half is for otherconservation improvements. Directing the program toward management practices favoring crop residuemanagement would increase adoption. Crop residue management, including conservation tillage, is aparticularly cost-effective method of erosion control (requiring fewer resources than intensive structuralmeasures such as terraces) that can be implemented in a timely manner to meet conservation needs. The cost-savings from reduced fuel, labor, machinery, and time requirements, while usually maintaining or increasingcrop yields, may provide economic incentives to overcome noneconomic barriers to greater adoption of CRM. (For more information on programs, see Chapter 6.1, Overview of Conservation and Environmental Programs,and Chapter 6.3, Compliance Provisions for Soil and Wetland Conservation).
Barriers to CRM adoptionGiven the conservation and potential economic advantages of conservation tillage systems, and the promotionthat has occurred, why haven’t the systems been adopted on more than 37 percent of U.S. cropland? First,adoption is the final step in a process that begins with becoming aware, moves to gaining information, then totrial, and finally to adoption. A number of farmers may be in the reduced tillage transition stage betweenintensive tillage and conservation tillage, or are currently trying conservation tillage on part of their land. Second, there are particular soils and climatic or cropping situations where conservation tillage systems have notyet demonstrated that they can consistently produce good economic results. In these areas, most farmers arewaiting for the development of improved systems. Further limiting factors include the need for additionalmanagement skill and capital investment in new equipment, economic risk involved in changing systems,negative attitudes and perceptions against new practices, and, in some cases, institutional constraints.
Some farmers= attitudes against adoption of new technologies, including conservation tillage, derive from areluctance to change from methods of production that have proven to be successful in their own experience. The superiority of new techniques has to be demonstrated to a sufficient extent to offset exposure to the risks
Non-HEL
Non-HEL
Non-HEL
Reduced-tillage
Mulch- and ridge-till
No-till
79
29
28
22 59
12
26
21
85
45
18
22 69
29
23
1770
18
42
10
50
14
28
87.4
2.92.12.4
Non-HEL
5.01.70.62.7
Percent of acres in each tillage system
Total CRM
Figure 4.2.14-Crop residue management on HEL and non-HEL
Corn(15 States)
Soybeans(17 States)
Winter wheat(14 States)
Cotton(12 States)
HEL HEL HEL
HEL = Highly erodible land
Source: USDA, ERS, based on ARMS Surveys of 1997 and 1999.

Agricultural Resources and Environmental Indicators, Chapter 4.2, page 41
inherent in making a change from traditional methods. The perceived risks are critical because unusual weatheror pest problems may be accepted as a normal occurrence with traditional methods but poor results related toweather or pests may be blamed on the new tillage system if they occur during the transition period. Consequently, the new technique may be unfairly discredited in the area for a long time if initial attempts areperceived to result in failure. Cultural and institutional factors can also constrain adoption. Some farmers oreven whole communities demonstrate strong preferences for clean tilled fields as a sign of "good" management.The banker and/or landlord may be reluctant to permit a change in the way the land is farmed, especially if theyperceive more potential risk to crop yields and net returns during the transition.
Farmers are aware that a series of challenges exist with higher residue levels. These may include different (butnot necessarily more serious) disease, insect, or weed problems; difficulties with more residue on the surface inproper seed, fertilizer, and pesticide placement; and, under certain conditions, particularly cool wet seasons,lower corn yields (CTIC, 1996). In addition, the land must be properly prepared for no-till. Previouscompaction and fertility problems need to be corrected first. The transition period can be very difficult as thefarmer wrestles with learning how to adapt the new tillage system to his unique situation, especially if unusualweather or pest problems arise during the transition. Long-term benefits such as improved soil quality may takeyears to be realized. However, in many situations, innovative farmers have found solutions to most of theseproblems or through experience have learned how to reduce their impact to tolerable levels until moreacceptable solutions can be devised.
Farmers often face significant tradeoffs when choosing the most appropriate tillage system for their conditions. Higher residue systems generally allow less opportunity to correct mistakes or adjust to changed circumstancesonce the season is underway. Conservation tillage practices, with their higher levels of crop residue, usuallyrequire more attention to proper timing and placement of nutrients and pesticides, and in carrying out tillageoperations. Nutrient management can become more complex with crop residue management because of higherresidue levels and reduced options with regard to method and timing of nutrient applications. No-till, inparticular, can complicate manure application and may also contribute to nutrient stratification within the soilprofile from repeated surface nutrient applications without any mechanical incorporation. This is notnecessarily a problem because with higher residue levels evaporation is reduced and more water is maintainednear the surface, fostering the growth of feeder roots near the surface where the nutrients are concentrated(Monson and Wollenhaupt, 1995). Also, new equipment is available that permits deep banding of nutrientswith minimal soil/residue disturbance. In some instances, increased application of specific nutrients and the useof specialized equipment for proper fertilizer placement may be necessary, contributing to higher costs.
Farmers' Use of Conservation Buffers and Structures
Soil and water conservation structures and buffer zones can significantly reduce erosion caused by rainfall andwater runoff. These structures allow for surface water to be captured on site or slowed and diverted from thefield via erosion-resistant waterways, channels, or outlets. While crop rotation and tillage practices may also beused to help control erosion, they may not provide sufficient control of runoff water after heavy rains. Therefore, engineering structures and buffer zones are often important components of farm soil managementsystems.
National and regional use of buffers and structuresDespite regional variation, ARMS data show some similarity of soil conserving structures used in conjunctionwith a particular cropping sequence (table 4.2.12). On land in continuous corn, for example, grassed waterways

Agricultural Resources and Environmental Indicators, chapter 4.2, page 42
are used by more farmers than any other structure, except in the Southeast States, where the practice is second tounderground outlets. In the Lake States and Corn Belt Regions, more than 20 percent of farms implementedcontour farming and underground outlets. In the Plains States and Southeast States Regions, the frequency ofcorn farmers using various soil-conserving structures is lower than in other regions, most likely because offewer problems with water-based erosion.
The use of one or more structures for soil and water conservation varies significantly across production regions(fig. 4.2.15). The adoption rate is higher in the Corn Belt (79 percent) and Lake States (75 percent) than it is inthe Southeast (52 percent) and Plains States (32 percent). The adoption rate in the Plains States, the only regionwhere more than half the planted corn for grain acreage is not serviced by at least one soil and waterconservation structure, is notably lower than it is in the other three regions. Soil and climatic variation are likelyresponsible for much of the adoption rate differences.
Table 4.2.12—Corn farms using various soil conserving structures, by cropping pattern and region, 1996Region andstructure
ContinuousCorn
CornSoy-Corn
Soy-Soy-Corn
FallowCorn-Corn
FallowSoy-Corn
Fallow-FallowCorn
Percent of farmsLake States RegionGrassed waterways 42 22 - 20 - 44Terraces 6 - - 2 - 1Contour farming 24 4 - 19 - 8Strip cropping 36 2 - 25 22 24Underground outlets 21 80 97 11 17 5Other drainage 15 6 1 2 - 2Corn Belt RegionGrassed waterways 53 26 42 77 24 76Terraces 26 8 25 - 6 -Contour farming 38 12 27 61 6 52Strip cropping 5 1 - - 6 -Underground outlets 45 59 49 16 42 36Other drainage 21 13 15 - - 2Plains States RegionGrassed waterways 8 15 13 32 71 11Terraces 2 11 13 32 - 15Contour farming 3 11 13 32 - 7Strip cropping 1 4 - - - 6Underground outlets 2 10 - - - -Other drainage 7 1- - 38 71 13Southeast States RegionGrassed waterways 11 27 20 15 71 4Terraces - 14 - - - -Contour farming - 39 - - - 3Strip cropping 5 3 13 - - -Underground outlets 13 24 18 - - -Other drainage 3 35 5 - - -- = less than 0.5 percent or insufficient data to make an estimate.Source: USDA, ERS, based on the 1996 ARMS.
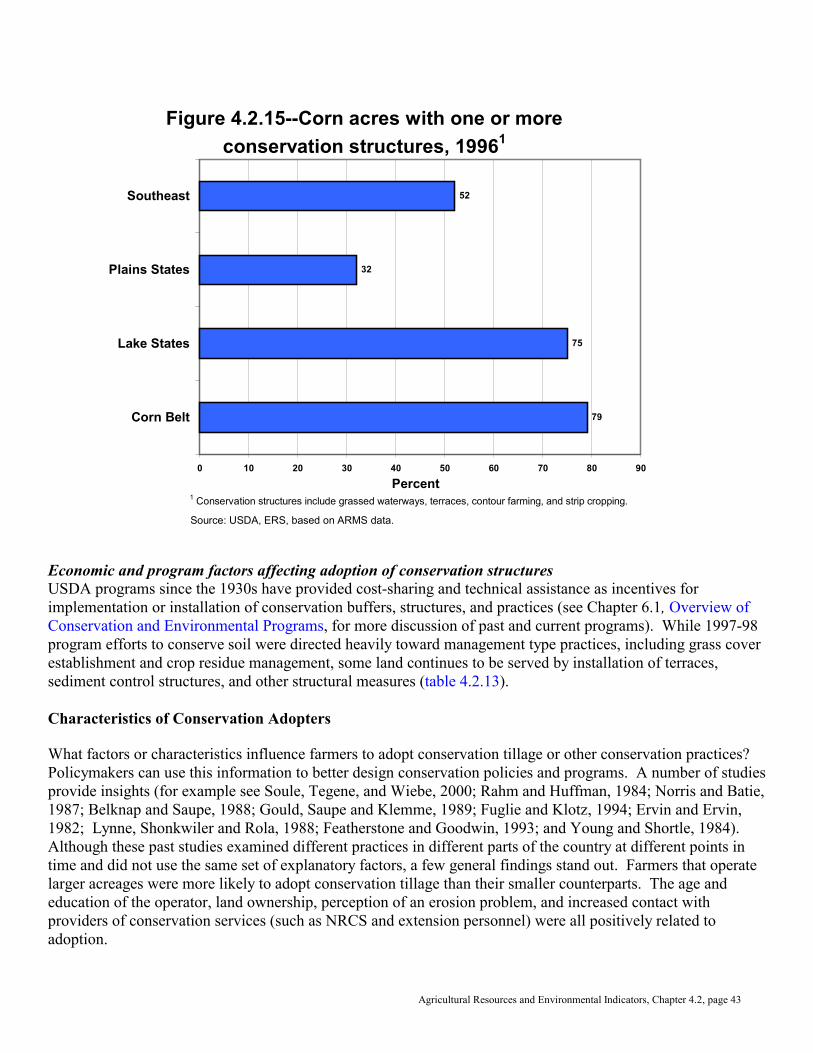
Agricultural Resources and Environmental Indicators, Chapter 4.2, page 43
Economic and program factors affecting adoption of conservation structuresUSDA programs since the 1930s have provided cost-sharing and technical assistance as incentives forimplementation or installation of conservation buffers, structures, and practices (see Chapter 6.1, Overview ofConservation and Environmental Programs, for more discussion of past and current programs). While 1997-98program efforts to conserve soil were directed heavily toward management type practices, including grass coverestablishment and crop residue management, some land continues to be served by installation of terraces,sediment control structures, and other structural measures (table 4.2.13).
Characteristics of Conservation Adopters
What factors or characteristics influence farmers to adopt conservation tillage or other conservation practices? Policymakers can use this information to better design conservation policies and programs. A number of studiesprovide insights (for example see Soule, Tegene, and Wiebe, 2000; Rahm and Huffman, 1984; Norris and Batie,1987; Belknap and Saupe, 1988; Gould, Saupe and Klemme, 1989; Fuglie and Klotz, 1994; Ervin and Ervin,1982; Lynne, Shonkwiler and Rola, 1988; Featherstone and Goodwin, 1993; and Young and Shortle, 1984).Although these past studies examined different practices in different parts of the country at different points intime and did not use the same set of explanatory factors, a few general findings stand out. Farmers that operatelarger acreages were more likely to adopt conservation tillage than their smaller counterparts. The age andeducation of the operator, land ownership, perception of an erosion problem, and increased contact withproviders of conservation services (such as NRCS and extension personnel) were all positively related toadoption.
Figure 4.2.15--Corn acres with one or more conservation structures, 19961
79
75
32
52
0 10 20 30 40 50 60 70 80 90
Corn Belt
Lake States
Plains States
Southeast
Percent
Source: USDA, ERS, based on ARMS data.
1 Conservation structures include grassed waterways, terraces, contour farming, and strip cropping.
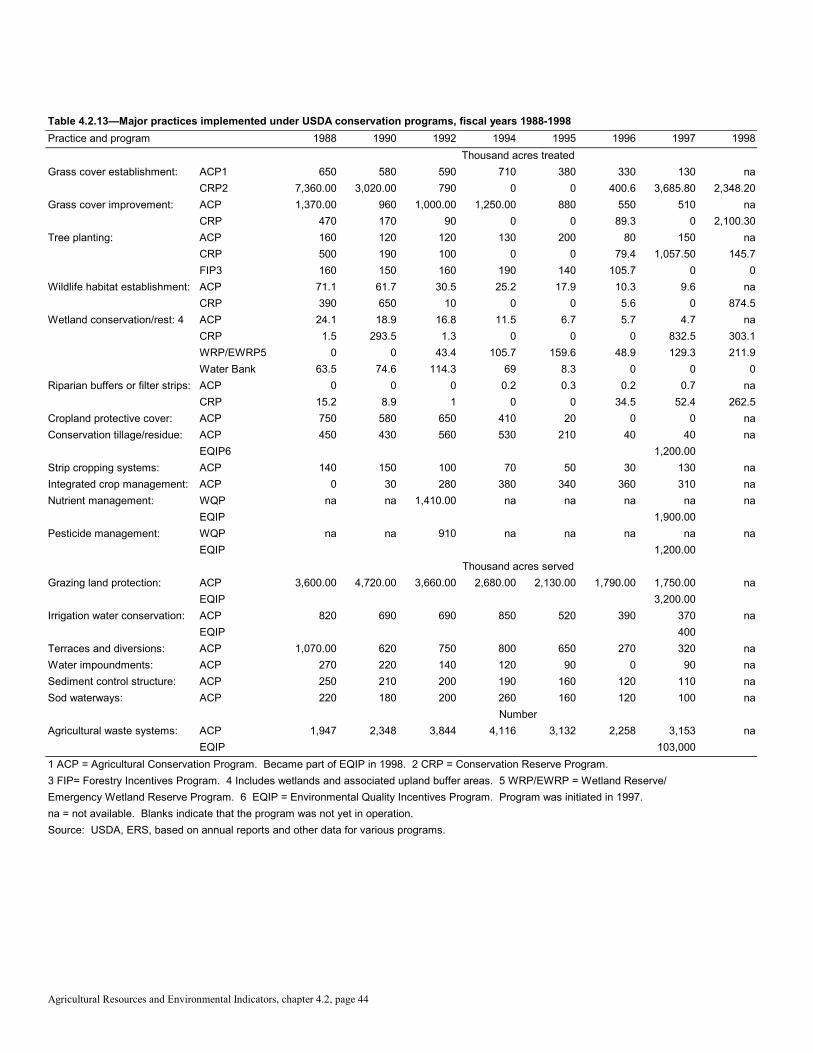
Agricultural Resources and Environmental Indicators, chapter 4.2, page 44
Table 4.2.13—Major practices implemented under USDA conservation programs, fiscal years 1988-1998Practice and program 1988 1990 1992 1994 1995 1996 1997 1998
Thousand acres treatedGrass cover establishment: ACP1 650 580 590 710 380 330 130 na
CRP2 7,360.00 3,020.00 790 0 0 400.6 3,685.80 2,348.20Grass cover improvement: ACP 1,370.00 960 1,000.00 1,250.00 880 550 510 na
CRP 470 170 90 0 0 89.3 0 2,100.30Tree planting: ACP 160 120 120 130 200 80 150 na
CRP 500 190 100 0 0 79.4 1,057.50 145.7FIP3 160 150 160 190 140 105.7 0 0
Wildlife habitat establishment: ACP 71.1 61.7 30.5 25.2 17.9 10.3 9.6 naCRP 390 650 10 0 0 5.6 0 874.5
Wetland conservation/rest: 4 ACP 24.1 18.9 16.8 11.5 6.7 5.7 4.7 naCRP 1.5 293.5 1.3 0 0 0 832.5 303.1WRP/EWRP5 0 0 43.4 105.7 159.6 48.9 129.3 211.9Water Bank 63.5 74.6 114.3 69 8.3 0 0 0
Riparian buffers or filter strips: ACP 0 0 0 0.2 0.3 0.2 0.7 naCRP 15.2 8.9 1 0 0 34.5 52.4 262.5
Cropland protective cover: ACP 750 580 650 410 20 0 0 naConservation tillage/residue: ACP 450 430 560 530 210 40 40 na
EQIP6 1,200.00Strip cropping systems: ACP 140 150 100 70 50 30 130 naIntegrated crop management: ACP 0 30 280 380 340 360 310 naNutrient management: WQP na na 1,410.00 na na na na na
EQIP 1,900.00Pesticide management: WQP na na 910 na na na na na
EQIP 1,200.00Thousand acres served
Grazing land protection: ACP 3,600.00 4,720.00 3,660.00 2,680.00 2,130.00 1,790.00 1,750.00 naEQIP 3,200.00
Irrigation water conservation: ACP 820 690 690 850 520 390 370 naEQIP 400
Terraces and diversions: ACP 1,070.00 620 750 800 650 270 320 naWater impoundments: ACP 270 220 140 120 90 0 90 naSediment control structure: ACP 250 210 200 190 160 120 110 naSod waterways: ACP 220 180 200 260 160 120 100 na
NumberAgricultural waste systems: ACP 1,947 2,348 3,844 4,116 3,132 2,258 3,153 na
EQIP 103,0001 ACP = Agricultural Conservation Program. Became part of EQIP in 1998. 2 CRP = Conservation Reserve Program. 3 FIP= Forestry Incentives Program. 4 Includes wetlands and associated upland buffer areas. 5 WRP/EWRP = Wetland Reserve/Emergency Wetland Reserve Program. 6 EQIP = Environmental Quality Incentives Program. Program was initiated in 1997.na = not available. Blanks indicate that the program was not yet in operation.Source: USDA, ERS, based on annual reports and other data for various programs.

Agricultural Resources and Environmental Indicators, Chapter 4.2, page 45
Recent analysis of the ARMS survey data of corn producers in 1996 and soybean producers in 1997 alsoexamined factors associated with adoption of conservation tillage and three types of structures—grassedwaterways, strip cropping, or contour farming. Three factors were positively correlated with conservationtillage adoption for both corn and soybean producers—farm size, the percentage of the farm in corn or soybeans,and the field’s designation as highly erodible land (HEL) (table 4.2.14). Farm program participation was also animportant explanatory factor for soybean producers but not for corn producers. Younger and more highlyeducated corn farmers were more likely to adopt conservation tillage, but age and education were not importantfactors for soybean producers. Less likely to use conservation tillage were corn producers with limitedresources, retired or residential/lifestyle, cash-rented land, and improved drainage.
For the adoption of the three structural practices, the designation of the sampled field as highly HEL was theonly significant explanatory factor for soybean producers (table 4.2.14). HEL was also a significant and positivefactor affecting adoption for corn producers, as was average annual precipitation. Negative influences onadoption by corn producers included farm size, the operator's age, the percent of the farm in corn or soybeans,and average annual temperature. Both cash-renters and share-renters were less likely to adopt conservationpractices on corn land than were owner-operators. In addition, among corn producers, limited-resource, retiredand residential/lifestyle farmers were less likely to adopt one of the conservation practices than were largefamily farmers.
Author: Richard Magleby (202-694-5615, [email protected]). Contributors: John Day, Mohinder Gill, MerrittPadgitt, Carmen Sandretto, Meredith Soule, and Marlow Vesterby.
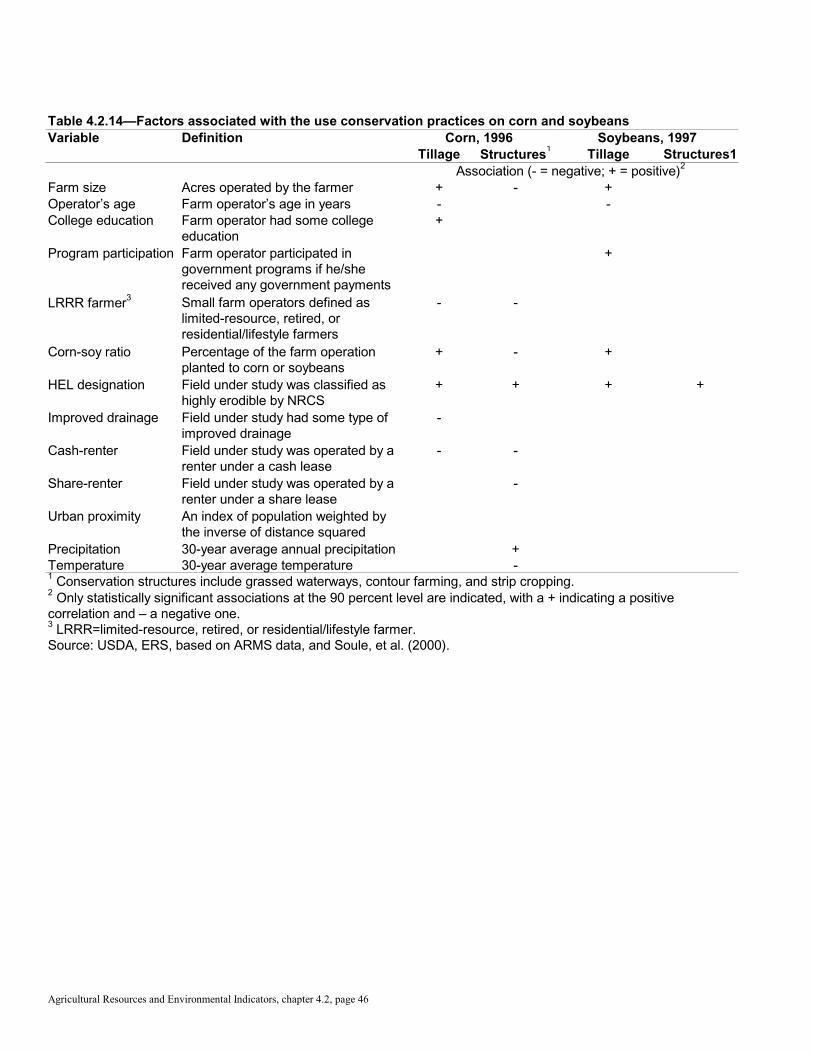
Agricultural Resources and Environmental Indicators, chapter 4.2, page 46
Table 4.2.14—Factors associated with the use conservation practices on corn and soybeansVariable Definition Corn, 1996 Soybeans, 1997
Tillage Structures1 Tillage Structures1Association (- = negative; + = positive)2
Farm size Acres operated by the farmer + - +Operator’s age Farm operator’s age in years - -College education Farm operator had some college
education+
Program participation Farm operator participated ingovernment programs if he/shereceived any government payments
+
LRRR farmer3 Small farm operators defined aslimited-resource, retired, orresidential/lifestyle farmers
- -
Corn-soy ratio Percentage of the farm operationplanted to corn or soybeans
+ - +
HEL designation Field under study was classified ashighly erodible by NRCS
+ + + +
Improved drainage Field under study had some type ofimproved drainage
-
Cash-renter Field under study was operated by arenter under a cash lease
- -
Share-renter Field under study was operated by arenter under a share lease
-
Urban proximity An index of population weighted bythe inverse of distance squared
Precipitation 30-year average annual precipitation +Temperature 30-year average temperature -1 Conservation structures include grassed waterways, contour farming, and strip cropping.2 Only statistically significant associations at the 90 percent level are indicated, with a + indicating a positivecorrelation and – a negative one.3 LRRR=limited-resource, retired, or residential/lifestyle farmer.Source: USDA, ERS, based on ARMS data, and Soule, et al. (2000).
Agricultural Resources and Environmental Indicators, Chapter 4.2, page 47
References
Acton, D.F., and L.J. Gregorich (1995). "Understanding Soil Health," The Health of Our Soils: Toward Sustainable Agriculture inCanada, Acton and Gregorich (eds.). Center for Land and Biological Resources Research, Research Branch, Agriculture and Agri-Food Canada, Ottawa, Ontario.
Alexander, E.B. and J.C. McLaughlin (1992). "Soil Porosity as an Indicator of Forest and Rangeland Soil Condition (Compaction)and Relative Productivity," Proceedings of the Soil Quality Standards Symposium, San Antonio, Texas, Oct. 1990. Watershed and AirManagement Report No. W0-WSA-2. U.S. Dept. Agr., U.S. Forest Service.
American Agricultural Economics Association Task Force (1986). Soil Erosion and Soil Conservation Policy in the United States. Occasional Paper No. 2, Iowa State University, Ames, IA.
American Society for Microbiology (1994). Microbial Diversity Research Priorities. Washington, DC.
Arshad, M.A., and G.M. Coen (1992). "Characterization of Soil Quality: Physical and Chemical Criteria," American Journal ofAlternative Agriculture, Vol. 7, Numbers 1 and 2.
Baker, J. L. (1980). "Agricultural Areas as Nonpoint Sources of Pollution." in M. R. Overcash and J. M. Davidson [eds.]Environmental Impact of Nonpoint Source Pollution. Ann Arbor Science Publications, Inc., Ann Arbor, MI, pp. 275-310.
Baker, J. L. (1987). "Hydrologic Effects of Conservation Tillage and Their Importance to Water Quality," in T. J. Logan, J. M.Davidson, J. L. Baker, and M. R. Overcash [eds.], Effects of Conservation Tillage on Ground-water Quality: Nitrates and Pesticides.Lewis Pub., Chelsea, MI, pp. 113-124.
Baker, J. L. and H. P. Johnson (1979). The Effect of Tillage System on Pesticides in Runoff from Small Watersheds. Transactions ofthe American Society of Agricultural Engineers, 22: 554-559.
Baker, J. L. and J. M. Laflen (1979). "Runoff Losses of Surface-applied Herbicides as Affected by Wheel Tracks and Incorporation,"Journal of Environmental Quality, 8: 602-607.
Baker, J. L., T. J. Logan, J. M. Davidson, and M. R. Overcash (1987). "Summary and Conclusions," in T. J. Logan, J. M. Davidson, J.L. Baker, and M. R. Overcash [eds.] , Effects of Conservation Tillage on Groundwater Quality: Nitrates and Pesticides. Lewis Pub.,Chelsea, MI, pp. 277-281.
Belknap, J. and W. Saupe (1988). “Farm Family Resources and the Adoption of No-Plow Tillage in Southwestern Wisconsin.” NorthCentral Journal of Agricultural Economics, 10 (January):13-24.
Bengtson, R. L., L. M. Southwick, G. H. Willis, and C. E. Carter (1989). The Influence of Subsurface Drainage Practices onHerbicide Loss. Paper 89-2130. American Society of Agricultural Engineers, St. Joseph, MI.
Bennett, H. H., and W. C. Lowdermilk. (1938). "General Aspects of the Soil Erosion Problems," Soil and Men: Yearbook ofAgriculture, 1938. U.S. Dept. of Agr., pp. 581-608.
Björklund, Johanna, Karin E. Limburg, and Torbjörn Rydberg (1999). "Impact of production intensity on the ability of the agriculturallandscape to generate ecosystem services: An example from Sweden," Ecological Economics 29(1999) 269-291.
Brust, G.E., and B.R. Stinner (1991). "Crop Rotation for Insect, Plant Pathogen, and Weed Control," CRP Handbook of PestManagement in Agriculture, David Pimentel (ed.), Second Edition, Volume 1. CRC Press Inc. pp.217-230.
Bull, Len. (1993). Residue and Tillage Systems for Field Crops, U.S. Dept. Agr., Econ. Res. Serv., Staff Report No. AGES 9310,July.
Bull, Len, and Carmen Sandretto (1995). "The Economics of Agricultural Tillage Systems," Farming for a Better Environment: A

Agricultural Resources and Environmental Indicators, chapter 4.2, page 48
White Paper. Soil and Water Conservation Society, Ankeny, IA, pp. 35-37.
Bull, Len, Herman Delvo, Carmen Sandretto, and Bill Lindamood (1993). "Analysis of Pesticide Use by Tillage System in 1990, 1991and 1992 Corn and Soybeans." Agricultural Resources: Inputs Situation and Outlook Report, AR-32, U.S. Dept. Agr., Econ. Res.Serv., October.
Clark, Richard T., James B. Johnson, and Jennifer Brundson (1994). "Economics of Residue Management," in Crop ResidueManagement to Reduce Erosion and Improve Soil Quality: Northern Great Plains Region. W.C. Moldenhauer and A.L. Black, (eds.)U.S. Dept. Agr., Agr. Res. Serv., Conservation Research Report No. 38.
Conservation Technology Information Center (1996). A Checklist for U.S. Farmers, West Lafayette, IN.
Council on Environmental Quality (CEQ) (1993). Environmental Quality. Twenty-fourth annual report. Executive Office of thePresident of the United States.
Daily, G.C., S. Alexander, P.R. Ehrlich, L. Goulder, J. Lubchenco, P.A. Matson, H.A. Mooney, S. Postel, S.H. Schneider, D. Tilman,and G.M. Woodwell (1997). "Ecosystem Services: Benefits Supplied to Human Societies by Natural Ecosystems," Issues in Ecology. No. 2. Spring. pp. 1-16.
Daily, G.C., P.A. Matson, and P. Vitousek (1997). "Ecosystem Services Supplied by Soil," in Nature's Services, Societal Dependenceon Natural Ecosystems. G.C. Daily (ed.), Island Press. pp.113-32.
Dick, W. A. and T. C. Daniel (1987). "Soil Chemical and Biological Properties as Affected by Conservation Tillage: EnvironmentalImplications," in T. J. Logan, J. M. Davidson, J. L. Baker, and M. R. Overcash (eds.), Effects of Conservation Tillage on GroundwaterQuality: Nitrates and Pesticides. Lewis Pub., Chelsea, MI, pp. 125-147.
Doran, J.W., and T.B. Parkin (1994). "Defining and Assessing Soil Quality," in Defining Soil Quality for a Sustainable Environment,D.C. Coleman, D.F. Bezdicek, and B.A. Stewart (eds.), SSSA Spec. Pub. No. 35, Madison, WI.
Doran, J.W., M. Sarrantonio, and R. Janke (1996). "Strategies to Promote Soil Quality and Health," The Soil Quality Concept. TheSoil Quality Institute. U.S. Dept. of Agr., Natural Resources Conservation Service. Oct.
Doster, D.H., T. W. Pritchard, D. R. Griffith, and S. D. Parsons (1994). Tillage Economics, One Planter Farms. ID-191. PurdueUniversity Cooperative Extension Service.
Duffy, Michael (1996). Personal conversation on Sept. 30, 1996. Department of Economics, Iowa State University, 560 Heady Hall,Ames, IA 50011.
Edwards, William M. (1995). "Effects of Tillage and Residue Management on Water for Crops," in Crop Residue Management toReduce Erosion and Improve Soil Quality: Appalachia and Northeast Region, R.L. Blevins and W.C. Moldenhauer (eds.), U.S. Dept.Agr., Agr. Res. Serv., Conservation Research Report No. 41.
Edwards, William M., M. J. Shipitalo, L. B. Owens, and W. A. Dick (1993). "Factors Affecting Preferential Flow of Water andAtrazine Through Earthworm Burrows Under Continuous No-till Corn," Journal of Environmental Quality. Vol. 22, No. 3.
Ervin, C. A., and D.E. Ervin (1982). "Factors Affecting the Use of Soil Conservation Practices: Hypotheses, Evidence and PolicyImplications." Land Economics 58 (August):277-291.
Fawcett, Richard S. (1987). "Overview of Pest Management for Conservation Tillage Systems," in T. J. Logan, J. M. Davidson, J. L.Baker, and M. R. Overcash (eds.), Effects of Conservation Tillage on Groundwater Quality: Nitrates and Pesticides. Lewis Pub.,Chelsea, MI, pp. 19-37.
Fawcett, Richard S., Dennis P. Tierney, Brian R. Christensen (1994). "Impact of Conservation Tillage on Reducing Runoff ofPesticides into Surface Waters." Journal of Soil and Water Conservation. Vol. 49, No. 2.
Agricultural Resources and Environmental Indicators, Chapter 4.2, page 49
Featherstone, A.M. and B.K. Goodwin (1993). "Factors Influencing a Farmer's Decision to Invest in Long-Term ConservationPractices: Hypotheses, Evidence and Policy Implications." Land Economics 69(February):67-81.
Fox, G., A. Weersink, G. Sarwar, S. Duff, and B. Deen (1991). "Comparative Economics of Alternative Agricultural ProductionSystems: A Review." Northeastern Journal of Agricultural and Resource Economics. Vol. 30, No. 1.
Foy, C.D., A.M. Sadeghi, J.C. Ritchie, D.T. Krizek, J.R. Davis, and W.D. Kemper (1999). "Aluminum Toxicity and High BulkDensity: Role in Limiting Shoot and Root Growth of Selected Aluminum Indicator Plants and Eastern Gamagrass in an Acid Soil,"Tektran. U.S. Dept. Agr., Agr. Res. Serv. May.
Fuglie, K.O. and C.A. Klotz (1994). “Adoption of Conservation Tillage in the Lower Susquehanna Basin.” Paper presented at theNEARWA meetings, July 27-29, 1994.
Glenn, S. and J. S. Angle (1987). "Atrazine and Simazine in Runoff from Conventional and No-Till Corn Watersheds." AgriculturalEcosystems and Environment, 18: 273-280.
Gottfried, R., D. Wear, and R. Lee (1996). "Institutional solutions to market failure on the landscape scale." Ecological Economics18(1996)133-140. Elsevier.
Gould, B.W., W.E. Saupe and R.M. Klemme (1989). “Conservation Tillage: The Role of Farm and Operator Characteristics and thePerception of Soil Erosion,” Land Economics 65 (May 1989):167-182.
Griffith, D. R., E. J. Kladivko, J. V. Mannering, T. D. West, and S. D. Parsons (1988). "Long Term Tillage and Rotation Effects onCorn Growth and Yield on High and Low Organic Matter, Poorly Drained Soils." Agronomy Journal No. 4, pp. 599-605.
Griffith, D.R., J.F. Moncrief, D.J. Eckert, J.B. Swan, and D.D. Breitbach (1992). "Crop Response to Tillage Systems." Journal of theAmerican Society of Agricultural Engineers, 22: 554-559.
Groot, Rudolf S. de (1992). Functions of Nature, Evaluation of Nature in Environmental Planning, Management and DecisionMaking. Wolters-Noordhoff. Netherlands.
Hall, J. K., N. L. Hartwig, and L. D. Hoffman (1984). "Cyanazine Losses in Runoff from No-Tillage Corn in 'Living' and DeadMulches vs. Unmulched, Conventional Tillage." Journal of Environmental Quality, 13: 105-110.
Halvorson, Johnathan J., Jeffrey L. Smith, and R.I. Papendick (1997). "Issues of Scale for Evaluating Soil Quality." Journal of Soiland Water Conservation, 52(1). Jan/Feb.
Hanthorn, M. and M. Duffy (1983). Corn and Soybean Pest Management Practices for Alternative Tillage Strategies. Publication No.IOS-2, U.S. Dept. Agr., Econ. Res. Serv., Washington, DC
Heichel, G.H (1987). "Legumes as a source of nitrogen in conservation tillage system," in The Role of Legumes in ConservationTillage System, J.F. Power (ed.), Ankeny, IA: Soil Conservation Society of America. pp. 29-35.
Heimlich, R., and N. Bills (1989). Productivity and Erodibility of U.S. Cropland. AER-604. U.S. Dept. Agr., Econ. Res. Serv.
Helling, C. S. (1987). "Effect of Conservation Tillage on Pesticide Dissipation." In T. J. Logan, J. M. Davidson, J. L. Baker, and M.R. Overcash (eds.), Effects of Conservation Tillage on Groundwater Quality: Nitrates and Pesticides. Lewis Pub., Chelsea, MI, pp.179-187.
Hornsby, A.G., and R.G. Brown (1992). "Soil Parameters Significant to Pesticide Fate." Proceedings of the Soil Quality StandardsSymposium, San Antonio, TX, Oct. 1990. Watershed and Air Management Report No. W0-WSA-2. U.S. Dept. Agr., U.S. ForestService.
Hudson, E. H. and J. F. Bradley (1995). "Economics of Surface-Residue Management, Southeast Region.” Crop Residue Management
Agricultural Resources and Environmental Indicators, chapter 4.2, page 50
to Reduce Erosion and Improve Soil Quality: Southeast Region, U.S. Dept. Agr., Agr. Res. Serv., Conservation Research Report No.39.
Jawson, Michael D. (2001). Technical Review (personal correspondence). U.S. Dept. Agr., Agr. Res. Serv. May.
Jaenicke, Edward. C. (1998). From the Ground Up, Exploring Soil Quality’s Contribution to Environmental Health. Policy StudiesReport No. 10, Henry Wallace Institute for Alternative Agriculture, Greenbelt, MD. Oct.
Karlen, Douglas L., and Susan S. Andrews (2000). "The soil quality concept: A tool for evaluating sustainability," DIAS Report No.38, Plant Production. Proceedings from NJF seminar 310, S. Elmholt, B. Stenberg, A. Grønlund, and V. Nuutinen, eds. DanishInstitute of Agricultural Sciences. Tjele, Denmark. pp.15-26. Dec.
Karlen, D.L., N.S. Eash, and P.W. Unger (1992). "Soil and crop management effects on soil quality indicators." American Journal ofAlternative Agriculture, Vol. 7, Nos. 1 and 2., pp. 48-55.
Karlen, D.L., M.J. Mausbach, J.W. Doran, R.G. Cline, R.F. Harris, and G.E. Schuman (1997). "Soil Quality: A Concept, Definition,and Framework for Evaluation." Soil Science Society of America Journal 61(1).
Kellogg, Robert L., Margaret Stewart Maizel, and Don W. Goss (1992). Agricultural Chemical Use and Ground Water Quality: AreThere Potential Problem Areas? U.S. Dept. Agr., Soil Conservation Service, Economic Research Service, Cooperative StateResearch Service, and National Center for Resource Innovations, Dec.
Kemper, W.D., E.E. Alberts, C.D. Foy, R.B. Clark, J.C. Ritchie and R.W. Zobel (1997). "Aerenchyma, acid tolerance, and associativenitrogen fixation enhance carbon sequestration in soil," in: R. Lal, J. M. Kimble, R.F. Follett and B.A. Stewart (eds.), Management ofCarbon Sequestration in Soil. CRC Press, Boca Raton, FL. Pp. 221-234.
Kennedy, A.C., and R.I. Papendick (1995). "Microbial Characteristics of Soil Quality," Journal of Soil and Water Conservation, Vol.50 (Nov.-Dec.), p. 243.
Kimberlin, L.W. (1976). Conservation Needs and Status of Treatment of Erodible Cropland in Tillage Rotation. Unpublished paper. U.S. Dept. of Agr., Soil Cons. Serv.
Kinsella, Jim. (1993). "Notes on Weed Control with Herbicides in the Production of Row Crops." Presented to ConservationTechnology Information Center Executive Meeting, March 30.
Kladivko, E., L. Brown, and J. Baker (2001). “Pesticide Transport to Subsurface Tile Drains in Humid Regions of North America,”Critical Reviews in Environmental Science and Technology, Vol. 31, Issue 1, Jan.
Lal, R., J. Kimble, R. Follett, and C. Cole (1998). The Potential for U.S. Cropland to Sequester Carbon and Mitigate the GreenhouseEffect. Ann Arbor Press, Chelsea, MI.
Larson, W.E., and F.J. Pierce (1991). "Conservation and enhancement of soil quality," in Evaluation for Sustainable LandManagement in the Developing World, Vol. 2. J. Dumanski, et al. (eds.), International Board for Soil Research and Management,Bangkok, Thailand. Sept.
Larson, W.E., and F.J. Stewart (1992). "Thresholds for Soil Removal for Maintaining Cropland Productivity." Proceedings of theSoil Quality Standards Symposium, San Antonio, Texas, Oct. 1990. Watershed and Air Management Report No. W0-WSA-2. U.S.Dept. Agr., U.S. Forest Service.
Lewis, Jim (2001). Technical Review (personal correspondence). U.S. Dept. of Agr., Natural Resources Conservation Service. Apr.
Lin, W., P. Westcott, R. Skinner, S. Sanford, and D. Ugarte (2000). Supply Response Under the 1996 Farm Act and Implications forthe U.S. Field Crops Sector. U.S. Dept. Agr., Econ. Res. Serv., TB No. 1888 (July).

Agricultural Resources and Environmental Indicators, Chapter 4.2, page 51
Lynne, G.D., J.S. Shonkwiler and LR. Rola (1988). "Attitudes and Farmer Conservation Behavior." American Journal of AgriculturalEconomics 70(February):12-19.
Martin, Alex R.(1995). "Weed Management,” in Crop Residue Management to Reduce Erosion and Improve Soil Quality: NorthCentral Region, W.C. Moldenhauer and L.N. Mielke (eds.), U.S. Dept. Agr., Agr. Res. Serv. Conservation Research Report No. 42.
Mausbach, Maurice J., Director of the Soil Quality Institute (1997). Personal correspondence. Jan.
McBride, William D. (1999). "The Economics of Crop Residue Management in U.S. Corn Production." Paper presented at theSouthern Agricultural Economics Association meetings, Memphis, TN, January 30-February 3.
McCormack, D.E., and R. Heimlich (1985). Erodible Soils: Definition and Classification. A & P Staff Report No. 85-2. U.S. Dept.Agr., Soil Conservation Service.
Meisenbach, T. (1983). Alternative Farming Task Force Report. University of Nebraska, Lincoln, NE.
Melvin, Stewart W. (1995). “Effects of Crop Residue Management on Water Quality,” in Crop Residue Management to ReduceErosion and Improve Soil Quality: North Central Region, W.C. Moldenhauer and L.N. Mielke (eds.), U.S. Dept. Agr., Agr. Res.Serv., Conservation Research Report No. 42.
Mengel, D. B., J. F. Moncrief, and E. E. Schulte (1992). "Fertilizer Management," in Conservation Tillage Systems andManagement, Crop Residue Management with No-till, Ridge-till, Mulch-till. Midwest Plan Service, MWPS-45, First Edition, Agricultural and Biosystems Engineering Department, Iowa State University, Ames, IA pp. 83-87.
Moldenhauer, W.C., W.D. Kemper, and L.N. Mielke (1995). “Long-Term Effects of Tillage and Crop Residue Management,” in CropResidue Management to Reduce Erosion and Improve Soil Quality: North Central Region, W.C. Moldenhauer and L.N. Mielke(eds.), U.S. Dept. Agr., Agr. Res. Serv., Conservation Research Report No. 42.
Monson, Mike and Nyle Wollenhaupt (1995). "Residue Management: Does It Pay? North Central Region," in Crop ResidueManagement to Reduce Erosion and Improve Soil Quality: North Central Region, W.C. Moldenhauer and L.N. Mielke (eds.), U.S.Dept. Agr., Agr. Res. Serv., Conservation Research Report No. 42.
National Research Council (NRC) (1993). Soil and Water Quality: An Agenda for Agriculture. National Academy Press,Washington, DC.
National Research Council (1989). Alternative Agriculture, National Academy Press, Washington D.C., pp. 135-150.
Nelson, Fredrick J., and Lyle P. Schertz. (eds.), 1996. Provisions of the Federal Agriculture Improvement and Reform Act of 1996. AIB No. 729. U.S. Dept. Agr., Econ. Res. Serv. Sept. http://www.ers.usda.gov/publications/aib729/aib729fm.pdf
Norris, P.E. and S.S. Batie (1987). "Virginia Farmers' Soil Conservation Decisions: An Application of Tobit Analysis." SouthernJournal of Agricultural Economics (July): 79-90.
Olson, K.R. (1992). "Soil Physical Properties as a Measure of Cropland Productivity." Proceedings of the Soil Quality StandardsSymposium, San Antonio, Texas, Oct. 1990. Watershed and Air Management Report No. W0-WSA-2. U.S. Dept. Agr., U.S. ForestService.
Onstad, C. A. and W. B. Voorhees (1987). "Hydrologic Soil Parameters Affected by Tillage," in T. J. Logan, J. M. Davidson, J. L.Baker, and M. R. Overcash (eds.), Effects of Conservation Tillage on Groundwater Quality: Nitrates and Pesticides. Lewis Pub.,Chelsea, MI, pp. 95-112.
Oskoui, K.E. and W.B. Voorhees (1991). "Economic Consequences of Soil Compaction." American Society of AgriculturalEngineers. Vol. 34(6).

Agricultural Resources and Environmental Indicators, chapter 4.2, page 52
Padgitt, M., D. Newton, R. Penn, and C. Sandretto (2000). Production Practices for Major Crops in U.S. Agriculture, 1990-97. U.S.Dept. Agr., Econ. Res. Serv., SB No. 969, Aug.
Parr, J.F., R.I. Papendick, S.B. Horner, and R.E. Meyer (1992). "Soil Quality: Attributes and Relationship to Alternative andSustainable Agriculture." American Journal of Alternative Agriculture, Vol. 7, Numbers 1 and 2.
Pierce, F.J., and W.E. Larson (1993). "Developing Criteria to Evaluate Sustainable Land Management," Proceedings of the EighthInternational Soil Management Workshop: Utilization of Soil Survey Information for Sustainable Land Use, J.M. Kimble (ed.). U.S.Dept. Agr., Soil Cons. Serv., Lincoln, NE. May.
Power, J.F (1987). "Legumes: Their Potential Role in Agricultural Production." American Journal of Alternative Agriculture 2(2): 69-73.
Pretty, J.N., C. Brett, D. Gee, R.E. Hine, C.F. Mason, J.I.L. Morison, H. Raven, M.D. Rayment, and G. van der Bijl (2000). "Anassessment of the total external costs of UK agriculture." Agricultural Systems 65 (2000) 113-136. Elsevier Science Ltd.
Rahm, M.R. and W.E. Huffman (1984). “The Adoption of Reduced Tillage: The Role of Human Capital and Other Variables.”American Journal of Agricultural Economics 66(November 1984):405-413.
Rao, P.S.C., and A.G. Hornsby (1989). "Behavior of Pesticides in Soils and Waters." Soil Science Fact Sheet SL 40 (revised).University of Florida, Gainesville, FL.
Ribaudo, M. (1986). Reducing Soil Erosion: Offsite Benefits. AER No. 561. U.S. Dept. Agr., Econ. Res. Serv., Sept.
Ruhl, J.B. 2000. "Farms, Their Environmental Harms, and Environmental Law," Ecology Law Quarterly 27:263.
Sander, K. W., W. W. Witt, and M. Barrett (1989). "Movement of Triazine Herbicides in Conventional and Conservation TillageSystems," in D. L. Weigmann (ed.), Pesticides in Terrestrial and Aquatic Environments. Virginia Water Resources Center andVirginia Polytechnic Institute and State University, Blacksburg, VA. pp. 378-382.
Sandretto, Carmen and Len Bull (1996). "Conservation Tillage Gaining Ground," Agricultural Outlook, AO No. 232, U.S. Dept. Agr.,Econ. Res. Serv., August.
Siemens, John C. and D. Howard Doster (1992). "Costs and Returns," in Conservation Tillage Systems and Management, CropResidue Management with No-till, Ridge-till, Mulch-till. Midwest Plan Service, MWPS-45, First Edition, Agricultural and BiosystemsEngineering Department, Iowa State University, Ames, IA pp. 34-41.
Seybold, C.A., M.J. Mausbach, D.L. Karlen, and H.H. Rogers (1997). "Quantification of Soil Quality," in Advances in Agronomy,B.A. Stewart and R. Lal (eds.), Lewis Publishers, New York, NY.
Söderbaum, P. (1987). "Environmental Management: A Non-Traditional Approach." Journal of Economic Issues. Vol. XXI, No. 1. March.
Soule, M., A. Tegene, and K. Wiebe (2000). “Land Tenure and the Adoption of Conservation Practices.” Amer. J. Agr. Econ. 82(4)(Nov.): 993-1005.
Torsvik, V., J. Goksoy, and F.L. Daae (1990). "High Diversity in DNA of Soil Bacteria." Applied Environmental Microbiology 56.
U.S. Department of Agriculture, Economic Research Service (ERS) (1993). "Water Quality Effects of Crop Residue Management." Agricultural Resources: Cropland, Water, and Conservation Situation and Outlook Report, AR No. 30, May.
U.S. Department of Agriculture, Economic Research Service (1997). Agricultural Resources and Environmental Indicators, 1996-97,AHB No. 712, Washington, DC, July.
Agricultural Resources and Environmental Indicators, Chapter 4.2, page 53
U.S. Department of Agriculture, Natural Resources Conservation Service (2000). Summary Report, 1997 National ResourcesInventory. Revised December 2000. (Available on http://www.nhq.nrcs.usda.gov/NRI/1997/summary_report/original/contents.html)
U.S. Department of Agriculture, Soil Conservation Service (1973). Land-Capability Classification (LCC). AH No. 210. Jan.
U.S. Department of Agriculture, Soil Conservation Service (1983). "Application of Soil Information: Soil Interpretations." Part 603. National Soil Handbook.
U.S. Department of Agriculture, Soil Conservation Service (1989a). The Second RCA Appraisal: Soil, Water and Related Resourceson Nonfederal Land in the United States.
U.S. Department of Agriculture, Soil Conservation Service (1989b). Summary Report, 1987 National Resources Inventory. SB No.790. Dec.
U.S. Department of Agriculture, Soil Conservation Service (SCS) (1993). Soil Survey Manual. AH No. 18.
U.S. Department of Agriculture, Soil Conservation Service (1994). Summary Report, 1992 National Resources Inventory. July.
Vesterby, M., and K.S. Krupa (1993). "Effects of Urban Land Conversion on Agriculture." in Urbanization and Development Effectson the Use of Natural Resources, E. Thunberg and J. Reynold (eds.), Southern Rural Development Center and Farm Foundation. SRDC No. 169.
Wagenet, R. J. (1987). "Processes Influencing Pesticide Loss with Water under Conservation Tillage," in T. J. Logan, J. M. Davidson,J. L. Baker, and M. R. Overcash (eds.), Effects of Conservation Tillage on Groundwater Quality: Nitrates and Pesticides. Lewis Pub.,Chelsea, MI, pp. 190-204.
Warkentin, B.P., and H.F. Fletcher (1977). "Soil quality for intensive agriculture," Proceedings of International Seminar on SoilEnvironment and Fertilizer Management. National Institute of Agricultural Science, Tokyo.
Wauchope, R. D. (1987. "Effects of Conservation Tillage on Pesticide Loss with Water." In T. J. Logan, J. M. Davidson, J. L. Baker,and M. R. Overcash [eds.] Effects of Conservation Tillage on Groundwater Quality: Nitrates and Pesticides. Lewis Pub., Chelsea, MI,pp. 205-215.
Wauchope, R. D.,T. M. Buttler, A. G. Hornsby, P. W. M. Augustijn Beckers, and J. P. Burt (1992). “The SCS/ARS/CES PesticideProperties Database for Environmental Decision-making.” Published as Volume 123 of Reviews of Environmental Contamination andToxicology by Springer-Verlag, New York, NY.
Waynne, Thorne D (1978). “Crop Characteristics and Cropping Systems,” in Soil, Water and Crop Production, AVI publishingCompany, Hartford, CT.
Weber, J. B. and R. L. Warren (1993). "Herbicide Behavior in Soils: A Pesticide/Soil Ranking System for Minimizing Ground WaterContamination." Proceedings of the Northeastern Weed Science Society, 47.
Weersink, A., M. Walker, C. Swanton and F.E. Shaw (1992). "Costs of Conventional and Conservation Tillage Systems." Journal ofSoil and Water Conservation. Vol. 47, No. 4.
World Resources Institute (1992). World Resources, 1992-1993. Oxford University Press: Oxford, England.
Young, C. Edwin and James S. Shortle (1984). "Investment in Soil Conservation Structures: The Role of Operator and OperationCharacteristics." Agricultural Economics Research 36:10-15.
Agricultural Resources and Environmental Indicators, chapter 4.2, page 54
Recent ERS Reports Related to Soil Management and Conservation
“Conservation Tillage Firmly Planted in U.S. Agriculture,” Agricultural Outlook, March 2001(Carmen Sandretto). Farmers across the Nation used conservation tillage (no-till, ridge-till, andmulch-till) on more than 109 million acres of farmland in 2000, over 36 percent of U.S. plantedcropland area and up from 26 percent in 1990. Expansion in no-till accounts for most of the growthin conservation tillage in the last decade.
Adoption of Agricultural Production Practices: Lessons Learned from the U.S. Department ofAgriculture Area Studies Project, AER 792, Jan. 2001 (Margriet Caswell et al.). This project lookedat the extent of adoption of nutrient, pest, soil, and water management practices and assessed thefactors that affected adoption for a wide range of management strategies across different naturalresource regions. An operator’s education had a significantly positive effect on his or her adoption ofinformation-intensive technologies, such as the use of biological pest control or nitrogen testing. Ownership had less of an impact on adoption of non-structural practices than expected.
Production Practices for Major Crops in U.S. Agriculture, 1990-97, SB 969, Aug. 2000 ( M.Padgitt, D. Newton, R. Penn, and C. Sandretto). This report presents information on nutrient and pestmanagement practices, crop residue management, and other general crop management practices inuse on U.S. farms. Three-fourths of the cropland acres were treated with commercial fertilizers, and90 percent with at least some pesticides. Eighty-two percent of the crop acreage was in a croprotation. Nearly 80 percent of the surveyed crop acres were scouted for pests, but soil and tissuetesting for pests occurred on less than 5 percent.
Soil Erosion and Conservation in the United States: An Overview, AIB 718, Oct. 1995 (R.Magleby, C. Sandretto, W. Crosswhite, and C.T. Osborn). Soil erosion on agricultural land in theUnited States does not pose an immediate threat to the Nation’s ability to produce food and fiber. However, erosion is impairing long-term productivity in some areas and is the largest contributor tononpoint source pollution of the Nation’s waterways. Over half of the erosion comes from slightlymore than a quarter of total cropland acreage.
Contact: Richard Magleby, 202-694-5615, [email protected].