chapter 4 what is preventing firms from creating more and...
TRANSCRIPT

Questions
• What are the business environment con-straints affecting fi rms in South Asia?
• Do these constraints vary by sector and fi rm characteristics?
• What are the main policy priorities for over-coming the identifi ed business constraints?
Findings
The chapter identifi es constraints facing fi rms and four areas of policy focus.
Constraints
• The most binding constraints facing all types of urban formal firms (where the highest-productivity and highest-paid jobs are) are electricity, corruption, and political instability. Job-creating fi rms are more severely affected than other fi rms by virtually the entire range of constraints. Labor regulations rank high in India, Nepal, and Sri Lanka.
• The rural nonfarm sector is an important route out of low-paid agricultural work. For fi rms in this sector, electricity and political instability also rank high on the list of constraints. Trans-port (poor road quality and inaccessibility) ranks much higher as a constraint for rural fi rms, as it affects access to larger markets.
• Increasing the productivity of informal fi rms is fundamental, as they employ the majority of workers. Electricity is the top constraint for informal urban fi rms in India. Relative to formal urban fi rms, they are less concerned about corruption, taxes, and labor regulations and more concerned about access to land.
• Firms cite inadequate access to finance as one of the top fi ve constraints in every sec-tor; this constraint is particularly severe for
informal fi rms. However, without informa-tion on whether inadequate fi nance refl ects the lack of bankable projects, one cannot infer directly that access to fi nance is a bind-ing constraint. Other evidence suggests that access to fi nance may be an issue for micro and small fi rms in some countries.
Policy focus areas
• The severity of the electricity constraint for all types of fi rms refl ects the large gap in the region between demand for and supply of power. Clos-ing the gap requires a substantial increase in investment, which in turn requires that power sector reforms be sustained and deepened.
• South Asian fi rms face high levels of corrup-tion in a range of interactions with public offi -cials, particularly for utilities and tax inspec-tions. Simplifying processes in, for example, tax administration and reducing unnecessary interaction with local officials could be an effective way of tackling corruption, as it has the additional benefi t of reducing the cost of red tape on fi rms.
• Key policy options for improving access to finance for micro and small firms include strengthening the institutional environment (secured transactions registry, credit informa-tion); creating a conducive environment for downscaling commercial banks and upscal-ing microfi nance institutions; and providing fi nancial literacy and training to micro and small fi rms.
• Easing business registration could benefit potential fi rm entrants. Signifi cant improve-ments in the registration process would help entrepreneurs who were previously in wage employment or out of the labor force start new activities and create new employment.
CHAPTER 4 What Is Preventing Firms from Creating More and Better Jobs?
Questions and Findings
125
4What Is Preventing Firms from
Creating More and Better Jobs?
This chapter looks at the constraints faced by South Asian firms in the manufacturing and service sectors
where, as shown in chapter 3, jobs are more productive and better paid. Addressing con-straints to the operations of fi rms in these sectors is therefore important for creating more and better jobs.
The chapter is organized as follows. The first section describes the methodologi-cal framework. The second section looks at constraints facing fi rms in the urban formal sector. The third section extends the analysis to the rural nonfarm and urban informal sectors. The fourth section suggests policy options for overcoming the most binding constraints. The last section examines the regulatory constraints faced by potential fi rm entrants.
Methodological framework
This chapter is based on fi ndings from three background studies by Carlin and Schaf-fer (2011a, 2011b, 2011c), who draw on 30 country enterprise surveys, covering more than 26,000 fi rms, conducted in South Asia between 2000 and 2010.1 The method-ological approach taken to identify binding business environment constraints uses the reported severity of constraints and reported
mitigation behaviors by fi rms in the enter-prise surveys. The business environment is considered external to the fi rm; its compo-nents resemble public goods and are consid-ered common to all fi rms in the economy.
All enterprise surveys include a standard question that asks firms to rate the sever-ity of different business environment con-straints.2 The question takes the form: “How much of an obstacle is X to the operation and growth of your business?” The firm’s response regarding its severity, rated on a fi ve-point scale, with 0 being no obstacle and 4 being a very severe obstacle, is a measure of the marginal cost imposed by the constraint on the operation and growth of its business. The cost can be interpreted as the difference between the fi rm’s profi t in the hypothetical situation in which the business environment poses no obstacle to the firm’s operations and the fi rm’s actual profi t given the existing quality of the business environment.
Differences in firms’ perceptions of the severity of constraints and mitigation behav-iors refl ect the different costs of the constraint to fi rms, which may refl ect differences in the quality of the business environment faced by fi rms or differences in the fi rms’ charac-teristics. Differences in fi rm characteristics are more likely if the business environment is shared. For example, almost all firms in
1 2 6 M O R E A N D B E T T E R J O B S I N S O U T H A S I A
Afghanistan, Bangladesh, and Nepal report at least one power cut per month, but the valuations of the electricity constraint vary across firms. A higher-productivity firm should report higher severity of a constraint than a lower-productivity fi rm, because the marginal cost/forgone profi ts are higher. The data confi rm this prediction.
In addition to subjective perceptions of the severity of constraints, this chapter examines objective measures, such as the frequency of power outages and mitigation behaviors, including the use of generators and payment of bribes. Mitigation behaviors are a fi rm’s reaction to the poor quality of the business environment. According to Carlin and Schaf-fer’s methodological framework (2011c), expenditures on mitigation behavior are decreasing in the quality of the external busi-ness environment (the better the environment, the less mitigation is needed) and increasing in the productivity of the fi rm (more produc-tive fi rms undertake more mitigation actions, because their marginal costs/forgone profi ts are higher). The fi ndings from these objective measures are largely consistent with those from the analysis of subjective constraints: countries in which fi rms report higher sever-ity of the electricity constraint also report higher frequency of power outages.
The average reported severity of con-straints and the average reported level of mitigation activities are measured for a “benchmark fi rm” in each country individu-ally and for the region as a whole (by pooling the country sample data), in order to account for differences in the composition of firms in the enterprise surveys and facilitate cross-country comparisons. A benchmark fi rm is a medium-size manufacturing fi rm with 30 employees that is domestically owned, does not export or import, is located in a large city, and did not expand employment in the pre-ceding three years. The reported severity of each element of the business environment was regressed on the fi rm’s characteristics. Hence, the average reported severity of a constraint for a benchmark fi rm is a conditional mean for the period covered by the surveys avail-able for each country (2000–10). The country surveys were pooled across time to generate
sufficiently large samples to analyze. The sample size of individual surveys generally did not allow analysis of how the reported sever-ity of constraints changed over time.
The ranking of constraints for individual countries as well as the region as a whole guides the prioritization of constraints to tackle. Some countries, notably India, report lower absolute levels of severity of constraints across the board. It is unlikely that there are no significant business environment con-straints in India. Therefore, it is important to look at the ranking of constraints, not just the reported absolute severity level.
The average severity of constraints reported by a benchmark fi rm in the urban formal sector is compared across countries at similar levels of per capita gross domestic product (GDP).3 These data indicate whether the severity reported by South Asian fi rms is greater than expected given their country’s level of development.
The framework reveals how the reported level of severity (and ranking) of constraints and mitigation activities varies for nonbench-mark fi rms (for example, how the reported severity of constraints changes with fi rm size, sector, location, formality, history of job cre-ation, and so forth). This book is particularly interested in fi rms that expanded employment in the past three years (job-creating firms), because identifying and addressing constraints to their operations and growth is likely to lead to the creation of more and better jobs.
Application of methodology to rural nonfarm and informal fi rms
One of the main drawbacks of standard enterprise surveys is that their sampling frames are generally limited to the formal urban sector. This bias is problematic in South Asia, given the high levels of informal-ity. Enterprise surveys also omit the rural nonfarm sector, an important source of bet-ter jobs in South Asia. The constraints anal-ysis is conducted here for four South Asian countries that conducted enterprise surveys of the rural nonfarm and informal sectors.
For the rural nonfarm sector, the analysis examines the severity of constraints reported

W H A T I S P R E V E N T I N G F I R M S F R O M C R E A T I N G M O R E A N D B E T T E R J O B S ? 1 2 7
by a benchmark fi rm in Bangladesh, Pakistan, and Sri Lanka, where rural enterprise surveys have been conducted.4 These results are then compared with those of an urban benchmark fi rm in these countries.
For the urban informal sector, the severity of constraints reported by benchmark fi rms is compared with that of the urban formal sector. (The informal survey in India was the only one with a large enough sample size to facilitate this comparison. The comparison is therefore limited to India’s formal and infor-mal urban manufacturing sector.5)
Rural nonfarm and informal sector fi rms are typically microenterprises: in the surveys, the median employment in rural nonfarm sector fi rms in Bangladesh, Pakistan, and Sri Lanka is 1.5 (compared with a median of 35 employees in the urban formal sector in these countries); in India, the median employment in the informal (urban) survey is 4 (compared with 20 for all fi rms in the urban formal sec-tor). As the median size of fi rms in the rural and informal sectors is much smaller, the benchmark firm in the rural nonfarm and informal sector analyses is defi ned as having fi ve employees.6
In the analysis of the rural nonfarm and informal sectors, the focus is on the con-straints to the benchmark firm, which is a nonexpanding fi rm. The average rural and informal sector firm reported very little employment growth:
• In the Bangladesh rural survey, 81 per-cent of firms experienced no growth in employment between 2005 and 2007 (World Bank 2008c).
• In the survey of informal fi rms conducted in India in 2005, 40 percent of fi rms had not grown since they started operations (Ferrari and Dhingra 2009).
• In the Sri Lanka rural survey, 90 percent of firms had not increased employment the previous year (World Bank 2005).
For this reason, it was not possible to ana-lyze the constraints facing an expanding fi rm in these sectors.
Even if addressing the constraints reported for a benchmark fi rm in the rural nonfarm
and informal sectors does not lead to substan-tial creation of new jobs, it is still important for increasing the productivity and job qual-ity of a large proportion of existing workers in manufacturing and services.
Limitations of the methodology
The methodology allows the costs of differ-ent business environment constraints to be assessed and compared. Two constraints that many fi rms in South Asia frequently report as severe—access to fi nance and tax rates—cannot be analyzed in the same framework as the others, as neither has the character of a public good. Even when the fi nance sys-tem is working well, one would expect that access to fi nance would be a constraint to potential borrowers with low-quality proj-ects. Indeed, less productive firms report more severe problems with access to fi nance. A high reported severity does not necessarily mean that access to fi nance is a problem or that increasing access to fi nance would nec-essarily boost output and productivity.
With respect to taxes, managers do not take into account the social benefi ts of taxation. In virtually all countries, irrespective of their level of development, managers consider high tax rates a constraint, but cutting taxation is not a priority everywhere. As the reported severity cannot be used to assess whether access to fi nance and tax rates are binding constraints, other indicators of the fi nancial sector and tax system are examined.
A second limitation with the methodol-ogy is that it identifi es binding constraints to existing fi rms. It does not identify constraints facing potential entrants. Regulatory con-straints faced by potential entrants are exam-ined later in this chapter.
Constraints in the urban formal sector
This section examines constraints fac-ing urban formal sector fi rms. It compares benchmark fi rms across countries and iden-tifi es the constraints facing both expanding/job-creating fi rms and other types of non-benchmark fi rms.

1 2 8 M O R E A N D B E T T E R J O B S I N S O U T H A S I A
Constraints facing benchmark fi rms
The three most common binding constraints facing urban formal fi rms in South Asia are electricity, corruption, and political instabil-ity (fi gure 4.1 and table 4.1). Although the ranking of these constraints varies across countries, most countries identify the same top three constraints. In every country except Bhutan and Maldives, electricity is one of the top two constraints. It is the
highest-ranked constraint in India and Sri Lanka. Political instability is among the top three constraints in all five countries where it was included in the survey except Bhutan. This fi nding is not surprising given that South Asia contains some of the most confl ict-affected areas in the world. In fi ve of the eight countries, corruption is among the top four constraints.
Though not as binding as electricity, corruption, and political instability, tax administration is a severe concern in some countries, especially India and Pakistan. Labor regulations are important in Bhutan, India, Sri Lanka, and Nepal. (Chapter 6 analyzes labor regulations and other labor market institutions in more detail). Firms in most countries report tax rates and access to fi nance as one of the top fi ve most severe constraints. However, because of endogeni-ety issues described in the methodology, their reported severity cannot be interpreted in the same way as the other constraints or ranked alongside them.
Given the heterogeneous nature of India, separate analyses of firm constraints were conducted for higher- and lower-income states (see annex 4A).7 The top three constraints (corruption, electricity, and tax administra-tion) are the same for low- and high-income states. Firms in low-income states complain more about inadequate physical infrastruc-ture (electricity, transport, access to land) and crime; fi rms in high-income states com-plain more about policy uncertainty and labor regulation. These results parallel cross-country results that show that fi rms in poor countries tend to complain more about physi-cal infrastructure and fi rms in rich countries complain more about labor regulation (Carlin and Schaffer 2011b).
Electricity Most South Asian countries rank electricity as one of the top constraints. The reported severity of the constraint in Afghanistan, Bangladesh, and Nepal is higher than in other countries at similar GDP levels and among the highest in the world. The down-ward slope in fi gure 4.2 implies that although
FIGURE 4.1 Severity of constraints reported by South Asian
benchmark fi rm in the urban formal sector
Source: Authors, based on Carlin and Schaff er 2011b (from World Bank enterprise surveys).Note: A benchmark fi rm is a medium-size manufacturing fi rm with 30 employees that is domesti-cally owned, does not export or import, is located in a large city, and did not expand employment in the preceding three years. Analysis is based on pooled sample of enterprise surveys conducted between 2000 and 2010. The severity of constraint is rated by fi rms on a 5-point scale, with 0 being no obstacle, 1 being a minor obstacle, 2 being a moderate obstacle, 3 being a major obstacle, and 4 being a very severe obstacle. Access to fi nance and tax rates constraints are excluded.
South Asian benchmark firm
0.7
0.9
0.9
1.0
1.0
1.1
1.1
1.1
1.2
1.2
1.3
1.4
1.7
1.8
2.2
2.6
0 1 2 3
telecoms
courts
business licensing
transport
labor regulations
inadequately
educated labor
customs
access to land
crime, theft, and
disorder
competition
macro instability
government policy
uncertainty
tax administration
corruption
electricity
political instability
severity of constraint

W H A T I S P R E V E N T I N G F I R M S F R O M C R E A T I N G M O R E A N D B E T T E R J O B S ? 1 2 9
TABLE 4.1 Top fi ve constraints reported by South Asian benchmark fi rm in the urban formal sector, by country
South Asia region Afghanistan Bangladesh Bhutan India Maldives Nepal Pakistan Sri Lanka
Electricity 2 2 1 1 2 2 1
Political instability 1 1 2 n.a. n.a. 1 3 n.a.
Corruption 3 3 3 2 3 4
Tax administration 4 5 5 3 1
Labor regulations 3 4 5 5
Inadequately educated labor 2 5 2
Access to land 4 4 1
Transport 1 3
Government policy
uncertainty 5 4 2
Courts 4 5
Crime, theft, and disorder 5 5
Business licensing 4
Macro instability 3
Competition 4
Source: Authors, based on Carlin and Schaff er 2011b (from World Bank enterprise surveys).Note: A benchmark fi rm is a medium-size manufacturing fi rm with 30 employees that is domestically owned, does not export or import, is located in a large city, and did not expand employment in the preceding three years. n.a. = Not applicable (question was not asked). Analysis is based on pooled sample of enterprise surveys conducted between 2000 and 2010. Access to fi nance and tax rates constraints are excluded.
FIGURE 4.2 Cross-country comparisons of reported severity of the electricity constraint
Afghanistan
Bangladesh
Nepal3
4 Electricity
Bhutan
India
Sri Lanka
Maldives
Pakistan
0
1
2
seve
rity
of c
on
stra
int
6 7 8 9 10 11
log of per capita GDP in purchasing power parity dollars
Source: Carlin and Schaff er 2011b (based on World Bank enterprise surveys).Note: The cross-country regression line shows the relationship between the reported severity of the constraint for a benchmark fi rm and the log of per capita GDP. The shaded area is the 95 percent confi dence interval band around the regression line. Vertical bars show confi dence intervals of 95 percent around the reported severity of the constraint for countries in South Asia. The lack of overlap between the South Asian country confi dence interval and the regression line confi dence interval is a conservative test of the statistically signifi cant diff erence between the reported severity of a constraint for the South Asian country and the average reported severity of constraint for countries at the same level of per capita GDP. The reported severity could still be signifi cantly diff erent even when there is an overlap. Analysis is based on pooled sample of enterprise surveys conducted between 2000 and 2010. The severity of constraint is rated by fi rms on a 5-point scale, with 0 being no obstacle, 1 being a minor obstacle, 2 being a moderate obstacle, 3 being a major obstacle, and 4 being a very severe obstacle.

1 3 0 M O R E A N D B E T T E R J O B S I N S O U T H A S I A
Afghanistan
Bangladesh
Nepal100
Bhutan
India
Sri LankaMaldives
Pakistan
0
20
40
60
80
per
cen
t o
f firm
s aff
ecte
d b
y at
leas
t o
ne
po
wer
ou
tag
e a
mo
nth
6 7 8 9 10 11log of per capita GDP in purchasing power parity dollars
Source: Carlin and Schaff er 2011b (based on World Bank enterprise surveys).Note: The cross-country regression line shows the relationship between the percentage of fi rms experiencing more than one power outage per month and the log of per capita GDP. The percentage of fi rms is a conditional mean for benchmark fi rms in each country. As the conditional means are calculated by holding constant the eff ects of the fi rm controls (fi rm characteristics) using a simple linear procedure, the eff ect of this can be, for unconditional country values that are at or close to 0 percent or 100 percent, to push the conditional mean under 0 percent or over 100 percent. The shaded area is the 95 percent confi dence interval band around the regression line. Vertical bars show confi dence intervals of 95 percent around the percentage of fi rms experiencing power outages for countries in South Asia. The lack of overlap between a South Asian country confi dence interval and the regression line confi dence inter-val is a conservative test of the statistically signifi cant diff erence between the share of fi rms experiencing power outages in the South Asian country and the average share of fi rms experiencing power outages in countries at the same level of per capita GDP. The share of fi rms could still be signifi cantly diff erent even when there is an overlap. Analysis is based on pooled sample of enterprise surveys conducted between 2000 and 2010.
FIGURE 4.3 Cross-country comparisons of power outages
fi rms in richer countries can be expected to make more demands on the electricity grid, which would lead to rising severity of com-plaints, those countries are better able to meet increased demand, resulting in lower levels of reported severity at higher incomes per capita. The severity of the constraint increased over time in India (between 2005 and 2010), Nepal (between 2000 and 2009), and Pakistan (between 2002 and 2007 and between 2007 and 2010).
This analysis covers only the urban for-mal sector. Electricity is also one of the top binding constraints in the rural nonfarm and informal sectors, as discussed later in this chapter.
Reported frequency of power outages—a direct fi rm-level estimate of the shared busi-ness environment—is consistent with the reported severity of the constraint. Indeed, in
Afghanistan, Bangladesh, and Nepal, virtu-ally 100 percent of fi rms experience outages (fi gure 4.3). In Bangladesh, urban fi rms face an average of 98.5 power outages a month—more than three a day (World Bank 2008c). Predictably, the use of generators to miti-gate the effects of uncertain power supply is higher in South Asia than elsewhere, with 87 percent of fi rms in Afghanistan, 52 percent in Sri Lanka, and 49 percent in India having generators.
The high reported severity of the electricity constraint and level of power outages refl ect the signifi cant demand-supply gap in electric-ity across the region caused by the failure of electricity supply to expand rapidly enough to keep up with robust economic and popula-tion growth (box 4.1).
The unreliability of power supply and the frequency of power outages causes fi rms to

W H A T I S P R E V E N T I N G F I R M S F R O M C R E A T I N G M O R E A N D B E T T E R J O B S ? 1 3 1
Access to and consumption of electricity are low in South Asia, where some 600 million people—more than 40 percent of the worldwide total—lack access to electricity. Access rates range from 44 percent of the population in Nepal to 77 percent in Sri Lanka (box table 4.1.1). Annual per capita electricity consump-tion is highest in Bhutan (1,174 kilowatts [KWh]) and lowest in Nepal (KWh 89). India consumes 566 KWh, Pakistan 436 KWh, and Sri Lanka 409 KWh. The average annual per capita consumption for the region is 500 KWh—lower than in Africa (513 KWh) and China (2,500 KWh) and just 3.8 percent of con-sumption in the United States (13,000 KWh) (World Bank 2011e).
Robust economic and population growth over the past two decades have led to rapidly rising energy demand. Although the 2008 global fi nancial crisis slowed economic activity, regional growth prospects remain strong, with annual growth forecast to aver-age 6 percent until 2015 (IMF 2010). Electricity consumption is likely to increase at an annual rate of about 6.0 percent in Bangladesh, 7.0 percent in India, and 8.8 percent in Pakistan, the region’s larg-est power markets (by comparison, annual growth in Organisation for Economic Co-operation and Development countries is projected at 0.7 percent).
The demand-supply gap is particularly wide in some countries. In addition, industrial consumers typically pay high tariffs and cross-subsidize other consumer categories. In Bangladesh, the gap is esti-mated to be 1,000 megawatts (MW). About 90 percent of generation is fired by gas, which itself is in short supply. Power outages are estimated to cost Bangladesh about $1 billion a year, reducing GDP growth by about 0.5 percent (USAID 2007). In India, the gap between peak demand and supply is about 10 percent (World Bank 2010a). Industrial consumers in India pay 30–60 percent above the
average level of tariffs, subsidizing agricultural and domestic consumers (KPMG 2009). Nepal’s grid-connected installed generation capacity stands at 698 MW, but available capacity falls to nearly one-third of installed capacity during the dry sea-son. Peak demand stands at 885 MW, and consum-ers face 16 hours of load shedding in dry winter months. In Pakistan, installed capacity is about 22 gigawatts (GW), but technical problems, includ-ing lack of fuel and inadequate maintenance of public sector thermal generation companies over prolonged periods, reduced actual available capac-ity to 18 GW in 2010. Electricity demand exceeds supply by about 2–4 GW, and rolling blackouts can stretch up to 8–10 hours a day. The Ministry of Finance estimates the cumulative effect of the energy crisis on the economy at more than 2 per-cent of GDP (Government of Pakistan 2010). An independent study conducted in 2008 estimated the cost of industrial load shedding to the economy at PRs. 210 billion, resulting in the loss of 400,000 jobs and $1 billion worth of exports (IIP 2009). Industrial consumers typically pay high tariffs, subsidizing other consumers. The share of indus-trial consumption is about 26 percent, but indus-tries contributed 30 percent to revenue, indicating the extent of cross-subsidy. In Sri Lanka, the aver-age customer paid $0.12/KWh in 2009, consider-ably more than the average tariff in Bangladesh, India, Pakistan, or Thailand of $0.05–$0.09/KWh
(World Bank 2010b).Sector fi nancial losses across the region are high,
largely as a result of the misalignment of tariffs with the cost of supply and high transmission and distri-bution losses, which arise from theft, faulty meter-ing, and poor technology in transmitting power. The total sector defi cit in Bangladesh amounts to almost $300 million a year. In India, the combined
BOX 4.1 Electricity challenges facing South Asia
(continues next page)
lose production and incur high costs of self-generation. Firms in South Asia lose a larger share of their output to power losses than fi rms in other regions—10.7 percent of sales for the region as a whole, up to 27 percent for Nepal—and spend more on generators
(table 4.2). In addition to using generators, there is growing evidence that to cope with unreliable supply, firms adopt second-best production technologies, which imply large efficiency gaps (Alby, Dethier, and Straub 2010). The persistent shortage of electricity

1 3 2 M O R E A N D B E T T E R J O B S I N S O U T H A S I A
TABLE 4.2 Electricity constraints faced by fi rms, by developing region
Region/country
Percentage of fi rms
citing electricity
as major or severe
constraint
Average total
time of power outages
per month
Value lost due to
power outages
(percent of sales)
Percentage of fi rms
owning generators
Africa 49.7 69.5 6.2 42.2
East Asia and Pacifi c 24.1 14.4 3.1 29.6
Eastern Europe and Central Asia 35.1 23.3 3.8 16.9
Latin America and the Caribbean 39.0 8.7 4.2 19.5
Middle East and North Africa 42.9 45.9 5.6 36.3
South Asia 53.4 139.4 10.7 42.8
Afghanistan 66.2 280.3 6.4 71.1
Bangladesh 78.4 113.2 10.6 52.3
Bhutan 5.8 8.5 4.3 17.8
India 32.0 — 6.6 41.4
Nepal 75.6 226.2 27.0 15.7
Pakistan 74.5 69.0 9.2 26.3
Sri Lanka 41.3 — — 75.1
Source: World Bank Enterprise Surveys. Note: Regional averages are unweighted. Country averages are unconditional (that is, not for the benchmark fi rm). — = Not available.
cash loss of state-owned distribution companies rose by nearly $22 billion a year, $9 billion attrib-utable to transmission and distribution losses and the rest attributable to tariffs that did not cover the cost of generation (Mint 2011). The annual sector defi cit in Pakistan resulting from noncollection by
distribution companies and below-cost recovery tariff is estimated at about $2 billion. These defi cits are met through subsidy payments by the govern-ment, short-term borrowing by companies, and the accumulation of receivables and payables on bal-ance sheets.
BOX 4.1 Electricity challenges facing South Asia (continued)
BOX TABLE 4.1.1 Selected energy indicators in South Asia, by country
Country
Per capita
electricity
consumption
(KWh per capita)
Percentage
of population
with access to
electricity
Installed
capacity
(MW)
Estimated defi cit or surplus Estimated investment
required in the medium
term (billions of dollars)MW Percent
Bangladesh 208 49 6,727 –1,000 –13 15.0 (2015)
Bhutan 1,174 56 1,498 +1,300 +15 3.1 (2020)
India 566 66 159,000 –15,700 –13 280.0 (2015)
Nepal 89 44 698 –200 –30 —
Pakistan 436 62 22,000 –4,500 –20 32.5 (2020)
Sri Lanka 409 77 2,684 +800 +30 10.0 (2020)
Sources: Data on access to electricity and per capita electricity consumption data are from International Energy Agency database 2010. Data on estimated supply gaps and investment requirements are from the following sources: Bangladesh, India, and Pakistan: World Bank 2010a; Bhutan: Bhutan Electricity Authority (http://www.bea.gov.bt); Nepal: Banerjee, Singh, and Samad 2011; Pakistan: Trimble, Yoshida, and Saqib 2011; Sri Lanka: Ceylon Electricity Board 2009; World Bank, 2011d.Note: Data are for most recent year available. — = Not available.

W H A T I S P R E V E N T I N G F I R M S F R O M C R E A T I N G M O R E A N D B E T T E R J O B S ? 1 3 3
for industrial and commercial activities is likely to be a major factor limiting the com-petitiveness of fi rms and dampening employ-ment growth.8
Corruption Corruption is the abuse of power, usually for personal gain or the benefi t of a group to which allegiance is owed. Corruption in government is defi ned as the abuse or mis-use of public offi ce or authority for private gain and benefi t that occurs at the interface of the public and private sectors.
Corruption poses serious challenges to development: it undermines democracy and good governance by subverting formal pro-cesses, reduces accountability and representa-tion in policymaking, and erodes the institu-tional capacity of government as procedures are disregarded (Dininio, Kpundeh, and Leiken 1988). It may also create distortions and ineffi ciencies by diverting public invest-ment away from priorities and into sectors and projects where kickbacks are more likely. Corruption also shields fi rms with access to infl uence from competition and may prevent small companies from growing.
Measuring the impact of corruption on fi rms is challenging because of the diffi culty of causal attribution and the fact that corrup-tion data are subject to measurement error. Some observers claim that corruption reduces costs by cutting through red tape. In fact, corruption may increase red tape, in order to allow public offi cials to obtain more bribes. A survey of the literature on econometric studies that analyze the economic costs of corruption suggests that corruption is bad for economic growth and bad for a number of factors that tend to be correlated with economic growth: domestic investment, the quantity and com-position of foreign direct investment, gov-ernment expenditures on health and educa-tion, the quantity and quality of government investment in infrastructure, and the returns to business and trade. Whatever the econo-metric and data problems of measuring the impact of corruption on fi nal outcomes such as growth, corruption affects the perceptions of businesses, which in turn leads them to be
more cautious regarding decisions to invest, expand, and hire.
The importance of corruption as a con-straint for fi rms is refl ected in both the high reported severity of the corruption constraint and the high prevalence of bribes. The rela-tionship between the reported severity of the corruption constraint and per capita GDP is characterized by low levels and low variation in rich countries and higher levels and more variation in low- and middle-income coun-tries (figures 4.4 and 4.5). Bhutan and Sri Lanka have lower levels of reported severity of the corruption constraint than is typical at their level of per capita GDP. Of the fi ve countries in which corruption was among the top five constraints (Afghanistan, Bangla-desh, India, Maldives, and Nepal), only Ban-gladesh has higher levels of reported severity than typical for countries at the same level of per capita GDP.
The data on the prevalence of bribes are consistent with those on corruption. Firms in Bangladesh report a very high prevalence of bribe payments in absolute and relative terms. Pakistan also has a higher preva-lence of bribes than is typical at its level of per capita GDP.
The high reported severity and prevalence of bribes is fairly consistent with the Cor-ruption Perceptions Index 2010 reported by Transparency International (2010), which ranks (out of 178 countries) Afghanistan at 176, Bangladesh at 134, and Pakistan at 143 (India is 87). Box 4.2 describes in more detail the nature of corruption in South Asia.
South Asian fi rms report signifi cant costs associated with corruption, including direct costs (for example, the value of bribes paid) and indirect costs (for example, management time spent dealing with offi cials). Enterprises in Afghanistan pay more than 2 percent of their sales as bribes (World Bank 2008a). Firms in India report spending an average of 2.2 percent of sales on informal payments and an average 8.1 percent of managers’ time dealing with government (Ferrari and Dhingra 2009).
Corruption also distorts the economy by creating an unlevel playing field. The

1 3 4 M O R E A N D B E T T E R J O B S I N S O U T H A S I A
FIGURE 4.5 Cross-country comparison of bribe payments
Source: Carlin and Schaff er 2011b (based on World Bank enterprise surveys).Note: The cross-country regression line shows the relationship between the percentage of fi rms reporting having made bribe payments and the log of per capita GDP. The percentage of fi rms is a conditional mean for benchmark fi rms in each country. As the conditional means are calculated by holding constant the eff ects of the fi rm controls (fi rm characteristics) using a simple linear procedure, the eff ect of this can be, for unconditional country values that are at or close to 0 percent or 100 percent, to push the conditional mean under 0 percent or over 100 percent. The shaded area is the 95 percent confi dence interval band around the regression line. Vertical bars show confi dence intervals of 95 percent around the percentage of fi rms reporting having made bribe pay-ments for countries in South Asia. The lack of overlap between a South Asian country confi dence interval and the regression line confi dence interval is a conservative test of the statistically signifi cant diff erence between the share of fi rms reporting having made bribe payments in the South Asian country and the average share of fi rms reporting having made bribe payments in countries at the same level of per capita GDP. The share of fi rms could still be signifi -cantly diff erent even when there is an overlap. Analysis is based on a pooled sample of enterprise surveys conducted between 2000 and 2010.
Afghanistan
Bangladesh
Bhutan
India
Sri Lanka
Maldives
Nepal
Pakistan
0
20
40
60
80
100
% o
f firm
s re
po
rtin
g h
avin
g m
ade
bri
be
pay
men
ts
6 7 8 9 10 11
log of per capita GDP in purchasing power parity dollars
FIGURE 4.4 Cross-country comparison of reported severity of corruption constraint
Source: Carlin and Schaff er 2011b (based on World Bank enterprise surveys).Note: The cross-country regression line shows the relationship between the reported severity of the constraint for a benchmark fi rm and the log of per capita GDP. The shaded area is the 95 percent confi dence interval band around the regression line. Vertical bars show confi dence intervals of 95 percent around the reported severity of the constraint for countries in South Asia. The lack of overlap between the South Asian country confi dence interval and the regression line confi dence interval is a conservative test of the statistically signifi cant diff erence between the reported severity of a constraint for the South Asian country and the average reported severity of constraint for countries at the same level of per capita GDP. The reported severity could still be signifi -cantly diff erent even when there is an overlap. Analysis is based on pooled sample of enterprise surveys conducted between 2000 and 2010. The severity of constraint is rated by fi rms on a 5-point scale, with 0 being no obstacle, 1 being a minor obstacle, 2 being a moderate obstacle, 3 being a major obstacle, and 4 being a very severe obstacle.
Afghanistan
Bangladesh
Bhutan
India
Sri Lanka
Maldives
Nepal
Pakistan
0
1
2
3
4
seve
rity
of c
on
stra
int
6 7 8 9 10 11
log of per capita GDP in purchasing power parity dollars
W H A T I S P R E V E N T I N G F I R M S F R O M C R E A T I N G M O R E A N D B E T T E R J O B S ? 1 3 5
BOX 4.2 Corruption in South Asia
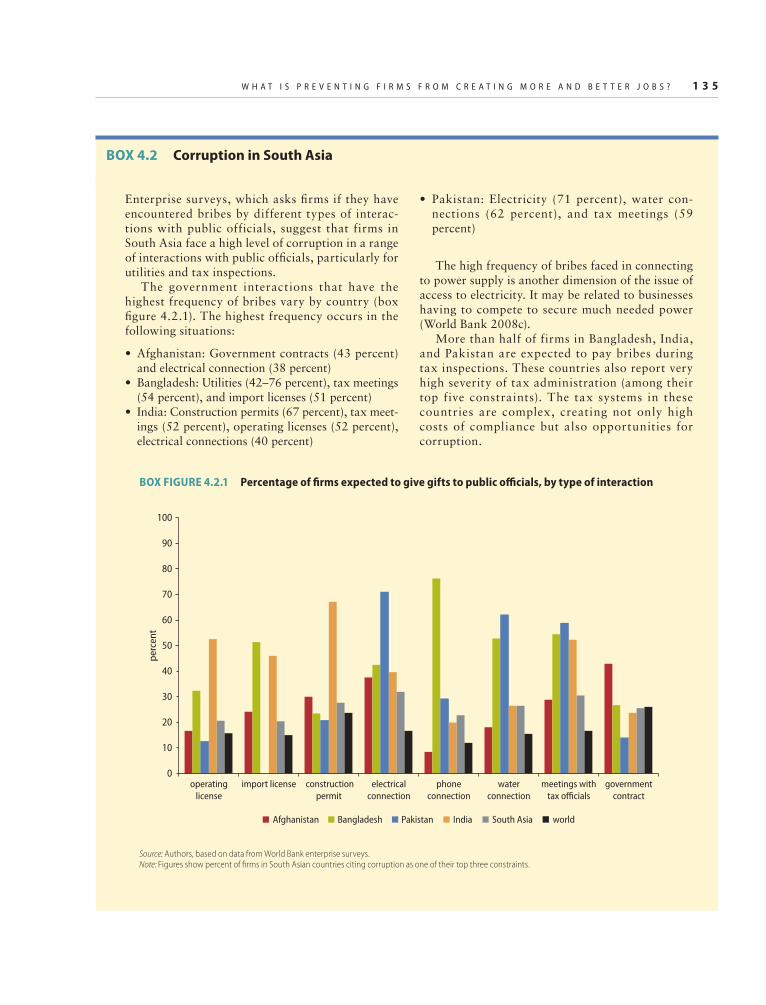
Enterprise surveys, which asks fi rms if they have encountered bribes by different types of interac-tions with public officials, suggest that firms in South Asia face a high level of corruption in a range of interactions with public offi cials, particularly for utilities and tax inspections.
The government interactions that have the highest frequency of bribes vary by country (box fi gure 4.2.1). The highest frequency occurs in the following situations:
• Afghanistan: Government contracts (43 percent) and electrical connection (38 percent)
• Bangladesh: Utilities (42–76 percent), tax meetings (54 percent), and import licenses (51 percent)
• India: Construction permits (67 percent), tax meet-ings (52 percent), operating licenses (52 percent), electrical connections (40 percent)
• Pakistan: Electricity (71 percent), water con-nections (62 percent), and tax meetings (59 percent)
The high frequency of bribes faced in connecting to power supply is another dimension of the issue of access to electricity. It may be related to businesses having to compete to secure much needed power (World Bank 2008c).
More than half of firms in Bangladesh, India, and Pakistan are expected to pay bribes during tax inspections. These countries also report very high severity of tax administration (among their top five constraints). The tax systems in these countries are complex, creating not only high costs of compliance but also opportunities for corruption.
Source: Authors, based on data from World Bank enterprise surveys.Note: Figures show percent of fi rms in South Asian countries citing corruption as one of their top three constraints.
BOX FIGURE 4.2.1 Percentage of fi rms expected to give gifts to public offi cials, by type of interaction
0
10
20
30
40
50
60
70
80
90
100
per
cen
t
operating
license
import license construction
permit
electrical
connection
phone
connection
water
connection
meetings with
tax officials
government
contract
Afghanistan Bangladesh Pakistan India South Asia world

1 3 6 M O R E A N D B E T T E R J O B S I N S O U T H A S I A
FIGURE 4.6 Cross-country comparison of reported severity of political instability constraint
Source: Carlin and Schaff er 2011b (based on World Bank enterprise surveys).Note: The cross-country regression line shows the relationship between the reported severity of the constraint for a benchmark fi rm and the log of per capita GDP. The shaded area is the 95 percent confi dence interval band around the regression line. Vertical bars show confi dence intervals of 95 percent around the reported severity of the constraint for countries in South Asia. The lack of overlap between the South Asian country confi dence interval and the regression line confi dence interval is a conservative test of the statistically signifi cant diff erence between the reported severity of a constraint for the South Asian country and the average reported severity of constraint for countries at the same level of per capita GDP. The reported severity could still be signifi -cantly diff erent even when there is an overlap. Analysis is based on a pooled sample of enterprise surveys conducted between 2000 and 2010. The severity of constraint is rated by fi rms on a 5-point scale, with 0 being no obstacle, 1 being a minor obstacle, 2 being a moderate obstacle, 3 being a major obstacle, and 4 being a very severe obstacle. Enterprise surveys in India, Maldives, and Sri Lanka did not ask fi rms about political instability.
Afghanistan
Bangladesh
Bhutan
Nepal
Pakistan
0
1
2
3
4
seve
rity
of c
on
stra
int
6 7 8 9 10
log of per capita GDP in purchasing power parity dollars
constraints analysis finds that expanding/job-creating firms, manufacturing firms, importing and exporting firms, and firms in larger cities are more constrained by cor-ruption than other fi rms. The greater sever-ity probably refl ects the greater use of public services, such as electricity for manufacturing fi rms; higher levels of interactions with pub-lic offi cials (to, for example, obtain import licenses); and the fact that larger cities have higher concentrations of economic resources. These firms are also the most productive, making the opportunity cost of corruption—goods and services not produced because of resources and time dedicated to overcoming corruption activities—even higher. The India investment climate assessment (Ferrari and Dhingra 2009) indicates that manufactur-ing firms on average pay a higher percent-age of sales in bribes and spend more time
on average dealing with government offi-cials than do service firms (manufacturing fi rms reportedly pay 4.9 percent of sales in and devote 12.6 percent of managers’ time to bribes). In Pakistan, manufacturing fi rms are also more likely than service fi rms to pay bribes across a range of interactions with public offi cials.
Political instability In the fi ve countries in which surveys asked about the political instability constraint (Afghanistan, Bangladesh, Bhutan, India, Nepal, and Pakistan), all except Bhutan reported it as one of the top three constraints. The reported costs of political instability are higher in Afghanistan, Bangladesh, and Nepal than in other countries at similar lev-els of per capita GDP (fi gure 4.6). These three countries have some of the highest reported

W H A T I S P R E V E N T I N G F I R M S F R O M C R E A T I N G M O R E A N D B E T T E R J O B S ? 1 3 7
FIGURE 4.7 Cross-country comparison of reported severity of tax administration constraint
Source: Carlin and Schaff er 2011b (based on World Bank enterprise surveys).Note: The cross-country regression line shows the relationship between the reported severity of the constraint for a benchmark fi rm and the log of per capita GDP. The shaded area is the 95 percent confi dence interval band around the regression line. Vertical bars show confi dence intervals of 95 percent around the reported severity of the constraint for countries in South Asia. The lack of overlap between the South Asian country confi dence interval and the regression line confi dence interval is a conservative test of the statistically signifi cant diff erence between the reported severity of a constraint for the South Asian country and the average reported severity of constraint for countries at the same level of per capita GDP. The reported severity could still be signifi -cantly diff erent even when there is an overlap. Analysis is based on a pooled sample of enterprise surveys conducted between 2000 and 2010. The severity of constraint is rated by fi rms on a 5-point scale, with 0 being no obstacle, 1 being a minor obstacle, 2 being a moderate obstacle, 3 being a major obstacle, and 4 being a very severe obstacle.
Afghanistan
Bangladesh
BhutanIndiaSri Lanka
Maldives
Nepal
Pakistan
0
1
2
3
4
6 7 8 9 10 11
log of per capita GDP in purchasing power parity dollars
seve
rity
of c
on
stra
int
costs of political instability in the world. (Chapter 7 examines the effect of armed confl ict, which is one key aspect of political instability, on fi rms and workers.)
Tax administrationTax administration is a major issue in some countries in South Asia (table 4.1). It is the top-ranked constraint in Pakistan, where the reported severity is above the average for countries at similar levels of per capita GDP (fi gure 4.7). As annex 4B shows, many tax systems in South Asia are complex, making tax compliance very costly for fi rms.
Tax ratesTaxes matter to business and individuals. Businesses and people talk about them, complain about them, and often try to avoid paying them when they can. Taxation also affects the ways in which businesses
organize their activities and produce goods and services, which in turn affects the struc-ture of taxation (Bird and Zolt 2007).
Firms in India and Pakistan report tax rates as their top constraint in terms of sever-ity; Sri Lankan fi rms report tax rates to be the third-most severe constraint. However, as explained in the methodology, one cannot directly infer the real cost of the constraint from the reported severity. Other measures have been used to assess whether tax rates are indeed a binding constraint (see annex 4B).
It seems likely that it is the complexity and lack of uniformity of tax systems rather than the tax rates themselves that impose signifi -cant costs on fi rms. These tax systems create distortions in the economy and make it dif-fi cult to raise adequate revenues. Simplify-ing the tax regimes (by reducing the number of taxes and exemptions) and widening the tax base is likely to benefi t fi rms and remove

1 3 8 M O R E A N D B E T T E R J O B S I N S O U T H A S I A
distortions in the economy. By increasing compliance, governments can maintain tax revenues while reducing statutory rates.
Constraints facing expanding/job-creating fi rms
The benchmark fi rm is useful for comparing the costs of constraints to fi rms across South Asia and the rest of the world. However, the main interest here is in understanding how these constraints affect employment creation. This section therefore examines the reported cost of constraints facing expanding/job-creating fi rms, because relaxing constraints on these fi rms is likely to produce the largest increases in employment. Job-creating fi rms also perform well: employment growth is positively and signifi cantly correlated with research and development, introduction of new processes and products, sales to mul-tinational companies, the education level of the manager, and in-house training.9 There-fore, relaxing constraints on job-creating
fi rms is likely to produce large increases in output as well.
Job-creating fi rms—which are similar in all respects to the benchmark firm except that they expanded employment during the preceding three years—report higher levels of severity than the benchmark fi rm for 14 of the 16 constraints (fi gure 4.8). They also report higher levels of mitigation activities (paying bribes and using generators). This pattern holds strongly in India and Paki-stan, where the difference between the cost of constraints facing expanding fi rms and the benchmark fi rm is largest.10
Although the level of severity changes, job-creating and benchmark fi rms in most countries rank constraints in a similar order: electricity, corruption, and politi-cal stability are the top three constraints among both types of fi rms, and the rank-ings of other constraints are similar (table 4.3). Only in Pakistan do the rankings by the benchmark and job-creating fi rms differ: corruption becomes the joint top constraint for expanding fi rms. Using alternative per-formance measures, such as productivity and innovation, reveals a similar pattern: well-performing fi rms report higher costs but similar ranking of constraints as poorly performing fi rms.
Constraints facing nonbenchmark fi rms
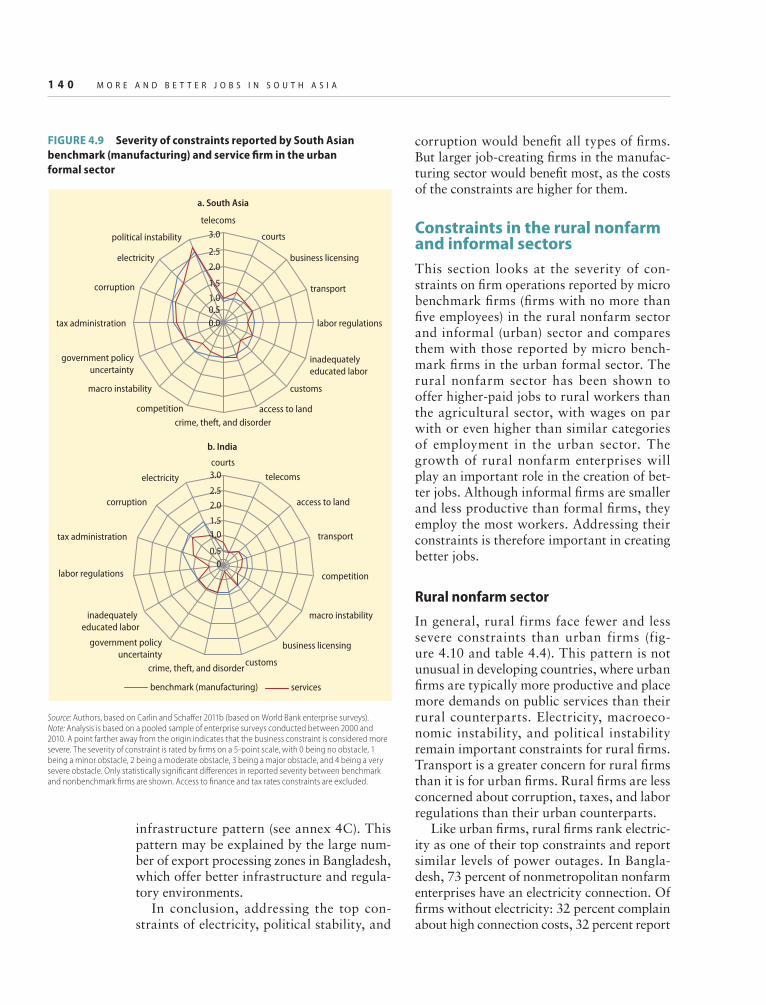
In general, the ranking of constraints facing different types of fi rms in the urban formal manufacturing sector is very similar to the ranking by the benchmark fi rm, although the level of severity differs. The patterns described below are consistent across countries in South Asia (fi gure 4.9).
Service fi rms generally report lower sever-ity of constraints than manufacturing fi rms. Firms in the service sector are typically less capital intensive, more dependent on commu-nications, and less engaged in trade than man-ufacturing fi rms. Indeed, service fi rms in South Asia report lower constraints for electricity, labor regulations, and custom administration (but higher cost for telecommunications). The difference between manufacturing and service
FIGURE 4.8 Severity of constraints reported by South Asian
benchmark (nonexpanding) and expanding fi rm in the urban formal
sector
Source: Authors, based on Carlin and Schaff er 2011b (based on World Bank enterprise surveys).Note: Analysis is based on a pooled sample of enterprise surveys conducted between 2000 and 2010. A point farther away from the origin indicates that the business constraint is considered more severe. The severity of constraint is rated by fi rms on a 5-point scale, with 0 being no obstacle, 1 being a minor obstacle, 2 being a moderate obstacle, 3 being a major obstacle, and 4 being a very severe obstacle. Only statistically signifi cant diff erences in reported severity between benchmark and nonbenchmark fi rms are shown. Access to fi nance and tax rates constraints are excluded.
0.0
0.5
1.0
1.5
2.0
2.5
3.0telecoms
courts
business licensing
transport
labor regulations
inadequately
educated labor
customs
access to land
crime, theft, and disorder
competition
macro instability
government policy
uncertainty
tax administration
corruption
electricity
political instability
benchmark (nonexpanding) expanding

W H A T I S P R E V E N T I N G F I R M S F R O M C R E A T I N G M O R E A N D B E T T E R J O B S ? 1 3 9
fi rms is particularly marked in India, where service fi rms report far less severe constraints than manufacturing fi rms in electricity, labor regulations, customs, tax rates and adminis-tration, and access to fi nance.11
Relative to smaller firms, larger formal fi rms which, on average produce higher out-put per worker (see chapter 3), report more severe constraints and a larger number of mit-igation activities, including management time spent on regulations and use of generators.12 They are also subject to more inspections. The difference between the benchmark fi rm with 30 employees and a fi rm with the same characteristics but with 60 employees is small
in India and larger in Nepal, Pakistan, and Sri Lanka. In Nepal, and to a lesser extent Sri Lanka, the cost of labor regulations increases signifi cantly with fi rm size (see annex 4C).
Exporters and importers in South Asia report more severe constraints, except in Bangladesh. Importers are more constrained by customs administration and anticom-petitive behavior. Macroeconomic instabil-ity is more problematic for both types of fi rms, which is likely to refl ect sensitivity to exchange rate movements and uncertainty. Exporters in Bangladesh report lower costs of constraints relative to nonexporters for electricity and most aspects of institutional
TABLE 4.3 Top fi ve constraints reported by South Asian benchmark (nonexpanding) and expanding fi rm in the urban formal
sector, by country
Constraint
South Asian
region Afghanistan Bangladesh Bhutan India Maldives Nepal Pakistan Sri LankaB
en
chm
ark
fi r
m
Ex
pa
nd
ing
fi r
m
Be
nch
ma
rk fi
rm
Ex
pa
nd
ing
fi r
m
Be
nch
ma
rk fi
rm
Ex
pa
nd
ing
fi r
m
Be
nch
ma
rk fi
rm
Ex
pa
nd
ing
fi r
m
Be
nch
ma
rk fi
rm
Ex
pa
nd
ing
fi r
m
Be
nch
ma
rk fi
rm
Ex
pa
nd
ing
fi r
m
Be
nch
ma
rk fi
rm
Ex
pa
nd
ing
fi r
m
Be
nch
ma
rk fi
rm
Ex
pa
nd
ing
fi r
m
Be
nch
ma
rk fi
rm
Ex
pa
nd
ing
fi r
m
Electricity 2 2 2 2 1 1 1 2 2 2 2 1 1
Political
instability 1 1 1 1 2 2 n.a. n.a. 1 1 3 1 n.a. n.a.
Corruption 3 3 3 4 3 3 2 1 3 4 4 4 1
Tax
administration 4 4 5 5 5 5 3 3 1 4
Labor
regulations 3 3 4 4 5 5 5 5
Inadequately
educated labor 2 2 5 5 2 2
Access to land 4 5 4 4 1 1
Transport 1 1 3 3
Government
policy
uncertainty 5 5 4 3 2 2
Courts 4 5 5
Crime, theft, and
disorder 5 3 5 3
Business
licensing 4 4
Macro instability 5 3 3
Competition 4 4
Source: Authors, based on Carlin and Schaff er 2011b (based on World Bank enterprise surveys).Note: Analysis is based on pooled sample of enterprise surveys conducted between 2000 and 2010. n.a. = Not applicable (question was not asked). Access to fi nance and tax rates constraints are excluded.
1 4 0 M O R E A N D B E T T E R J O B S I N S O U T H A S I A
infrastructure pattern (see annex 4C). This pattern may be explained by the large num-ber of export processing zones in Bangladesh, which offer better infrastructure and regula-tory environments.
In conclusion, addressing the top con-straints of electricity, political stability, and
corruption would benefi t all types of fi rms. But larger job-creating fi rms in the manufac-turing sector would benefi t most, as the costs of the constraints are higher for them.
Constraints in the rural nonfarm and informal sectors
This section looks at the severity of con-straints on fi rm operations reported by micro benchmark fi rms (fi rms with no more than fi ve employees) in the rural nonfarm sector and informal (urban) sector and compares them with those reported by micro bench-mark fi rms in the urban formal sector. The rural nonfarm sector has been shown to offer higher-paid jobs to rural workers than the agricultural sector, with wages on par with or even higher than similar categories of employment in the urban sector. The growth of rural nonfarm enterprises will play an important role in the creation of bet-ter jobs. Although informal fi rms are smaller and less productive than formal fi rms, they employ the most workers. Addressing their constraints is therefore important in creating better jobs.
Rural nonfarm sector
In general, rural firms face fewer and less severe constraints than urban firms (fig-ure 4.10 and table 4.4). This pattern is not unusual in developing countries, where urban fi rms are typically more productive and place more demands on public services than their rural counterparts. Electricity, macroeco-nomic instability, and political instability remain important constraints for rural fi rms. Transport is a greater concern for rural fi rms than it is for urban fi rms. Rural fi rms are less concerned about corruption, taxes, and labor regulations than their urban counterparts.
Like urban fi rms, rural fi rms rank electric-ity as one of their top constraints and report similar levels of power outages. In Bangla-desh, 73 percent of nonmetropolitan nonfarm enterprises have an electricity connection. Of fi rms without electricity: 32 percent complain about high connection costs, 32 percent report
0.00.51.0
1.5
2.0
2.5
3.0
telecoms
a. South Asia
courts
business licensing
transport
labor regulations
inadequately
educated labor
customs
access to landcrime, theft, and disorder
competition
macro instability
government policyuncertainty
tax administration
corruption
electricity
political instability
courts
telecoms
access to land
transport
competition
macro instability
business licensing
customscrime, theft, and disorder
government policyuncertainty
inadequately
educated labor
labor regulations
tax administration
corruption
electricity
b. India
00.5
1.01.5
2.0
2.5
3.0
benchmark (manufacturing) services
FIGURE 4.9 Severity of constraints reported by South Asian
benchmark (manufacturing) and service fi rm in the urban
formal sector
Source: Authors, based on Carlin and Schaff er 2011b (based on World Bank enterprise surveys).Note: Analysis is based on a pooled sample of enterprise surveys conducted between 2000 and 2010. A point farther away from the origin indicates that the business constraint is considered more severe. The severity of constraint is rated by fi rms on a 5-point scale, with 0 being no obstacle, 1 being a minor obstacle, 2 being a moderate obstacle, 3 being a major obstacle, and 4 being a very severe obstacle. Only statistically signifi cant diff erences in reported severity between benchmark and nonbenchmark fi rms are shown. Access to fi nance and tax rates constraints are excluded.
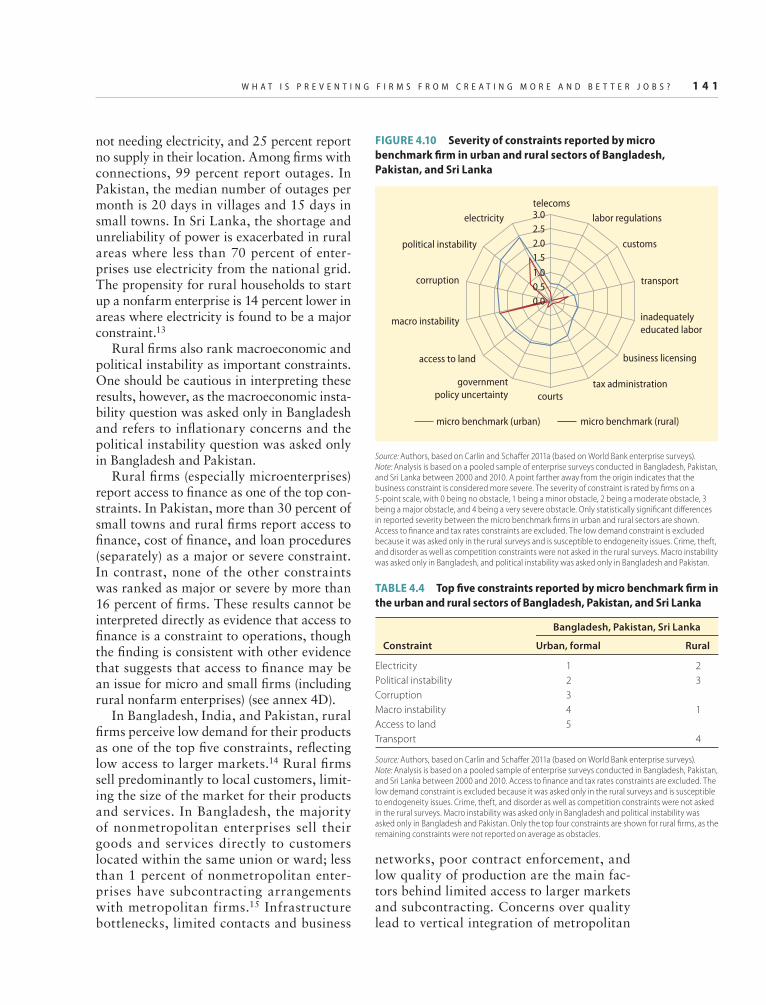
W H A T I S P R E V E N T I N G F I R M S F R O M C R E A T I N G M O R E A N D B E T T E R J O B S ? 1 4 1
not needing electricity, and 25 percent report no supply in their location. Among fi rms with connections, 99 percent report outages. In Pakistan, the median number of outages per month is 20 days in villages and 15 days in small towns. In Sri Lanka, the shortage and unreliability of power is exacerbated in rural areas where less than 70 percent of enter-prises use electricity from the national grid. The propensity for rural households to start up a nonfarm enterprise is 14 percent lower in areas where electricity is found to be a major constraint.13
Rural fi rms also rank macroeconomic and political instability as important constraints. One should be cautious in interpreting these results, however, as the macroeconomic insta-bility question was asked only in Bangladesh and refers to infl ationary concerns and the political instability question was asked only in Bangladesh and Pakistan.
Rural fi rms (especially microenterprises) report access to fi nance as one of the top con-straints. In Pakistan, more than 30 percent of small towns and rural fi rms report access to fi nance, cost of fi nance, and loan procedures (separately) as a major or severe constraint. In contrast, none of the other constraints was ranked as major or severe by more than 16 percent of fi rms. These results cannot be interpreted directly as evidence that access to fi nance is a constraint to operations, though the fi nding is consistent with other evidence that suggests that access to fi nance may be an issue for micro and small fi rms (including rural nonfarm enterprises) (see annex 4D).
In Bangladesh, India, and Pakistan, rural fi rms perceive low demand for their products as one of the top fi ve constraints, refl ecting low access to larger markets.14 Rural fi rms sell predominantly to local customers, limit-ing the size of the market for their products and services. In Bangladesh, the majority of nonmetropolitan enterprises sell their goods and services directly to customers located within the same union or ward; less than 1 percent of nonmetropolitan enter-prises have subcontracting arrangements with metropolitan firms.15 Infrastructure bottlenecks, limited contacts and business
FIGURE 4.10 Severity of constraints reported by micro
benchmark fi rm in urban and rural sectors of Bangladesh,
Pakistan, and Sri Lanka
Source: Authors, based on Carlin and Schaff er 2011a (based on World Bank enterprise surveys).Note: Analysis is based on a pooled sample of enterprise surveys conducted in Bangladesh, Pakistan, and Sri Lanka between 2000 and 2010. A point farther away from the origin indicates that the business constraint is considered more severe. The severity of constraint is rated by fi rms on a 5-point scale, with 0 being no obstacle, 1 being a minor obstacle, 2 being a moderate obstacle, 3 being a major obstacle, and 4 being a very severe obstacle. Only statistically signifi cant diff erences in reported severity between the micro benchmark fi rms in urban and rural sectors are shown. Access to fi nance and tax rates constraints are excluded. The low demand constraint is excluded because it was asked only in the rural surveys and is susceptible to endogeneity issues. Crime, theft, and disorder as well as competition constraints were not asked in the rural surveys. Macro instability was asked only in Bangladesh, and political instability was asked only in Bangladesh and Pakistan.
0.0
0.5
1.0
1.5
2.0
2.5
3.0telecoms
labor regulations
customs
transport
inadequately
educated labor
business licensing
tax administrationcourts
government
policy uncertainty
access to land
macro instability
corruption
political instability
electricity
micro benchmark (urban) micro benchmark (rural)
TABLE 4.4 Top fi ve constraints reported by micro benchmark fi rm in
the urban and rural sectors of Bangladesh, Pakistan, and Sri Lanka
Constraint
Bangladesh, Pakistan, Sri Lanka
Urban, formal Rural
Electricity 1 2
Political instability 2 3
Corruption 3
Macro instability 4 1
Access to land 5
Transport 4
Source: Authors, based on Carlin and Schaff er 2011a (based on World Bank enterprise surveys).Note: Analysis is based on a pooled sample of enterprise surveys conducted in Bangladesh, Pakistan, and Sri Lanka between 2000 and 2010. Access to fi nance and tax rates constraints are excluded. The low demand constraint is excluded because it was asked only in the rural surveys and is susceptible to endogeneity issues. Crime, theft, and disorder as well as competition constraints were not asked in the rural surveys. Macro instability was asked only in Bangladesh and political instability was asked only in Bangladesh and Pakistan. Only the top four constraints are shown for rural fi rms, as the remaining constraints were not reported on average as obstacles.
networks, poor contract enforcement, and low quality of production are the main fac-tors behind limited access to larger markets and subcontracting. Concerns over quality lead to vertical integration of metropolitan

1 4 2 M O R E A N D B E T T E R J O B S I N S O U T H A S I A
fi rms. A quarter of the fi rms that did not subcontract cited difficulties in ensuring quality control; another quarter cited lack of predictability and reliability of supply
(World Bank 2008c). Low market demand does not necessar-
ily reflect market failure. It is affected by the fi rms’ characteristics (a poor-performing fi rm that does not make goods suitable for the market will face low demand). Endogeni-ety issues make it diffi cult to interpret high reported severity as a business environment constraint to fi rms.
Low market demand is consistent with fi rms citing transport (road conditions and accessibility of roads) as one of their top four constraints. Nonmetropolitan enterprises in Bangladesh identify inaccessibility of roads during certain seasons as a major or severe constraint. Regression analysis shows that the greater the distance to the nearest medium-size city (a city with a population of 100,000 or more), the greater the likelihood that a nonmetropolitan manufacturer will identify low demand as a major or severe constraint. In Pakistan, 16 percent of rural enterprises surveyed (far more than small town enter-prises) cite road quality and 14 percent cite availability of transport as a major or severe constraint. In Sri Lanka, nearly a third of rural enterprises (versus 20 percent of urban enterprises) cite transport as a major or severe obstacle to operation or growth of business. Among fi rms that describe transport as an obstacle, 35 percent cite road quality, 33 percent cite lack of access to roads, and 32 percent cite lack of available transport as the underlying issue. These results are not sur-prising, as poor transport limits access to larger, urban markets.
Good-quality transport infrastructure is critical for facilitating urban-rural nonfarm sector linkages. The India poverty assess-ment (World Bank 2011b) uses the varia-tion in the nonfarm sector across India to explore the determinants of rural non-farm growth. It fi nds that the expansion of employment in the nonfarm sector is more closely linked to urban than agricultural growth. A simple multivariate regression
analysis using Nepal census data also shows that rural nonfarm employment has a statistical and practical positive associa-tion with income growth in nearby urban centers.16A one percentage point decline in urban poverty is associated with a 0.1–0.2 percentage point increase in the rural non-farm employment rate. Urban growth can increase the demand for goods and ser-vices produced by the rural nonfarm sec-tor, which otherwise might be limited by the small size of their local markets. The rural nonfarm sector can produce goods to be directly consumed by urban consum-ers or by urban firms through backward contracting arrangements. Linkages to urban markets are hindered by weak trans-port infrastructure connecting rural areas to urban areas (as well as lack of market information and the inability of rural non-farm firms to produce goods demanded in the urban areas). Assessments of rural transport in South Asia would help policy makers develop specifi c options.
Rural fi rms are much less concerned than urban fi rms with corruption, taxes, and labor regulations. This fi nding is consistent with the fact that rural fi rms report less engagement with offi cials than urban fi rms (inspections and management time) and that about half of rural fi rms are informal (just 40 percent of rural fi rms in Bangladesh and 53 percent in Sri Lanka were registered).
Informal urban sector
Figure 4.11 and table 4.5 contrast the rank-ing and severity of constraints reported by micro benchmark fi rms in the formal and informal sectors of urban areas of India.
Like formal firms, informal firms rank electricity as one of their top constraints and report similar levels of power outages. For-mal fi rms in India cite power as their great-est constraint; informal fi rms cite it as their second-greatest constraint (after access to fi nance). Power outages and loss of sales as a result of outages are very high for informal firms (11.3 percent of annual sales lost to power outages).

W H A T I S P R E V E N T I N G F I R M S F R O M C R E A T I N G M O R E A N D B E T T E R J O B S ? 1 4 3
FIGURE 4.11 Severity of constraints reported by micro benchmark
fi rm in India’s urban formal and informal sectors
Source: Authors, based on Carlin and Schaff er 2011a (based on World Bank enterprise surveys).Note: Analysis is based on a pooled sample of enterprise surveys conducted in India between 2000 and 2010. A point farther away from the origin indicates that the business constraint is considered more severe. The severity of constraint is rated by fi rms on a 5-point scale, with 0 being no obstacle, 1 being a minor obstacle, 2 being a moderate obstacle, 3 being a major obstacle, and 4 being a very severe obstacle. Only statistically signifi cant diff erences in reported severity between the micro benchmark fi rms in formal and informal sectors are shown. Access to fi nance and tax rates constraints are excluded. The low demand constraint is excluded because it was asked only in the informal surveys and is susceptible to endogeneity issues. Political instability was not asked in the India surveys.
0.0
0.5
1.0
1.5
2.0
2.5
3.0courts
telecoms
macro instability
business licensing
competition
customs
government policy
uncertaintytransport
inadequately
educated labor
labor regulations
access to land
crime, theft, and disorder
tax administration
corruption
electricity
micro benchmark (formal) micro benchmark (informal)
TABLE 4.5 Top fi ve constraints reported by micro benchmark fi rm in
India’s urban formal and informal sectors
India
Formal Informal
Electricity 1 1
Corruption 2
Tax administration 3
Crime, theft, and disorder 4
Access to land 5 3
Competition 2
Transport 4
Government policy uncertainty 5
Source: Authors, based on Carlin and Schaff er 2011a (based on World Bank enterprise surveys).Note: Analysis is based on a pooled sample of enterprise surveys conducted in India between 2000 and 2010. Access to fi nance and tax rates constraints are excluded. The low demand constraint is excluded because it was asked only in the informal surveys and is susceptible to endogeneity issues. Political instability was not asked in the India surveys.
Informal fi rms cite lack of access to fi nance as the top constraint they face: in 2005, more than a third of informal fi rms viewed it as the single greatest obstacle. In contrast, formal fi rms cite access to fi nance as the fi fth- greatest obstacle. This finding does not necessarily mean that access to fi nance is a binding con-straint for informal fi rms (see the earlier dis-cussion of the endogeneity problem), nor does it necessarily mean that access to fi nance is a greater constraint to informal fi rms than for-mal fi rms. However, given the overwhelming response by informal fi rms, this issue merits the analysis reported in the next section.
Informal fi rms are more concerned about access to land and transport than formal fi rms and (like rural fi rms) less concerned about corruption, taxes, and labor regula-tions. This finding is consistent with the fact that informal fi rms report less manage-ment time spent with offi cials than formal fi rms.
The concern regarding access to land expressed by urban informal fi rms in India may reflect the impact of regulations that shape the operation of land markets. Den-sity regulations, which limit the ratio of fl oor space to plot area, lead cities to expand out-ward instead of upward. Together with lim-ited accessibility of public transport, such expansion can make it more difficult for informal manufacturing units to locate where they should—close to buyers and suppli-ers. Relaxing density regulations, improving urban transport, and increasing the supply of property might help reduce the severity of the land constraint for informal urban fi rms (World Bank 2011a).
Access to fi nance
A growing body of empirical research has established a positive association between fi nancial sector and economic development (countries with higher levels of credit to the private sector relative to GDP experienced higher real per capita GDP growth rates between 1980 and 2007) and between access to external finance and firm productivity (see, for example, Banerjee and Dufl o 2008;
Beck, Demirgüç-Kunt, and Maksimovic 2005). Though in general it is very diffi cult to control for endogeniety in these types of analyses, the studies suggest that if fi nance is indeed a binding constraint, it could have a signifi cant adverse effect on productivity and growth.
1 4 4 M O R E A N D B E T T E R J O B S I N S O U T H A S I A
Firms in all South Asian countries report access to fi nance as one of their top fi ve con-straints. The reported severity is higher for informal, rural, and small fi rms. To circum-vent endogeniety issues, this book looks at alternative indicators, including financial depth and outreach/access indicators, to see whether there is other evidence suggesting that access to fi nance is a severe constraint to fi rms (see annex 4D). It does not fi nd strong evidence that access to fi nance is a binding constraint for all types of firms in South Asia. Firm-level data from enterprise sur-veys show that smaller fi rms in South Asia use less external finance (this evidence is consistent with evidence from other regions). Small firms in Afghanistan and Pakistan use less external fi nance than small fi rms in other regions. Microenterprises in the infor-mal and rural sector report even lower use of external fi nance than small fi rms in the formal sector, refl ecting less access to bank-ing services in general and the large number of fi rms that are unable to apply for credit because they cannot meet the loan require-ments, especially with regard to collat-eral. The evidence suggests that addressing access to fi nance issues for micro, small, and medium-size enterprises may be important in some countries.17
After studying the evidence on whether small and medium-size enterprises in Asia are credit constrained, the Asian Develop-ment Bank (2009) concluded that studies are subject to numerous endogeniety issues. It noted that although the evidence may be inconclusive, policy makers believe lack of credit is an important issue and have already introduced many active interventions. The next section assesses which of these inter-ventions is technically appropriate and eco-nomically justifi ed.
Demand-side policy options
This section suggests policy options to overcome some of the binding constraints faced by fi rms in South Asia. Policy options are based on experiences from coun-tries inside and outside the region. The
relevance of each option for an individual country will depend on country-specific issues and contexts.
Electricity policy options
Alleviating the demand gap across all seg-ments in the value chain requires at least $300 billion by 2020 ($280 billion for India only) (see box 4.1). The private sector is pro-jected to continue to be the leading fi nan-cier. Since 1990, it has invested $121 billion in the sector, 85 percent since 2000 (table 4.6). India has attracted about 90 percent of the regional investment in the power sec-tor with private participation (World Bank 2011c). The private sector’s contribution to total power sector investments in India rose from 21 percent under the 10th Plan to 36 percent under the 11th Plan; it is expected to reach about 50 percent in the 12th Plan, beginning in 2012 (Economic Times 2011; Government of India 2009).
If these improvements in closing the elec-tricity gap are to be sustained or increased, countries will need to continue to create enabling environments to improve sector performance and foster additional invest-ment. Key actions include deepening market and institutional reforms and improving the commercial and financial viability of the sector.
Deepening market and institutional reformsBeginning in the mid- to late 1990s, coun-tries put in place overarching policy and legal frameworks and restructured power utilities to make investments more attrac-tive and commercialize utilities to enhance service delivery. Most countries established regulatory bodies; separated segments (generation, transmission, and distribu-tion); and implemented a host of measures to attract the private sector, particularly in generation. (See table 4.7 for a summary of market reforms in the power sector in South Asia.) Bangladesh and Pakistan also unbundled their power markets to some extent, with the prevailing market model the single buyer with independent power

W H A T I S P R E V E N T I N G F I R M S F R O M C R E A T I N G M O R E A N D B E T T E R J O B S ? 1 4 5
producers or rental power plants selling their power at regulated prices. The unbun-dling of the Water and Power Develop-ment Authority in Pakistan into a number of generation companies was formalized in 2001 and 2002. Bhutan unbundled only the power generation segment by establishing a power company responsible for domes-tic power (Bhutan Power Corporation) and another company responsible for operating the export-oriented hydropower projects (Druk Green Power Company). In India, the generation, transmission, distribution segments include a number of players (both
TABLE 4.6 Private investment in electricity in South Asia, by
country, 1999–2000 and 2001–10
(millions of dollars)
Country 1999–2000 2001–10 Total
Afghanistan 0 2 2
Bangladesh 573 823 1,397
Bhutan 0 201 201
India 11,039 97,683 108,722
Nepal 239 34 273
Pakistan 5,937 4,496 10,433
Sri Lanka 177 271 488
Total 17,966 103,510 121,475
Source: World Bank PPI database (http://www.ppi.worldbank.org).Note: Data on Maldives are not available.
TABLE 4.7 Market reforms in the power sector in selected countries in South Asia
Country
Market
structure Regulator
Role of
public sector Role of private sector Role of competition
Bangladesh Unbundled Bangladesh
Electricity
Regulatory
Commission
Companies created
after unbundling
continue to be
state owned.
Government launched program
in 2010 to attract independent
power producers and boost
private investment in generation.
Because of gas shortages, most
independent power producers and
rental plants are small and oil fi red.
Competition limited and confi ned
to generation sector
India Unbundled Electricity
regulatory
commissions in
most states
Public sector owns
large shares of
the transmission
and distribution
segments.
Private sector assets and fi nancing
are concentrated in generation;
limited private presence in
transmission and negligible
presence in distribution.
Long-term agreements by
independent power producers,
public-private partnerships
in transmission, distribution
franchisees. Policy framework
shifting from guaranteed return
on assets to tariff s based on
competitive bidding
Nepal Horizontally
integrated
None Public sector owns
large shares of
the transmission
and distribution
segments.
Signifi cant participation of
independent power producers in
generation.
Competition introduced in
generation.
Pakistan Unbundled National electric
power regulatory
authority
Companies created
after unbundling
continue to be
state owned.
Independent power producers
own one-third of generation
capacity.
Further strengthening of the
regulatory framework envisaged
to enable competition and market-
oriented systems for power pricing,
trading, and exchange.
Sri Lanka Horizontally
integrated
Multisector
public utilities
regulatory
Public sector owns
large shares of
the transmission
and distribution
segments.
Limitation of private investment
above 25 MW unless there is
shareholding by the government.
Independent power producers
supply oil-dependent power to
the grid.
Limited
Source: Authors’ compilation, based on Besant-Jones 2006.

1 4 6 M O R E A N D B E T T E R J O B S I N S O U T H A S I A
public and private) as well as electricity traders, who participate in a competitive electricity wholesale market. Nepal and Sri Lanka retain their vertically integrated state-owned company.
Countries also have to strengthen insti-tutions in order to effi ciently expand capac-ity. The region has pursued ambitious plans to meet power shortages. In India alone, power sector investments have to increase from about $7 billion a year to about $30–$40 billion a year by 2012, under the 11th Plan, which calls for total investment of $150 billion. Total investment is expected to double to $300 billion under the 12th Plan (2012–17) (Banerji and Mishra 2010). India added 50 GW between 2006 and 2011 and implemented a series of “ultra mega” (4,000 MW) generation projects based on competitive bidding by independent power producers. It also set up a functioning trad-ing market for contracts of less than a year. In 2010/11, the short-term power market constituted 10 percent of the total power procured in India (Central Electricity Regu-latory Commission 2011).
Bangladesh plans to develop 9,426 MW of new generation capacity by 2015, at an estimated cost of about $15 billion, includ-ing associated transmission and distribution investments and fuel development and sup-ply facilities. Bhutan has established public-private partnerships and secured financing on commercial terms for a large export- oriented hydropower project (Dagachhu HPP). Between 2008 and 2010, Pakistan added more than 2,000 MW of capacity. It expects to commission 300 MW of hydro-power by 2012.
Further improvements in the operating environment are needed to increase invest-ments in generation. Generation shortages are caused primarily by procedural bottlenecks (land acquisition, environmental and forest clearances, and provision of water for ther-mal plants); limited technical and fi nancial capacity to implement large projects; the lack of fuel and the inability to import it; and dif-fi culty in accessing domestic resources (such as coal in India, which lies under forests or in tribal areas, or hydropower in Nepal, the
development of which has been limited by political instability).
There is more scope for private players in the transmission and distribution sectors, where investments have been considerably lower than in generation, reflecting the natural monopoly nature of transmission and difficulties in tackling longstanding underpricing and theft in distribution. In India, several public-private partnership contracts have been competitively awarded on a Build, Own, Operate, and Maintain or a Design, Build, Finance, Operate, and Transfer basis. India and Pakistan have also pursued private participation in power distribution as a means of improving the commercial orientation and service deliv-ery. In India, power distribution has been privatized in Delhi and the state of Orissa, and some states, such as Maha rashtra, are developing “franchise” models akin to lease contracts to bring in the private sector. Pak-istan privatized distribution in the Karachi Electricity Supply Corporation. The results of these initiatives have been mixed, refl ect-ing the difficulties in moving to and sus-taining cost-covering tariffs and reducing nonpayment and theft.
Skill mapping and skill development need to appear on top of the business agenda among sector players, as the lack of skilled manpower is emerging as a constraint hin-dering massive investment. The active par-ticipation of private players in the sector has resulted in higher attrition rates from the public sector and steep competition for talent. In India, demand for manpower is expected to increase through 2013/14, when the sector will require an estimated 85,000 additional workers (CRISIL 2011).
Exploiting the signifi cant potential of intraregional energy tradeCountries need to build on the unexploited potential of interregional trade and improve the effi ciency of existing investments, two of the most cost-effective options for alleviating shortages in the region. Interregional trade, particularly hydro exports from Bhutan to India, has increased in recent years. Ini-tiatives continue, with the government

W H A T I S P R E V E N T I N G F I R M S F R O M C R E A T I N G M O R E A N D B E T T E R J O B S ? 1 4 7
of Bangladesh signing a memorandum of understanding with India in 2010 for cross-border power trade that will facilitate the import of 500 MW of electricity and a new Nepal-India electricity and trade project that will facilitate the trading of up to 1,000 MW of electricity. As a result of transmission bottlenecks, electricity exchange between Nepal and India was limited to about 70 MW in 2010. The potential for more effi -ciently deploying existing generation capac-ity through rehabilitation, maintenance, and technical optimization is also important.
Improving the commercial and fi nancial viability of the sectorGovernments in the region have been pro-active in curbing losses in the power sector. India’s power development reform program (R-APDRP), launched under the 11th Plan, which aims to limit losses to 15 percent, focuses on demonstrable and measurable performance in reducing distribution losses. Pakistan has conducted technical and opera-tional audits of distribution and generation companies, which provide a menu of actions for the government and utilities to imple-ment (for instance, investments to reduce losses and improve effi ciency, administrative and commercial steps to enhance account-ability, and upgrading of information sys-tems and management practices).
Many states in India have undertaken rural feeder segregation programs to reduce losses in rural distribution lines and provide uninterrupted power to rural nonagricultural consumers. These mechanisms have had a transformative effect on rural livelihoods in Gujarat, the state where the scheme has func-tioned the longest and been subject to many evaluations (box 4.3).
Tariff rationalization—that aligns tar-iffs with costs and better targets implicit subsidies—is critical. In Bangladesh, policy makers envisage addressing the sector’s financial deficit through a combination of tariff increases, cost reduction, and demand-side management. Retail tariffs were raised by 5 percent in February 2011, but additional tariff increases are required. In Bhutan, the government adopted a more cost-reflective tariff structure after the corporatization of the electricity utility in 2002. During 2004–09, the average electricity tariff increased by 66 percent. Even after the increase, however, tariffs need to rise 73 percent for residential customers and 28 percent for industrial con-sumers to cover the cost of production (ADB 2010). In Pakistan, consumer tariffs were not increased at all between 2003 and 2007, despite substantial increases in the interna-tional prices of fuel oil and gas. Changes in the tariff level and structure carried out in March 2008 were implemented to reduce the
Although most villages in the Indian state of Gujarat were electrifi ed by 2003, the power supply remained erratic and unreliable, because the feeders to rural areas were joined and utilities had no incentive to sup-ply 24-hour power to a group of mostly unmetered consumers paying below cost-recovery tariff. The Jyotigram Yojana (JGY) aimed to segregate agricul-ture from rural domestic and industrial power supply. Feeders were laid to provide 24/7 uninterrupted sup-ply, and farmers were rationed an uninterrupted, pre-announced 8-hour supply. The scheme was launched in 2003 on a pilot basis and then scaled up to include the whole state. The scale-up created 1,888 feeders at
a cost of $285 million in a record 1,000 days from ini-tiation to implementation. The scheme was expected to provide better quality power supply to nonagricul-ture consumers, charge farmers for power use, and ration the power supply to agriculture consumers.
The impact of the scheme has been signifi cant: both the quantity and quality of power and enter-prise operations improved. As a result, families can now work at night. The Gujurat Electricity Board also experienced increases in revenue collection and made profi ts in 2010.
Sources: Devaiah 2010; Mishra 2010.
BOX 4.3 Bringing light to rural consumers in Gujarat, India

1 4 8 M O R E A N D B E T T E R J O B S I N S O U T H A S I A
fi scal burden of tariff subsidies and improve the benefi t incidence of such subsidies. Tariffs have since increased by 75 percent, which has helped cut the gap between the cost of supply and notifi ed tariffs in half (from 35 percent to 17 percent). The Public Utilities Commission of Sri Lanka announced a new set of electric-ity tariffs for 2011–15 in late 2010. The tar-iffs are expected to be gradually restructured to refl ect cost-effectiveness by 2015.
More remains to be done, particularly in rationalizing industrial tariffs by reducing the cross-subsidy and improving targeting. Doing so would help industries go back to the grid (instead of depending on captive generators) and use open access options (IDFC 2010).
Regulators with adequate capacity can ensure transparency and accountability in tariff setting, a process that continues to be driven by factors such as political exigen-cies. In Pakistan, the regulator (NEPRA) has exclusive responsibility for determining tar-iffs after public hearings, but tariffs become legally binding only once they have been noti-fi ed by the government in the offi cial gazette. In India, there are instances of tariffs not being fi led annually and subsidies not paid to utilities in time. New initiatives have been implemented, however, particularly the mul-tiyear tariff, which provides certainty on the costs for which utilities can be held account-able, and the stepping back from regulatory
interference in day-to-day utility matters. At least eight states in India have passed multi-year tariff orders. Regulators have also made attempts to improve the consumer interface by enabling consumers to have input into reg-ulatory decision making.
Governance and the institutional capac-ity of utilities need to be strengthened. Most countries have unbundled their power sectors, corporatized previously vertically integrated power utilities, or both. How-ever, many newly formed utilities are still not empowered to act autonomously and suffer from severe institutional capacity constraints. Their accountability, effi ciency, and customer service are well below industry benchmarks. The freedom to make important decisions—such as setting up performance-based remu-neration systems and providing market-linked remuneration to new employees—is limited. Robust and effective corporate governance is widely accepted as the essential foundation for performance improvement. Without the support of a strong board and high-quality senior management, the complete transfor-mation in organizational culture needed to commercialize in the face of a long tradi-tion of risk-averse top-down bureaucratic control will not be achieved. Some states in India (such as Andhra Pradesh and West Ben-gal) have adopted technology initiatives and accountability frameworks to improve sector performance (box 4.4).
In 1999, the government of Andhra Pradesh under-took a comprehensive reform program to control theft of electricity from state-owned power compa-nies and improve its revenue collection. The cam-paign focused on four measures: enacting a new law to address electricity theft, strengthening enforce-ment mechanisms, reorganizing the anticorruption function in the utilities, and reengineering busi-nesses processes to improve management control and customer service.
The distribution companies installed modern bulk metering, data-logging equipment, and mil-
lions of digital meters; they automated meter read-ing and reduced billing cycles. They also consulted extensively with customers and communicated with the general public about their reforms—a major change from previous practice. Under this cam-paign, the distribution companies regularized large numbers of consumers and prosecuted extreme cases of theft of electricity. As a result, they reduced losses from 38 percent in 1999 to 26 percent in 2003 and increased the collection rate to 98 percent.
Source: Bhatia and Gulati 2004.
BOX 4.4 Improving performance of state-owned power suppliers in Andhra Pradesh

W H A T I S P R E V E N T I N G F I R M S F R O M C R E A T I N G M O R E A N D B E T T E R J O B S ? 1 4 9
BOX 4.5 Cutting red tape to reduce corruption
Investment climate assessments conducted by the World Bank identify several reforms that have reduced corruption by cutting red tape.
Bangladesh port and customs
The port of Chittagong, which handles 85 percent of Bangladesh’s trade, was highly ineffi cient, with, for example, ship turnaround times of fi ve to six days compared with one day at more effi cient ports. Main problems included long and complex procedures, labor shortages, and lack of accountability of offi -cers and employees of customs and port, leading to rent-seeking behavior and irregularities.
Following the handover of the Chittagong Con-tainer Terminal to a private operator, there have been noticeable improvements in handling opera-tions. A one-stop service incorporating shipping agents, freight forwarders, customs, clearing and forwarding agents, and banks has ensured docu-ment clearance within 20 minutes. The turnaround time of ships has decreased to three to four days. Port effi ciency has increased 30 percent, and the cost of doing business in the port has decreased 40 percent.
India land registration
Uncertainty surrounding property titles drives up the cost of land acquisition by limiting the supply of reliable investments. In many states, land records and registration of deeds have not been computer-
ized. Manual transcriptions are more prone to errors and misplacement.
Although recent reforms in some states have improved the registration process, it takes on aver-age 87 days to register a property in India. Because of the lengthy and complex land transfer process, informal payments are considerable.
Recent reforms include computerization of land records in Gujurat, Karnataka, Madhya Pradesh, Maharashtra, and Tamil Nadu and computeriza-tion of the registration of deeds in Andhra Pradesh, Karnataka, Maharashtra, Rajasthan, and Tamil Nadu.
These reforms have led to substantial improve-ments. In cities where reforms have taken place, it takes a little more than one month to register land, rather than the more than fi ve months in cities with no reforms. The reform has also had an impact on corruption: computerization of land records in Karnataka reduced informal payments by Rs 800 mil-lion and saved Rs 66 million in waiting time (Ferrari and Dhingra 2009).
Pakistan tax reform
The recent literature on tax reforms stresses the importance of tax administration and the effect it has on compliance costs. Recent reforms have focused on improving the management and organization of revenue administration; updating information tech-nology and systems to efficiently process massive information flows from taxpayers; strengthening
(continues next page)
Corruption policy options
Two broad strategies are discussed for addressing corruption based on experiences from countries in South Asia and other regions. The first strategy focuses on cut-ting red tape and simplifying administrative procedures to reduce unnecessary interac-tion with public offi cials and reduce oppor-tunities for discretionary abuse by offi cials. In addition to reducing corruption, these policies should benefit firms by reducing the administrative burden on fi rms. Box 4.5
provides examples of red tape reforms that have had an impact on corruption.
The second broad strategy involves legis-lative and administrative interventions, such as establishing anticorruption laws and set-ting up anticorruption institutions, such as an independent anticorruption commission. Direct interventions have had a mixed record, with success depending on the governance structure of these institutions, their inde-pendence, and their resources and authority. Box 4.6 provides successful examples of direct legislative and administrative intervention.

1 5 0 M O R E A N D B E T T E R J O B S I N S O U T H A S I A
investigation, so that authorities can develop risk analysis to closely follow cases that violate tax laws; and credibly conducting audits to improve enforce-ment. Such reforms signal credibility in the tax regime, a critical part of improving the system that can in turn increase voluntary compliance.
Reforms that simplify tax procedures and reduce interactions between tax offi cials and taxpayers, such as the reforms adopted in Chile, Colombia, and Latvia (Gill 2003), also reduce opportunities for corruption. Other anticorruption measures enabled by automation include restricting access of employees to scanned copies of original records to prevent tampering and creating audit trails of administrative decisions and changes to taxpayer current accounts.
In an attempt to decrease corruption by reduc-ing the interaction between tax officials and pri-vate agents, the government of Pakistan raised the threshold for general sales tax registration from Rs 0.5 million to Rs 5 million, freeing 42,000 pre-viously registered taxpayers from corruption-related
problems. However, this solution came at the cost of decreased tax revenue.
A less costly, and arguably more effective, effort was made by the Federal Bureau of Revenue to improve the integrity and accountability of its inspec-tors. It implemented a task force’s recommendations to allow only minimal contact between taxpayers and tax offi cials; establish end-to-end automation of tax fi ling and refunds; improve recruitment policies, to weed out potentially corrupt offi cials; simplify tax structures; and reduce the discretion of tax offi cials in determining tax liabilities.
These attempts to decrease corruption should have an important side benefit in reducing tax administration costs, which firms in Pakistan cite as their second-highest constraint (after tax rates). Cross-country data on time to prepare and pay taxes show fi rms in Pakistan spending 560 hours versus an average of 314 hours for South Asia (World Bank 2011e).
Sources: Ferrari and Dhingra 2009; World Bank 2008c, 2009.
BOX 4.5 Cutting red tape to reduce corruption (continued)
The annual Transparency International Corrup-tion Perceptions Index ranks countries in terms of the degree to which corruption is perceived to exist among public offi cials and politicians.a Singapore has consistently ranked among the least corrupt countries in the index, ranking third in 2010 (after Denmark and New Zealand).
Singapore has a long tradition of fighting cor-ruption. It implemented a comprehensive anticor-ruption system aimed at reducing the incentives and opportunities for corruption. This system includes legislation against corruption, called the Prevention Corruption Act; an independent authority called the Corrupt Practices Investigation Bureau, with strong powers to implement the law, including functions of investigation, prevention, and training in cases
related to corruption; and public information cam-paigns that promote whistleblowing and the fi ght against corruption.
Several countries in East Asia have tried to follow Singapore’s recipe, with varying degrees of success. The Republic of Korea introduced the Anticorruption Act (2001), the Money Laundering Prevention Act (2001), and the Code of Conduct for Maintaining the Integrity of Public Offi cials (2003). It also created the Korea Independent Commission against Corrup-tion (later called the National Integrity Commission). Korea’s ranking in the Corruption Perceptions Index declined from 48 in 2001 to 39 in 2010. However, other East Asian countries that introduced similar reforms saw their rankings deteriorate (Malaysia ranked 44th in 2006 and 56th in 2010).
BOX 4.6 Legislative and administrative interventions to reduce corruption in East Asia
(continues next page)
W H A T I S P R E V E N T I N G F I R M S F R O M C R E A T I N G M O R E A N D B E T T E R J O B S ? 1 5 1
Access to fi nance policy options
Access to fi nance is an issue for many micro, small, and medium enterprises in some South Asian countries. Policies to increase access to fi nance for such fi rms address the various demand- and supply-side constraints and the underlying institutional and regulatory environment that affects credit. Commercial banks face higher costs in lending to small, often geographically dispersed businesses, because identifying potential borrowers, conducting due diligence, and maintaining contact after a loan is made are all more dif-fi cult. For their part, small businesses often do not know what is needed to qualify for bank financing and lack market informa-tion. Governments should focus on devel-oping an enabling environment that makes small business lending safer, cheaper, and faster rather than on prescriptive measures such as directed lending programs, which have created distortions and ineffi ciencies in fi nancial intermediation in many South Asian countries.
Good practices from countries that have been able to expand access to finance for micro, small, and medium-size enterprises include the following:
• Establishing efficient secured transac-tions registries for available movable assets, in order to address micro, small,
and medium-size enterprises’ lack of con-ventional collateral
• Strengthening credit bureaus, in order to help overcome adverse selection and moral hazard related to asymmetric information in credit markets
• Supporting financial intermediation by facilitating downscaling of commercial banks (for instance, through simplifi cation of documentation and collateral require-ments, reducing the number of days to approve a loan, and so forth) and upscal-ing microfi nance institutions
• Providing technical assistance and fi nan-cial literacy training to micro, small, and medium-size enterprises.
Annex 4E expands on these policy options.
The “how” of tackling constraints: public-private collaboration
This chapter so far has identified binding constraints to firms and suggests reforms that may be needed to facilitate the expan-sion of employment. The next question is how to design and implement successful reforms to address these constraints.
Reforms can be designed and imple-mented through coordinated public and private sector efforts. International experi-ences of successful industrial development
BOX 4.6 (continued)
Analysis of the factors that may have led to suc-cess in Singapore suggests that there must be strong political will to fi ght corruption. This political will is partially reflected in the issuance of legislation and the creation of an independent implementa-tion authority, but the authority must also have full powers, there must be strong political support for its actions at the highest level, and it must have the budget and personnel to carry out its functions. The anticorruption agency must be independent from the police and political control and incorruptible itself;
any corruption within the agency must be subject to harsh penalties. Major causes of corruption (includ-ing low civil service salaries and excessive red tape) must be tackled and corrupt offenders punished (Quah 2007).
a. The Transparency International Corruption Perceptions Index is a composite index drawing on corruption related data from expert and business surveys carried out by a variety of independent institutions. The index ranks more than 175 countries in terms of perceived levels of corruption as determined by expert assessment and opinion surveys (see http://www.transparency.org/policy_research/surveys_indices/cpi/2010/results).

1 5 2 M O R E A N D B E T T E R J O B S I N S O U T H A S I A
indicate that such collaboration can play an important role in identifying binding constraints and designing, championing and implementing reform/actions in a coor-dinated and integrated manner, leading to increased competitiveness and growth. Efforts often focus on a particular sec-tor, because many binding constraints and market failures are sector specifi c and pri-vate sector players fi nd it easier to coalesce around a particular sector. Box 4.7 looks at the role of public-private collaboration to implement reforms in the export garment industry in Cambodia.
The World Bank’s Financial and Private Development Network developed the Com-petitiveness Partnership Initiative (CPI), which is being piloted in several countries, including India, Jordan, and Kenya. CPI is a collaborative process between the public and private sectors around a sector or sectors with high growth potential. In Kenya, for instance, the selected sectors are tourism and business process outsourcing.
The CPI is developed around three broad steps:
• Identify sector opportunities. The fi rst step is to use agreed upon selection criteria and demand-side/market signals (such as factor endowments, which identify where a coun-try’s latent comparative advantage lies) to identify existing sectors that have the poten-tial to compete in regional and global mar-kets, attract investment, and create jobs.
• Conduct sector analyses. The second step is to conduct evidence-based technical analy-ses of the opportunities and constraints of the selected sector—by, for example, per-forming value-chain diagnostics to identify constraints at each stage of the chain.
• Develop action and implementation plans. The last step is to create country-level task forces and joint public-private working groups that develop action plans to remove constraints and lead their implementation. Types of public, private, and public-private collaborative actions that could come out of this process include both hard and soft infrastructure delivery.
This targeted sector approach has several potential drawbacks. First, sectors could be
Cambodia’s garment industry—the country’s top export earner and top employer—consists of about 270 export-orientated factories. Total gar-ment export revenue increased from $1.2 billion in 2001 to $2.9 billion in 2010, representing 78 per-cent of exports and 15 percent of GDP. The indus-try employs 290,000 workers, 92 percent of them women, representing 70 percent of formal manufac-turing employment.
In 1999, the Government-Private Sector Forum (G-PSF) was established. Chaired by the prime min-ister, the G-PSF comprises eight working groups, each made up of government offi cials and private sector representatives. The export processing work-ing group is co-chaired by the Ministry of Com-merce and the Garment Manufacturers Association.
The International Finance Corporation (which funded G-PSF from 2000 to 2010) ranked it as one of the top most effective public-private dialogue
mechanisms in the world. By reducing business costs, the 11 reforms the forum has implemented have saved the private sector an estimated $100 million.
A wide range of reforms has been implemented to improve the competitiveness of the garment and other export sectors. These reforms include the following:
• Simplifying import/export procedures, such as customs clearance at point of import
• Reducing export management fees• Reducing contributions to the National Social
Security Fund• Developing the Trade Union Law • Establishing joint trade missions between the pri-
vate sector and the government• Conducting government negotiations to obtain
trade preferences and free trade agreements.
Source: Van 2011.
BOX 4.7 Public-private collaboration to implement reforms in the Cambodian garment industry

W H A T I S P R E V E N T I N G F I R M S F R O M C R E A T I N G M O R E A N D B E T T E R J O B S ? 1 5 3
chosen arbitrarily or on the basis of noneco-nomic reasons rather than on latent com-parative advantage or potential economic benefits. To prevent scarce resources from being unproductively invested, it is impor-tant to agree on objective selection criteria, use demand-side/market signals to identify sectors with comparative advantage, gauge trade potential and interest by private inves-tors, and ensure that a wide set of private sector representatives from different sectors is consulted during the process of identifying priority sectors.
Second, the approach could create an uneven playing fi eld between fi rms in dif-ferent sectors and between fi rms within a sector if the reforms benefi t disproportion-ately certain fi rms. To reduce the risks of being captured by vested interests of rent-seeking firms with privileged access to political and governance structures, it is important to ensure broad representation of private sector players—and not just the largest firms—in the public-private dia-logue process; use objective, evidence-based analyses to identify constraints and assess costs and benefi ts of proposed actions; and establish processes that elicit structured and transparent dialogue, analysis, and decision making.
Cameroon provides an example of a com-petitiveness partnership initially diverted into rent-seeking activity. Most of the private
sector members of the competitiveness com-mittee, created in 1998, were members of a single business lobbying association. In 2007, the World Bank and the International Finance Corporation helped restructure a new collab-oration platform, which was more inclusive and included a process for selecting proposals that followed good practice. The focus of the proposals was also narrowed to enable better scrutiny of the details (large reform proposals tend to provide opportunities to hide details). The results have been broader participation and wider acceptance of the reforms.
Constraints facing potential fi rm entrants: Business entry regulations
One of the limitations of the analysis of fi rm constraints is that it does not necessar-ily identify the constraints facing potential entrants. Doing so is important because new fi rms create jobs. The ease of business entry regulations has been identifi ed as an important determinant of new fi rm entry, with studies showing that large reductions in business entry regulations—by, for exam-ple, introducing a one-stop shop of business registration centers or reducing registration fees—can spur the establishment of new formal fi rms by individuals who were pre-viously wage workers or out of the labor force. Box 4.8 summarizes the evidence.
Large reductions in the ease of opening a business are positively and strongly associated with higher levels of business registration and new fi rm entry. A cross-country study by Klapper and Love (2010) fi nds that large reforms—reforms that achieve more than a 40 percent reduction in costs, days, or procedures of busi-ness registration—lead to an increase in rates of new firm entrance. Multiple and simultaneous reforms have a larger impact on business registration. A coun-
try’s initial conditions matter: countries that start out with high registration costs need larger reforms to induce a signifi cant number of new registrations.
In Mexico, a reform that reduced the average number of days needed to start a business from 30 to 1.4 led to a 5.0 percent increase in the number of new businesses and a 2.2 percent increase in wage employment (Bruhn 2008). The increase in registra-tion and employment came from new activities from
BOX 4.8 Eff ects of easing business entry regulations on fi rm entry, employment, and formalization
(continues next page)

1 5 4 M O R E A N D B E T T E R J O B S I N S O U T H A S I A
former wage earners. Former unregistered business owners were not more likely to register their busi-ness after the reform.
A field experiment in Sri Lanka by De Mel, McKenzie, and Woodruff (2011) aimed to estimate the demand for formality among informal fi rms with 1–14 workers. The experiment took 500 fi rms and divided them into 5 groups, each with 100 fi rms. The fi rst group was the control group. The second group was given information on how to register with the district secretariat and obtain a business registration certifi cate and offered reimbursement of the cost of doing so. The remaining groups were also given this information. In addition, they were offered payments of Rs 10,000 (about $88, just under half a month’s profi ts for the median fi rm); Rs 20,000; or Rs 40,000 if they registered within a set timeframe.
The study found that providing information and reducing the cost of registering to zero was not enough to induce fi rms to register. In contrast, the Rs 10,000 and Rs 20,000 payments were enough to induce about one-fifth of eligible informal firms to register, and the Rs 40,000 payment was enough to induce almost half of eligible informal fi rms to do so. The fi nding that additional monetary incen-tives were required supports the “exit” hypoth-esis, which posits that the net benefi ts to formal-ization may be very low (if not negative) and that fi rms are therefore rational in choosing to remain informal, rather than the “exclusion” hypothesis, which posits that there are high net positive benefi ts to formalization and that it is the upfront costs or complexity of registration that keeps fi rms infor-mal. Firm owners asked about the possible costs of registering most often cited paying taxes (corporate and employee) and being subject to tax and labor
inspections. In terms of benefi ts, most mentioned being able to obtain a bank account, apply for bank loans, operate on a larger and more visible scale, and get contracts.
Does formalization of existing informal firms result in increased productivity and employment? The Sri Lanka study reinterviewed the same fi rms 12–18 months after formalizing, to see whether there was any evidence that formality had benefi tted them. Over this time frame it found little evidence of any of the main channels through which formality is argued to benefi t fi rms: the newly formalized fi rms had not received more credit or obtained more government contracts, they had not become more visible, and they had not hired more workers. There was also no signifi cant impact on sales or profi ts (although the study could not rule out large negative or positive impacts given how noisy the data were). These fi nd-ings suggest that informal enterprise owners acted rationally by formalizing only when provided with monetary incentives to do so.
Simplification of entry regulations alone is unlikely to be enough to get informal fi rms to for-malize, although the results show that it does not take too much of a change in net benefi ts of formal-izing to induce formalization (half the fi rms were ready to formalize for an amount equal to 1.5–2.0 months’ profi ts). Moreover, formalization is not suf-fi cient for increasing productivity. Therefore, rather than focusing on inducing existing informal fi rms to register their businesses, it may be more effec-tive to focus on directly easing constraints to their productivity. Increasing their productivity is likely to have a second-round effect on reducing informal-ity, as increasing productivity can increase returns to formalization.
BOX 4.8 Eff ects of easing business entry regulations on fi rm entry, employment, and formalization (continued)
The 2010 World Bank Doing Business indicator for starting a business indicates that the average number of procedures, time, and cost of starting a business in South Asia are on a par with or lower than in Africa, East Asia, or Latin America and the Caribbean.
India has the largest number of procedures (12) and costs in the region and is ranked lowest (165th in the world) for this indica-tor.18 Nepal ranks 96th, Pakistan 85th, Bhu-tan 84th, Bangladesh 79th, Maldives 50th, Afghanistan 25th, and Sri Lanka 24th.

W H A T I S P R E V E N T I N G F I R M S F R O M C R E A T I N G M O R E A N D B E T T E R J O B S ? 1 5 5
Annex 4A Business environment constraints in high- and low-income states in India
FIGURE 4A.1 Severity of constraints reported by benchmark fi rm
in urban formal sector in high- and low-income states in India
Source: Authors, based on Carlin and Schaff er 2011b (based on World Bank enterprise surveys).Note: A benchmark fi rm is a medium-size manufacturing fi rm with 30 employees that is domesti-cally owned, does not export or import, is located in a large city, and did not expand employment in the preceding three years. Analysis is based on a pooled sample of enterprise surveys conducted in India between 2000 and 2010. A point farther away from the origin indicates that the business constraint is considered more severe. The severity of constraint is rated by fi rms on a 5-point scale, with 0 being no obstacle, 1 being a minor obstacle, 2 being a moderate obstacle, 3 being a major obstacle, and 4 being a very severe obstacle. Access to fi nance and tax rates constraints are excluded. Political instability was not asked in the India surveys.
0.0
0.5
1.0
1.5
2.0
2.5
3.0
courts
telecoms
macroinstability
business licensing
government policy
uncertainty
competition
customs
access to landinadequately
educated labor
labor regulations
crime, theft, and disorder
transport
tax administration
corruption
electricity
India low-income states benchmark
India high-income states benchmark
TABLE 4A.1 Top five constraints reported by
benchmark fi rm in the urban formal sector in high-
and low-income states in India
Constraint
Low-income
states
High-income
states
Electricity 1 3
Corruption 2 1
Tax administration 3 2
Transport 4
Crime, theft, and
disorder 5
Labor regulations 4
Government policy
uncertainty 5
Source: Authors, based on Carlin and Schaff er 2011b (based on World Bank enterprise surveys). Note: A benchmark fi rm is a medium-size manufacturing fi rm with 30 employees that is domestically owned, does not export or import, is located in a large city, and did not expand employment in the preceding three years. Analysis is based on a pooled sample of enterprise surveys conducted in India between 2000 and 2010. Access to fi nance and tax rates constraints are excluded. Political instability was not asked in the India surveys.
The reported severity of the tax rate con-straint cannot be interpreted directly as evi-dence that tax rates are binding constraints in South Asia. This annex looks at alterna-tive indicators.
Cross-country comparison of reported severity
Although comparing the level of severity reported for the tax rate constraint with
Annex 4B Tax rates as a constraint to fi rms
other elements of the business environment is problematic, cross-country comparisons can be used to show whether the severity reported in South Asia is atypical. Figure 4B.1 shows the reported severity of the tax rate constraint for a benchmark fi rm in dif-ferent countries. It shows that independent of the level of income of the country, fi rms complain signifi cantly about tax rates. Only Pakistan reports higher severity than is typi-cal of countries at its level of development;
The division into high-income and low-income states in India is based on their net state domestic product per capita over the period 1999/2000 to 2009/10. The high income group comprises Andhra Pradesh, Goa, Gujarat, Haryana, Himachal Pradesh, Karnataka, Kerala, Maharashtra, Pun-jab, Tamil Nadu, Andaman and Nicobar Islands, Chandigarh, Delhi, and Puducherry.
The low income group comprises Arunachal Pradesh, Assam, Bihar, Chattisgarh, Jammu and Kashmir, Jharkand, Madhya Pradesh, Manipur, Meghalaya, Mizoram, Nagaland, Orissa, Rajasthan, Sikkim, Tripura, Uttar Pradesh, Uttarakhand, and West Bengal.
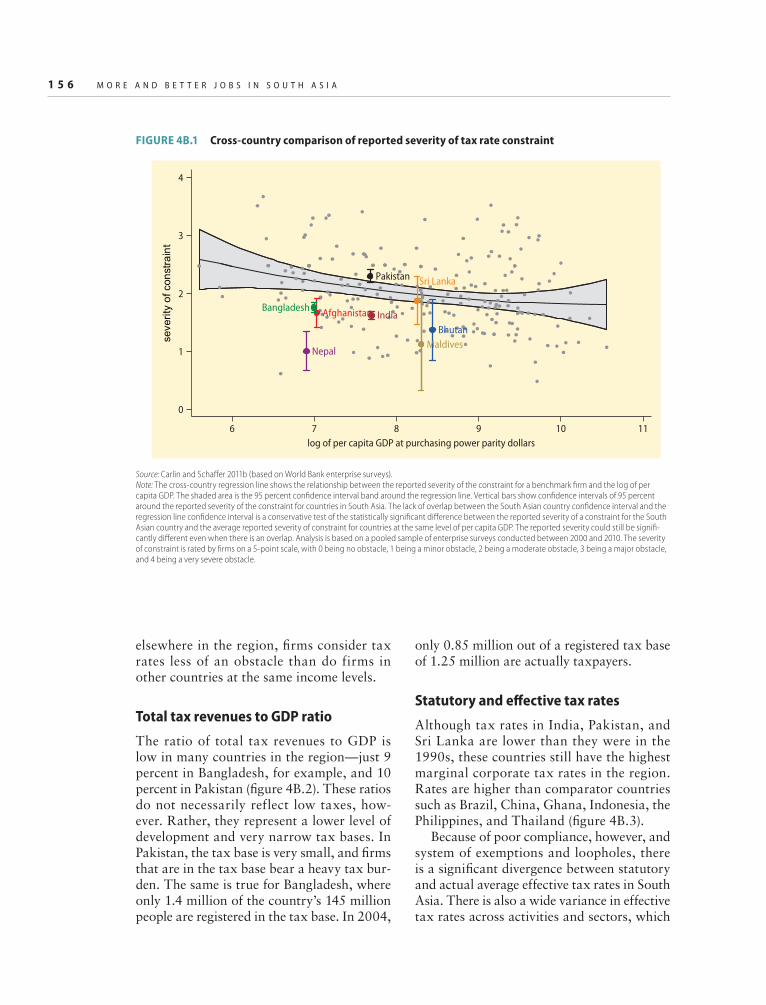
1 5 6 M O R E A N D B E T T E R J O B S I N S O U T H A S I A
3
4se
verit
y of
con
stra
int
AfghanistanBangladesh
Bhutan
India
Sri Lanka
MaldivesNepal
Pakistan
1
2
0
6 7 8 9 10 11
log of per capita GDP at purchasing power parity dollars
FIGURE 4B.1 Cross-country comparison of reported severity of tax rate constraint
Source: Carlin and Schaff er 2011b (based on World Bank enterprise surveys). Note: The cross-country regression line shows the relationship between the reported severity of the constraint for a benchmark fi rm and the log of per capita GDP. The shaded area is the 95 percent confi dence interval band around the regression line. Vertical bars show confi dence intervals of 95 percent around the reported severity of the constraint for countries in South Asia. The lack of overlap between the South Asian country confi dence interval and the regression line confi dence interval is a conservative test of the statistically signifi cant diff erence between the reported severity of a constraint for the South Asian country and the average reported severity of constraint for countries at the same level of per capita GDP. The reported severity could still be signifi -cantly diff erent even when there is an overlap. Analysis is based on a pooled sample of enterprise surveys conducted between 2000 and 2010. The severity of constraint is rated by fi rms on a 5-point scale, with 0 being no obstacle, 1 being a minor obstacle, 2 being a moderate obstacle, 3 being a major obstacle, and 4 being a very severe obstacle.
elsewhere in the region, fi rms consider tax rates less of an obstacle than do firms in other countries at the same income levels.
Total tax revenues to GDP ratio
The ratio of total tax revenues to GDP is low in many countries in the region—just 9 percent in Bangladesh, for example, and 10 percent in Pakistan (fi gure 4B.2). These ratios do not necessarily reflect low taxes, how-ever. Rather, they represent a lower level of development and very narrow tax bases. In Pakistan, the tax base is very small, and fi rms that are in the tax base bear a heavy tax bur-den. The same is true for Bangladesh, where only 1.4 million of the country’s 145 million people are registered in the tax base. In 2004,
only 0.85 million out of a registered tax base of 1.25 million are actually taxpayers.
Statutory and eff ective tax rates
Although tax rates in India, Pakistan, and Sri Lanka are lower than they were in the 1990s, these countries still have the highest marginal corporate tax rates in the region. Rates are higher than comparator countries such as Brazil, China, Ghana, Indonesia, the Philippines, and Thailand (fi gure 4B.3).
Because of poor compliance, however, and system of exemptions and loopholes, there is a signifi cant divergence between statutory and actual average effective tax rates in South Asia. There is also a wide variance in effective tax rates across activities and sectors, which

W H A T I S P R E V E N T I N G F I R M S F R O M C R E A T I N G M O R E A N D B E T T E R J O B S ? 1 5 7
6
0
5
10
15
20
25
per
cen
t
9 910 10
1213
21
12
16
20
Afghanist
an
Bhutan
Bangladesh
Pakistan
Nepal
India
Sri Lanka
Mald
ives
South A
sia
OECD
Europe and
Central A
sia
FIGURE 4B.2 Tax revenue as a percentage of GDP in South Asia
Source: World Bank 2011e.Note: OECD = Organisation for Economic Co-operation and Development.
20
25 2527 27.5
30 30
34 34 35 35
0
5
10
15
20
25
30
35
40
per
cen
t
Afghanist
an
Ghana
China
Bangladesh
Indonesia
Phillipin
es
Thailand
India
Brazil
Pakistan
Sri Lanka
FIGURE 4B.3 Highest marginal corporate tax rate in South Asian countries and selected comparator
countries
Source: World Bank 2011e.
creates distortions, because decisions about resource allocation, location, and invest-ment are driven by tax considerations rather than underlying economic reasons. The cases of Bangladesh and Pakistan are discussed below.
Taxation in Bangladesh is characterized by low collections, highly complex rules, a heavy administrative burden, and poor compliance (World Bank 2008c). It has become the norm in Bangladesh to pay minimum taxes (by, for example, underreporting profi ts) or to avoid
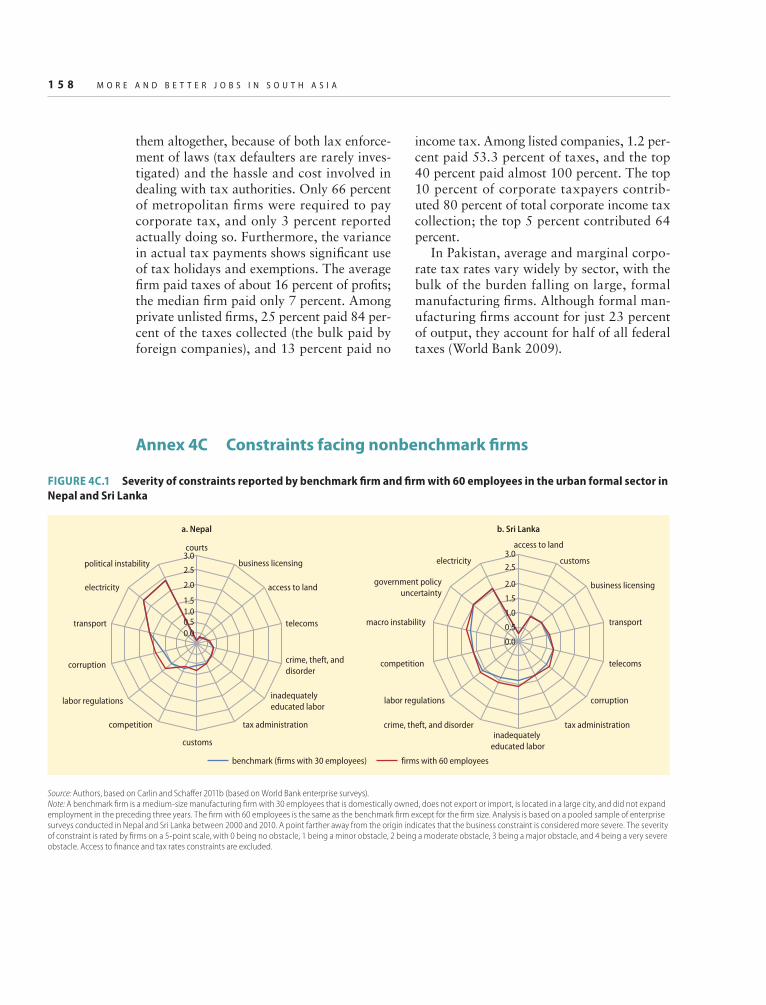
1 5 8 M O R E A N D B E T T E R J O B S I N S O U T H A S I A
0.0
0.5
1.0
1.5
2.0
2.5
3.0access to land
b. Sri Lankaa. Nepal
customs
business licensing
transport
telecoms
corruption
tax administrationinadequately
educated labor
crime, theft, and disorder
labor regulations
competition
macro instability
government policy
uncertainty
electricity
0.0
0.51.01.5
2.0
2.5
3.0courts
business licensing
access to land
telecoms
crime, theft, and
disorder
inadequately
educated labor
tax administration
customs
competition
labor regulations
corruption
transport
electricity
political instability
benchmark (firms with 30 employees) firms with 60 employees
FIGURE 4C.1 Severity of constraints reported by benchmark fi rm and fi rm with 60 employees in the urban formal sector in
Nepal and Sri Lanka
Source: Authors, based on Carlin and Schaff er 2011b (based on World Bank enterprise surveys). Note: A benchmark fi rm is a medium-size manufacturing fi rm with 30 employees that is domestically owned, does not export or import, is located in a large city, and did not expand employment in the preceding three years. The fi rm with 60 employees is the same as the benchmark fi rm except for the fi rm size. Analysis is based on a pooled sample of enterprise surveys conducted in Nepal and Sri Lanka between 2000 and 2010. A point farther away from the origin indicates that the business constraint is considered more severe. The severity of constraint is rated by fi rms on a 5-point scale, with 0 being no obstacle, 1 being a minor obstacle, 2 being a moderate obstacle, 3 being a major obstacle, and 4 being a very severe obstacle. Access to fi nance and tax rates constraints are excluded.
Annex 4C Constraints facing nonbenchmark fi rms
them altogether, because of both lax enforce-ment of laws (tax defaulters are rarely inves-tigated) and the hassle and cost involved in dealing with tax authorities. Only 66 percent of metropolitan fi rms were required to pay corporate tax, and only 3 percent reported actually doing so. Furthermore, the variance in actual tax payments shows signifi cant use of tax holidays and exemptions. The average fi rm paid taxes of about 16 percent of profi ts; the median fi rm paid only 7 percent. Among private unlisted fi rms, 25 percent paid 84 per-cent of the taxes collected (the bulk paid by foreign companies), and 13 percent paid no
income tax. Among listed companies, 1.2 per-cent paid 53.3 percent of taxes, and the top 40 percent paid almost 100 percent. The top 10 percent of corporate taxpayers contrib-uted 80 percent of total corporate income tax collection; the top 5 percent contributed 64 percent.
In Pakistan, average and marginal corpo-rate tax rates vary widely by sector, with the bulk of the burden falling on large, formal manufacturing fi rms. Although formal man-ufacturing fi rms account for just 23 percent of output, they account for half of all federal taxes (World Bank 2009).

W H A T I S P R E V E N T I N G F I R M S F R O M C R E A T I N G M O R E A N D B E T T E R J O B S ? 1 5 9
The reported severity of the access to fi nance constraint cannot be interpreted as evidence that access to fi nance is a binding constraint in South Asia. This annex looks at alterna-tive indicators.
Cross-country comparison of reported severity
Figure 4D.1 shows the reported severity of the access to finance constraint for bench-mark fi rms in different countries. It shows that in no country in South Asia do fi rms cite it as a greater obstacle than in fi rms in other countries with the same level of per capita GDP.
Financial depth
Financial depth measures the availability of fi nancial resources for the economy and for firms. The financial markets in South Asia are not shallow by measures such as domestic credit to the private sector as a
percentage of GDP, and they are generally experiencing rapid growth. Indeed, fi nancial depth has been increasing in all countries in South Asia except Sri Lanka.
In 2008, domestic credit to the private sector as a share of GDP was 29 percent in Sri Lanka and Pakistan, 30 percent in Bhu-tan, 39 percent in Bangladesh, 51 percent in India, and 56 percent in Nepal (Hoxha 2011). Compared with countries with similar levels of per capita GDP (which is positively corre-lated correlation with fi nancial depth), only Bhutan is signifi cantly below average.
Cost of fi nance
Using lending interest rates to assess the cost of fi nance is diffi cult, because there is a high level of state intermediation in many South Asian countries: interest rates in Bangladesh, India, and Pakistan are not freely set by the market. Nevertheless, lending rates in South Asia are not high compared with other coun-tries at the same level of per capita GDP.
0.0
0.5
1.0
1.5
2.0
2.5
3.0labor regulation
courts
transport
business licensing
crime, theft, and
disorder
inadequately
educated labor
telecoms
customscompetition
macroinstability
government policy
uncertainty
tax administration
access to land
corruption
political instability
electricity
0.0
0.5
1.01.5
2.0
2.5
3.0telecoms
a. South Asia b. Bangladesh
courts
business licensing
transport
labor regulations
inadequately
educated labor
customs
access to landcrime, theft, and disorder
competition
macroinstability
government policy
uncertainty
tax administration
corruption
electricity
political instability
benchmark (nonexporting) exporters
FIGURE 4C.2 Severity of constraints reported by benchmark (nonexporting) and exporting fi rm in the urban formal sector
in South Asia and Bangladesh
Source: Authors, based on Carlin and Schaff er 2011b (based on World Bank enterprise surveys). Note: A benchmark fi rm is a medium-size manufacturing fi rm with 30 employees that is domestically owned, does not export or import, is located in a large city, and did not expand employment in the preceding three years. The exporter fi rm is the same as the benchmark fi rm except that it exports. Analysis is based on pooled sample of enterprise surveys con-ducted in South Asia and Bangladesh between 2000 and 2010. A point farther away from the origin indicates that the business constraint is considered more severe. The severity of constraint is rated by fi rms on a 5-point scale, with 0 being no obstacle, 1 being a minor obstacle, 2 being a moderate obstacle, 3 being a major obstacle, and 4 being a very severe obstacle. Access to fi nance and tax rates constraints are excluded.
Annex 4D Access to fi nance as a constraint to fi rms

1 6 0 M O R E A N D B E T T E R J O B S I N S O U T H A S I A
Financial outreach and access
Outreach is a measure of financial inclu-siveness; it is captured here by variables such as the percent of fi rms with access to a loan or other fi nancial products. Enterprise surveys show large variation in access to external finance for firms both across and within countries, with smaller firms having less access, leading to claims of a small and medium-size enterprise fi nance gap, particularly in emerging economies, where larger enterprises are frequently the main beneficiaries of tax incentives and corporate subsidies and aid is targeted at microenterprises.19
Small firms in the urban formal sector in Afghanistan, Pakistan, and, to a lesser extent, India use external fi nance less than small fi rms in other countries (fi gure 4D.2). Only 2 percent of fi rms in Afghanistan and
5 percent of fi rms in Pakistan use banks to finance working capital compared with 36 percent in India, 43 percent in Bangladesh, and 52 percent in Sri Lanka. Small fi rms in Afghanistan and Pakistan finance a larger share of working capital (88–91 percent) from internal financial sources than large fi rms (63–88 percent).
Moreover, comparable survey data in Afghanistan, Bangladesh, and Pakistan show no clear trend in terms of the share of invest-ment financed by internal funds (retained earnings); external fi nance (banks and non-bank financial institutions); and informal finance (family, friends, moneylenders) in the past fi ve years for a benchmark fi rm in the urban formal sector. Internal funds con-tinue to fi nance most investment.
Use of external fi nance is even lower among rural and informal fi rms, which are typically microenterprises, and often reflects lower
Afghanistan
Bangladesh
Bhutan
India
Sri Lanka
Maldives
Nepal
Pakistan
0
1
2
3
4
seve
rity
of c
on
stra
int
6 7 8 9 10 11
log of per capita GDP at purchasing power parity dollars
Access to Finance
FIGURE 4D.1 Cross-country comparison of reported severity of access to fi nance constraint
Source: Carlin and Schaff er 2011b (based on World Bank enterprise surveys).Note: The cross-country regression line shows the relationship between the reported severity of the constraint for a benchmark fi rm and the log of per capita GDP. The shaded area is the 95 percent confi dence interval band around the regression line. Vertical bars show confi dence intervals of 95 percent around the reported severity of the constraint for countries in South Asia. The lack of overlap between the South Asian country confi dence interval and the regression line confi dence interval is a conservative test of the statistically signifi cant diff erence between the reported severity of a constraint for the South Asian country and the average reported severity of constraint for countries at the same level of per capita GDP. The reported severity could still be signifi -cantly diff erent even when there is an overlap. Analysis is based on pooled sample of enterprise surveys conducted between 2000 and 2010. The severity of constraint is rated by fi rms on a 5-point scale, with 0 being no obstacle, 1 being a minor obstacle, 2 being a moderate obstacle, 3 being a major obstacle, and 4 being a very severe obstacle.

3640
34
6
57
26
38
15
35
51
58
48
2
64
44
50
43
55
6367
50
11
78
48
68
55
50
0
10
20
30
40
50
60
70
80
90
per
cen
t
Europe and
Central A
siaLatin
Am
erica and
the C
aribbean
East Asia
andPacifi
c
16
32
45
Africa
Afghanist
an2010
Bhutan
2009 India
2010 Nepal2009
Pakistan
2010
Sri Lanka
2010
small (5–19 employees) medium (20–99 employees) large (100 or more employees)
FIGURE 4D.2 Percentage of fi rms with credit line or loan from fi nancial institution, by fi rm size and region
Source: Authors, based on World Bank enterprise surveys.
16
1

1 6 2 M O R E A N D B E T T E R J O B S I N S O U T H A S I A
access to banking services. In Bangladesh, only 9 percent of fi rms in nonmetropolitan areas have bank accounts, compared with 95 percent in metropolitan areas, and only 6 percent of nonmetropolitan enterprises use formal fi nance.
In the informal sector in India, 89 percent of enterprises had bank accounts, but less than 20 percent had a loan (from informal or formal sources). Only 6–9 percent of infor-mal fi rms had a loan from a fi nancial institu-tion (versus 26 percent of small fi rms in the formal sector).
In Pakistan, very few rural firms deal with the formal banking sector: only 10–12 percent of enterprises keep savings, and less than 10 percent maintain checking accounts. About 43 percent enterprises in villages and 58 percent in small towns made investments the year preceding the survey, but nearly 90 percent were made with savings. Among surveyed business owners in rural areas, 24–28 percent wanted to apply for a formal loan, but only 4–7 percent actually did so. Among fi rms in Pakistan that wanted a loan but did not apply for one, 40 percent cited loan procedures that were too complicated, 27 percent cited interest rates that were too high, 16 percent cited insuffi cient collateral, and 8 percent cited the shortness of the loan duration. Two-thirds of loan applications were approved. Among rejected applica-tions, 36 percent were refused because of insuffi cient collateral. Eighty percent of for-mal loans require collateral, and the average
value of the collateral required was 132 per-cent of the loan amount. The most common forms of collateral were property/buildings and land. In summary, there is evidence of unmet demand for the rural nonfarm sector in Pakistan.
Institutional indicators
Creditors care about the broader institu-tional environment (Djankov, McLiesh, and Shleifer 2007). A World Bank (2008b) study, based on an April 2007 survey of commer-cial banks, addresses the issue of access to credit from the perspective of supply. It reviews the factors that limit the willingness of fi nancial institutions to lend or increase their incentives to charge higher interest rates. Key concerns were problems with col-lateral registration and enforcement; lim-ited information (the result of the lack of a well-functioning credit registry); and poor accounting and auditing practices, which limit verifi able fi nancial information. Some countries in South Asia have weak legal and property rights, but the region as a whole performs better in this regard than Africa and the Middle East and North Africa and is on par with Latin America and the Carib-bean and East Asia and Pacific. In terms of credit, public and private credit bureau coverage in South Asia is lower than in any other region, although the depth of credit information is better than in Africa and East Asia and Pacifi c.
Annex 4E Policy options for increasing access to fi nance
This annex describes four policy areas that can increase access to fi nance, particularly for micro, small, and medium-size enter-prises (Hoxha 2011).
Operationalize secure transactions registeries
Lack of credit information on custom-ers and weak contract enforcement means
that banks are generally not willing to lend without secure collateral. Micro, small, and medium-size enterprises find it harder to meet collateral requirements: in Bangladesh 30.8 percent of small firms (compared to 4.2 percent of large fi rms) found collateral requirements too high (World Bank 2008c). Banks usually require immovable property, such as land, buildings, or an owner’s assets, to secure a loan. Most micro, small, and

W H A T I S P R E V E N T I N G F I R M S F R O M C R E A T I N G M O R E A N D B E T T E R J O B S ? 1 6 3
medium-size enterprise fi rms’ property and assets are vested in movable property, such as machinery and inventory.
For example, in India an immovable asset of the enterprise (60 percent of loans) or a personal asset of the owner (25 percent of loans) is usually required as collateral. Such assets account for a small percentage of the total asset value of unorganized fi rms. More-over, in about half of cases, the collateral required was more than twice the amount of the loan (Ferrari and Dhingra 2009). In Sri Lanka, collateral in the form of land is espe-cially important for rural enterprises, but high levels of public landownership, unclear ownership records, and widespread restric-tions on the use and transfer of land make it difficult to use land as collateral (World Bank 2005).
In the absence of a secured transactions mechanism, lenders find it risky to accept movable property as collateral. A secured transactions mechanism facilitates lending by eliminating information asymmetries about collateral and reducing the risk of lending secured by movables.
Successful models of secured transac-tions registry include the creation of a reg-istration database in which a public record of obligations secured by movable property can be made; the setting of priorities in case of multiple obligations of the same security giver as secured by the same collateral; and the establishment of a means to uniformly enforce secure interests in case the security giver defaults.
Deepen the reach of credit bureaus
Credit bureaus promote deeper financial systems by helping overcome adverse selec-tion and moral hazard related to asymmet-ric information in credit markets (Djankov, McLiesh, and Shleifer 2007). As a result of the cost savings achieved through more effi -cient and accurate credit analysis and lower expected losses, lenders can increase their credit extension. Using cross-country fi rm-level survey data and survey data of credit bureaus, Love and Mylenko (2003) fi nd that
the existence of private credit bureaus is associated with lower fi nancing constraints and a larger share of bank financing. In addition, small and medium-size enterprises tend to have a larger share of bank fi nancing in countries where private registries exist. Currently, credit bureau coverage in South Asia is the lowest of any region. It is par-ticularly low in Afghanistan, Bangladesh, Bhutan, Nepal, and Pakistan.
Downscale commercial banks and upscale microfi nance institutions
Access depends not only on the terms and cost of fi nance but also on other barriers, such as eligibility criteria; procedural exclu-sions (high minimum loan size requirements, documentation requirements, days to pro-cess loans); and lack of appropriate fi nancial products for micro, small, and medium-size enterprises.
A crucial function of fi nancial intermedi-aries is to screen borrowers. The number of days it takes to process a loan application can be a de facto eligibility barrier, because some borrowers may be discouraged from applying for bank loans and seek financ-ing elsewhere to avoid long waiting periods. Beck, Demirgüç-Kunt, and Peria (2007) fi nd that on average loan applications by small and medium-size enterprise take more than a month to process in Bangladesh (43 days) and Pakistan (34 days). In contrast, the median number of days for the 60 countries in their sample was nine days.
Lack of documentation can create other eligibility barriers. Bangladesh and Nepal require at least four documents, including an identity card or passport, a recommenda-tion letter, a wage slip, and proof of domicile. For the 60 countries Beck, Demirgüç-Kunt, and Peria examine, the average number of documents was two. Given the high degree of informality in South Asia, only a small pro-portion of potential borrowers can produce these documents.
Standard financial products offered by banks, such as lines of credit, are designed for large corporations (the traditional client

1 6 4 M O R E A N D B E T T E R J O B S I N S O U T H A S I A
BRAC Bank Ltd. was established in Bangladesh in 2001, with a focus on the small business sector. Its small and medium-size enterprise banking unit goes beyond traditional banking, working with entrepre-neurs as a business partner by building awareness, providing training, and arranging road shows to support and develop clients’ businesses. BRAC Bank is the number one small business bank in Bangla-desh in terms of loans outstanding, with nationwide coverage (44 percent of coverage is in rural areas). The bank’s small business banking model empha-
sizes relationship banking and collateral-free lend-ing of up to $14,000.
Upscaling relies heavily on support from inter-national and domestic fi nancial institutions in the start-up phase. Such support is particularly impor-tant in adapting microfinance institutions’ lend-ing technologies to serve the new clientele and in building the capacity of staff. BRAC Bank’s sec-ond- and third-largest shareholders are Shorecap International Limited and the International Finance Corporation.
BOX 4E.2 Scaling up microfi nance institutions: The case of BRAC Bank
ICICI Bank is the largest private sector bank in India. Its small and medium-size enterprise banking model is based on segmentation of the market by industry and business linkages; a proprietary risk evaluation covering fi nancial and nonfi nancial parameters to compensate for enterprises’ lack of fi nancial informa-tion; and a “beyond lending approach,” which relies primarily on deposit products and other banking services (used by 95 percent of small and medium-size enterprise clients) rather than lending products (used by just 5 percent of such clients). Client ser-vicing is done though multiple channels, including relationship managers, doorstep banking, branches, the Internet, and automatic teller machines.
In 2002, Standard Chartered Bank implemented a client-centric model on a global scale, creating a separate small and medium-size enterprise bank-ing operation, with its own resources and credit processes, within its consumer bank unit. Today, this business unit operates in more than 30 coun-tries. The bank follows three customer acquisition and servicing approaches: relationship managers handle larger medium-size enterprises; a portfolio team made up of salespeople and virtual relation-ship managers handle midsize small and medi-um-size enterprises; and branches handle smaller businesses, whose needs are similar to those of individuals.
BOX 4E.1 Successful approaches to small and medium-size business banking
for South Asian banks). They are inappropri-ate for many small businesses, which do not deposit their revenues in banks.
To serve small businesses well and prof-itably, banks need to simplify procedures for small business loans; design appropriate fi nancial products for micro, small, and medi-um-size enterprises; reduce reliance on col-lateral and modernize lending based on risk and credit information; and use technology
to reduce transaction costs and generate deal volume. Some banks have been successful in downscaling to the small and medium-size enterprise market, achieving high levels of outreach, scale, and sustainability (box 4E.1).
Microfinance institutions need to adapt their business model and product offerings to the small and medium-size enterprise mar-ket. One institution that has done so is BRAC Bank (box 4E.2).

W H A T I S P R E V E N T I N G F I R M S F R O M C R E A T I N G M O R E A N D B E T T E R J O B S ? 1 6 5
Commercial downscaling and microfi-nance institution upscaling should be led by banks themselves. Governments can facilitate the process by creating an enabling regula-tory and institutional environment—by, for example, revising rules on provisioning and credit bureau reporting, which make it expen-sive to serve smaller fi rms. Governments can also look into using credit guarantee schemes and other fi nancial products aimed at reduc-ing the risk associated with lending to small and medium-size enterprises. Such schemes would address information asymmetries, the high costs of processing small credit transac-tions, and constraints in the enforcement of contracts.
Provide technical assistance and fi nancial literacy training
Small and medium-size enterprises face sev-eral nonfi nancial barriers that are related to their own capacity. Managers or owners of such fi rms usually perform a wider range of tasks than their managers or owners of larger firms. Moreover, small and medium-size enterprises cannot take advantage of econo-mies of scale related to accounting, business planning, and market research to the same extent as large fi rms can. Enterprise survey data indicate that only 37 percent of small fi rms have their annual fi nancial statement reviewed by an external auditor, compared with 58 percent of medium-size fi rms and 79 percent of large fi rms (Hoxha 2011). In Bangladesh, a quarter of smaller urban fi rms fi nd the procedures for applying for a loan too complex (compared with only 1.2 percent of large urban fi rms) (World Bank 2008c). Only about 5 percent of village enterprises and 11 percent of small town enterprises in Pakistan prepare fi nancial statements.
Technical assistance and fi nancial liter-acy training can be provided to small and medium-size enterprises to increase their capacity to keep better accounts and develop and present bankable proposals. Doing so would ensure that such enterprises have the capacity to successfully apply for loans and effectively use loans for the growth of their businesses.
Notes
1. The fi rst study sets out the methodological framework and tests predictions of how a fi rm’s evaluation of the cost of constraints imposed by its external environment varies with the fi rm’s characteristics. These tests confi rm the predictions of the model and provide the empirical basis for using, in the second and third studies, the reported sever-ity of constraints to assess which elements of the external environment are most problem-atic for fi rms across South Asia and in each country.
2. Eighteen constraints appear in the enter-prise surveys: electricity; telecommunica-tions; transport; access to land; inadequately educated labor; macroeconomic instability; government policy uncertainty; political instability; access to fi nance; competition; tax administration; tax rates; labor regula-tions; customs; business licensing; courts; corruption; and crime, theft, and disorder. Surveys in Afghanistan, Bhutan, and Nepal did not ask about macroinstability or gov-ernment policy uncertainty. Surveys in India, Maldives, and Sri Lanka did not ask about political instability.
3. The World Bank enterprise surveys portal contains data on almost 120,000 urban for-mal fi rms (16,000 in South Asia) from more than 230 surveys in 126 countries conducted between 2000 and 2010 (see http://www.enterprisesurveys.org/).
4. The Bangladesh rural survey covered peri-urban areas, small towns, and rural villages. The Pakistan rural survey covered small towns and rural villages. The Sri Lanka rural survey covered rural areas as defi ned by the Department of Census and Statistics.
5. Only the 2001 survey was used in the formal analysis of the severity of constraints, because the constraint question in 2005 did not use the standard 0–4 scale. The ranking of con-straints from the 2005 informal survey was used to check the results.
6. In addition, to facilitate better comparison, fi rms with more than 20 employees were dropped from the sample of urban formal fi rms.
7. The states were grouped based on net state domestic product per capita over the previous 10 years.
8. Empirical evidence on other developing regions indicates that because they lack the economies of scale to operate a power

1 6 6 M O R E A N D B E T T E R J O B S I N S O U T H A S I A
generator effi ciently, small and medium enterprises, which create a large share of new jobs, are the most affected in areas without access to electricity or an unreliable pub-lic grid (Aterido, Hallward-Driemeier, and Pagés 2007).
9. Results reported are from partial correla-tions with other indicators of fi rm produc-tivity in the pooled sample of South Asian fi rms with country fi xed effects and controls for fi rm size, sector, location, exporting and importing status, and ownership (Carlin and Schaffer 2011c).
10. Expanding fi rms in Afghanistan and Bangladesh fi rms report lower costs than the benchmark fi rm. A hypothesis on why this may be the case in Bangladesh is that expand-ing fi rms are located in export processing zones, which face especial conditions that lower the constraints.
11. This fi nding is consistent with a 2007 Organisation for Economic Co-operation and Development (OECD) economic survey of India that describes the service sector as being less dependent on electricity and less subject to labor regulations; the sector also faces lower indirect taxation and has access to better infrastructure and a more condu-cive business environment. The OECD sur-vey makes the case that growth in the service sector has been more dynamic because these constraints are less binding.
12. The regression model assumes a linear rela-tionship between fi rm characteristics and reported severity, so that if, on average, larger fi rms (more than 30 employees) report more severe constraints than the benchmark fi rm (30 employees), on average, smaller fi rms (fewer than 30 employees) will report less severe constraints.
13. Using the rural enterprise and household sur-veys, Deininger, Jin, and Sur (2007) fi nd that the top fi ve reported constraints among rural fi rms in Sri Lanka were also the most signifi -cant determinants of new nonfarm enterprise start-ups. In areas where electricity is a major constraint, the propensity to start up a fi rm is 14 percent lower. Distance to banks, poor road access, credit constraints, and lack of market demand are all negatively correlated with the probability of starting up a business.
14. Enterprises that sell to larger fi rms are less likely than enterprises that sell directly to local consumers to complain about low demand (World Bank 2008c).
15. About 305 urban manufacturing fi rms had subcontracting arrangements for input pur-chases, but only 1 percent purchased inputs from fi rms/distributors located in villages.
16. Other controls in the ordinary least squares regression include the number of urban cen-ters in the district, the number of urban cen-ters in a region, distance to district headquar-ters, the average height and slope of land, and the population density in the village.
17. The second Bangladesh investment climate assessment (World Bank 2008c) concludes that overall lending to the private sector had improved and was adequate in Bangladesh but that lending to small fi rms and nonurban fi rms remained inadequate because of lack of appropriate lending techniques and products for micro, small, and medium-size enterprises.
18. A procedure is defi ned as any interaction between the company founders and exter-nal parties (for example, government agen-cies, lawyers, auditors, or notaries). Cost is measured as a percentage of the economy’s income per capita. It is measured in two ways: (a) all offi cial fees and fees for legal or profes-sional services if such services are required by law and (b) the amount the entrepreneur needs to deposit in a bank or with a notary before registration and up to three months following incorporation, as a percentage of the economy’s income per capita.
19. A 2008 World Bank enterprise survey of more than 50,000 fi rms in more than 70 countries indicates that small and medium-size fi rms rank access to and cost of fi nance as one of their top constraints to growth.
References
Alby, P., J. J. Dethier, and S. Straub. 2010. “Firms Operating under Infrastructure and Credit Constraints in Developing Countries. The Case of Power Generators.” Policy Research Working Paper 5497, World Bank, Washington, DC.
ADB (Asian Development Bank). 2009. Enterprises in Asia: Fostering Dynamism in SMEs. Manila.
———. 2010. Bhutan Energy Sector: Sector Assistance Program Evaluation. Manila.
Aterido, R., M. Hallward-Driemeier, and C. Pagés. 2007. “Business Climate and Employment Growth: The Impact of Access to Finance, Corruption and Regulation Across firms.”

W H A T I S P R E V E N T I N G F I R M S F R O M C R E A T I N G M O R E A N D B E T T E R J O B S ? 1 6 7
IZA Discussion Paper, Institute for the Study of Labor, Bonn.
Banerjee, A., and E. Dufl o. 2008. “Do Firms Want to Borrow More? Testing Credit Constraints Using a Directed Lending Program.” CEPR Discussion Paper 4681, Center for Economic and Policy Research, Washington, DC.
Banerjee, S. G., A. Singh, and H. Samad. 2011. Power and People: The Benefi ts of Renewable Energy in Nepal. World Bank, South Asia Sustainable Development, Washington, DC.
Banerji, D., and M. Mishra. 2010. “Power Sector to Lead Infra Investments in 12th Plan.” Business Standard, December 29, New Delhi. http://www.business-standard.com/india/news/power-sector-to-lead-infra-investments-in-12th-plan/419972/.
Beck, T., A. Demirgüç-Kunt, and V. Maksimovic. 2005. “Financial and Legal Constraints to Firm Growth: Does Firm Size Matter?” Journal of Finance 60 (1): 137–77.
Beck, T., A. Demirgüç-Kunt, and M. Peria. 2007. “Banking Banking Services for Everyone? Barriers to Bank Access and Use around the World.” Policy Research Working Paper 4079, World Bank, Washington, DC.
Besant-Jones, J. 2006. “Reforming Power Markets in Developing Countries. What Have We Learned?” Energy and Mining Sector Board Discussion Paper 19, World Bank, Washington, DC. http://siteresources.worldbank.org/ INTENERGY/Resources/Energy19.pdf.
Bhatia, B., and M. Gulati. 2004. “Reforming the Power Sector: Controlling Electricity Theft and Improving Revenue.” Note 272 Private Sector Development, World Bank, Washington, DC. http://rru.worldbank.org/documents/publicpolicyjournal/272bhatia_Gulati.pdf.
Bird, R., and M. Zolt. 2007. “Tax Policy in Emerging Countries.” International Tax Program Paper 0707. University of Toronto.
Bruhn, M. 2008. “License to Sell: The Effect of Business Reg is t rat ion Reform on Entrepreneurial Activity in Mexico.” Policy Research Working Paper 4538, World Bank, Washington, DC.
Carlin, W., and M. Schaffer. 2011a. “A Comparison of Business Environment Constraints between Formal Sector Firms and Rural and Informal Sector Firms.” Background study conducted for this book.
———. 2011b. “Which Elements of the Business Environment Matter Most for Firms and How
Do They Vary Across Countries?” Background study conducted for this book.
———. 2011c. “How Do Business Environment Constraints Vary with Firm Efficiency and Dynamism?” Background study conducted for this book.
Central Electricity Regulatory Commission. 2011. Report on the State of Short-Term Power Market in India. New Delhi.
Ceylon Electricity Board. 2009. “Statistical Digest 2009.” Colombo, Sri Lanka.
CRISIL Risk and Infrastructure Solutions Limited. 2011. The Study on Skill Gaps and Employment Opportunities in Power Sector in India. Report submitted to World Bank, Washington, DC.
Deininger, K., S. Jin, and M. Sur. 2007. “Sri Lanka’s Rural Non-Farm Economy: Removing Constraints to Pro-Poor Growth.” World Development 35 (12): 2056–78.
De Mel, S., D. McKenzie, and C. Woodruff. 2011. “What Is the Cost of Informality? Experimentally Estimating the Demand for Formalization.” Unpublished paper.
Devaiah, D. 2010. Government of Gujarat: Jyotigram Yojana. http://www.scribd.com/doc /33811921/Government-of-Gujarat-Jyotigram-Yojana.
Dininio, P., S. J. Kpundeh, and R. Leiken. 1988. A Handbook on Fighting Corruption. U.S. Agency for International Development (USA ID), Center for Democracy and Governance, Washington, DC.
Djankov,S., C. McLiesh, and A. Shleifer. 2007. “Private Credit in 129 Countries.” Journal of Financial Economics 8 (4): 299–329.
Economic Times. 2011. “Infra Sector Needs Rs 41 Lakh Cr Investment in 12th Plan Period: Economic Survey.” February 25. http://articles.economictimes.indiatimes.com/2011-02-25/news/28634119_1_power-sector-national-forest-land-bank-land-acquisition.
Ferrari, A. and I.S. Dhingra. 2009. India’s Investment Climate Assessment: Voices of Indian Business. World Bank, South Asia Region, Washington, DC.
Gill, J. B. S. 2003. The Nuts and Bolts of Revenue Generation. World Bank, Washington, DC.
Government of India. 2009. Position Paper on Power Sector in India. Department of Economic Affairs, New Delhi.
Government of Pakistan. 2010. Economic Survey 2009–10. Ministry of Finance, Islamabad. http://www.finance.gov.pk/survey_0910.html.

1 6 8 M O R E A N D B E T T E R J O B S I N S O U T H A S I A
Hoxha, I. 2011. “Access to Finance in South Asia.” Background study conducted for this book.
IDFC (Infrastructure Development Finance Company Limited). 2010. “India Infrastructure Report: Infrastructure Development in a Low-Carbon Economy.” New Delhi.
IIP (Institute of Public Policy). 2009. State of the Economy: Emerging from the Crises. Second Annual Report. Beaconhouse National University, Lahore.
IMF (International Monetary Fund). 2010. World E conomic Out look Database , October. Washington, DC. http:www.imf.org/external/pubs/ft/weo/2010/02/weodata/index.aspx
Klapper, L., and I. Love. 2010. “The Impact of Business Environment Reforms on New Firm Registration.” Policy Research Working Paper 5493, World Bank, Washington, DC.
KPMG. 2009. Think BRIC: India . Key Considerations for Investors Targeting the Power Sectors of the World’s Largest Emerging Economies. Mumbai.
Love, I ., and N. Mylenko. 2003. “Credit Reporting and Financing Constraints.” Policy Research Working Paper 3142, World Bank, Washington, DC.
Mint. 2011. “Can’t Erase State Power Firms’ Losses at One Go.” January 4.
Mishra, P. 2010. Alleviating Energy Poverty through Innovation. The Case of Jytotigram Yojana of Gujarat. http://www.worldenergy.org/documents/congresspapers/228.pdf.
OECD (Organisation for Economic Co-operation and Development). 2007. “OECD Economic Surveys: India.” Paris.
Quah, John. 2007. Combating Corruption Singapore-Style: Lessons for Other Asian Countries. Maryland Series in Contemporary Asian Studies 2-2007 (189), University of Maryland School of Law, Baltimore, MD.
Transparency International. 2010. Corruption Percept ions Index 2010. ht tp: / /w w w.transparency.org/policy_research/surveys_indices/cpi/2010/results.
Trimble, C., N. Yoshida, and M. Saqib. 2011. Rethinking electricity tariffs and subsidy policy in Pakistan. Report 62971-PK, World Bank, Washington, DC.
USA I D (U. S . Agency for I nternat iona l Development). 2007. Impact and Benefits of Power Trading in the South Asia Growth Quadrangle. http://www.sari-energy.org/successdocs/ImpactBenefi tsSAGQ.pdf.
Van, Sou Leng. 2011. “Competit iveness Partnerships: How the Cambodia Government Private Sector Forum (G-PSF) Helps the Garment Industry Grow.” Presentation to the World Bank, April, Washington, DC.
World Bank. 2005. Sri Lanka: Improving the Rural and Urban Investment Climate. Washington, DC.
———. 2008a. The Afghanistan Investment Climate Assessment. Washington, DC.
———. 2008b. Finance for All? Policies and Pitfalls in Expanding Access. Washington, DC.
———. 2008c. Harnessing Competitiveness for Stronger Inclusive Growth: Bangladesh Second Investment Climate Assessment. Washington, DC.
———. 2009. Pakistan Investment Climate Assessment. Washington, DC.
———. 2010a. Impact of the Global Financial Crisis on Investments in South Asia’s Electric Power Infrastructure. India, Bangladesh, and Pakistan. Report 56849-SAS. Washington, DC.
———. 2010b. Sri Lanka: Environmental Issues in the Power Sector. South Asia Sustainable Development, Washington, DC.
———. 2011a. India Urbanization Review. Washington, DC.
———. 2011b. Perspectives on Poverty in India: Stylized Facts from Survey Data. Washington, DC.
———. 2011c. PPI database. Washington, DC. http://www.ppi.worldbank.org.
———. 2011d. Sri Lanka Infrastructure Assessment. Washington, DC.
———. 2011e. World Development Indicators. Washington, DC.
