chapter 4 trends in the united states and western europe deficit... · longitudinal trends are...
TRANSCRIPT
DEMOCRATIC DEFICITS: CHAPTER 4 2/16/2010 7:35 PM
1
Chapter 4
Trends in the United States and Western Europe
The assumption that the general public in established democracies has become deeply
disillusioned with government and politics is so pervasive today that many accounts jump straight into
the discussion of consequences and solutions, without questioning the evidence. To understand these
claims, Part I summarizes what is known about system support from the previous research literature,
where concern about trust and confidence in governing institutions has usually waxed and waned over
the years, with scholarly accounts reflecting the impact of contemporary political events, real politik,
and global waves of democratization. Part II sets out the interpretative framework used for describing
and interpreting trends in citizen’s orientations, emphasizing the importance of paying close attention to
the ‘when’, ‘where’, and ‘what’ has changed. This chapter focuses upon comparing established
democracies, as the longest and richest time‐series survey data is available in these societies.
Longitudinal trends are documented in the United States and Western Europe, all affluent societies with
extensive historical experience of democracy. Using the Eastonian framework discussed earlier, the
chapter first compares developments in the most specific levels of support, including attitudes towards
particular government agencies, and then moves upwards to consider more diffuse indicators of
satisfaction with the general performance of democratic regimes and the strength of core attachments
to the nation state.
The longitudinal evidence available within the United States and Western Europe challenges
conventional claims that an inevitable downward spiral of public disenchantment with politics has
occurred across all established democracies. In particular, when changes in system support do occur, it
is usually far more common to observe fluctuations over time in successive surveys, rather than
straightforward linear or uniform decline. Some cross‐national changes in system support do
occasionally occur simultaneously ‐‐symbolized by the events of 9/11, after which support for
government appears to peak simultaneously across many countries ‐‐ but these are the exception, not
the rule. In terms of ‘where’ changes occur, persistent cultural differences can be observed over many
years even among relatively similar nations, such as contrasting levels of confidence in government in
Italy and Spain, different levels of trust in parties in the Netherlands and Belgium, and diverse patterns
of national pride in Germany and France. During the last decade, a few established democracies (notably
the UK and Portugal) experienced a rising tide of mistrust about government institutions, which should
raise concern in these particular countries, although during the same period, Belgium and Finland

DEMOCRATIC DEFICITS: CHAPTER 4 2/16/2010 7:35 PM
2
experienced the reverse.1 Lastly in terms of ‘what’ changes occur, instead of a uniform general pattern,
contrasts in public attitudes towards different branches of government are apparent within each
country, including in the United States, exemplified by different levels of trust and confidence in the
legislature and in the courts. Perhaps most importantly for an accurate diagnosis, at the most diffuse
level, public satisfaction with the general performance of democracy in Western Europe has usually
strengthened over time, not weakened. Affective attachments to the nation‐state remain strong and
stable.
This complexity indicates the need for differentiated and nuanced arguments which can account
for cross‐national variance and the dynamics of longitudinal flux in political support. The diagnosis
suggests that it would probably be most fruitful to investigate short and medium‐term explanations of
any changes in indicators of system support, abandoning over‐simple claims about steadily growing
public disenchantment with politics across all established democracies – or indeed across the world.2
Hence the most promising hypotheses concern the instrumental performance of governments and
public sector institutions, rather than propositions which posit glacial long‐term social trends, such as
processes of human development and cultural evolution. The next chapter builds upon these
conclusions by comparing cross‐national patterns in the far broader range of countries, cultural regions
and types of regimes included in the 2005 wave of the World Values Survey, setting developments in
the US and Western Europe within a global perspective.
I: The debate about critical citizens in established democracies
The earliest surveys of American public opinion towards government were conducted during the
decade after the end of World War II, at a time when the role and functions of the federal government
had expanded greatly under the New Deal Roosevelt administration, and when the United States had
recently emerged as victorious and economically dominant in the world. It was often assumed that
during this era American public opinion was relatively favorable towards the role of government. Rather
than a ‘golden age’, however, the earliest studies conducted by Hyman and Sheatsley in 1954, McClosky
in 1958, and Mitchell in 1959 described American post‐war attitudes as ambivalent towards
government; public opinion typically expressed pride in U.S. democracy and yet considerable skepticism
about the morality and honesty of elected politicians. The American, Mitchell concluded, “tends to
expect the worst in politics but hopes for the best”. 3
Systematic comparative work on public opinion towards government originated during the late‐
1950s and early‐1960s, with Almond and Verba’s landmark study of The Civic Culture. The theoretical
DEMOCRATIC DEFICITS: CHAPTER 4 2/16/2010 7:35 PM
3
impetus for this work reflected contemporary concern to understand the underlying causes of regime
instability during the second great reverse wave of democracy.4 The context included the historic rise of
Nazi Germany and Italian fascism and the global disruption of the Second World War, as well as the
collapse during the 1960s of fledgling parliamentary democracies in many newly independent African
states emerging from colonial rule, and the checkered political experience of Latin America, due to a
succession of military coups, populist dictators, and Communist revolution.5 The central message
emerging from The Civic Culture emphasized that political stability required congruence between culture
and structure. Almond and Vera argued that the democratic public needed to be finely balanced in
equilibrium between the dangers of either an excessively deferential, apathetic and disengaged
citizenry, on the one hand, or an overly‐agitated, disenchanted, and heated engagement, on the other.
An optimal level of political trust was posited in stable democratic states, such as Britain and the U.S.,
where active and watchful citizens checked the powerful, without succumbing to the destabilizing forces
of either excessive loyalty and deference, at one pole, or else excessive disaffection and alienation, at
the other extreme. The idea that societies differed in their political culture was hardly novel; indeed it
had been the subject of philosophical speculation for centuries, in classic works from Montesquieu to de
Tocqueville. But one of the more radical aspects of the civic culture study was the way that support for
the theory was derived from a path‐breaking cross‐national opinion survey, demonstrating that citizen’s
orientations could be examined empirically. The study analyzed the mass publics in Mexico, the United
States, Italy, Britain, and Germany during the late‐1950s.
Almond and Verba concluded that the United States (and to a lesser extent, Britain) exemplified
their notion of a civic culture: “Respondents in the United States, compared with those in the other four
nations, are very frequently exposed to politics. They report political discussion and involvement in
political affairs, a sense of obligation to take an active part in the community, and a sense of
competence to influence the government. They are frequently active members of voluntary
associations. Furthermore, they tend to be affectively involved in the political system: they report
emotional involvement during election campaigns, and they have a high degree of pride in the political
system. And their attachment to the political system includes both generalized system affect as well as
satisfaction with specific government performance.” 6 By contrast, Italy (and to a lesser extent, Mexico)
exemplified an alienated political culture: “The picture of Italian political culture that has emerged from
our data is one of relatively unrelieved political alienation and distrust. The Italians are particularly low
in national pride, in moderate and open partisanship, in the acknowledgment of the obligation to take
DEMOCRATIC DEFICITS: CHAPTER 4 2/16/2010 7:35 PM
4
an active part in local community affairs, in the sense of competence to join with others in situations of
political stress, in their choice of social forms of leisure activity, and in their confidence in the social
environment.”7 The Civic Culture therefore emphasized the cross‐national variations, even among
relatively similar post‐industrial societies, such as Italy and Germany. This influential study did much to
establish the conventional view that during the Eisenhower era, a period of economic abundance and
cold war politics, Americans held positive views about their political system.
The mid‐1960s and early‐1970s, however, saw mounting concern about the capacity of
democratic institutions to serve as an outlet to contain public dissent in the United States and in
Western Europe. The era experienced the outbreak of tumultuous protest politics, with urban riots in
Philadelphia, Watts, Newark, and Detroit symbolizing a radicalization of race relations and a breakdown
of social control in the United States,. Mass demonstrations on the streets of London, Paris and Bonn
catalyzed similar concerns in Western Europe. These events triggered new cross‐national survey
research seeking to understand the causes of protest activism.8 The gloomier prognostications which
became common during these decades received their strongest endorsement from Crosier, Huntington
and Watakuki, who published a major influential report written during the mid‐1970s for the Trilateral
Commission, which diagnosed a ‘crisis’ of democratic legitimacy afflicting not just America but also many
similar post‐industrial societies.9
This wave of concern ebbed somewhat during the early‐1980s, reflecting some subsidence of
radical social movements and the more quiescent mass politics characteristic of the Thatcher‐Reagan
era. During these years, Lipset and Schneider compared a wide range of American public opinion polls
towards government, business, and labor. 10 The research concluded that mass support for many types
of political institutions in the United States had indeed eroded over time, but Lipset and Schneider
argued that most criticisms were leveled at the behavior and performance of specific power‐holders,
rather than expressing doubts about the underlying structure and function of American institutions. The
more positive interpretation was reinforced by the Beliefs in Government project, a multivolume
comparison examining broader trends in Western Europe from the early‐1970s until the mid or late‐
1990s. A thorough and detailed collaborative study, the Beliefs in Government project dismissed talk of a
‘crisis of democracy’ as exaggerated. In particular, chapters in these volumes which examining
institutional confidence and trust in politicians concluded that little evidence pointed to a steady secular
erosion of systems support in Europe during these three decades. Instead the authors arrived at
relatively sanguine conclusions which emphasized the existence of persistent cross‐national differences

DEMOCRATIC DEFICITS: CHAPTER 4 2/16/2010 7:35 PM
5
in systems support across different European member states, and a pattern of trendless fluctuations
over the years.11
The debate over the depth of any problem was far from settled, however, and during the early
to mid‐1990s, as already noted, a host of American scholars continued to express worries about
‘disenchanted democrats’, ‘critical citizens’, and growing civic disengagement. Similar concern about
political mistrust, voter apathy, and democratic disaffection echo among commentators in many other
post‐industrial societies, as well.12 Russell Dalton provided the most comprehensive recent summary of
the cross‐national survey evidence from the 1960s until the late‐1990s across a range of established
democracies and post‐industrial societies. Dalton concluded that during these years citizens became
increasingly detached from political parties, more skeptical towards governing elites and institutions,
and less confident about parliaments, although public support for democratic ideals has not flagged.13
Scholarly research mirrors popular commentary focused on contemporary phenomenon in Western
societies which appear to underline citizen anger, exemplified during 2009 by the public reaction to the
Westminster expenses scandal in Britain, and in the United States by the simmering rage and
breakdown of civility towards elected representatives expressed by ‘tea party’ activists at town hall
meetings debating health care reform, the federal deficit, and the stimulus package.14
II: The interpretative framework: What has declined, when and where?
Before plunging into analyzing the causes of any democratic deficits, as a preliminary step it is
important to establish a clear picture of trends in the descriptive evidence. Analysts need to pay
attention to the depth, breadth, and timing of any changes in citizens’ orientations towards democratic
politics and government in the United States and Western Europe. What has declined, where and when?
In terms of what, bearing in mind the Eastonian framework already discussed, it needs to be
established whether any erosion of support has occurred only at the most specific level of trust in
politicians, party leaders, elected officials and public sector workers, or whether any rot has spread
upwards to damage confidence in many core political institutions and state agencies, and even, at the
most diffuse level, to fragment common identities within multinational communities.
In terms of where, we need to demonstrate whether general patterns of declining trust and
confidence are evident across many comparable established democracies ‐‐suggesting general causes‐‐
or whether any serious problem of eroding system support is confined to just a few nations. The largest
research literature on this topic concerns the United States, but the American constitution was founded

DEMOCRATIC DEFICITS: CHAPTER 4 2/16/2010 7:35 PM
6
upon classical liberal principles, emphasizing mistrust of government. Lipset notes that American culture
may prove exceptional in this regard, as in so much else.15
Lastly, in terms of when, close attention needs to be paid to the exact timing of any fluctuations
in systems support. It is insufficient to look at net changes in different societies, since countries may all
arrive at a similar end point through divergent pathways. Moreover the starting and ending date for
many series of observations is often arbitrary, yet this can clearly color interpretations of the trends, for
example if the series of survey measurements commences on a relatively high or low point. It is more
rigorous to examine whether any changes happen simultaneously across states, or whether trends vary
in their timing.
Prior attention to the ‘what, where and when’ helps to select the most plausible competing
theoretical hypotheses which can then be analyzed further in subsequent chapters. For example, any
evidence of a glacial erosion of political support for parties and parliaments which persists over
successive decades in many similar Western societies would suggest looking for evidence of long‐term
causes, such as processes of social psychological change in cultural value occurring among individual
citizens, or the impact of societal modernization, human development, the penetration of the mass
media, and globalization at macro‐level. On the other hand, if patterns of trendless fluctuations and
short‐term volatility can be observed, with dynamic peaks and troughs which vary across relatively
similar types of societies and among different branches of government, this points more clearly towards
investigating specific performance and event‐based explanations within each country, such as the
government’s success or failure in handling the economy, the outbreak of a major parliamentary
scandal, the end of an unpopular war, the rise of new parties, polarization of party politics, or an
election throwing the governing party out of office.
The longest continuous time‐series evidence is available from the ANES, allowing us to track half
a century of trends in the standard American indicators of trust in government officials. The U.S. General
Social Survey (GSS) has also regularly monitored institutional confidence in public and private‐sector
agencies from 1972‐2006. To see whether similar trends are apparent in other established democracies,
we can draw upon the series of bi‐annual Euro‐Barometer surveys conducted since the early‐1970s. The
Euro‐Barometer survey regularly monitors confidence in national institutions, satisfaction with the
performance of democracy, and feelings of national pride and identity.
Given the immense outpouring of scholarly research and popular commentary, what is there
new to say? Surprisingly, perhaps, a lot. Many studies of the empirical evidence provide a partial view by

DEMOCRATIC DEFICITS: CHAPTER 4 2/16/2010 7:35 PM
7
selecting only one aspect of the underlying multidimensional concept of systems support, or by focusing
upon only a few countries, or a single global region. Much of the literature lacks a clear and
comprehensive conceptual framework focused on support for the political system. In studies of the
empirical evidence, both attitudinal and behavioral indicators are commonly mixed together. Equally
importantly, even half a century after the original Civic Culture survey, items carried in the time‐series
survey evidence used for identifying trends is often of limited duration and cross‐national breadth,
making it impossible to determine with any accuracy whether general trends have indeed occurred. To
update the analysis, we can start by monitoring developments in the United States and Western Europe,
which possess the longest series of indicators and the largest body of previous research. This sets the
context for the broader comparison of contemporary societies worldwide presented in the next chapter.
III: Longitudinal trends in the United States and Western Europe
Trust in public officials in the U.S. federal government
As discussed earlier, the standard American National Election Study questions about political
trust ask whether the ‘government in Washington’, or ‘people running the government’ can be trusted
to ‘do what is right’, whether they ‘waste taxes’, whether government is run ‘for a few big interests’, or
whether public officials are ‘crooked’. These items seek to tap public orientations towards the national
government including perceptions about the ethical standards, probity, and integrity of elected officials.
The questions have also been carried in other American and cross‐national surveys.16 As Russell Hardin
points out, however, these items are often used in empirical studies without reflecting upon whether
they actually relate to the underlying notion of political trust.17 For Hardin, trustworthiness rests on both
motivations and competencies; do government officials seek to act in the public interest and, if so, do
they actually have the capacity to do so? For example, people may believe that elected officials are
trustworthy in their motivations for public service (for example, that the local Congressional
representative from their local district is honest and hardworking, or that the president is well‐meaning
and likeable), and yet they may also feel that these individuals often prove generally incompetent or
ineffective, for example when managing a major economic or foreign policy crisis. Or conversely citizens
could logically believe that politicians are usually competent and effective but also venal, if thought to
line their own pockets or those of special interests. The standard ANES battery of items mostly concern
the trustworthiness of the motivations of public officials (to ‘do the right thing’), but not their
competencies.

DEMOCRATIC DEFICITS: CHAPTER 4 2/16/2010 7:35 PM
8
Reflecting a long‐standing debate, the meaning of these indicators is also open to alternative
interpretations. Hence for Jack Citrin, they provide signs of specific support for incumbent office holders,
with limited consequences. The erosion of American political trust which occurred during the 1960s can
be best understood in this view as an expression of public dissatisfaction with the performance of
particular incumbent political leaders and public policies, representing part of the regular cycle of
normal electoral politics and real world events.18 From this perspective, the public popularity of
members of congress and particular presidents can be expected to ebb and flow over time, without
indicating that Americans are willing to support constitutional reforms. For Arthur Miller, however, the
ANES indicators tap into diffuse support. Any erosion suggests that the roots of public dissatisfaction
extend more deeply to indicate a crisis of legitimacy in American democracy, representing a loss of faith
that U.S. political institutions are the most appropriate ones for American society. 19 Others suggest that
because government institutions are operated by incumbents, in practice it is difficult, if not impossible,
to disentangle support for agencies and actors.20 The ambiguity and potential measurement error when
operationalizing the complex concept of political trust means that relying solely upon these indicators is
unwise, and it would be prudent to see whether similar trends are evident in support for institutions
using alternative data.21 If the dynamics of public confidence in the executive, legislative and judicial
branches of American government reflects the peaks and troughs of confidence in the federal
government, this would lend greater confidence to time‐series trends, as well as indirectly supporting
the Miller interpretation. If, however, there are marked variations in citizen’s reactions towards among
different institutions, then this suggests the need to search for more performance and event‐driven
explanations.
The first item in the ANES battery comes closest to the notion of general trust in public sector
officials working within the federal government, relating to Easton’s notion of specific rather than
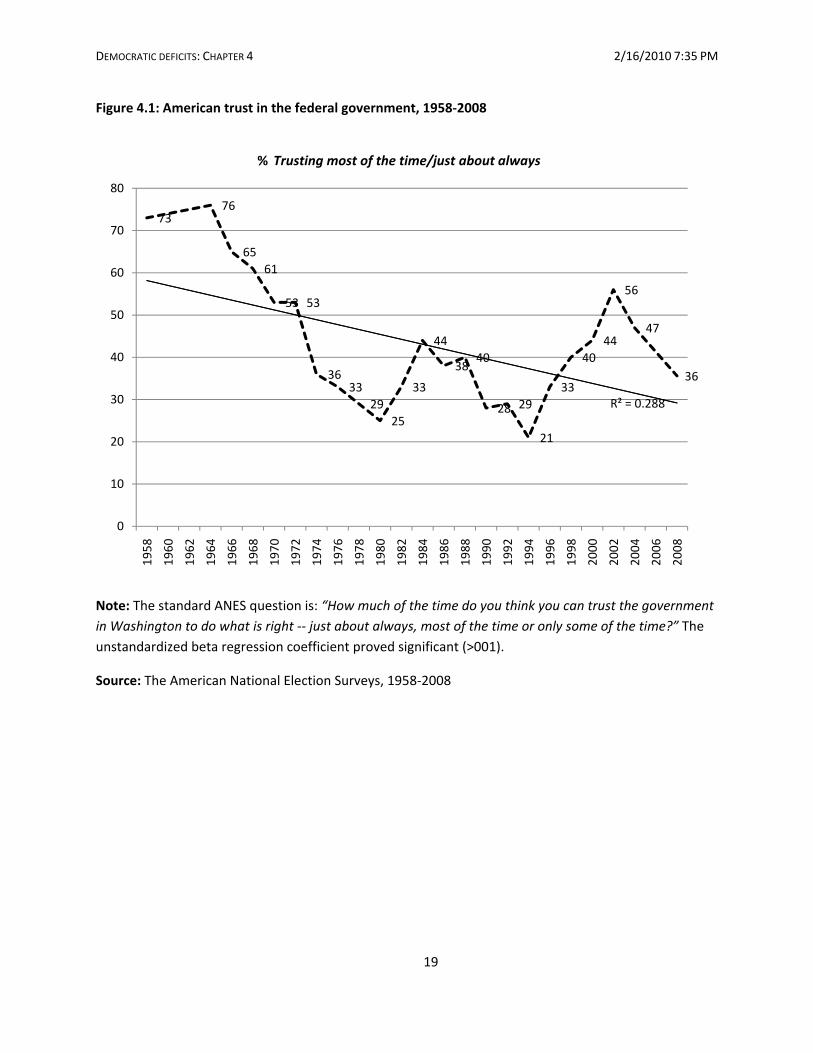
diffuse support. This item also provides the longest time‐series. If we compare trends over time in the
proportion of the American public reporting that they trusted the federal government to do what is right
‘most of the time’ or ‘just about always’, as shown in Figure 4.1, the evidence suggests that American
trust in government leaders plummeted steadily every election year from the mid‐1960s to the late‐
1970s, during the period of hot button politics and dissent over race relations, Vietnam, the war on
poverty, and Watergate.22 Yet the subsequent trend line displays considerable volatility, with dynamic
peaks and troughs, rather than a simple linear or continuous fall. According to this series of
observations, a sharp revival of American trust in the federal government occurred during the first

DEMOCRATIC DEFICITS: CHAPTER 4 2/16/2010 7:35 PM
9
Reagan administration from 1980‐1984, despite the anti‐government rhetoric of this administration, the
deep recession in the U.S. economy during the early‐1980s, and the growing polarization of party
politics as the GOP moved sharply towards the right on certain moral and economic issues. Citrin and
Green suggest that this happened because economic indicators for employment and inflation improved
markedly after 1982, and President Reagan’s leadership style exuded confidence and sunny optimism. 23
Trust in the federal government revived again from 1994 to 2002, a period of sustained economic
growth which started under President Clinton and continued under President George W. Bush. Support
peaked again after the dramatic events of 9/11, which Hetherington attributed to a ‘rally around the
flag’ effect associated with any foreign policy crisis and the priority given to security issues.24 Support
then fell back again during the next three national elections. Nor is this simply a product of the ANES
survey measurement as similar volatility among the American public is evident when the same question
was asked in a series of Gallup polls and New York Times/CBS News polls conducted since the early‐
1970s.25 The overall volatility indicates that there are clearly periods where American trust in the
federal government has revitalized, as well as periods when it has plummeted, and comprehensive
explanations need to account for dynamic fluctuations over time.
[Figure 4.1 about here]
Are similar trends evident elsewhere? Some of the ANES items on trust in politicians have been
asked in national election surveys conducted in some other established democracies, but as a previous
review by Listhaug emphasized, comparisons of trends are limited because of considerable variations in
the item wording and the lack of continuity of items over successive national surveys. 26 The most
thorough and comprehensive recent review of trends in sixteen established democracies using these
types of items, by Dalton, concluded that these indicate a net decline in confidence in politicians in
recent decades: “Regardless of recent trends in the economy, in large and small nations, in presidential
and parliamentary systems, in countries with few parties and many, in federal and unitary states, the
direction of change is the same.”27 The evidence that the public has become more skeptical about
elected officials presented by Dalton is certainly suggestive and important but nevertheless some
caution is needed when interpreting the results of the regression analysis used in his study, since out of
43 separate items, only seventeen items saw a statistically significant fall in trust over time. Moreover
any erosion of support which has occurred at the most specific level of elected officials may have few
important consequences; in democracies with regular multiparty elections allowing the removal of

DEMOCRATIC DEFICITS: CHAPTER 4 2/16/2010 7:35 PM
10
incumbents, less public trust in politicians may generate higher turnover of elected representatives,
without necessarily affecting more diffuse levels of public confidence in government institutions.
Institutional confidence in the U.S.
The U.S. General Social Survey monitors trends in confidence in public sector agencies, including
the three branches of the American federal government. Any sustained erosion of faith in these
institutions has potentially far more serious consequences than loss of trust in particular presidents,
congressional leaders, or elected representatives. In democratic states, the popularity of elected leaders
and governing parties is expected to rise and fall according to citizens’ evaluation of their performance.
Where opinions are overwhelmingly negative, multiparty democracies with alternating parties in
government provide a safety value for dissatisfaction through periodic opportunities to ‘throw the
rascals out’ via the ballot box. But institutional confidence reflects more enduring and diffuse
orientations than the popularity of specific leaders; any severe and persistent loss of legitimacy for the
U.S. Congress, the Supreme Court, or the executive branch is not easily remedied, and it has broader
ramifications. The GSS also examines attitudes towards the private sector as well, including confidence
in major companies, as well as in banks and financial institutions. This helps to establish whether the
American public has increasingly lost faith in many established pillars of authority, or whether this
particular problem is confined mainly to the image or performance of government agencies and
bureaucrats working in the public sector.
[Figures 4.2‐4 about here]
The U.S General Social Survey, conducted by NORC, has monitored confidence in institutional
leaders since the early‐1970s by asking: “I am going to name some institutions in this country. As far as
the people running these institutions are concerned, would you say you have a great deal of confidence,
only some confidence, or hardly any confidence at all in them?” Figure 4.2 shows the trends in American
confidence in the executive branch and the Supreme Court. The dotted trend line, and the R2 coefficient,
summarize the overall strength and direction of any linear trends. The trend in public confidence in both
the executive branch and the Supreme Court clearly demonstrate patterns of trendless fluctuation
around the mean; in particular, most strikingly, no significant overall fall in institutional confidence
occurred for either of these institutions from 1972 to 2006. The executive branch, in particular, displays
considerable volatility over time, for example with the sharp peaks registered temporarily in 1977
(temporarily restoring levels of confidence under the Carter administration to the pre‐Watergate era), in
1988‐92 (under the presidency of George H.W. Bush), and again in 2001, under George W. Bush,

DEMOCRATIC DEFICITS: CHAPTER 4 2/16/2010 7:35 PM
11
following the events of 9/11. The highs and lows are rarely sustained, however, although the White
House saw lower than average confidence during Clinton’s first term, before public revelations
surrounding the Lewinsky affair. The trend lines for the Supreme Court and the Executive branch roughly
mirror each other, although the Supreme Court retains higher public confidence and more stable
evaluations.
Confidence in the US Congress, illustrated in Figure 4.3, displays parallel periods of rising and
falling public confidence, provide a fainter mirror of trends in the executive. Similar fluctuations can be
observed in other surveys, for example in June 2008, the Gallup poll found that just 12% of Americans
expressed confidence in Congress, the worst rating the organization had measured for any institutions in
the 35‐year history of the question. Following the election of President Obama and the return of a
Democratic‐led Congress, the March 2009 Gallup poll saw Congressional approval jump to 39%. After an
initial honeymoon period, approval fell back again to 25% by the end of 2009.28 Overall, however,
compared with presidential approval, there is a flatter line for Congressional approval in the GSS series,
suggesting less pronounced volatility for the legislature than the executive branch. Moreover, and most
importantly, the overall trend line since the early‐1970s to 2006 shows falling net support for Congress
during these decades, as many commentators have noted.29 It appears that in evaluations about the
leadership among the core institutions of the U.S. federal government, the public has expressed the
most consistent growing doubts about the legislative branch.
But does this long‐term fall in Congressional approval mean a crisis of legitimacy for American
government – suggesting that the need to search for potential political explanations ‐ or are similar
trends apparent for other established institutions in the private sector as well? If a more generic trend
affecting attitudes towards those in authority, then cultural or social reasons might provide more
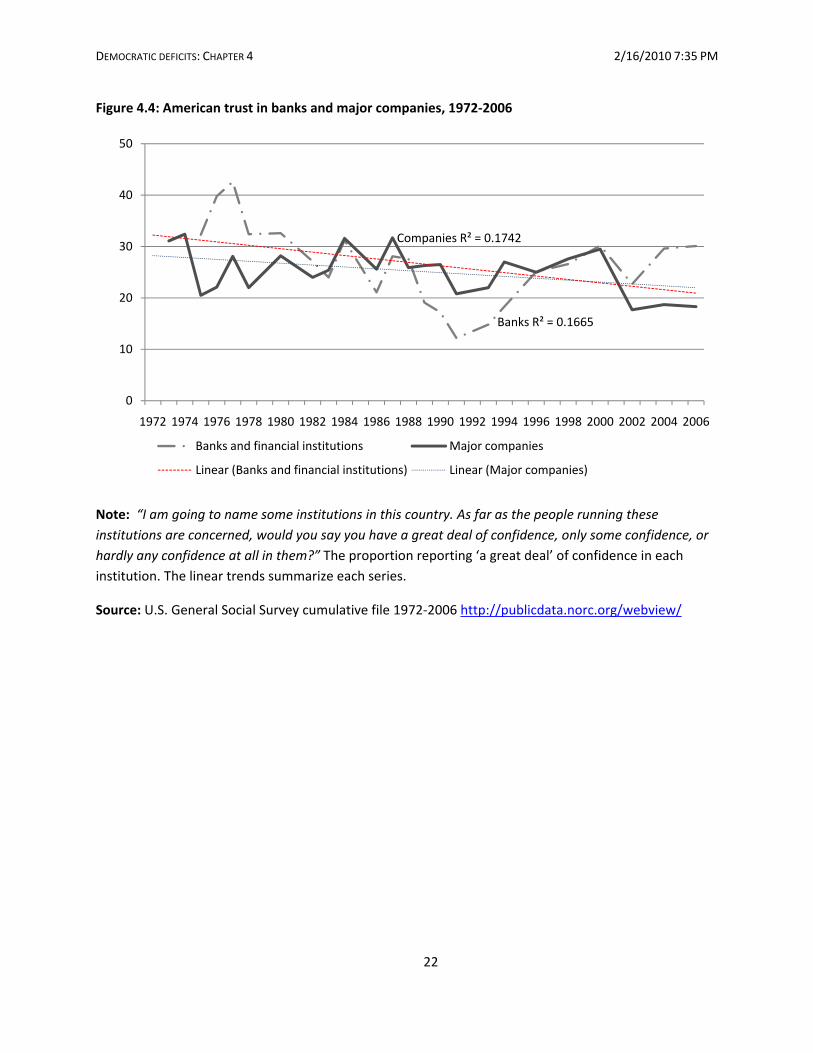
plausible explanations. For comparison, the bottom graph in Figure 4.4 shows parallel trends in
confidence in the private sector for banks and financial institutions as well as for major companies. Most
strikingly both these private sector institutions show overall trends of falling confidence from the start
to the end of this era, with declines which are similar in strength to that experienced during the same
era by Congress. It is also notable that banks and financial institutions show sharper peaks and troughs
than confidence in major companies.
The GSS evidence concerning institutional trust in the United States therefore suggests several
important points, which challenge the conventional wisdom. Firstly, the time‐series evidence suggests
that any trends in American public opinion are not simply directed towards loss of faith in all three

DEMOCRATIC DEFICITS: CHAPTER 4 2/16/2010 7:35 PM
12
branches of the U.S. federal government; instead the most consistent net loss of confidence during
more than three decades focuses upon Congress. Secondly, the legislature is not alone in this regard,
and the issue is broader than simply a crisis of faith in government; other major private sector
institutions like American banks and companies have experienced an equivalent net loss of public
confidence as well. Lastly, this data reinforces the point that any persuasive explanations need to
account for the dynamics of public support in attitudes towards government institutions, with attention
to the precise timing of particular short‐term fluctuations, rather than assuming a net erosion of political
trust and confidence. Often studies have simply focused upon net percentage point change derived from
the starting and end points for any time‐series data, but inevitably this approach assumes certain
arbitrary benchmarks; it is unclear, for example, what confidence in these institutions was like prior to
the early‐1970s. It is equally important analytically to understand the dynamic variance in the trends
over time.
Institutional trust in Western Europe
For comparison with other long‐established democracies and affluent post‐industrial societies,
the EuroBarometer allows us to compare the U.S. with Western Europe. The survey monitors
longitudinal trends in trust and confidence in a wide range of public and private sector institutions,
including governments, parliaments and parties, as well as satisfaction with the general performance of
democracy, and the strength of national identities. The Eurobarometer now covers public opinion in all
current 25 member states. For a consistent time series, however, the longest trend analysis from these
surveys is limited to the countries which have been member states since 1973.
European trust in government
We can start by comparing the annual trends in institutional trust in the national government
across seventeen European societies where attitudes have been monitored during the last decade. The
data illustrated in Figure 4.4 and summarized in Table 4.1 shows the proportion of the public who
express trust in their national government every year (allowing comparisons of persistent contrasts
across countries, such as between Italy and Luxembourg)) and the overall net change which occurred
from the start to end of this decade (showing any overall net losses or gains). The final columns in Table
4.1 measure the strength and significance of the unstandardized OLS regression beta coefficients (which
summarizes the direction of linear trends).

DEMOCRATIC DEFICITS: CHAPTER 4 2/16/2010 7:35 PM
13
[Figure 4.5 and Table 4.1]
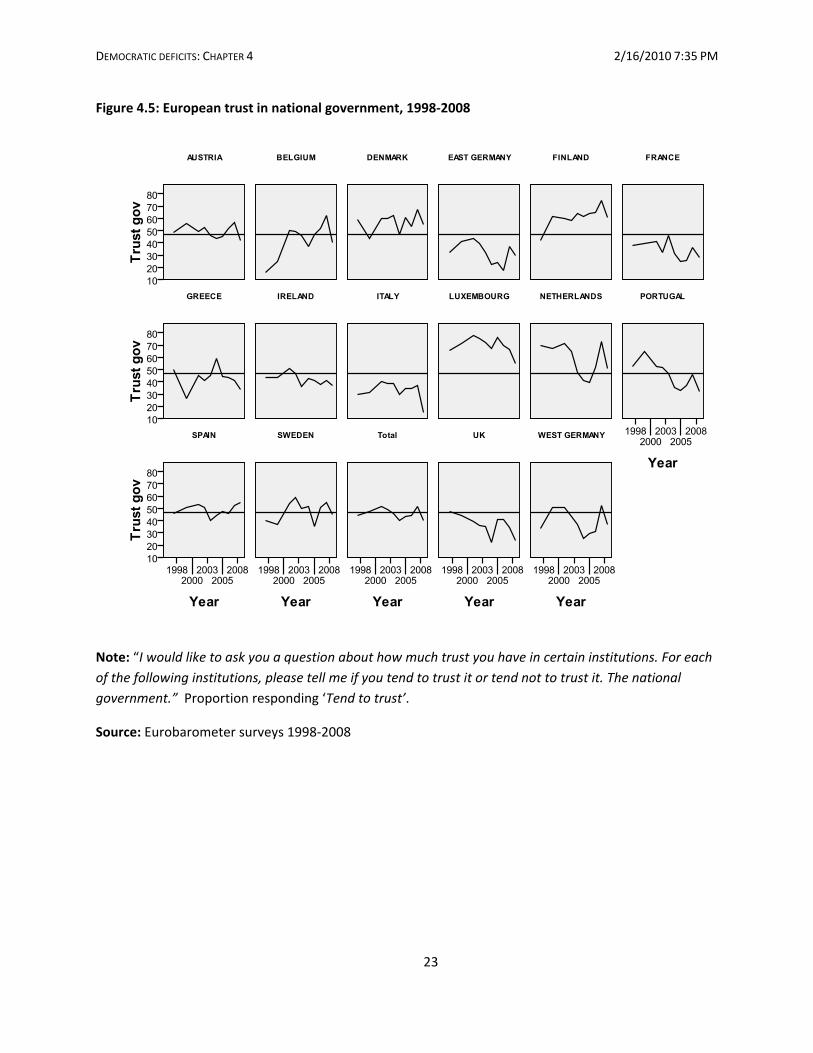
Trends in European trust in their national government indicate several important points. Firstly,
(i) during the last decade the net change in European confidence in government varied in direction and
size by country. For example, the UK and Portugal experienced the sharpest significant net drop in the
proportion trusting government during the last decade (down by 20 percentage points or more).30 This
finding would give support to the conventional assumption of steadily eroding trust but for the fact that
other European societies experienced trendless fluctuations and no significant linear change over time,
or even, in a few cases (Finland and Belgium), a significant 19‐24 point rise in political trust during the
same period. The assumption that trust in government has eroded consistently across established
European democracies receives no support from this cross‐national survey evidence. Now of course the
time series is relatively short, and it may be that trust in government eroded during earlier eras; we
simply cannot determine this with the available EuroBarometer evidence, but nor can others. It is also
important to emphasize that there are substantial persistent contrasts among EU member states which
need to be explained; for example just as Almond and Verba observed half a century ago, the Italian
public remains deeply skeptical in their orientation towards their government.31 By comparison, citizens
in Luxembourg and Finland are generally more trusting than average. The precise reasons for the
restoration of political trust in Finland and Belgium, and the simultaneous fall in Britain and Portugal,
also deserve further scrutiny when we consider alternative explanations later in this volume. But the
overall comparison suggests that performance‐based explanations which affect specific governments
appear more plausible candidates than any account proposing systematic shifts in cultural values
towards politics and public affairs.
As Figure 4.5 illustrates, however, this does not mean that European trust in government was
steady; instead (ii) sharp fluctuations in trust in government can be observed in many countries, such as
the peaks and troughs occurring in Denmark, Sweden and France. Lastly, and equally importantly, (iii)
two period effects register a short‐term peak in trust in government occurring simultaneously across
many European countries, notably in the survey taken in October‐November 2001, shortly after the
events of 9/11, when average trust jumped by 9 percentage points from the spring to fall, and another
clear but smaller average peak in April‐May 2007, which cannot be so easily attributed to any particular
event or terrorist incident.
European trust in parliaments
DEMOCRATIC DEFICITS: CHAPTER 4 2/16/2010 7:35 PM
14
As with the U.S. data, however, we also need to establish whether there are general trends in
Europe across all major branches of government. As in the United States, it may be that European
publics continue to support the executive branch in their national government, but that any erosion of
confidence has occurred in the legislature and in political parties. Dalton suggests that public support for
both institutions has fallen in a wide range of advanced industrialized democracies.32 Evidence of
eroding confidence in parliament in his study is based on regression analysis derived from four waves of
the World Values Survey, as well as trends in Gallup, Harris and related commercial polls, but in fact only
six of the 21 coefficients in the Dalton study prove statistically significant and negative. Table 4.2 and
Figure 4.6 show the Euro‐barometer evidence when citizens were asked directly about their trust in
parliament during the last decade.
[Table 4.2 and Figure 4.6 about here]
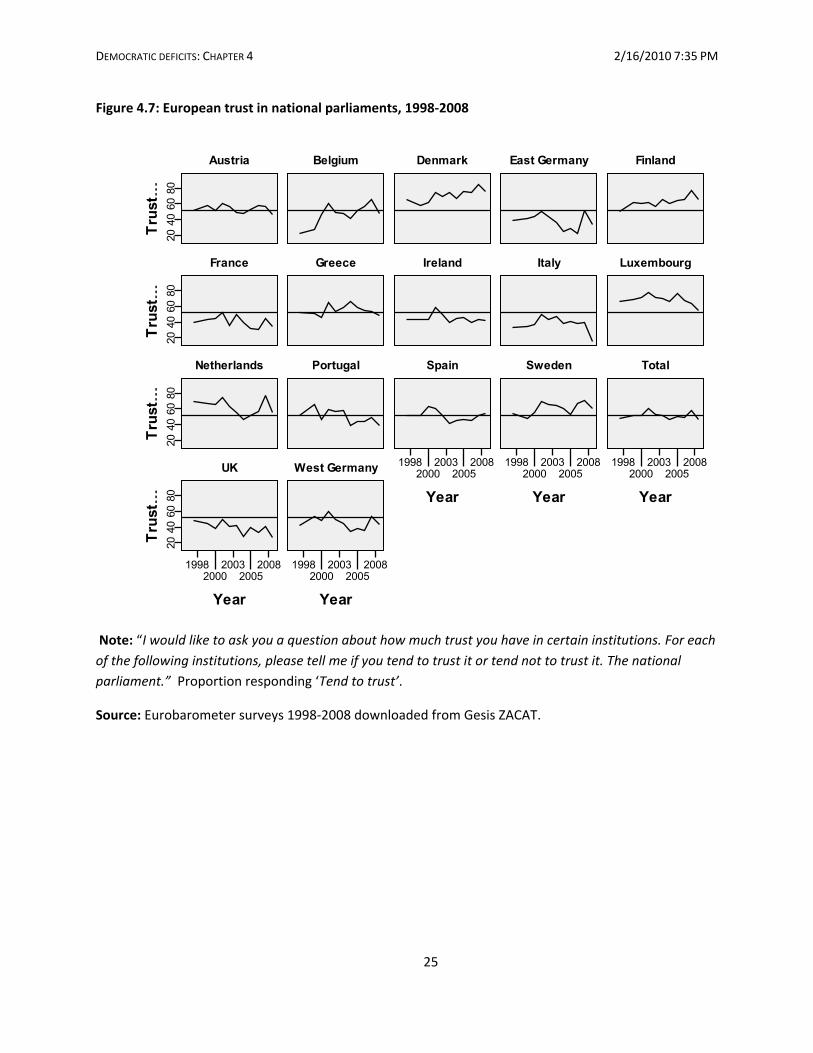
The results largely confirm the observations already made concerning government. Again the
data shows that most countries have experienced trendless fluctuations in trust of parliaments, with the
UK and Portugal again showing a significant growth of cynicism towards these institutions since the late‐
1990s (reflecting the pattern already observed for trust in government), while Denmark, Finland and
Belgium experienced a significant restoration of public trust towards their national legislature. The
overall mean trust in parties across the EU shows no significant change. Overall there are also marked
and persistent contrasts between European societies, with only 16% of Italians expressing trust in their
parliament in 2008, compared with three‐quarters of Danes (76%). This strengthens the conclusion that
specific cultural or institutional factors need to be explored in subsequent chapters to account for long‐
term contrasts among countries, while the dynamics of short‐term fluctuations in trust over time may
plausibly relate to variations in the perceived performance of governments, parliaments and elected
representatives.
European trust in political parties
What about political parties? There is a wealth of literature showing important changes in
citizen’s social psychological orientations towards political parties, as well as behavioral measures such
as falling party membership rolls, but the implications of these trends for systems support is not
straightforward. There is indeed good evidence that party membership has declined in many
established democracies.33 But this may happen for multiple reasons, however, such as organizational
changes in how far parties seek to recruit grassroots voluntary supporters and local activists, if parties
rely increasingly upon public funding and paid professionals, as well as due to broader shifts in more

DEMOCRATIC DEFICITS: CHAPTER 4 2/16/2010 7:35 PM
15
general patterns of social and political activism. As argued earlier, interpreting motivational attitudes
directly from behavioral measures can be highly misleading. More directly, Dalton compares attitudes
towards political parties derived from trends in the strength of party identification in a range of
advanced industrialized democracies. Based on this evidence, Dalton concludes: “If party attachments
reflect citizen support for the system of party based representative government, then the simultaneous
decline in party attachments in nearly all advanced industrial democracies offers a strong sign of the
public’s affective disengagement from political authorities.” 34 Yet it is not clear whether party
identification is the most appropriate measure of trust and confidence in these institutions, since this
orientation could weaken for many reasons, including the growth of more educated and rational voters
choosing parties based upon policies and performance, rather than habitual loyalties towards specific
parties, without meaning that citizens have necessarily lost faith with the party system as a whole.
[Table 4.3 and Figure 4.6 about here]
To look more directly at the evidence, Table 4.3 and Figure 4.6 show the Eurobarometer
evidence when citizens were asked directly about their trust in political parties. Contrary to the declinist
thesis, party trust fell significantly during the last decade only in the UK. In most European nations there
were trendless fluctuations, while in four cases (Sweden, Denmark, Belgium and Spain) party trust
strengthened significantly by 10‐18 points during this era. The consistent erosion of institutional trust in
government, parliament and parties observed under the Labour government in the UK, and the
strengthening of institutional trust during the same decade in Belgium, are clearly cases requiring
further exploration later in the book. It may be that particular incidents of party polarization, policy
failure and corruption reduced faith in the government in Belgium.35 In Britain, as well, there has been
much concern about these developments, even prior to the 2009 parliamentary expenses scandal. 36
Many reasons have been offered to account for trends, generating public concern and parliamentary
debate about the role of declining standards in public life.37
European satisfaction with the performance of democracy
We can also compare trends in satisfaction with democracy, one of the standard indicators used
in the research literature in many global regions. 38 This item has been carried in many cross‐national
surveys, including in the Eurobarometer since the early 1970s. As discussed earlier in chapter 2,
however, there remain ongoing debates about the precise meaning of this measure.39 On the one hand,
the item can be seen to tap approval of 'democracy' as a value or ideal, analogous to support for the
principles of human rights or gender equality. In this study, however, we agree with Linde and Ekman

DEMOCRATIC DEFICITS: CHAPTER 4 2/16/2010 7:35 PM
16
that the phrasing of the question (by emphasizing how democracy is performing) makes it most suitable
to test public evaluations of the actual workings of democratic regimes and assessments of democratic
practices, rather than principles.40 Satisfaction with the performance of democracy can also be regarded
as a more diffuse level of support than trust in institutions or authorities, and therefore evidence of any
deepening dissatisfaction would be real cause for genuine concern.
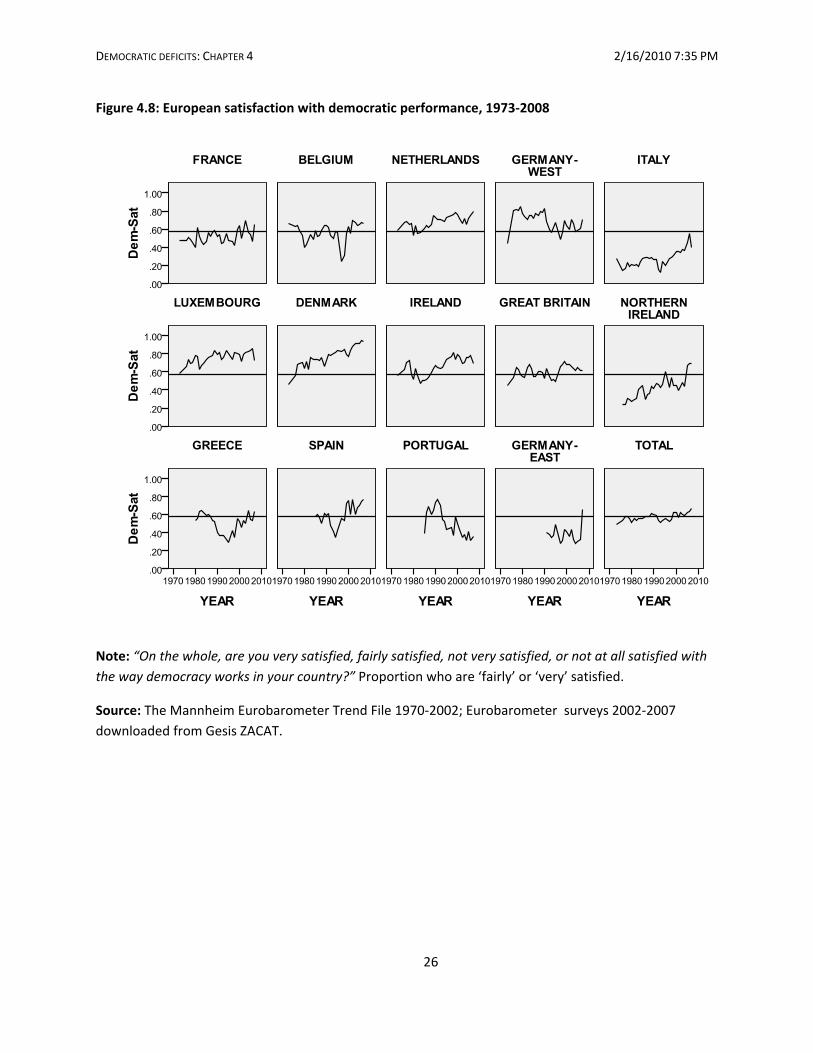
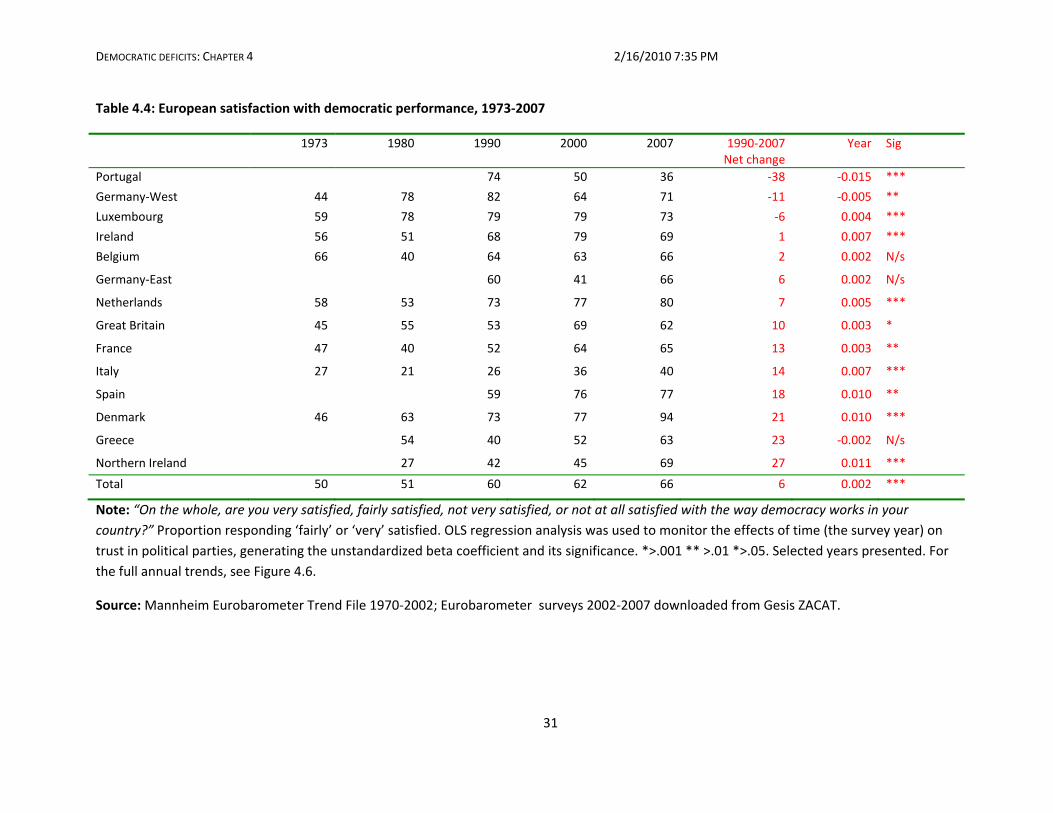
[Figure 4.8 and Table 4.4 about here]
The comparison of trends in satisfaction with democracy illustrated in Figure 4.8 and Table 4.4
share certain aspects of the findings already presented concerning trust in state institutions; there
remain diverse trends in democratic satisfaction in different European countries, annual volatility in
public evaluations, and some persistent contrasts among societies, notably the low satisfaction
registered in Italy.41 But the overall direction of satisfaction with the performance of democracy among
most European countries is usually positive over time. Across Western Europe, Table 4.4 demonstrates
that today on average two‐thirds of the European public expresses satisfaction with the workings of
democracy in their own country. In 11 of the 14 nations under comparison, from 1990‐2007 these
attitudes become more positive, not less. Satisfaction is exceptionally low in Italy – but persistently so ‐‐
and even here, satisfaction with democracy grew since the early 1990s. Regression analysis of the linear
trends, summarized in Table 4.4, summarizes the direction and significance of changes over time. Of the
eleven societies registering a significant change, nine become more positive in evaluations of the
performance of their democracy (with major improvements in Northern Ireland, Denmark, Spain and
Italy), two become progressively more negative (with less satisfaction over time in Portugal and West
Germany), while the remainder show insignificant linear trends. Far from any signs of a general crisis of
European states, or even spreading disaffection or disenchantment, the overall pattern shows that the
public’s satisfaction with the workings of democracy has progressively strengthened during recent
decades in many countries.
European national pride
Lastly, we can also compare trends in the strength of national pride, operating at the most
diffuse level of systems support. Lasting bonds to the nation‐state are exemplified by feelings of national
pride and identity, representing a sense of community within shared common territorial boundaries.
Such feelings are important for every nation‐state but they are thought to have particularly significant
consequences for social cohesion and state legitimacy in multicultural communities and plural societies.

DEMOCRATIC DEFICITS: CHAPTER 4 2/16/2010 7:35 PM
17
The European evidence is also important because the growing powers and functions of the European
Union, and the process of economic and social integration across the borders of member states, might
be expected to have eroded national pride and identities more strongly within this region than in other
parts of the world, although previous empirical studies provide little support for this claim.42
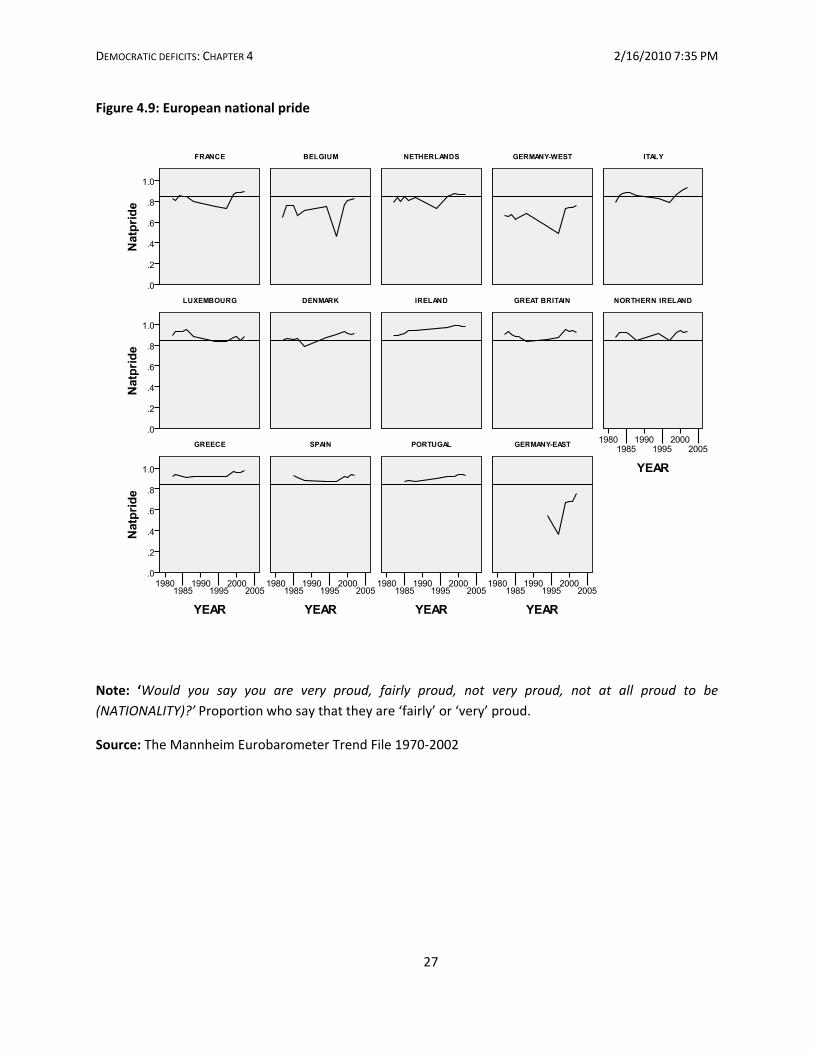
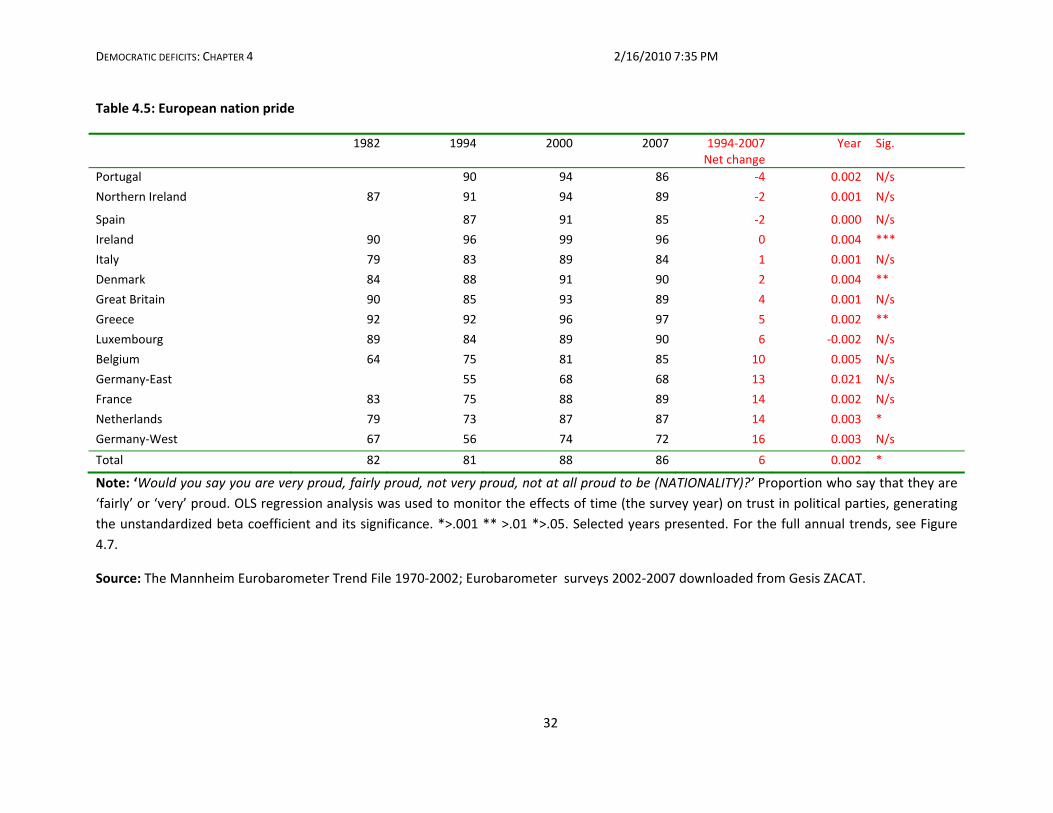
[Figure 4.9 and Table 4.5 about here]
Figure 4.9 and Table 4.5 show the proportion of the European public who express national pride
in their country, and the trends over time. It is striking that most European societies display consistently
high levels of national pride, with eight out of ten Europeans reporting that they are very or fairly proud
of their country. The most notable exception is East and West Germany, a pattern which can perhaps
best be accounted for by cultural awareness of the particular historical experience of Germany’s role in
World War II. Elsewhere national pride remains strong and stable even in societies such as Italy where
we have observed little public faith in political institutions or satisfaction with democracy. Unlike the
previous tables, no European societies saw a significant drop in national pride during these years.
Conclusions and discussion
Numerous commentators assume that support for the political system has gradually weakened
in many established democracies, generating widespread public and scholarly concern about the rise of
public disaffection (Torcal and Montero), mistrust of government (Dogan), or ‘dissatisfied democrats’
(Pharr and Putnam). 43 This chapter has sought to describe time‐series survey evidence about public
opinion within established democracies. Based on the analysis, this chapter arrives at an interpretation
which challenges the over‐simple views of an inevitable downward spiral of public disenchantment and
steadily‐growing hostility towards government actors, institutions, and feelings of attachment to the
nation‐state. The evidence reinforces the conclusion that it is essential to distinguish trends in public
attitudes which operate at different levels, rather than treating ‘political support’ as though it is all of
one piece. Careful attention to the precise timing and breadth of any trends is also critical for an
accurate diagnosis of developments.
The most diffuse level concerns the most fundamental orientations towards the nation state,
exemplified by deep‐rooted feelings of national pride and national identity. Membership of the
European Union might be expected to have eroded these attachments, generating more cosmopolitan
attitudes as Europeans are increasingly bound together through ties of trans‐border communication

DEMOCRATIC DEFICITS: CHAPTER 4 2/16/2010 7:35 PM
18
flows, labor force mobility, and trade. 44 Nevertheless the evidence confirms that nationalism remains
strong and relatively stable, even among West European societies which are long‐standing members of
the EU. 45 Trust in political institutions such as national governments, parliaments and parties show
systematic and persistent contrasts among established democracies in Western Europe and the U.S.
Overall fluctuations over time usually prove far more common than straightforward linear or uniform
downward trends. The conclusions lend further confirmation to Levi and Stoker’s observation: “despite
all the verbiage decrying the decline in trust, there is little actual evidence of a long‐term decline, either
in the United States or in Western Europe across the board.”46 Contrasts are also evident in public
attitudes towards different branches of government within each country; for example the U.S. has seen
a long‐term significant erosion of support for the legislature, but this has not affected public support for
the Supreme Court or the Executive. Persistent differences in institutional trust can also be observed
among relatively similar nations, such as between Italy and Spain, or Germany and France. A few
European countries have experienced growing trust in state institutions, while a few have seen the
reverse situation. Perhaps most importantly, in Europe diffuse support for the nation‐state remains
strong and stable, and satisfaction with the performance of democracy has usually strengthened over
time, not weakened.
The conventional wisdom assumes that public support for government has eroded significantly
and consistently over time in established democracies. If symptoms of trendless fluctuations are
evident in recent decades in Western countries, however, this suggests the need to revise the standard
interpretation. The complexity observed in this chapter calls for a diagnosis which can account for the
dynamic fluctuations and the persistent cross‐national variations in political support. Before examining
these explanations, however, it is important to cast the net wider by comparing many other countries.
Even though it often remains more difficult to explore time‐series trends elsewhere, contemporary
contrasts in systems support can be compared among rich and poor nations, as well as among many
democratic and autocratic regimes worldwide.
DEMOCRATIC DEFICITS: CHAPTER 4 2/16/2010 7:35 PM
19
Figure 4.1: American trust in the federal government, 1958‐2008
Note: The standard ANES question is: “How much of the time do you think you can trust the government
in Washington to do what is right ‐‐ just about always, most of the time or only some of the time?” The
unstandardized beta regression coefficient proved significant (>001).
Source: The American National Election Surveys, 1958‐2008
7376
65
61
53 53
3633
29
25
33
44
3840
28 29
21
33
40
44
56
47
36
R² = 0.288
0
10
20
30
40
50
60
70
80
1958
1960
1962
1964
1966
1968
1970
1972
1974
1976
1978
1980
1982
1984
1986
1988
1990
1992
1994
1996
1998
2000
2002
2004
2006
2008
% Trusting most of the time/just about always

DEMOCRATIC DEFICITS: CHAPTER 4 2/16/2010 7:35 PM
20
Figure 4.2: American trust in the U.S. Supreme Court and Executive, 1972‐2006
Note: “I am going to name some institutions in this country. As far as the people running these
institutions are concerned, would you say you have a great deal of confidence, only some confidence, or
hardly any confidence at all in them?” The proportion reporting ‘a great deal’ of confidence in each
institution. The linear trends summarize each series.
Source: U.S. General Social Survey cumulative file 1972‐2006 http://publicdata.norc.org/webview/
Executive Branch R² = 0.0004
Supreme Court R² = 0.0213
0
10
20
30
40
50
1972 1974 1976 1978 1980 1982 1984 1986 1988 1990 1992 1994 1996 1998 2000 2002 2004 2006
Executive Branch Supreme Court
Linear (Executive Branch) Linear (Executive Branch)

DEMOCRATIC DEFICITS: CHAPTER 4 2/16/2010 7:35 PM
21
Figure 4.3: American trust in the U.S. Congress, 1972‐2006
Note: “I am going to name some institutions in this country. As far as the people running these
institutions are concerned, would you say you have a great deal of confidence, only some confidence, or
hardly any confidence at all in them?” The proportion reporting ‘a great deal’ of confidence in each
institution. The linear trends summarize each series.
Source: U.S. General Social Survey cumulative file 1972‐2006 http://publicdata.norc.org/webview/
US Congress R² = 0.1414
0
10
20
30
40
50
1972 1974 1976 1978 1980 1982 1984 1986 1988 1990 1992 1994 1996 1998 2000 2002 2004 2006
US Congress Linear (US Congress)
DEMOCRATIC DEFICITS: CHAPTER 4 2/16/2010 7:35 PM
22
Figure 4.4: American trust in banks and major companies, 1972‐2006
Note: “I am going to name some institutions in this country. As far as the people running these
institutions are concerned, would you say you have a great deal of confidence, only some confidence, or
hardly any confidence at all in them?” The proportion reporting ‘a great deal’ of confidence in each
institution. The linear trends summarize each series.
Source: U.S. General Social Survey cumulative file 1972‐2006 http://publicdata.norc.org/webview/
Banks R² = 0.1665
Companies R² = 0.1742
0
10
20
30
40
50
1972 1974 1976 1978 1980 1982 1984 1986 1988 1990 1992 1994 1996 1998 2000 2002 2004 2006
Banks and financial institutions Major companies
Linear (Banks and financial institutions) Linear (Major companies)
DEMOCRATIC DEFICITS: CHAPTER 4 2/16/2010 7:35 PM
23
Figure 4.5: European trust in national government, 1998‐2008
Note: “I would like to ask you a question about how much trust you have in certain institutions. For each
of the following institutions, please tell me if you tend to trust it or tend not to trust it. The national
government.” Proportion responding ‘Tend to trust’.
Source: Eurobarometer surveys 1998‐2008

DEMOCRATIC DEFICITS: CHAPTER 4 2/16/2010 7:35 PM
24
Figure 4.6: European trust in political parties, 1998‐2008
Note: “I would like to ask you a question about how much trust you have in certain institutions. For each
of the following institutions, please tell me if you tend to trust it or tend not to trust it. Political parties.”
Proportion responding ‘Tend to trust’.
Source: Eurobarometer surveys 1998‐2008 downloaded from Gesis ZACAT.
DEMOCRATIC DEFICITS: CHAPTER 4 2/16/2010 7:35 PM
25
Figure 4.7: European trust in national parliaments, 1998‐2008
Note: “I would like to ask you a question about how much trust you have in certain institutions. For each
of the following institutions, please tell me if you tend to trust it or tend not to trust it. The national
parliament.” Proportion responding ‘Tend to trust’.
Source: Eurobarometer surveys 1998‐2008 downloaded from Gesis ZACAT.
DEMOCRATIC DEFICITS: CHAPTER 4 2/16/2010 7:35 PM
26
Figure 4.8: European satisfaction with democratic performance, 1973‐2008
Note: “On the whole, are you very satisfied, fairly satisfied, not very satisfied, or not at all satisfied with
the way democracy works in your country?” Proportion who are ‘fairly’ or ‘very’ satisfied.
Source: The Mannheim Eurobarometer Trend File 1970‐2002; Eurobarometer surveys 2002‐2007
downloaded from Gesis ZACAT.
DEMOCRATIC DEFICITS: CHAPTER 4 2/16/2010 7:35 PM
27
Figure 4.9: European national pride
Note: ‘Would you say you are very proud, fairly proud, not very proud, not at all proud to be
(NATIONALITY)?’ Proportion who say that they are ‘fairly’ or ‘very’ proud.
Source: The Mannheim Eurobarometer Trend File 1970‐2002

DEMOCRATIC DEFICITS: CHAPTER 4 2/16/2010 7:35 PM
28
Table 4.1: European trust in national government, 1997‐2008
1997 1999 2001 Spr
2001 Fall
2002 2003 2004 2005 2006 2007 2008 1997‐2008Net Change
Year Sig
UK 48 44 35 44 36 36 22 41 41 34 24 ‐24 ‐1.51 *
Portugal 52 65 50 55 52 47 36 33 37 46 32 ‐20 ‐2.42 **
Netherlands 69 67 66 76 65 47 41 40 51 73 51 ‐18 ‐1.82 N/s
Greece 50 27 39 52 41 45 59 44 43 41 34 ‐16 ‐.127 N/s
Italy 29 32 33 47 39 38 29 35 35 37 15 ‐14 ‐.641 N/s
Luxembourg 65 71 77 78 76 72 68 76 70 66 55 ‐10 ‐.817 N/s
France 38 40 37 46 32 46 31 25 26 36 28 ‐10 ‐1.20 N/s
Ireland 44 44 48 55 47 37 43 41 38 41 37 ‐7 ‐.874 N/s
Austria 48 56 47 52 53 46 44 46 51 57 42 ‐6 ‐.309 N/s
Denmark 59 44 54 66 60 62 47 61 54 67 55 ‐4 .409 N/s
East Germany 32 41 40 47 40 32 22 24 18 37 30 ‐2 ‐1.31 N/s
West Germany 34 51 47 54 43 37 25 30 31 52 37 4 .467 N/s
Sweden 41 37 49 59 59 50 51 35 51 55 45 5 ‐.679 N/s
Spain 46 50 48 58 51 40 44 47 46 52 55 9 .162 N/s
Finland 42 61 56 64 59 64 61 64 65 75 61 19 1.66 **
Belgium 16 25 45 55 49 46 37 47 52 62 40 24 2.50 *
Total 44 47 47 56 49 46 40 43 44 52 40 ‐4 ‐.404 N/s
Note: “I would like to ask you a question about how much trust you have in certain institutions. For each of the following institutions, please tell
me if you tend to trust it or tend not to trust it. The national government.” Proportion responding ‘Tend to trust’. OLS regression analysis was
used to monitor the effects of time (the survey year) on trust in the national government, generating the unstandardized beta coefficient and its
significance. *>.001 ** >.01 *>.05.
Source: Eurobarometer surveys 1997‐2008 downloaded from Gesis ZACAT.

DEMOCRATIC DEFICITS: CHAPTER 4 2/16/2010 7:35 PM
29
Table 4.2: European trust in parliament, 1997‐2008
1997 1999 2000 2001 Spr 2001 Fall 2002 2003 2004 2005 2006 2007 2008 1997‐2008Net Change
Year Sig
UK 49 44 38 36 50 41 42 28 39 33 41 27 ‐22 ‐1.503 **
Italy 33 34 37 38 50 43 47 38 41 38 39 16 ‐17 ‐.663 N/s
Portugal 52 66 46 58 59 57 58 39 44 44 49 39 ‐13 ‐1.561 *
Netherlands 69 67 65 68 74 63 56 47 51 57 77 56 ‐13 ‐.976 N/s
Luxembourg 66 69 71 75 78 71 70 66 76 67 64 55 ‐11 ‐.774 N/s
Austria 52 58 52 53 61 57 49 48 53 58 57 46 ‐6 ‐.325 N/s
East Germany 39 42 44 39 50 43 36 25 29 23 51 34 ‐5 ‐.936 N/s
France 40 43 45 41 52 36 50 39 32 31 44 35 ‐5 ‐.822 N/s
Greece 52 51 46 50 65 53 59 66 58 55 53 49 ‐3 .183 N/s
Ireland 43 43 43 49 58 50 40 45 46 40 43 42 ‐1 ‐.341 N/s
West Germany 42 53 48 52 60 50 44 34 38 36 54 43 1 ‐.689 N/s
Spain 51 51 63 52 60 51 41 45 47 45 52 54 3 ‐.555 N/s
Sweden 54 48 55 57 69 65 64 61 53 67 70 60 7 1.030 N/s
Denmark 66 58 62 60 75 70 74 67 76 74 85 76 10 1.639 **
Finland 50 62 61 57 62 57 66 61 64 65 77 66 16 1.429 **
Belgium 22 28 46 48 61 49 48 42 52 57 66 48 26 2.607 **
Total 48 51 51 51 61 53 52 46 50 49 58 47 ‐2 ‐.071 N/s
Note: “I would like to ask you a question about how much trust you have in certain institutions. For each of the following institutions, please tell
me if you tend to trust it or tend not to trust it. The national parliament.” Proportion responding ‘Tend to trust’. OLS regression analysis was used
to monitor the effects of time (the survey year) on trust in the national parliament, generating the unstandardized beta coefficient and its
significance. *>.001 ** >.01 *>.05.
Source: Eurobarometer surveys 1997‐2008 downloaded from Gesis ZACAT.

DEMOCRATIC DEFICITS: CHAPTER 4 2/16/2010 7:35 PM
30
Table 4.3: European trust in political parties, 1997‐2008
1997 1999 2000 2001 Spr 2001 Fall 2002 2003 2004 2005 2006 2007 2008 1997‐2008Net Change
Year Sig
Luxembourg 39 32 41 42 35 34 33 36 41 41 29 29 ‐10 ‐.426 N/s
UK 20 19 15 18 18 17 15 12 15 14 13 13 ‐7 ‐.641 ***
Greece 21 19 19 19 26 17 18 30 16 18 17 17 ‐4 ‐.324 N/s
Netherlands 43 45 44 36 40 38 37 29 35 41 40 40 ‐3 ‐.552 N/s
France 12 12 15 12 16 13 16 14 10 12 10 10 ‐2 ‐.308 N/s
Italy 14 17 14 12 14 16 16 14 21 21 13 13 ‐1 .114 N/s
Austria 28 25 22 26 27 27 22 21 21 29 30 30 2 .253 N/s
Portugal 16 23 19 20 23 23 22 17 31 27 19 19 3 .320 N/s
West Germany 15 21 19 21 18 20 13 13 20 16 19 19 4 .021 N/s
East Germany 14 16 19 15 18 16 10 9 18 20 18 18 4 .215 N/s
Ireland 22 23 24 28 32 26 22 27 25 25 27 27 6 .285 N/s
Sweden 18 20 17 20 24 26 21 22 28 29 28 28 10 1.056 ***
Denmark 34 30 34 36 38 38 42 36 38 44 50 50 16 1.600 ***
Finland 15 24 23 25 25 23 28 22 12 9 31 31 16 .381 N/s
Belgium 11 18 22 19 21 24 23 22 24 30 28 28 18 1.363 ***
Spain 22 21 30 25 25 26 24 29 23 23 40 40 18 1.237 *
Total 21 22 23 23 25 24 22 21 24 25 26 26 4 .368 **
Note: “I would like to ask you a question about how much trust you have in certain institutions. For each of the following institutions, please tell
me if you tend to trust it or tend not to trust it. Political parties.” Proportion responding ‘Tend to trust’. OLS regression analysis was used to
monitor the effects of time (the survey year) on trust in political parties, generating the unstandardized beta coefficient and its significance.
*>.001 ** >.01 *>.05.
Source: Eurobarometer surveys 1997‐2008 downloaded from Gesis ZACAT.
DEMOCRATIC DEFICITS: CHAPTER 4 2/16/2010 7:35 PM
31
Table 4.4: European satisfaction with democratic performance, 1973‐2007
1973 1980 1990 2000 2007 1990‐2007Net change
Year Sig
Portugal 74 50 36 ‐38 ‐0.015 ***
Germany‐West 44 78 82 64 71 ‐11 ‐0.005 **
Luxembourg 59 78 79 79 73 ‐6 0.004 ***
Ireland 56 51 68 79 69 1 0.007 ***
Belgium 66 40 64 63 66 2 0.002 N/s
Germany‐East 60 41 66 6 0.002 N/s
Netherlands 58 53 73 77 80 7 0.005 ***
Great Britain 45 55 53 69 62 10 0.003 *
France 47 40 52 64 65 13 0.003 **
Italy 27 21 26 36 40 14 0.007 ***
Spain 59 76 77 18 0.010 **
Denmark 46 63 73 77 94 21 0.010 ***
Greece 54 40 52 63 23 ‐0.002 N/s
Northern Ireland 27 42 45 69 27 0.011 ***
Total 50 51 60 62 66 6 0.002 ***
Note: “On the whole, are you very satisfied, fairly satisfied, not very satisfied, or not at all satisfied with the way democracy works in your
country?” Proportion responding ‘fairly’ or ‘very’ satisfied. OLS regression analysis was used to monitor the effects of time (the survey year) on
trust in political parties, generating the unstandardized beta coefficient and its significance. *>.001 ** >.01 *>.05. Selected years presented. For
the full annual trends, see Figure 4.6.
Source: Mannheim Eurobarometer Trend File 1970‐2002; Eurobarometer surveys 2002‐2007 downloaded from Gesis ZACAT.
DEMOCRATIC DEFICITS: CHAPTER 4 2/16/2010 7:35 PM
32
Table 4.5: European nation pride
1982 1994 2000 2007 1994‐2007Net change
Year Sig.
Portugal 90 94 86 ‐4 0.002 N/s
Northern Ireland 87 91 94 89 ‐2 0.001 N/s
Spain 87 91 85 ‐2 0.000 N/s
Ireland 90 96 99 96 0 0.004 ***
Italy 79 83 89 84 1 0.001 N/s
Denmark 84 88 91 90 2 0.004 **
Great Britain 90 85 93 89 4 0.001 N/s
Greece 92 92 96 97 5 0.002 **
Luxembourg 89 84 89 90 6 ‐0.002 N/s
Belgium 64 75 81 85 10 0.005 N/s
Germany‐East 55 68 68 13 0.021 N/s
France 83 75 88 89 14 0.002 N/s
Netherlands 79 73 87 87 14 0.003 *
Germany‐West 67 56 74 72 16 0.003 N/s
Total 82 81 88 86 6 0.002 *
Note: ‘Would you say you are very proud, fairly proud, not very proud, not at all proud to be (NATIONALITY)?’ Proportion who say that they are
‘fairly’ or ‘very’ proud. OLS regression analysis was used to monitor the effects of time (the survey year) on trust in political parties, generating
the unstandardized beta coefficient and its significance. *>.001 ** >.01 *>.05. Selected years presented. For the full annual trends, see Figure
4.7.
Source: The Mannheim Eurobarometer Trend File 1970‐2002; Eurobarometer surveys 2002‐2007 downloaded from Gesis ZACAT.

CRITICAL CITIZENS REVISITED: CHAPTER 4 2/16/2010 7:35 PM
33
1 Hugh national variations, and periodic fluctuations, are also noted by others when comparing trust in
national parliaments; see Bernhard Wessels.2009. ‘Trust in political institutions.’ In The Legitimacy of the
European Union after Enlargement. Ed Jacques Thomassen. Oxford: Oxford University Press.
2 See, for example, the claims in Gerry Stoker. 2006. Why Politics Matters: Making Democracy Work.
London: Palgrave/Macmillan. Chapter 2.
3 See Stephen Earl Bennett. 2001. ‘Were the halcyon days really golden?’ In John R. Hibbing and
Elizabeth Theiss‐Morse. Eds. 2001. What Is It About Government That Americans Dislike? Cambridge:
Cambridge University Press.
4 Samuel P. Huntington. 1991. The Third Wave: Democratization in the Late Twentieth Century. Norman:
The University of Oklahoma Press.
5 For the intellectual history of the origins of the civic culture study, see Gabriel Almond’s (1996) ‘The
civic culture: Prehistory, retrospect, and prospect’ (http://repositories.cdlib.org/csd/96‐01) and Gerardo
L. Munck and Richard Snyder. 2007. Passion, Craft, and Method in Comparative Politics.
6 Gabriel A. Almond and Sidney Verba. 1963. The Civic Culture. Princeton: Princeton University Press. p.
314.
7 Gabriel A. Almond and Sidney Verba. 1963. The Civic Culture. Princeton: Princeton University Press.
p.308.
8 Samuel Barnes and Max Kaase. 1979. Political Action: Mass Participation in Five Western Democracies.
Beverley Hills, CA: Sage.
9 Michel Crozier, Samuel P. Huntington, and Joji Watanuki. 1975. The Crisis of Democracy: Report on the
Governability of Democracies to the Trilateral Commission. New York: New York University Press. See
also Samuel P. Huntington. 1981. American Politics: The Promise of Disharmony. Cambridge: Harvard
University Press.
10 Seymour Martin Lipset and William C. Schneider. 1983. The Confidence Gap: Business, Labor, and
Government in the Public Mind. New York: Free Press. P.6. See also Joseph S. Nye, Philip D. Zelikow, and

CRITICAL CITIZENS REVISITED: CHAPTER 4 2/16/2010 7:35 PM
34
David C. King. Eds. 1997. Why People Don't Trust Government. Cambridge, MA: Harvard University
Press.
11 See, in particular, Ola Listhaug and Matti Wiberg. 1995. ‘Confidence in political and private
institutions.’ In Citizens and the State, eds. Hans‐Dieter Klingemann and Dieter Fuchs. Oxford: Oxford
University Press; Ola Listhaug. 1995. ‘The dynamics of trust in politicians.’ In Citizens and the State, eds.
Hans‐Dieter Klingemann and Dieter Fuchs. Oxford: Oxford University Press.
12 Susan J. Pharr and Robert D. Putnam, Eds. 2000. Disaffected democracies: what's troubling the
trilateral countries? 2000, Princeton, N.J.: Princeton University Press; Mattei Dogan. Ed. 2005. Political
Mistrust and the Discrediting of Politicians. The Netherlands: Brill; Gerry Stoker. 2006. Why Politics
Matters: Making Democracy Work. London: Palgrave/Macmillan; Mariano Torcal and José R. Montero.
(Eds). 2006. Political Disaffection in Contemporary Democracies: Social Capital, Institutions, and Politics.
London: Routledge; Colin Hay. 2007. Why We Hate Politics. Cambridge: Polity Press.
13 Russell J. Dalton. 1999. ‘Political support in advanced industrialized democracies.’ In Critical Citizens:
Global Support for Democratic Governance. Ed. Pippa Norris. New York: Oxford University Press. See also
Russell J Dalton and Martin P. Wattenberg. (Eds). 2002. Parties without Partisans: Political Change in
Advanced Industrial Democracies. Oxford: Oxford University Press; Russell J. Dalton. 2004. Democratic
Challenges, Democratic Choices: The Erosion of Political Support in Advanced Industrial Democracies.
New York: Oxford University Press.
14 Michael Kenny. 2009. ‘Taking the Temperature of the British Political Elite 3: When Grubby is the
Order of the Day ...’ Parliamentary Affairs 62(3): 503‐513.
15 Seymour Martin Lipset. 1996. American Exceptionalism: A Double‐Edged Sword. New York: W. W.
Norton & Company.
16 See, for example, World Public Opinion. 2008. World Public Opinion on Governance and Democracy.
Program on International Policy Attitudes at the University of Maryland. WorldPublicOpinion.org.
17 Russell Hardin. 2006. Trust. Cambridge: Polity Press.
18 Jack Citrin. 1974. ‘Comment: The political relevance of trust in government.’ American Political Science
Review 68:973‐88; Jack Citrin and Donald Philip Green. 1986. ‘Presidential leadership and the resurgence
of trust in government.’ British Journal of Political Science 16: 431‐53.

CRITICAL CITIZENS REVISITED: CHAPTER 4 2/16/2010 7:35 PM
35
19 Arthur H. Miller. 1974. ‘Political issues and trust in government, 1964‐1970.’ American Political
Science Review 68: 951‐72; Arthur H. Miller. 1974. ‘Rejoinder to 'Comment' by Jack Citrin: Political
discontent or ritualism?’ American Political Science Review 68:989‐1001; Arthur H. Miller and Stephen A.
Borrelli. 1991. ‘Confidence in government during the 1980s.’ American Politics Quarterly 19: 147‐73.
20 Marc J. Hetherington. 2005. Why Trust Matters. Princeton, NJ: Princeton University Press. P15.
21 Paul R. Abramson and Ada W. Finifter. 1981. ‘On the meaning of political trust: new evidence from
items introduced in 1978.’ American Journal of Political Science 25 (2): 297‐307.
22 See the ANES Guide to Public Opinion and Electoral Behavior.
http://www.electionstudies.org/nesguide/graphs/g5a_1_2.htm
23 Jack Citrin and Donald Green. 1986. ‘Presidential Leadership and Trust in Government.’ British Journal
of Political Science 16:431‐53. See also Virginia A. Chanley, Thomas J. Rudolph and Wendy M. Rahn.
2001. ‘Public trust in government in the Reagan years and beyond.’ In John R. Hibbing and Elizabeth
Theiss‐Morse. Eds. 2001. What Is It About Government That Americans Dislike? Cambridge: Cambridge
University Press.
24 Marc J. Hetherington. 2005. Why Trust Matters. Princeton, NJ: Princeton University Press.
25 The New York Times/CBS News surveys have carried comparable item to the ANES measures for trust
in the federal government from February 1976 to February 2010. In this series, the proportion
expressing trust in the federal government ‘always’ or ‘most of the time’ was 28 percent in the poll prior
to 9/11, the proportion peaked at 55 percent following the events of 9/11, before falling back further to
19 percent by February 2010. See http://www.nytimes.com/2010/02/12/us/politics/12poll.html?hp For
Gallup series, ‘Trust in Government’, see www.gallup.com .
26 Ola Listhaug. 1995. ‘The dynamics of trust in politicians.’ In Citizens and the State, eds. Hans‐Dieter
Klingemann and Dieter Fuchs. Oxford: Oxford University Press.
27 Russell J. Dalton. 2004. Democratic Challenges, Democratic Choices: The Erosion of Political Support in
Advanced Industrial Democracies. New York: Oxford University Press. Pp.29‐31.
28 For details see the Gallup poll: http://www.gallup.com/poll/124787/Decade‐Review‐Four‐Key‐
Trends.aspx

CRITICAL CITIZENS REVISITED: CHAPTER 4 2/16/2010 7:35 PM
36
29 John R. Hibbing and Elizabeth Theiss‐Morse. 1995. Congress as Public Enemy. New York: Cambridge
University Press.
30 Steven Van de Walle, Steven Van Roosbroek, and Geert Bouckaert. 2008. ‘Trust in the public sector: is
there any evidence for a long‐term decline?’ International Review of Administrative Sciences 74(1): 47‐
64.
31 Gabriel A. Almond and Sidney Verba. 1963. The Civic Culture. Princeton: Princeton University Press.
32 Russell J. Dalton. 2004. Democratic Challenges, Democratic Choices: The Erosion of Political Support in
Advanced Industrial Democracies. New York: Oxford University Press.
33 Richard.S. Katz et al., 1992. ‘The Membership of Political Parties in European Democracies, 1960–
1990’, European Journal of Political Research, 22: 329–45; Susan Scarrow. 2000. ‘Parties without
Members? Party Organization in a Changing Electoral Environment.’ In R.J. Dalton and M.P. Wattenberg
(eds), Parties without Partisans: Political Change in Advanced Industrial Democracies, Oxford: Oxford
University Press, 2000; Peter Mair and Ingrid van Biezen. 2001. ‘Party membership in twenty European
democracies 1980‐2000.’ Party Politics 7 (1): 5‐22; Ingrid van Biezen, Peter Mair and Thomas Poguntke.
2009. ‘ Going, Going,……Gone? Party Membership in the 21st Century.’ Paper presented at the Joint
Workshops at the European Consortium for Political Research, Lisbon..
34 Russell J. Dalton. 2004. Democratic Challenges, Democratic Choices: The Erosion of Political Support in
Advanced Industrial Democracies. New York: Oxford University Press. P.32.
35 J. Maesschalck and S. Van de Walle. 2006. ‘Policy failure and corruption in Belgium: Is federalism to
blame?’ West European Politics 29(5): 999‐1017.
36 See John Curtice and Roger Jowell. 1995. ‘The skeptical electorate.’ In British Social Attitudes: The 12th
Report, eds. Roger Jowell, et al., pp. 140‐72. Aldershot: Ashgate; John Curtice and Roger Jowell. 1997. ‘Trust
in the Political System.’ In British Social Attitudes: the 14th Report, eds. Roger Jowell et al. Aldershot: Ashgate.
37See the Committee on Standards in Public Life. http://www.public‐standards.gov.uk/
38 For some of the many previous studies using this measure, see Anderson, Christopher J., and Christine
A. Guillory. 1997. ‘Political institutions and satisfaction with Democracy.’ American Political Science
Review 91(1):66‐81; Marta Lagos. 2003. ‘Support for and satisfaction with democracy.’ International
Journal of Public Opinion Research 15 (4): 471‐487; André Blais and F. Gelineau. 2007. ‘Winning, losing

CRITICAL CITIZENS REVISITED: CHAPTER 4 2/16/2010 7:35 PM
37
and satisfaction with democracy.’ Political Studies 55: 425–441; Kees Aarts and Jacques Thomassen.
2008. ‘Satisfaction with democracy: Do institutions matter?’ Electoral Studies 27(1): 5‐18; Alexander
F.Wagner, Friedrich Schneider, and Martin Halla. 2009. ‘The quality of institutions and satisfaction with
democracy in Western Europe: A panel analysis.’ European Journal of Political Economy 25 (1): 30‐41
39For a debate concerning the meaning, see D. Canache, J.J. Mondak and Mitch A. Seligson. 2001.
‘Meaning and measurement in cross‐national research on satisfaction with democracy.’ Public Opinion
Quarterly 65: 506–528; Jonas Linde and Joakim Ekman. 2003. ‘Satisfaction with democracy: A note on a
frequently used indicator in comparative politics.’ European Journal of Political Research 42(3): 391 –
408.
40 Jonas Linde and Joakim Ekman. 2003. ‘Satisfaction with democracy: A note on a frequently used
indicator in comparative politics.’ European Journal of Political Research 42(3): 391 – 408.
41 For a discussion about the Italian case, see Paolo Segatti. ‘Italy, forty years of political disaffection: A
longitudinal exploration.’ In Mariano Torcal and José R. Montero. (Eds). 2006. Political Disaffection in
Contemporary Democracies: Social Capital, Institutions, and Politics. London: Routledge.
42 Sophie Duchesne and Andrè‐Paul Frognier. 1995. ‘Is There a European Identity?’ In Public Opinion and
Internationalized Governance. Edited by Oskar Niedermayer and Richard Sinnott. Oxford: Oxford
University Press; Angelika Scheuer. 1999. ‘A Political Community?’ In Political Representation and
Legitimacy in the European Union. Ed. Hermann Schmitt and Jacques Thomassen. Oxford: Oxford
University Press; T. Risse. 2001. ‘A European identity? Europeanization and the evolution of nation‐state
identities.’ In Transforming Europe. Eds. M.G. Cowles, J. Caporaso and T. Risse. Ithaca, NY: Cornell
University Press. See also B. Nelson, D. Roberts and W.Veit. (eds). The Idea of Europe: Problems of
National and Transnational Identity. Oxford: Berg; Lauren M. McLaren. 2005. Identity, Interests and
Attitudes to European Integration. London: Palgrave Macmillan.
43 Susan Pharr and Robert Putnam. (Eds.) 2000. Disaffected Democracies: what's troubling the trilateral
countries? Princeton: Princeton University Press; Mariano Torcal and José R. Montero . 2006. Political
Disaffection in Contemporary Democracies: Social Capital, Institutions, and Politics. London: Routledge;
Mattei Dogan. Ed. 2005. Political Mistrust and the Discrediting of Politicians. The Netherlands: Brill
44 David Held, Anthony McGrew, David Goldblatt, and Jonathan Perraton. 1999. Global transformations:
Politics, economics, and culture. Stanford, CA: Stanford University Press. Chapter 7.

CRITICAL CITIZENS REVISITED: CHAPTER 4 2/16/2010 7:35 PM
38
45 See also, Pippa Norris and Ronald Inglehart. 2009. Cosmopolitan Communications. New York:
Cambridge University Press.
46Margaret Levi and Laura Stoker. 2000. ‘Political trust and trustworthiness.’ Annual Review of Political
Science 3: 475‐508.