chapter 4 transport equipment sector
TRANSCRIPT
Engineering Industries of Japan, No. 41, 2007 77
Chapter 4 Transport Equipment Sector
4-1. Automobiles
4-1-1. Trends in Supply & Demand
(1) Overview
As Japan’s economy continues down the road to a full-fledged recovery, some manufacturers in the nation’s auto industry have announced record high financial results, and conditions in the industry have taken a favorable turn. While soaring oil prices threaten to dampen automobile sales, global markets – particularly the U.S. market – have begun to de-mand greater fuel efficiency; as a result, sales of Japanese automobiles are increasing again. In con-
trast, U.S. automakers face huge retirement costs for their aging workforces. However, there are some markets that Japanese automakers have yet to domi-nate outright, indicating that some challenges still lay ahead.
The following sections will discuss current conditions in the auto industry and the direction in which it is heading.
(2) Domestic Production, Sales & Vehicle Registrations
Japanese auto production is experiencing an upward trend that can be attributed to the nation’s economic recovery. Diagram 4-1-1 shows produc-tion results in three major categories over the past five years. As indicated, production has increased steadily since 2002 (production declined in 2001). Total output in 2005 was approximately 10.8 million units; this figure has remained above the 10-million-unit mark since 2002.
In the passenger car category, production of standard-size, compact, and “kei” (mini) cars in-creased across the board to more than 9 million units; this was the first year since 1992 that produc-tion has reached this level. As production increases, Japanese automakers are taking steps to expand their production capacities. Toyota, for example, expanded the production line at its Miyata Plant,
and Honda announced it will construct a new plant in Saitama Prefecture (Yorii Town).
Truck production totaled approximately 1.71 million units, but fell below previous year results. Standard-size and compact truck production has been in a downward trend since 2004. On the other hand, production of “kei” (mini) trucks, which had been in a downward trend, began to increase.
In the bus category, increased production of compact buses helped to boost overall bus produc-tion to 76,000 units. This is a dramatic increase in light of the fact that bus production had been in a downward trend since 2002.

Engineering Industries of Japan, No. 41, 2007 78
Diagram 4-1-1. Domestic Automobile Production by Vehicle Type
Standard Compact Kei Subtotal Standard Compact Kei Subtotal2001 3,460,006 3,378,915 1,278,642 8,117,563 595,403 445,270 560,863 1,601,5362002 3,671,023 3,637,501 1,309,830 8,618,354 679,964 380,303 512,373 1,572,6402003 3,753,446 3,434,662 1,290,220 8,478,328 772,727 449,462 524,427 1,746,6162004 4,044,563 3,309,147 1,366,675 8,720,385 769,953 446,536 514,202 1,730,6912005 4,191,360 3,416,622 1,408,753 9,016,735 723,663 436,763 546,185 1,706,611
Large Compact Subtotal2001 11,205 46,887 58,092 9,777,1912002 11,141 55,180 66,321 10,257,3152003 11,406 49,668 61,074 10,286,0182004 12,286 48,156 60,442 10,511,5182005 11,763 64,550 76,313 10,799,659
TOTAL
Passenger Cars Trucks
Buses
Source: Japan Automobile Manufacturers Association (JAMA) statistics
Diagram 4-1-2. Domestic Automobile Production by Manufacturer
Toyota Nissan Mazda Mitsubishi Isuzu Daihatsu Honda Subaru
2001 3,354,424 1,270,288 729,279 834,749 215,929 638,887 1,284,707 462,8832002 3,485,168 1,392,439 773,418 871,304 231,053 599,541 1,386,379 436,3552003 3,520,017 1,471,595 801,084 749,371 244,575 641,236 1,170,941 450,0622004 3,680,946 1,439,007 818,730 639,883 218,352 679,485 1,242,528 491,7922005 3,789,582 1,451,212 864,929 664,900 210,253 724,509 1,261,994 469,497
NissanDiesel Hino Suzuki GM Japan Mitsubishi
Fuso Other TOTAL
2001 24,153 53,435 907,528 492 - 437 9,777,1912002 26,768 54,170 999,880 241 - 599 10,257,3152003 38,848 83,122 980,731 1,012 132,745 679 10,286,0182004 40,107 93,837 1,045,735 - 120,118 998 10,511,5182005 41,071 96,985 1,090,786 - 132,274 1,667 10,799,659
Source: Japan Automobile Manufacturers Association (JAMA) statistics
Diagram 4-1-2 breaks down domestic automo-
bile production by manufacturer. As shown, all pas-senger car manufacturers increased production with the exception of Subaru (Fuji Heavy Industries, Ltd.). This upward trend can be attributed to the unveiling of new compact and kei models by each automaker. Subaru, on the other hand, did not re-lease any new models during this period, and this is considered to be the reason behind decreased pro-duction; however, industry watchers predict that Subaru production will increase in the future as a result of the company’s partnership with Toyota.
Each automaker with a kei car lineup increased kei car production considerably – particularly Dai-hatsu and Suzuki.
Automakers that primarily manufacture trucks
had mixed results. Some decreased production, and those that were able to increase production were unable to do so at the same rate of the previous year. This may be attributed in part to the enactment of emission restrictions.
Even Mitsubishi Group, which was plagued by a series of recall scandals and forced to drastically reduce production in 2004, was able to boost pro-duction this year, and sales of its kei cars were fa-vorable. Once the recall scandal was exposed, Mit-subishi announced a plan to close one of its domes-tic plants. However, the company subsequently de-cided to postpone the closure indefinitely in order to increase production, and now seems to be getting back on track. As automakers continue to boost production, many

Engineering Industries of Japan, No. 41, 2007 79
are once again taking measures to boost production capacity for the first time since downsizing and re-structuring their operations in the wake of Japan’s “bubble economy” meltdown. Industry watchers expect other automakers to follow the examples of Toyota and Honda and develop plans to create new plants and expand production lines. However, these efforts could be tempered by memories from the “bubble” era, when automakers made aggressive capital investments in order to boost production ca-pacity only to be left with excess capacity once the bubble burst.
Diagram 4-1-3 shows domestic automobile sales in each category. The total number of vehicle
sales/registrations was approximately 5.85 million units – virtually the same as the previous year. Even though Japan’s economy is steadily recovering, high oil prices are seen to have had an adverse effect on standard-size car sales.
Poor truck and bus sales may be attributed in part to a lack of replacement demand. New envi-ronmental regulations were enacted in previous years, and therefore many customers who needed to upgrade their vehicles did so before 2005, which caused a slump in demand this year. New emission restrictions are also considered to have had a damp-ening effect on sales.
Diagram 4-1-3. Domestic Automobile Sales & Registrations by Vehicle Type
Standard Compact Kei Subtotal Standard Compact Kei Subtotal2001 741,489 2,274,996 1,273,198 4,289,683 83,038 943,591 574,227 1,600,8562002 674,094 2,460,103 1,307,157 4,441,354 76,035 739,502 518,843 1,334,3802003 1,229,907 2,194,194 1,291,819 4,715,920 208,752 373,259 509,044 1,091,0552004 1,358,281 2,037,767 1,372,083 4,768,131 186,588 361,449 519,067 1,067,1042005 1,271,349 2,089,992 1,387,068 4,748,409 197,548 351,708 536,648 1,085,904
Large Compact Subtotal2001 4,420 11,512 15,932 5,906,4712002 4,729 11,630 16,359 5,792,0932003 5,862 15,341 21,203 5,828,1782004 5,098 13,049 18,147 5,853,3822005 5,856 11,898 17,754 5,852,067
TOTAL
Passenger Cars Trucks
Buses
Note: Before 2003, sales statistics were chassis-based; beginning in 2003, sales are based on the number of vehicle registrations. There is no continuity between chassis- and registration-based statistics. Source: Japan Automobile Manufacturers Association (JAMA) statistics
As Diagram 4-1-3 indicates, passenger car
sales dropped slightly below 2004 figures to a rough total of 4.75 million units. This may be attributed to poor sales of standard-size cars, which in turn can be attributed to increasing demand for more fuel-efficient cars as a result of high oil prices.
Compact and kei cars, on the other hand, each experienced a slight increase in sales. This may be attributed to the high degree of fuel efficiency that they offer and to the release of new models.
Truck sales increased slightly over the previous year to a rough total of 1.09 million units. In con-trast to passenger cars, sales of standard-size and kei trucks increased while sales of compact trucks dropped. Bus sales – roughly 18,000 units – fol-
lowed the same trend. While domestic economic recovery is helping
to improve conditions in the auto industry, environ-mental regulations, high oil prices, and other factors have prevented sales from growing at a larger rate. It seems unlikely that oil prices will drop in the near future, particularly when one considers the unstable conditions that currently exist in the Middle East. That this situation will have an adverse effect on Japan’s economy is undeniable; it makes it difficult to determine whether or not domestic automobile sales will grow in future years.
Rising oil prices also cause the price of materi-als used to manufacture cars increase as well; as a result, the manufacturing costs of automobiles in-

Engineering Industries of Japan, No. 41, 2007 80
crease. Generally speaking, car selling practices in Japan have developed in such a way that it is diffi-cult for buyers to notice when car prices go up. Nevertheless, rising oil costs will likely force auto-makers to pass on the increased cost of materials to their customers. Industry watchers believe this could
have serious consequences for domestic sales. De-pending on future market trends, sales of low-profit-margin compact and kei cars may in-crease while sales in other categories suffer, ad-versely affecting automaker profits.
Diagram 4-1-4 Domestic Automobile Sales & Registrations by Brand
Toyota Nissan Mazda Mitsubishi Isuzu Daihatsu Honda Subaru2001 1,713,271 731,628 281,352 487,655 60,573 542,024 854,035 287,2642002 1,675,213 773,741 263,081 416,387 54,727 504,596 892,868 255,3752003 1,704,717 825,090 277,783 367,034 86,104 541,855 715,119 243,8242004 1,759,003 826,879 280,583 255,240 80,979 577,809 743,133 278,4232005 1,703,185 866,226 286,919 244,251 84,197 601,154 714,115 258,217
NissanDiesel Hino Suzuki GM Japan Mitsubishi
Fuso Lexus Other TOTAL
2001 16,326 34,361 622,057 118 - - 275,807 5,906,4712002 15,694 33,210 626,090 522 - - 280,589 5,792,0932003 22,245 47,871 626,873 1,226 87,509 - 280,928 5,828,1782004 19,704 50,902 662,135 - 73,293 - 245,299 5,853,3822005 21,407 54,528 695,787 - 61,171 10,293 250,617 5,852,067
Notes: 1. Before 2003, sales statistics were chassis-based; beginning in 2003, sales are based on the number of vehicle registrations.
There is no continuity between chassis- and registration-based statistics. 2. Before 2004, registered vehicle sales were categorized by manufacturer; beginning in 2004, registered vehicle sales are
categorized by brand. Vehicles manufactured overseas by Japanese automakers heretofore included in the “Other” category have been included in domestic sales/registration statistics. There is no continuity between manufacturer- and brand-based statistics. Sales/registrations of brands not specifically mentioned have been included in the “Other” category.
Source: Japan Automobile Manufacturers Association (JAMA) statistics
Diagram 4-2-4 shows brand-specific domestic
sales figures for the past five years. Toyota’s 2005 sales dropped below the previous year, due in part to the fact that Lexus sales are now in a separate cate-gory. However, even if Toyota and Lexus sales are added together, the total (approx. 1.71 million units) is still lower than the previous year. This is the first time since 2002 that Toyota’s sales have dropped. Lexus sales are said to have fallen below Toyota’s initial estimates, and high oil prices have also cre-ated challenges. Industry watchers are interested to see what measures Toyota will take to reverse this trend.
In contrast to Toyota, Nissan’s 2005 sales in-creased roughly 40,000 units over the previous year to 870,000 units. This can be attributed to the com-pany’s aggressive marketing activities designed to
enable the company to achieve CEO Carlos Ghosn’s domestic sales “commitment.” However, others at-tribute this growth to favorable sales of Nissan kei vehicles, the production of which is actually out-sourced to other manufacturers. This notion has generated doubt about Nissan’s reported sales in-crease, and whether or not this increase can be at-tributed to cars manufactured by Nissan itself.
While Honda’s sales increased in 2004, sales in ’05 dropped below the previous year. Although the company sells kei vehicles, some believe that the decrease in overall sales can be attributed to the Honda’s failure to expand kei vehicle sales.
Suzuki and Daihatsu, both of which are in-volved in fierce competition in the kei market, saw their sales increase in 2005. Suzuki’s sales rose to approximately 700,000 units, while Daihatsu’s sales
Engineering Industries of Japan, No. 41, 2007 81
rose above 600,000 units. Suzuki seems poised to overtake Honda, and has successfully taken advan-tage of favorable conditions in recent years to secure a solid position in the market. Daihatsu, too, is in-
creasing its share of the compact and kei vehicle markets, and is playing an increasingly important role in its partnership with the Toyota Group.
Diagram 4-1-5. Top Five Passenger Car Models Based on Domestic Vehicle Registrations
2005 2004 2003Rank Model Make Units Model Make Units Model Make Units
1 Wagon R Suzuki 236,701 Wagon R Suzuki 211,929 Corolla Toyota 198,9042 Move Daihatsu 196,977 Move Daihatsu 186,780 Move Daihatsu 187,5453 Corolla Toyota 149,810 Corolla Toyota 173,301 Fit Honda 182,2854 Alto Suzuki 143,092 Life Honda 159,055 Wagon R Suzuki 177,1515 Vitz Toyota 131,935 Fit Honda 149,503 Wish Toyota 158,658
Note: Shadowed text indicates a kei car Source: Japan Automobile Dealers Association (JADA) Web site and statistics
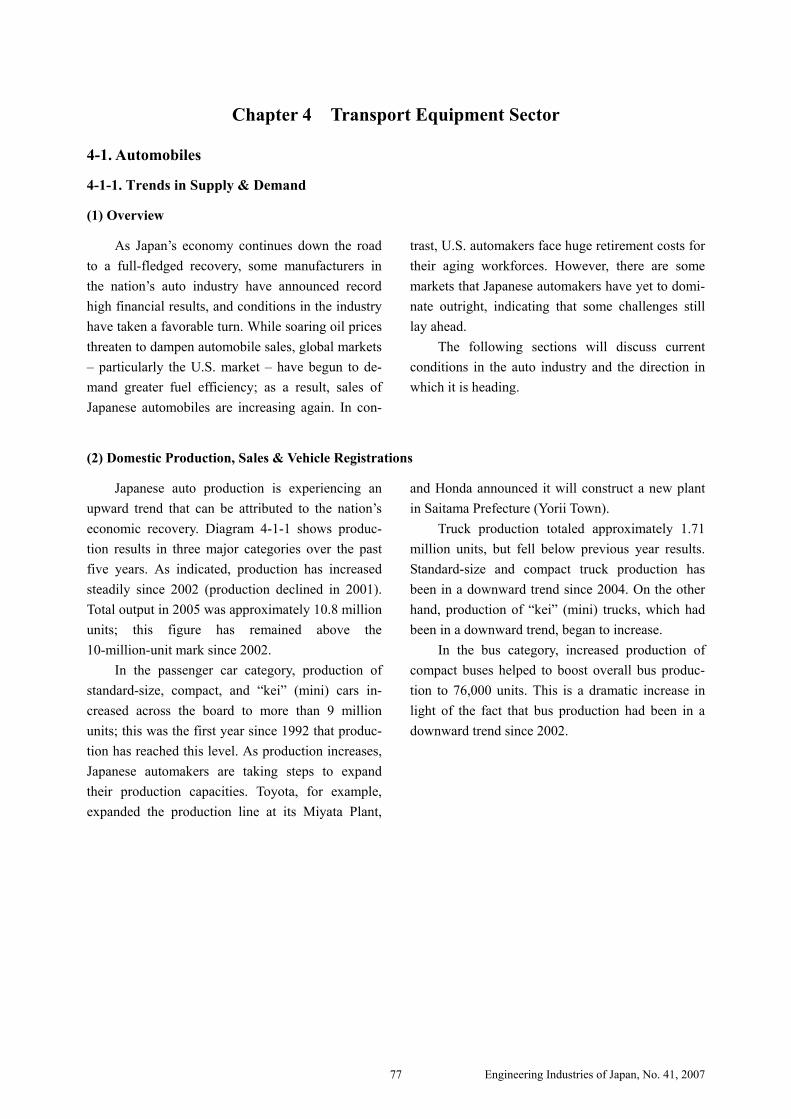
Diagram 4-1-5 shows the five best-selling pas-
senger car models in the Japanese market. As shown, sales and registrations of kei cars are in an upward trend, and it is no longer unusual to see a kei model in the top slot.
New model releases were expected to boost sales of compact cars. For example, Toyota sold roughly 60,000 Vitz cars in 2004. Then the Vitz un-derwent a full model change, and 2005 sales more
than doubled to roughly 130,000 units. Suzuki’s Wagon R underwent a model change in 2003 and it still remains high in popularity.
Sales of Lexus luxury cars are said to be ex-periencing sluggish growth, and Nissan has post-poned the domestic release of its Infiniti luxury brand due to rising oil prices and falling demand. On the other hand, sales of fuel-efficient compact and kei cars will benefit from these conditions.
(3) Imports & Exports
Exports of Japanese cars continued to increase, and reached a rough total of 5.05 million units in 2005. Auto exports have not reached such a high level since 1993, when roughly 5.02 million units were exported. Exports of passenger cars totaled roughly 4.36 million units, and exports of stan-dard-size passenger cars alone totaled 3.16 million units.
Exports of compact and kei cars fell below
previous year figures. Truck exports fell below the previous year to
610,000 units. Bus exports increased to roughly 78,000 units due to increased exports of compact buses.
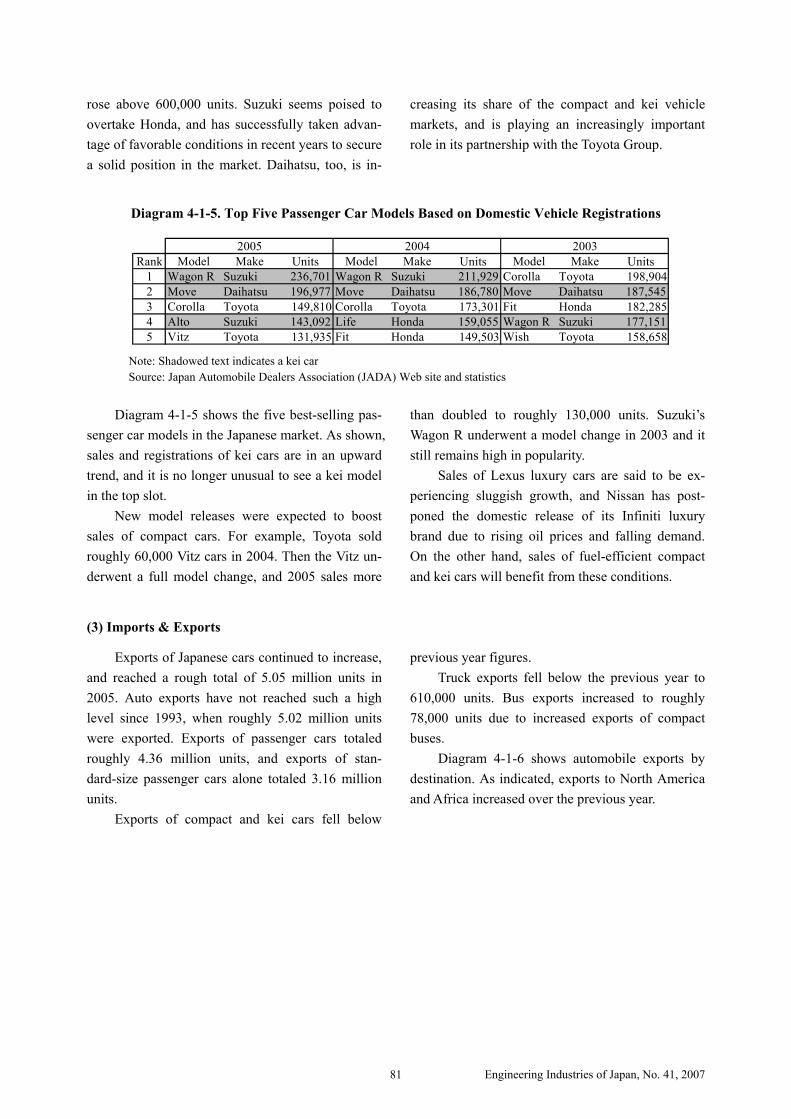
Diagram 4-1-6 shows automobile exports by destination. As indicated, exports to North America and Africa increased over the previous year.
Engineering Industries of Japan, No. 41, 2007 82
Diagram 4-1-6. Automobile Exports by Region
All EU Former EU New EU Canada U.S.2001 351,227 381,965 810,087 780,750 29,337 895,415 188,818 1,606,998 1,795,8162002 426,692 419,274 864,794 837,639 27,155 949,699 234,661 1,841,637 2,076,2982003 524,093 439,587 1,019,058 988,523 30,535 1,159,706 192,230 1,594,157 1,786,3872004 510,939 457,406 1,036,127 987,299 48,828 1,275,229 166,858 1,559,607 1,726,4652005 420,067 519,594 895,728 856,791 38,937 1,178,197 191,499 1,662,939 1,854,438
2001 109,390 184,166 98,524 341,808 7,778 4,166,0892002 142,807 144,358 144,979 385,455 9,166 4,698,7282003 153,912 118,385 146,269 418,202 9,802 4,756,3432004 186,930 157,914 182,451 448,671 11,658 4,957,6632005 221,732 191,527 209,548 447,922 10,036 5,053,061
North AmericaAsia Middle
East
TOTAL
Europe
Oceania OtherCentralAmerica
SouthAmerica Africa
Source: Japan Automobile Manufacturers Association (JAMA) statistics
Diagram 4-1-7. Automobile Imports by Region
EU U.S.2001 8,293 198,677 215,880 33,967 38,606 17,681 13,397 122 293,9792002 12,711 196,061 213,396 31,151 34,409 14,509 18,346 98 293,4692003 21,091 177,390 184,652 25,940 28,423 11,570 40,201 111 286,0482004 14,158 203,632 205,555 26,535 27,979 8,160 37,105 119 293,0762005 18,146 191,036 192,219 23,567 25,972 10,583 44,891 114 291,925
Africa Oceania &Other TOTALAsia &
Middle EastEurope North America Central & South
America
Notes: 1. “EU” represents the 25 EU nations that have been included in statistics since 2004. 2. Statistics are based on 4-wheel vehicles only, and include tractors and other special-purpose vehicles. Source: “Ministry of Finance Trade Statistics” taken from the Japan Customs Web site
Exports to Asia and Europe were in a down-
ward trend due to the shift of Japanese auto manu-facturing operations to overseas plants. Exports to Mexico, which have risen sharply since 2001, rose from roughly 55,000 units in 2004 to 75,000 units in ’05, and exports to South Africa rose from 39,000 units to 65,000 units in the same period.
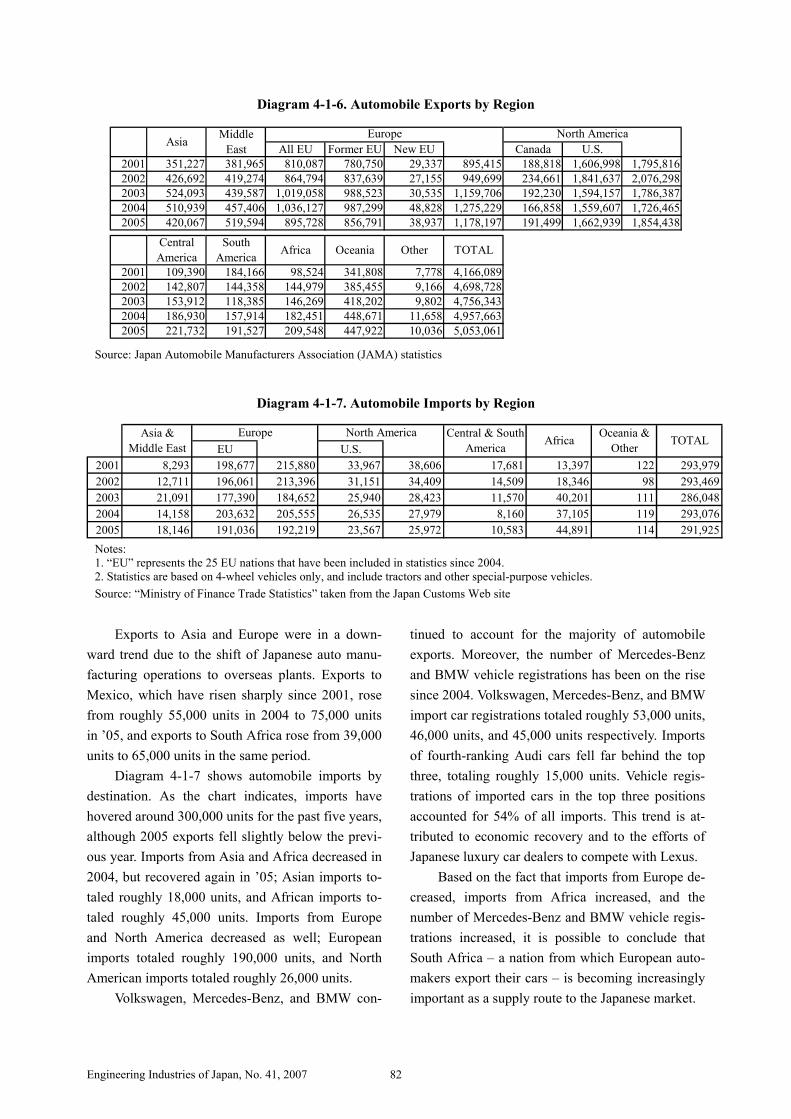
Diagram 4-1-7 shows automobile imports by destination. As the chart indicates, imports have hovered around 300,000 units for the past five years, although 2005 exports fell slightly below the previ-ous year. Imports from Asia and Africa decreased in 2004, but recovered again in ’05; Asian imports to-taled roughly 18,000 units, and African imports to-taled roughly 45,000 units. Imports from Europe and North America decreased as well; European imports totaled roughly 190,000 units, and North American imports totaled roughly 26,000 units.
Volkswagen, Mercedes-Benz, and BMW con-
tinued to account for the majority of automobile exports. Moreover, the number of Mercedes-Benz and BMW vehicle registrations has been on the rise since 2004. Volkswagen, Mercedes-Benz, and BMW import car registrations totaled roughly 53,000 units, 46,000 units, and 45,000 units respectively. Imports of fourth-ranking Audi cars fell far behind the top three, totaling roughly 15,000 units. Vehicle regis-trations of imported cars in the top three positions accounted for 54% of all imports. This trend is at-tributed to economic recovery and to the efforts of Japanese luxury car dealers to compete with Lexus.
Based on the fact that imports from Europe de-creased, imports from Africa increased, and the number of Mercedes-Benz and BMW vehicle regis-trations increased, it is possible to conclude that South Africa – a nation from which European auto-makers export their cars – is becoming increasingly important as a supply route to the Japanese market.
Engineering Industries of Japan, No. 41, 2007 83
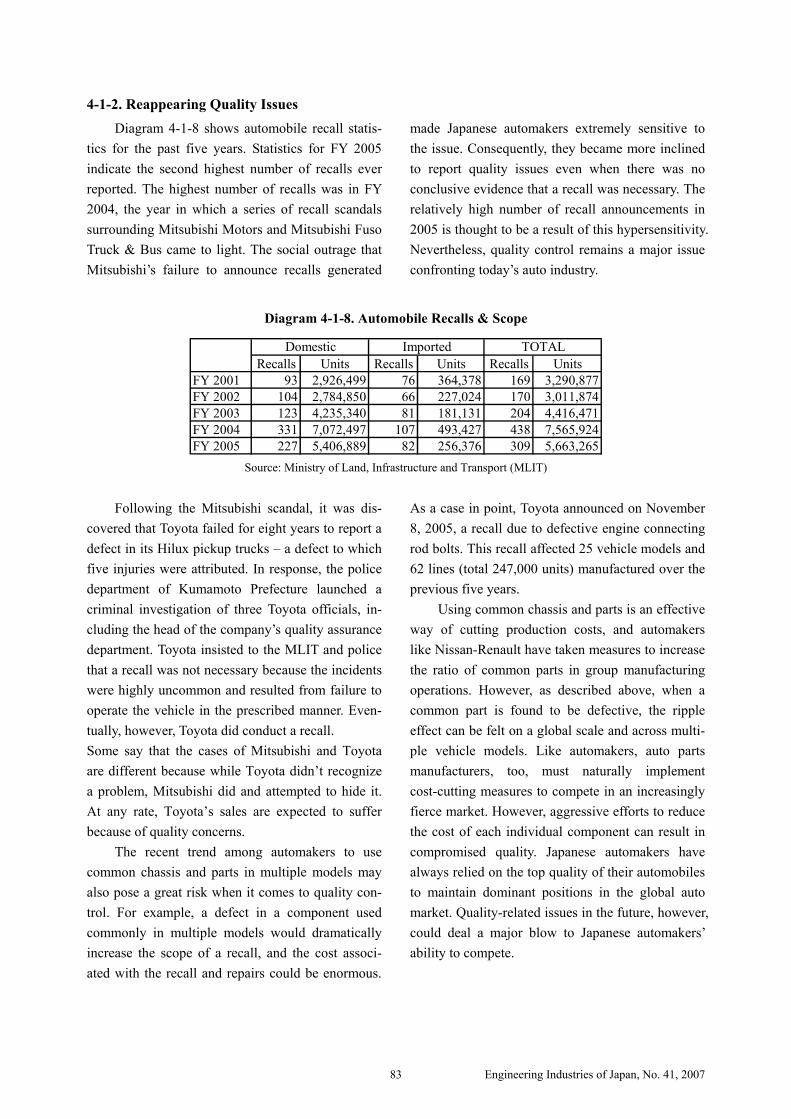
4-1-2. Reappearing Quality Issues Diagram 4-1-8 shows automobile recall statis-
tics for the past five years. Statistics for FY 2005 indicate the second highest number of recalls ever reported. The highest number of recalls was in FY 2004, the year in which a series of recall scandals surrounding Mitsubishi Motors and Mitsubishi Fuso Truck & Bus came to light. The social outrage that Mitsubishi’s failure to announce recalls generated
made Japanese automakers extremely sensitive to the issue. Consequently, they became more inclined to report quality issues even when there was no conclusive evidence that a recall was necessary. The relatively high number of recall announcements in 2005 is thought to be a result of this hypersensitivity. Nevertheless, quality control remains a major issue confronting today’s auto industry.
Diagram 4-1-8. Automobile Recalls & Scope
Recalls Units Recalls Units Recalls UnitsFY 2001 93 2,926,499 76 364,378 169 3,290,877FY 2002 104 2,784,850 66 227,024 170 3,011,874FY 2003 123 4,235,340 81 181,131 204 4,416,471FY 2004 331 7,072,497 107 493,427 438 7,565,924FY 2005 227 5,406,889 82 256,376 309 5,663,265
Domestic Imported TOTAL
Source: Ministry of Land, Infrastructure and Transport (MLIT)
Following the Mitsubishi scandal, it was dis-
covered that Toyota failed for eight years to report a defect in its Hilux pickup trucks – a defect to which five injuries were attributed. In response, the police department of Kumamoto Prefecture launched a criminal investigation of three Toyota officials, in-cluding the head of the company’s quality assurance department. Toyota insisted to the MLIT and police that a recall was not necessary because the incidents were highly uncommon and resulted from failure to operate the vehicle in the prescribed manner. Even-tually, however, Toyota did conduct a recall. Some say that the cases of Mitsubishi and Toyota are different because while Toyota didn’t recognize a problem, Mitsubishi did and attempted to hide it. At any rate, Toyota’s sales are expected to suffer because of quality concerns.
The recent trend among automakers to use common chassis and parts in multiple models may also pose a great risk when it comes to quality con-trol. For example, a defect in a component used commonly in multiple models would dramatically increase the scope of a recall, and the cost associ-ated with the recall and repairs could be enormous.
As a case in point, Toyota announced on November 8, 2005, a recall due to defective engine connecting rod bolts. This recall affected 25 vehicle models and 62 lines (total 247,000 units) manufactured over the previous five years.
Using common chassis and parts is an effective way of cutting production costs, and automakers like Nissan-Renault have taken measures to increase the ratio of common parts in group manufacturing operations. However, as described above, when a common part is found to be defective, the ripple effect can be felt on a global scale and across multi-ple vehicle models. Like automakers, auto parts manufacturers, too, must naturally implement cost-cutting measures to compete in an increasingly fierce market. However, aggressive efforts to reduce the cost of each individual component can result in compromised quality. Japanese automakers have always relied on the top quality of their automobiles to maintain dominant positions in the global auto market. Quality-related issues in the future, however, could deal a major blow to Japanese automakers’ ability to compete.

Engineering Industries of Japan, No. 41, 2007 84
4-1-3. Future Prospects and Challenges There are many challenges and prospects that
surround the Japanese auto industry, such as soaring oil prices, environmental compliance, the trend to-ward intelligent car technology, and global competi-tion. However, the most pressing issue facing Ja-pan’s machine industries is the aging and shrinking of the Japanese population – and the auto industry is no exception.
As a result of globalization efforts, the ratio of automobiles manufactured overseas continues to rise. Generally speaking, the majority of Japanese automakers are inclined to install “Japanese-style” manufacturing systems in their overseas plants. In doing so, they are faced with the major challenge of how to introduce and normalize Japanese-style manufacturing practices abroad. The problem is that the majority of Japanese automakers rely on human resources in many facets to accomplish this type of goal; specifically, it is common to dispatch seasoned supervisors to overseas plants to carry out the edu-cation and training of local workers.
Many Japanese supervisors are now working at overseas plants in an effort to expand production; however, in many cases the degree of expansion has risen to the extent that a shortage of Japanese super-visors has developed. The expansion of overseas manufacturing operations – particularly in develop-ing nations – commonly relies on the utilization of relatively low-cost labor and minimized factory automation. Consequently, young Japanese workers who are used to highly automated production lines in Japanese plants cannot effectively provide on-site training at foreign plants that rely more on human labor than on factory automation. To circumvent this issue, automakers are bringing more and more for-
eign employees to Japan for training. Toyota, for example, has set up global “production promotion centers” where it provides training programs in the U.S., Europe, and in Asia-Pacific nations. Still, on-the-job training that is tailored to plant-specific needs is the preferred method.
Japan’s aging population and low birth rate is one of the problems facing the auto industry that must be dealt with. Soon, Japanese baby boomers – the core of Japan’s manufacturing industries – will begin to retire en masse, taking with them decades of expertise. Japanese manufacturers must find ways in which to transfer this expertise to the next gen-eration before it is lost.
In the future, securing young male workers is expected to become more difficult, so automakers are taking aggressive measures to hire more female workers. Efforts are also being made to make tradi-tionally male-oriented work environments more fe-male-friendly. Women are already playing a vital role in electrical industry manufacturing operations, and in the auto industry, female workers from Thai-land and the Philippines have become a consider-able force as well. In order to secure female work-forces in the future, manufacturers must also give consideration to setting up childcare centers and offering financial incentives such as promotions and raises.
In addition to the shrinking/aging population problem, Japanese automakers are also faced with a myriad of issues concerning overseas operations and work environments. If these problems are not re-solved, they could have an adverse effect on auto-makers’ ability to compete.
Engineering Industries of Japan, No. 41, 2007 85
4-2. Auto Parts
4-2-1. Trends in Supply & Demand
(1) Overview
As sales in the automobile market continue to enjoy favorable conditions, the auto parts industry, too, is experiencing a boom. Parts production and sales continue to increase, due in part to increased automobile production. On the other hand, rising oil prices are expected to have an adverse effect on automobile sales in the future, and the market share of fuel-efficient compact and “kei” cars has increase, which could deal a blow to parts manufacturers’ profits. Hybrids and other types of environ-
ment-friendly cars are becoming increasingly im-portant in view of rising oil prices, and auto parts manufacturers – like automakers – will need to de-vote future resources to R&D in this field. Auto parts manufacturers are also taking measures to ac-commodate globalization efforts in the automobile industry. Consequently, the auto parts industry is expected to become increasingly vital to the auto-mobile industry as a whole.
(2) Production & Shipment Trends
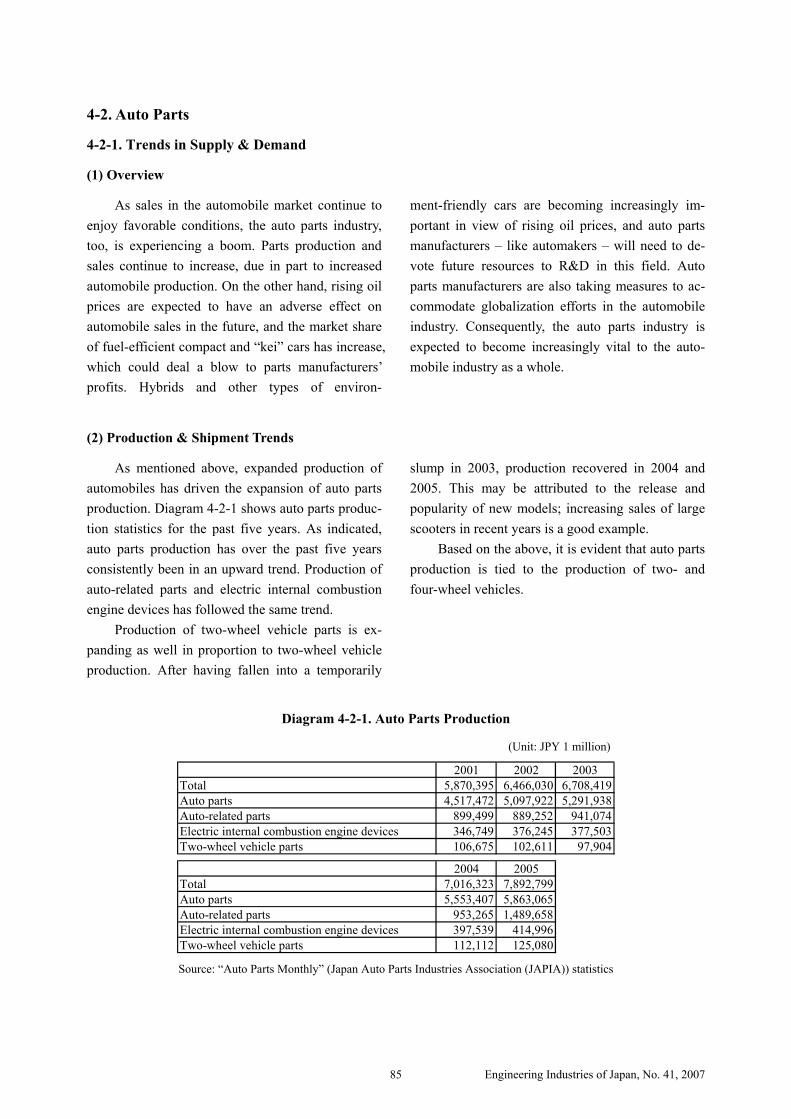
As mentioned above, expanded production of automobiles has driven the expansion of auto parts production. Diagram 4-2-1 shows auto parts produc-tion statistics for the past five years. As indicated, auto parts production has over the past five years consistently been in an upward trend. Production of auto-related parts and electric internal combustion engine devices has followed the same trend.
Production of two-wheel vehicle parts is ex-panding as well in proportion to two-wheel vehicle production. After having fallen into a temporarily
slump in 2003, production recovered in 2004 and 2005. This may be attributed to the release and popularity of new models; increasing sales of large scooters in recent years is a good example.
Based on the above, it is evident that auto parts production is tied to the production of two- and four-wheel vehicles.
Diagram 4-2-1. Auto Parts Production
(Unit: JPY 1 million)
2001 2002 2003Total 5,870,395 6,466,030 6,708,419Auto parts 4,517,472 5,097,922 5,291,938Auto-related parts 899,499 889,252 941,074Electric internal combustion engine devices 346,749 376,245 377,503Two-wheel vehicle parts 106,675 102,611 97,904
2004 2005Total 7,016,323 7,892,799Auto parts 5,553,407 5,863,065Auto-related parts 953,265 1,489,658Electric internal combustion engine devices 397,539 414,996Two-wheel vehicle parts 112,112 125,080 Source: “Auto Parts Monthly” (Japan Auto Parts Industries Association (JAPIA)) statistics
Engineering Industries of Japan, No. 41, 2007 86
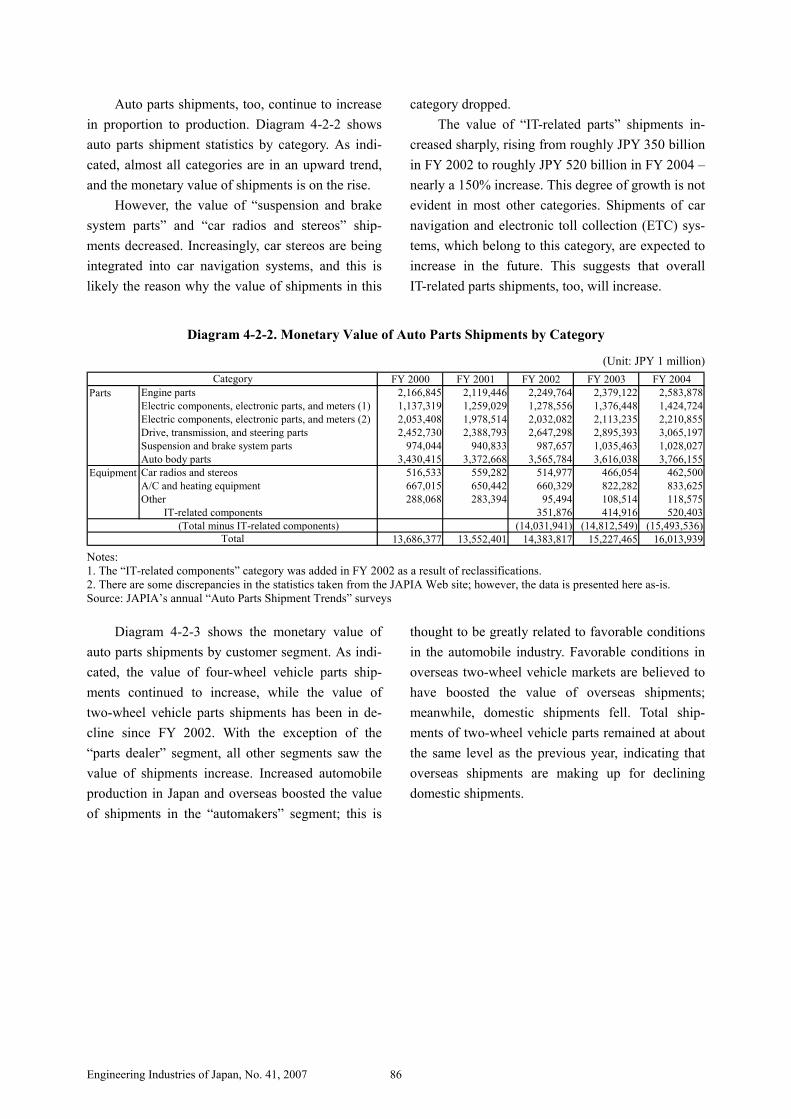
Auto parts shipments, too, continue to increase in proportion to production. Diagram 4-2-2 shows auto parts shipment statistics by category. As indi-cated, almost all categories are in an upward trend, and the monetary value of shipments is on the rise.
However, the value of “suspension and brake system parts” and “car radios and stereos” ship-ments decreased. Increasingly, car stereos are being integrated into car navigation systems, and this is likely the reason why the value of shipments in this
category dropped. The value of “IT-related parts” shipments in-
creased sharply, rising from roughly JPY 350 billion in FY 2002 to roughly JPY 520 billion in FY 2004 – nearly a 150% increase. This degree of growth is not evident in most other categories. Shipments of car navigation and electronic toll collection (ETC) sys-tems, which belong to this category, are expected to increase in the future. This suggests that overall IT-related parts shipments, too, will increase.
Diagram 4-2-2. Monetary Value of Auto Parts Shipments by Category
(Unit: JPY 1 million) FY 2000 FY 2001 FY 2002 FY 2003 FY 2004
Parts Engine parts 2,166,845 2,119,446 2,249,764 2,379,122 2,583,878Electric components, electronic parts, and meters (1) 1,137,319 1,259,029 1,278,556 1,376,448 1,424,724Electric components, electronic parts, and meters (2) 2,053,408 1,978,514 2,032,082 2,113,235 2,210,855Drive, transmission, and steering parts 2,452,730 2,388,793 2,647,298 2,895,393 3,065,197Suspension and brake system parts 974,044 940,833 987,657 1,035,463 1,028,027Auto body parts 3,430,415 3,372,668 3,565,784 3,616,038 3,766,155
Equipment Car radios and stereos 516,533 559,282 514,977 466,054 462,500A/C and heating equipment 667,015 650,442 660,329 822,282 833,625Other 288,068 283,394 95,494 108,514 118,575
IT-related components 351,876 414,916 520,403(Total minus IT-related components) (14,031,941) (14,812,549) (15,493,536)
13,686,377 13,552,401 14,383,817 15,227,465 16,013,939Total
Category
Notes: 1. The “IT-related components” category was added in FY 2002 as a result of reclassifications. 2. There are some discrepancies in the statistics taken from the JAPIA Web site; however, the data is presented here as-is. Source: JAPIA’s annual “Auto Parts Shipment Trends” surveys
Diagram 4-2-3 shows the monetary value of auto parts shipments by customer segment. As indi-cated, the value of four-wheel vehicle parts ship-ments continued to increase, while the value of two-wheel vehicle parts shipments has been in de-cline since FY 2002. With the exception of the “parts dealer” segment, all other segments saw the value of shipments increase. Increased automobile production in Japan and overseas boosted the value of shipments in the “automakers” segment; this is
thought to be greatly related to favorable conditions in the automobile industry. Favorable conditions in overseas two-wheel vehicle markets are believed to have boosted the value of overseas shipments; meanwhile, domestic shipments fell. Total ship-ments of two-wheel vehicle parts remained at about the same level as the previous year, indicating that overseas shipments are making up for declining domestic shipments.

Engineering Industries of Japan, No. 41, 2007 87
Diagram 4-2- 1. Monetary Value of Auto Parts Shipments by Customer Segment
(Unit: JPY 1 million)
FY 2000 FY 2001 FY 2002 FY 2003 FY 2004Domestic 9,184,362 8,943,700 9,298,092 9,654,965 9,904,300Overseas 706,954 677,917 779,570 865,528 951,932Domestic 409,205 371,202 348,871 351,608 364,506Overseas 18,990 17,614 23,057 15,479 21,768
167,057 197,583 224,661 297,048 369,49652,471 56,355 42,528 53,095 36,189
Domestic 1,553,343 1,573,290 1,765,872 2,002,015 2,226,326Overseas 311,051 342,505 440,942 560,303 648,398Domestic 374,954 401,636 3,907,426 383,597 410,366Overseas 466,737 527,271 610,083 608,450 648,953
13,245,124 13,109,073 13,944,102 14,792,088 15,582,234Domestic 363,390 364,114 352,491 348,360 334,003Overseas 53,348 53,074 59,680 62,850 69,391Domestic 13,609 12,500 12,922 11,509 11,984Overseas 10,906 13,640 14,622 13,204 16,327
441,253 443,328 439,715 435,923 431,70513,686,377 13,552,401 14,383,817 15,228,011 16,013,939
Assembly
Repair
Customer Segment
Four
-whe
elTw
o-w
heel
Automakers
Subtotal
SubtotalTotal
Auto body makersParts dealers
Parts makers
Direct to the commercialmarket
Assembly
Repair
Source: JAPIA’s annual “Auto Parts Shipment Trends” surveys
(3) Import & Export Trends
As Diagram 4-2-4 shows, exports of auto parts continued an upward trend. The monetary values of exports to Asia, North America, and Europe were highest due to aggressive efforts by Japanese auto-makers to shift production to overseas plants. The value of exports to newly emerging markets, which have been drawing attention in recent years, rose roughly 40% over the previous year to nearly JPY 140 billion, and exports to Central and South Amer-ica remained about the same at roughly JPY 148
billion. Japanese automaker’s advances into newly emerging markets is likely the reason behind in-creased exports to these nations. However, it is likely that shifting of automobile manufacturing operations to newly emerging nations will lead to auto parts manufacturers’ following the example of automakers and shifting production to developing nations. It may be difficult to increase the value of exports on a sustained basis.
Diagram 4-2-4. Monetary Value of Japanese Auto Parts Exports by Region
(Unit: JPY 1 million)2001 2002 2003 2004 2005
Asia 948,627 1,124,631 1,352,922 1,530,225 1,608,008Mideast 127,526 152,030 152,611 164,693 179,700Europe 748,294 823,450 857,151 916,667 972,321
North America 1,722,489 1,863,050 1,816,492 1,898,425 1,973,889Central America 107,483 100,345 88,383 97,467 140,836South America 102,639 96,667 94,786 122,129 147,507
Africa 93,508 94,036 108,212 133,505 129,678Oceania 110,267 112,098 113,403 104,554 104,025
Total 3,960,832 4,366,308 4,583,960 4,967,664 5,255,964
Source: Japan Automobile Manufacturers Association (JAMA) Web site statistics
Diagram 4-2-5 shows auto parts import statis- tics for the past five years. As indicated, imports

Engineering Industries of Japan, No. 41, 2007 88
also continued an upward trend. While the value of imports from North America reached a peak in 2002 and entered a downward trend thereafter, the total value in 2005 remained at virtually the same level as the previous year. The value of Asian imports con-tinues to increase year-on-year, reaching JPY 680 billion in 2005. Asian imports accounted for 60% of the total value of all imports in 2005; additionally,
their value was 480% higher than the value of North American imports. The value of European imports, too, is one the rise, due in part to the shift of Japa-nese auto parts manufacturing operations to over-seas plants. This trend is expected to continue in the future, with the value of imports from Asia remain-ing the largest.
Diagram 4-2-5. Monetary Value of Japanese Auto Parts Imports by Region
(Unit: JPY 1 million)2001 2002 2003 2004 2005
Asia 346,895 413,374 456,755 545,451 680,081Mideast 225 97 196 175 142Europe 126,432 159,029 215,789 275,552 288,117
North America 208,776 264,748 213,812 141,446 141,728Central America 4,205 8,141 14,341 16,608 19,360South America 1,293 1,838 1,509 1,719 1,830
Africa 1,989 2,336 2,006 2,112 1,855Oceania 9,955 10,935 8,144 6,331 4,843
Total 699,770 860,498 912,550 989,395 1,137,956 Source: Japan Automobile Manufacturers Association (JAMA) Web site statistics
4-2-2. Business Trends
According to statistics released by the Japan Auto Parts Industries Association (JAPIA), auto parts industry sales and profits have been on the rise since FY 2003. This is due primarily to increased automobile production. Industry watchers also at-tribute this trend to the successful efforts of parts manufacturers’ to cut costs in spite of soaring crude oil and steel prices.
Diagram 4-2-6 shows auto parts manufacturers’ financial results that were calculated by JAPIA. As indicated, manufacturer performance continued an upward trend due in part to Japanese economic re-covery and favorable conditions in overseas markets. The overall ratio of operating profit to sales and the overall ratio of pre-tax profit to sales both exceeded 6%.
Diagram 4-2-6. Auto Parts Industry Financial Results
(Unit: JPY 100 million)FY 2002 FY 2003 FY 2004
Sales 132,301 145,125 163,634Operating profit 7,901 8,755 10,059Ratio of operating profit to sales 5.97% 6.03% 6.15%Pre-tax profit 7,836 9,137 10,758Ratio of pre-tax profit to sales 5.92% 6.30% 6.57%
Note: Statistics are based on the financial results of 84 companies that are members of JAPIA and listed on the Tokyo Stock Exchange. Auto parts production accounts for at least 50% of their total output. Source: “FY 2005 Auto Parts Industry Business Trends” (JAPIA; June 2006; p. 9)
Diagram 4-2-7 compares FY 2003 and ’04 sales results of auto parts industry companies. As

Engineering Industries of Japan, No. 41, 2007 89
indicated, the number of companies in FY 2004 that reported sales growth rates of over 15% was the highest, and more than 60% of all companies re-ported sales growth rates of at least 10%. In contrast, the largest number of companies in 2003 reported sales growth rates of up to 10%. These results show
that sales growth rates rose sharply over the previ-ous year.
Diagram 4-2-8 compares FY 2003 and ’04 op-erating profit results of auto parts industry compa-nies. As indicated, the largest numbers are concen-trated in the high percentage range.
0
32
13
65
28
15
01
20
2
53
19
2527
22
0
5
10
15
20
25
30
-15%
or l
ess
~-1
5%
~-1
0%
~-5
%
~-3
%
~3%
~5%
~10
%
~15
%
15%
or m
ore
(Com
pani
es)
FY 2003 (N=85) FY 2004 (N=84)
Source: “FY 2004 Auto Parts Industry Business Trends” (JAPIA; May 2005) and “FY 2005 Auto Parts Industry Business Trends” (JAPIA; June 2006)
Diagram 4-2-7. Comparison of Auto Parts Industry Sales Growth Rates in FY 2003 & FY 2004
0
5
10
15
20
25
Oth
er
-50%
or l
ess
~-5
0%
~-4
0%
~-3
0%
~-2
0%
~-1
0%
~-3
%
~3%
~10
%
~20
%
~30
%
~40
%
~50
%
50%
or m
ore
Oth
er
(Com
pani
es)
FY 2003 (N=85) FY 2004 (N=84) Source: “FY 2004 Auto Parts Industry Business Trends” (JAPIA; May 2005) and “FY 2005 Auto Parts Industry Business
Trends” (JAPIA; June 2006)
Diagram 4-2-8. Comparison of Auto Parts Industry Operating Profit Growth Rates in FY 2003 & FY 2004

Engineering Industries of Japan, No. 41, 2007 90
4-2-3. Overseas Production Trends According to a survey on overseas business
conducted in 2004 by JAPIA, the scale of overseas auto parts business expanded further. The country with the largest number of Japanese-owned auto parts plants was China (294 plants).
Diagram 4-2-9 shows local procurement ratios by region. While each region showing local pro-curement ratios of around 60-70%, all the compa-nies involved indicate that they will continue to rise the ratios in the future. This trend is attributed to aggressive efforts on the part of Japanese auto parts makers with overseas plants to procure materials locally. At the same time, it is still quite difficult to
find reliable suppliers that are able to offer state-of-the-art products. It is possible to conclude, however, that improving procurement ratios indicate that the efforts of auto parts makers are achieving some degree of success. However, the fact that China’s local procurement ratio continues to drop each year deserves attention. The Chinese auto market is booming, and luxury automobiles almost equivalent to those available in Japan are released into global markets including China simultaneously. This is considered to be the reason behind China’s dwindling local procurement ratio.
Notes: 1. Local procurement ratio=(sales-total cost of overseas procurement)/sales 2. Imports within EU, NAFTA, and ASEAN are not considered to be “imports.” 3. Number of companies surveyed in 2001: North America (125 companies), Europe (47), Asia (174), ASEAN (90), and China (44). 4. Number of companies surveyed in 2002: North America (134), Europe (55), Asia (203), ASEAN (106), and China (58). 5. Number of companies surveyed in 2003: North America (134), Europe (60), Asia (249), ASEAN (128), and China (76). 6. Number of companies surveyed in 2004: North America (140), Europe (57), Asia (230), ASEAN (108), and China (81). Source: JAPIA’s “General Survey of Overseas Operations” published in 2003, ’04, and ’05.
Diagram 4-2-9. Local Procurement Ratios by Region
In 2004, Japanese manufacturers (the largest segment) accounted for 58.5% of all auto parts or-ders; this trend has not changed, although a slight change was observed among parts makers operating
in China. Diagram 4-2-10 shows ratios of Japanese auto
parts buyers by region. In China, 35% of parts pro-duced locally by Japanese parts manufacturers were
68.871.8
62.465.7
56.2
79.4
70.0
62.6 64.1
53.3
65.3 65.2 65.2 64.7
51.0
62.7
70.1
57.060.2
47.1
0
10
20
30
40
50
60
70
80
90
北米 欧州 アジア うちアセアン うち中国
(%)
01年 02年 03年 04年
North America Europe Asia (Total) ASEAN China
’01 ’02 ’03 ’04

Engineering Industries of Japan, No. 41, 2007 91
sold to Japanese automakers; this ratio has changed little since 2003. In the past, the majority of auto parts made by Japanese-owned plants overseas were sold in local markets. However, a relatively large percentage of auto parts manufactured in China by Japanese manufacturers are exported. It is likely that auto parts makers in China are recognized by auto-makers as key players in global procurement.
According to JAPIA1, however, the ratio of parts manufactured in China that are exported de-creased steadily from 2001 (59.9%) to ’02 (56.1%) to ’03 (36.1%). Although the ratio rose again in 2004 to 46%, it has yet to return to the level re-corded in 2001. As a result, industry watchers have indicated a need to reevaluate the capabilities of Japanese-owned auto parts plants in China.
Diagram 4-2-10. Ratios of Japanese Auto Parts Buyers by Region
2003 2004 2003 2004North America 65% 74% 17% 15%Europe 32% 35% 35% 33%Asia (Total) 41% 43% 17% 13% ASEAN 47% 49% 3% 2% China 34% 35% 22% 12%Other 36% 47% 18% 14%
2003 2004 2003 2004North America 13% 7% 5% 4%Europe 17% 14% 16% 18%Asia (Total) 9% 11% 32% 32% ASEAN 9% 13% 40% 36% China 8% 8% 36% 46%Other 19% 12% 27% 27%
Japanese-ownedAutomobile Plants Other Automakers
For Repairs For Export
Source: JAPIA’s “General Survey of Overseas Operations” (November 2005; p. 8) 4-2-4. The Future
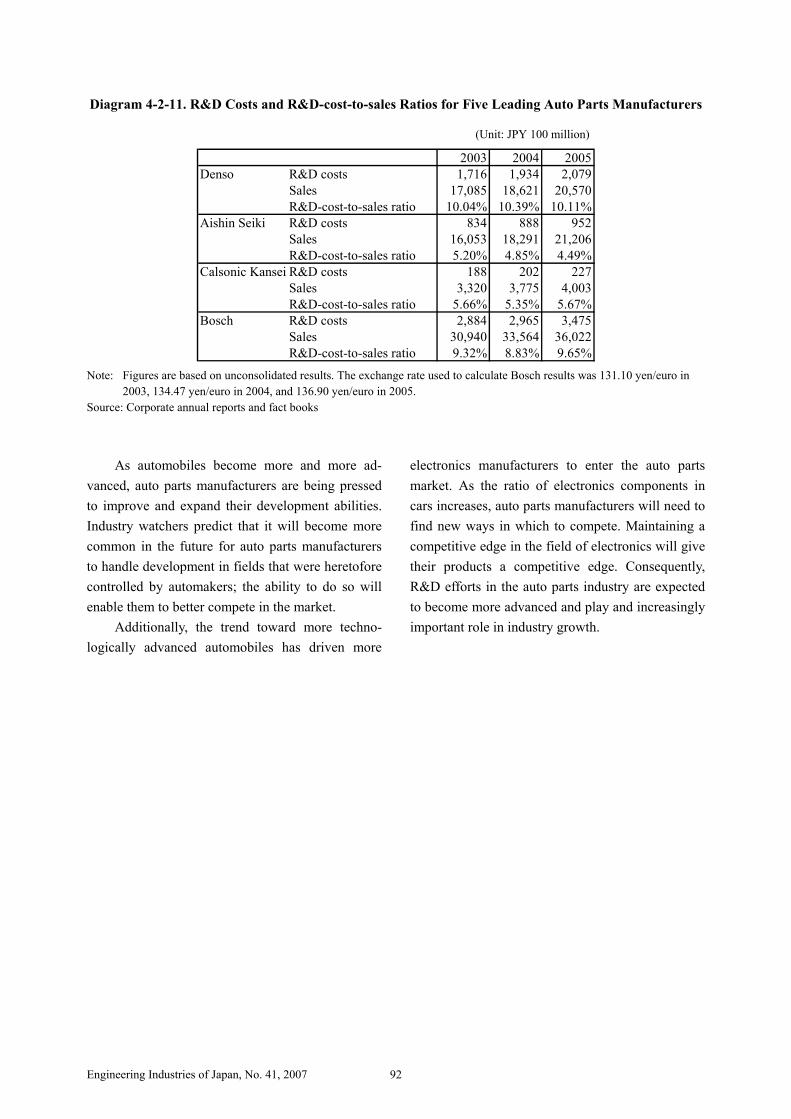
Automobiles are becoming increasingly ad-vanced in order to meet environmental, safety, and information technology needs, placing greater de-mands on auto parts manufacturers. In many fields, operations that were once performed by automakers are now handled by parts manufacturers. Conse-quently, the importance of product development and research in the auto parts industry has never been higher.
Diagram 4-2-11 shows R&D costs for the top four companies in the auto parts industry. As indi-
cated, R&D costs at each company have increased year-on-year. The R&D-cost-to-sales ratio at Aisin Seiki Company and Calsonic Kansei Corporation was about 5%, while Denso’s ratio was roughly 10%. Denso’s R&D costs illustrate its priority in that field. The amount that Denso spends on R&D is larger than the amount spent by German auto parts manufacturer Bosch. Bosch, too, has a high R&D-cost-to-sales ratio, and its technological prowess is given high marks by the world’s auto-makers.
1 JAPIA’s “General Survey of Overseas Operations” (November 2004; p. 2)
Engineering Industries of Japan, No. 41, 2007 92
Diagram 4-2-11. R&D Costs and R&D-cost-to-sales Ratios for Five Leading Auto Parts Manufacturers
(Unit: JPY 100 million)
2003 2004 2005Denso R&D costs 1,716 1,934 2,079
Sales 17,085 18,621 20,570R&D-cost-to-sales ratio 10.04% 10.39% 10.11%
Aishin Seiki R&D costs 834 888 952Sales 16,053 18,291 21,206R&D-cost-to-sales ratio 5.20% 4.85% 4.49%
Calsonic Kansei R&D costs 188 202 227Sales 3,320 3,775 4,003R&D-cost-to-sales ratio 5.66% 5.35% 5.67%
Bosch R&D costs 2,884 2,965 3,475Sales 30,940 33,564 36,022R&D-cost-to-sales ratio 9.32% 8.83% 9.65%
Note: Figures are based on unconsolidated results. The exchange rate used to calculate Bosch results was 131.10 yen/euro in 2003, 134.47 yen/euro in 2004, and 136.90 yen/euro in 2005.
Source: Corporate annual reports and fact books
As automobiles become more and more ad-vanced, auto parts manufacturers are being pressed to improve and expand their development abilities. Industry watchers predict that it will become more common in the future for auto parts manufacturers to handle development in fields that were heretofore controlled by automakers; the ability to do so will enable them to better compete in the market.
Additionally, the trend toward more techno-logically advanced automobiles has driven more
electronics manufacturers to enter the auto parts market. As the ratio of electronics components in cars increases, auto parts manufacturers will need to find new ways in which to compete. Maintaining a competitive edge in the field of electronics will give their products a competitive edge. Consequently, R&D efforts in the auto parts industry are expected to become more advanced and play and increasingly important role in industry growth.
Engineering Industries of Japan, No. 41, 2007 93
4-3. Aircraft
4-3-1. Trends in Supply & Demand
(1) Overview
In spite of the fact that terrorism has yet to be eradicated, remarkable economic growth – primarily in Asia – has revitalized aircraft demand. Many air-craft manufacturers have plans to release new mod-els based on estimates that new demand1 for pas-senger aircraft over the next 20 years, starting in 2004, will amount to roughly 25,000 units.
Mitsubishi Heavy Industries, Kawasaki Heavy Industries, and Fuji Heavy Industries are all partici-pating in the development of Boeing’s 787 next-generation passenger jet – a project that has offered various business opportunities to Japanese manufacturers of aircraft parts, including materials and components.
(2) Production Trends
Diagram 4-3-1 shows aircraft industry produc-tion (sales) results2 for the past 24 years. In FY 2005, the total monetary value of production fell 2.4% below the previous year to JPY 949.1 billion. Pro-duction of airframes dropped 8.0% below the pre-
vious year to JPY 554.4 billion, while engine pro-duction rose 7.2% over the previous year to JPY 270.2 billion, and equipment/parts production rose 1.6% to JPY 123.2 billion.
(3) Import & Export Trends
The total monetary value of aircraft engines, airframes, and parts rose 25.5% over the previous
year to JPY 288.3 billion, and the value of imports rose 16.8% to JPY 880.3 billion (Diagram 4-3-2).
(4) Future Outlook
According to a survey conducted by the Soci-ety of Japanese Aerospace Companies on 28 of its corporate members, the total monetary value of air-craft industry production in FY 2006 is predicted to rise 9.8% (JPY 96.9 billion) over the previous year to JPY 1.841 trillion.
While decreasing demand for airframes in the military sector has had an adverse effect on the in-dustry, significant growth in aircraft parts exports is expected to result in an 11.8% (JPY 67.5 billion) increase over the previous year. The total estimated value of 2006 airframe production is JPY 642.7 bil-lion.
Aircraft engine production is expected to fol-low the same trend, rising 6.7% (JPY 18.7 billion)
over the previous year to JPY 298.7 billion. This, too, is attributed to increasing aircraft parts exports. Exports of aircraft equipment/parts are expected to increase in FY 2006, rising 8.1% (JPY 10.7 billion) over the previous year to JPY 142.7 billion.
The total monetary value of FY 2006 exports is expected to rise 21.0% (JPY 76.9 billion) to JPY 442.1 billion. Exports of airframes are expect to rise 27.6% (JPY 47.5 billion) over the previous year to JPY 219.8 billion, engine exports are expected to rise 13.0% (JPY 22.5 billion) to JPY 195 billion, and equipment/parts exports are expected to in-crease by JPY 6.8 billion to JPY 27.2 billion.
These favorable predictions are attributed to increased demand at Boeing and Airbus.
1 Based on Boeing’s “2005 Current Market Outlook,” a report that predicts new demand for commercial aircraft between 2005
and ’24 will amount to 25,700 units. 2 Data compiled by the Society of Japanese Aerospace Companies based on production figures (value of both aircraft industry
production and repairs) shown in METI’s “Annual Report on Machinery Statistics”.

Engineering Industries of Japan, No. 41, 2007 94
4-3-2. Business Conditions & Industry Trends
(1) Business Conditions
- Mitsubishi Heavy Industries Due to recovering passenger aircraft demand
and an increase in orders from Boeing for its 787 (main wings) and 777 (aft fuselage) airliners, sales in Mitsubishi Heavy Industries’ aerospace division rose 9.3% over the previous year to JPY 445.9 bil-lion. In April 2006, the company plans to finish construction of a new plant at its shipyard in Shi-monoseki (Yamaguchi Prefecture). The plant will
manufacture skin stringers for use in Boeing 787 composite-material wing boxes. Mitsubishi also plans to finish construction of a new plant in Na-goya. Although the Nagoya plant will be equipped to manufacture seven models of aircraft, the com-pany plans to expand the plant’s capacity to 10 models through streamlining efforts.
2,686 2,808
3,6433,977
3,4733,809
4,065 4,1914,543
4,9165,133 5,171
4,969 4,916
5,391
5,8316,097
5,888
6,694
6,221 6,241
5,251
5,990
5,544
854 884 1,0151,192 1,210 1,210 1,272
1,490 1,555 1,694 1,754 1,834 1,7701,506
1,7282,029
2,322 2,406 2,2512,538 2,438 2,473 2,512
2,707
1,556 1,582 1,6871,909 2,068 1,956
1,656 1,630 1,548 1,456 1,460 1,380 1,348 1,212 1,232
4,3074,651
5,740
6,365 6,2396,601
7,024
7,590
8,1658,566 8,666 8,650
8,2657,907
8,692
9,517
10,0499,842
10,40110,21910,059
9,072
9,491
1,5741,4841,5231,6451,799
1,195
959767 1,081
9,715
0
2,000
4,000
6,000
8,000
10,000
12,000
1982
1983
1984
1985
1986
1987
1988
1989
1990
1991
1992
1993
1994
1995
1996
1997
1998
1999
2000
2001
2002
2003
2004
2005
億円
Source: The Society of Japanese Aerospace Companies (SJAC)
Diagram 4-3-1. Monetary Value of Aircraft Industry Production
Unit: JPY 100 million
Airframes Engines Equipment & Parts
TOTAL

Engineering Industries of Japan, No. 41, 2007 95
Diagram 4-3-2. Monetary Value of Aircraft Industry Imports & Exports
(Unit: JPY 1 million)
Exports ImportsAircraft engines (piston) 62 506Aircraft engine (piston) parts 2,007 1,552Aircraft engines (turbine, other) 377 130,074Aircraft engine (turbine, other) parts 130,155 216,022
Gliders, hang gliders, hot air balloons, blimps, and engineless aircraft 493 1,059Helicopters (total) 936 16,370
2,000 kg and under (self-weight) 407 2,724Over 2,000 kg (self-weight) 529 13,646
Airplanes and other aircraft (total) 161 364,1462,000 kg and under (self-weight) 11 5072,001 kg – 15,000 kg (self-weight) 150 11,207Over 15,000 kg (self-weight) 352,432
Parts (total) 154,026 140,641Airplane propellers - 714Helicopter rotors (incl. blades) 148,142 2,133Propellers, rotors, and associated parts (excluding helicopter rotors) - 2,329Other airplane and helicopter parts 148,142 110,749Hot air balloon, blimp, and glider parts - -Landing gear and other parts 3,844 19,670Other 1,110 5,046
Parachutes, rotochutes, and associated parts 31 892Aircraft launching gear, desk-arrestor gear, and other similar gear and associated parts - 175Ground flying trainers and associated parts 29 8,870Total 288,277 880,307
Source: The Society of Japanese Aerospace Companies (SJAC)
Diagram 4-3-3. FY 2006 Aircraft Industry Production & Export Estimates
FY 2004 Results FY 2005 Estimates FY 2006 Estimates FY 2004 Results FY 2005 Estimates FY 2006 Estimates
Airframes 227,153 197,184 175,083 Airframes 507 72 108Parts 335,736 378,086 467,666 Parts 125,588 172,221 219,724
Subtotal 562,889 575,270 642,749 Subtotal 126,095 172,293 219,832Airframes 64,788 60,251 65,707 Airframes 11,485 14,392 18,800
Parts 186,109 219,732 232,981 Parts 118,484 158,127 176,221Subtotal 250,897 279,983 298,688 Subtotal 129,969 172,519 195,021
140,862 131,946 142,667 17,229 20,413 27,231954,648 987,199 1,084,104 273,293 365,225 442,084
Value of Exports (Unit: JPY 1 million)Value of Production (Unit: JPY 1 million)
TOTAL
Airframe-related
Engine-related
Equipment/parts TOTAL
Airframe-related
Engine-related
Equipment/parts
Source: “Aircraft Industry Production, Export & Order Estimates (May 2006)” (SJAC)

Engineering Industries of Japan, No. 41, 2007 96
Diagram 4-3-4. Consolidated Financial Results of Five Leading Aircraft Industry Companies
(Units: JPY 100 million, %)
March 2001 March 2002 March 2003 March 2004 March 2005 March 2006 Y/YSales 30,450 28,639 25,938 23,734 25,907 27,921 7.80%Aerospace division sales only 5,222 4,720 5,067 3,922 4,079 4,459 9.30%Operating profit 748 786 1,153 666 147 709 382.30%Pre-tax profit 632 679 781 297 125 503 302.40%Ratio of operating profit to sales 2.50% 2.70% 4.40% 2.80% 0.60% 2.50% -Sales 10,604 11,445 12,395 11,602 12,415 13,224 6.50%Aerospace division sales only 1,361 1,610 1,548 1,737 1,882 2,185 16.10%Operating profit 44 313 305 222 247 417 68.80%Pre-tax profit △ 35 142 162 121 210 308 46.70%Ratio of operating profit to sales 0.40% 2.70% 2.50% 1.90% 2.00% 3.20% -Sales 11,148 10,824 10,190 10,474 10,890 11,271 3.50%Aerospace division sales only 2,339 2,329 2,438 2,414 2,383 2,695 13.10%Operating profit 399 272 246 -232 106 218 105.70%Pre-tax profit 280 187 96 -424 42 159 278.60%Ratio of operating profit to sales 3.60% 2.50% 2.40% -2.20% 1.00% 1.90% -Sales 13,118 13,624 13,723 14,394 14,464 14,764 2.10%Aerospace division sales only 656 663 630 566 595 818 37.50%Operating profit 816 884 675 503 420 593 41.20%Pre-tax profit 715 782 585 566 435 468 7.60%Ratio of operating profit to sales 6.20% 6.50% 4.90% 3.50% 2.90% 4.00% -Sales 1,343 1,422 1,395 1,306 1,279 1,297 1.40%Aerospace division sales only 250 339 385 288 208 207 -0.50%Operating profit 32 28 32 64 60 49 -18.30%Pre-tax profit 23 19 24 59 61 52 -14.80%Ratio of operating profit to sales 2.40% 2.00% 2.30% 4.90% 4.70% 3.80% -
ShinMaywaIndustries
MitsubishiHeavyIndustries
KawasakiHeavyIndustries
Ishikawajima-Harima HeavyIndustries
Fuji HeavyIndustries
Source: Corporate financial reports (March 2006)
- Kawasaki Heavy Industries
Kawasaki Heavy Industries saw its air-craft-related sales rise over the previous year to JPY 218.5 billion. This increase is attributed to increased sales of new fixed-wing patrol aircraft for military use, new transport aircraft development, and Boeing 777 jet parts. The company will build a new factory in its “Works 1” complex in Nagoya, where it will manufacture Boeing 787 forward body sections, main landing gear wheel wells, and fixed trailing edges for the wings. The integrated production line incorporates a range of processes, from composite material processing to assembly. - Ishikawajima-Harima Heavy Industries
Military-sector demand continued a downward trend due to military budget cuts, which have had an effect on Ishikawa-Harima’s sales. However, due to favorable economic conditions around the world,
private-sector demand for passenger aircraft was solid. The company is making solid advances in the development of GEnx engines for use in Boeing and Airbus next-generation, midsize private aircraft. As a result, sales rose over the previous year to JPY 269.5 billion. - Fuji Heavy Industries
Fuji Heavy Industries is manufacturing the Boeing 787 central wing box, which connects the fuselage to the wings. The company has also com-pleted construction of a new facility where it will manufacture composite materials for use in aircraft. FHI hopes this will enable it to boost monthly pro-duction of small business jet wings for U.S.-based Eclipse from 40 units this year to 60 units by fall 2007. The company recorded its highest sales ever this year (JPY 81.8 billion).
Engineering Industries of Japan, No. 41, 2007 97
- ShinMaywa Industries ShinMaywa Industries’ private-sector sales
were favorable due to Boeing orders for wing-to-body fairings for use in its 777 jets. Its plans to start developing new military-sector patrol
and transport aircraft are proceeding according to schedule; however, the company no longer operates in the field of rescue aircraft redesign and develop-ment. Consequently, sales dropped 0.9% below the previous year to JPY 20.6 billion.
(2) Future Prospect & Challenges
Aircraft development projects, which help to boost aircraft industry profits, are a major priority for aircraft industry companies. Industry watchers believe that business opportunities exist for compa-nies in the fields of 1) new aircrafts that offer im-proved safety and fuel efficiency and 2) mainte-nance services.
In the future, expanded airline routes and mod-erate airfares are expected to make the airline busi-ness more attractive from a user perspective. Indus-try watchers expect to see airframes become lighter as a result of efforts to improve fuel efficiency; such efforts will likely involve heavier use of carbon composite materials. Together, Toray and other Japanese manufacturers hold a 70% (approx.) share3 of the global carbon composite material market. Additionally, the typical life of an aircraft is said to be around 20 to 30 years, indicating that business opportunities exist in the after-sales maintenance and upgrade fields.
There is a growing trend among airline compa-nies to procure PMA (Parts Manufacturer Approval) parts that are of the same or better quality – and cheaper – than OEM parts. For Japanese manufac-
turers to break into the PMA market, however, their products must be certified by the U.S. Federal Avia-tion Administration (FAA) as having at least the same specifications as their OEM counterparts. This certification process is only available to U.S. corpo-rations, which means that Japanese companies must first establish corporations in the U.S. before they can be considered eligible. A Society of Japanese Aerospace Companies (SJAC) ad hoc committee has initiated discussing the establishment of an air-craft parts consortium in the U.S. for the purpose of promoting Japanese aircraft parts business there4.
In July 2006, Honda Motor Company is sched-uled to establish in the U.S. a new company called Honda Aircraft Company that plans to start accept-ing orders for mass-production HondaJet aircraft in fall 2006. Over the next three to four years, the company plans to acquire mass-production aircraft certification and launch manufacturing operations in the U.S. It also announced plans to begin fulfilling HondaJet orders sometime in 2010. Industry watch-ers expect Japanese manufacturers to make signifi-cant contributions to the small jet aircraft market in the future.
3 Based on Toray estimates and business information taken from the company’s Web site. 4 SJAC’s “Air & Space” (April 2006 edition)