chapter 4 results 4.1 extraction of plant …studentsrepo.um.edu.my/4227/8/thesis_chapter_4.pdf70...
TRANSCRIPT
70
CHAPTER 4
RESULTS
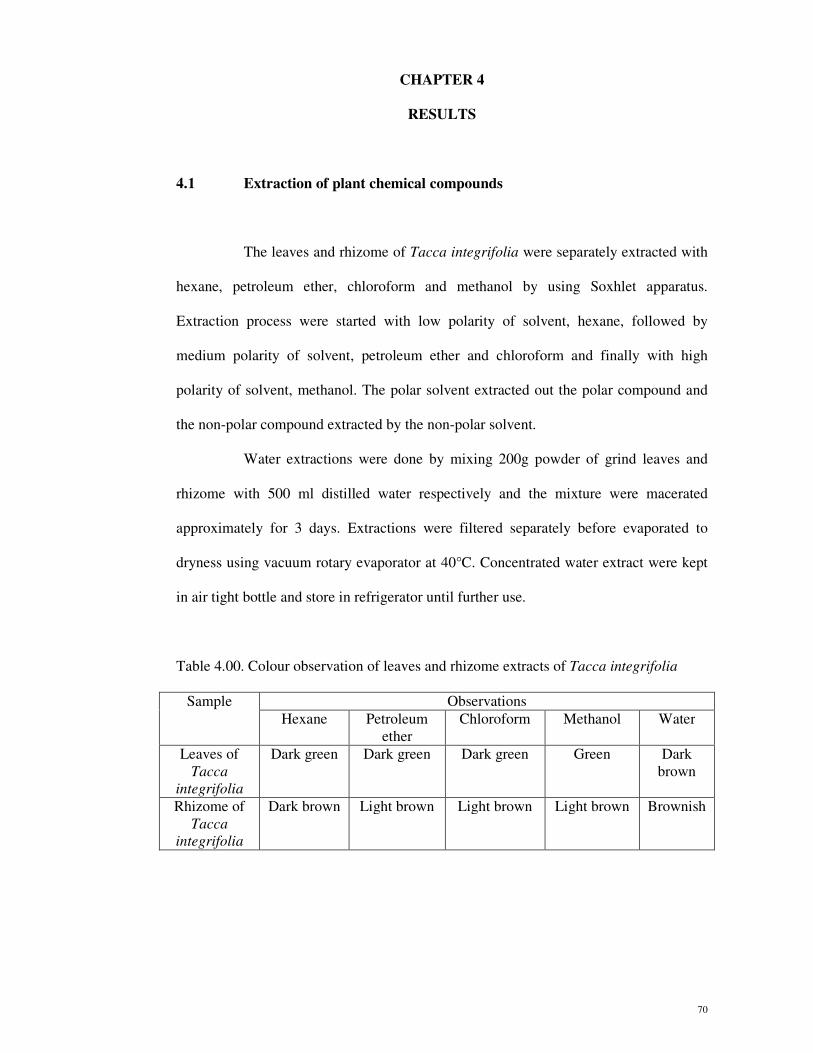
4.1 Extraction of plant chemical compounds
The leaves and rhizome of Tacca integrifolia were separately extracted with
hexane, petroleum ether, chloroform and methanol by using Soxhlet apparatus.
Extraction process were started with low polarity of solvent, hexane, followed by
medium polarity of solvent, petroleum ether and chloroform and finally with high
polarity of solvent, methanol. The polar solvent extracted out the polar compound and
the non-polar compound extracted by the non-polar solvent.
Water extractions were done by mixing 200g powder of grind leaves and
rhizome with 500 ml distilled water respectively and the mixture were macerated
approximately for 3 days. Extractions were filtered separately before evaporated to
dryness using vacuum rotary evaporator at 40°C. Concentrated water extract were kept
in air tight bottle and store in refrigerator until further use.
Table 4.00. Colour observation of leaves and rhizome extracts of Tacca integrifolia
Sample Observations
Hexane Petroleum
ether
Chloroform Methanol Water
Leaves of
Tacca
integrifolia
Dark green Dark green Dark green Green Dark
brown
Rhizome of
Tacca
integrifolia
Dark brown Light brown Light brown Light brown Brownish
71
4.2 Isolation and separation of chemical compounds
4.2.1 Thin Layer Chromatography (TLC)
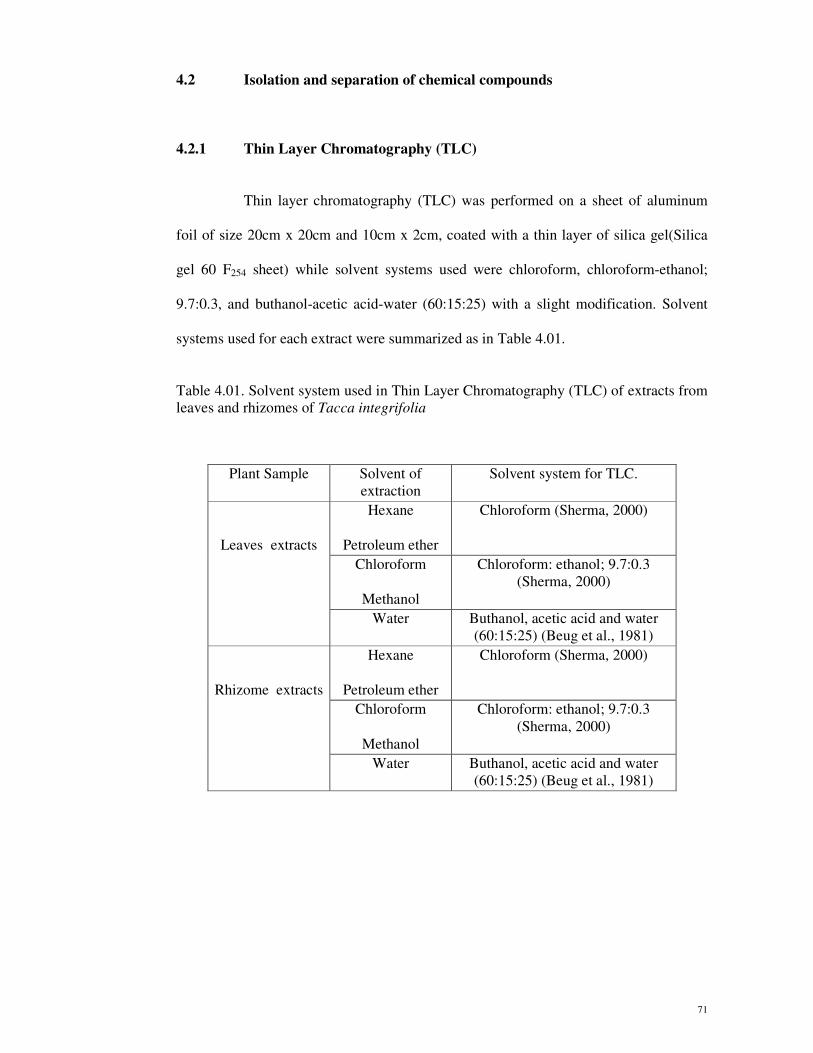
Thin layer chromatography (TLC) was performed on a sheet of aluminum
foil of size 20cm x 20cm and 10cm x 2cm, coated with a thin layer of silica gel(Silica
gel 60 F254 sheet) while solvent systems used were chloroform, chloroform-ethanol;
9.7:0.3, and buthanol-acetic acid-water (60:15:25) with a slight modification. Solvent
systems used for each extract were summarized as in Table 4.01.
Table 4.01. Solvent system used in Thin Layer Chromatography (TLC) of extracts from
leaves and rhizomes of Tacca integrifolia
Plant Sample Solvent of
extraction
Solvent system for TLC.
Leaves extracts
Hexane
Petroleum ether
Chloroform (Sherma, 2000)
Chloroform
Methanol
Chloroform: ethanol; 9.7:0.3
(Sherma, 2000)
Water Buthanol, acetic acid and water
(60:15:25) (Beug et al., 1981)
Rhizome extracts
Hexane
Petroleum ether
Chloroform (Sherma, 2000)
Chloroform
Methanol
Chloroform: ethanol; 9.7:0.3
(Sherma, 2000)
Water Buthanol, acetic acid and water
(60:15:25) (Beug et al., 1981)
72
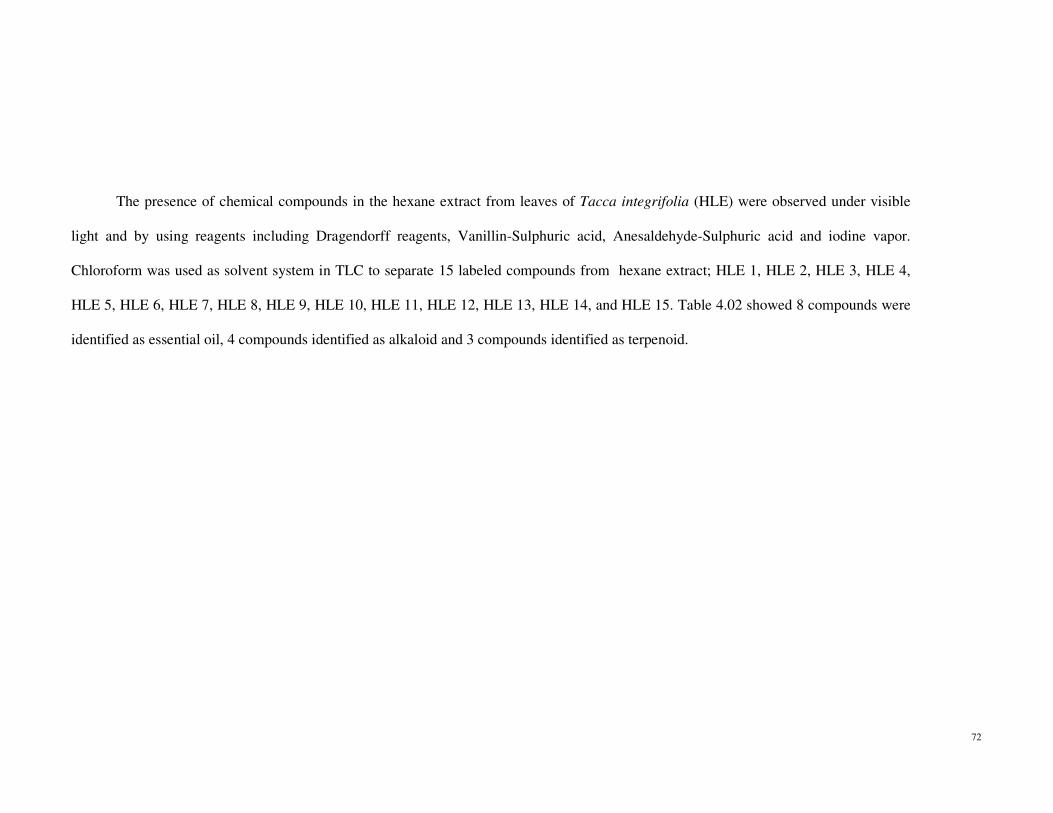
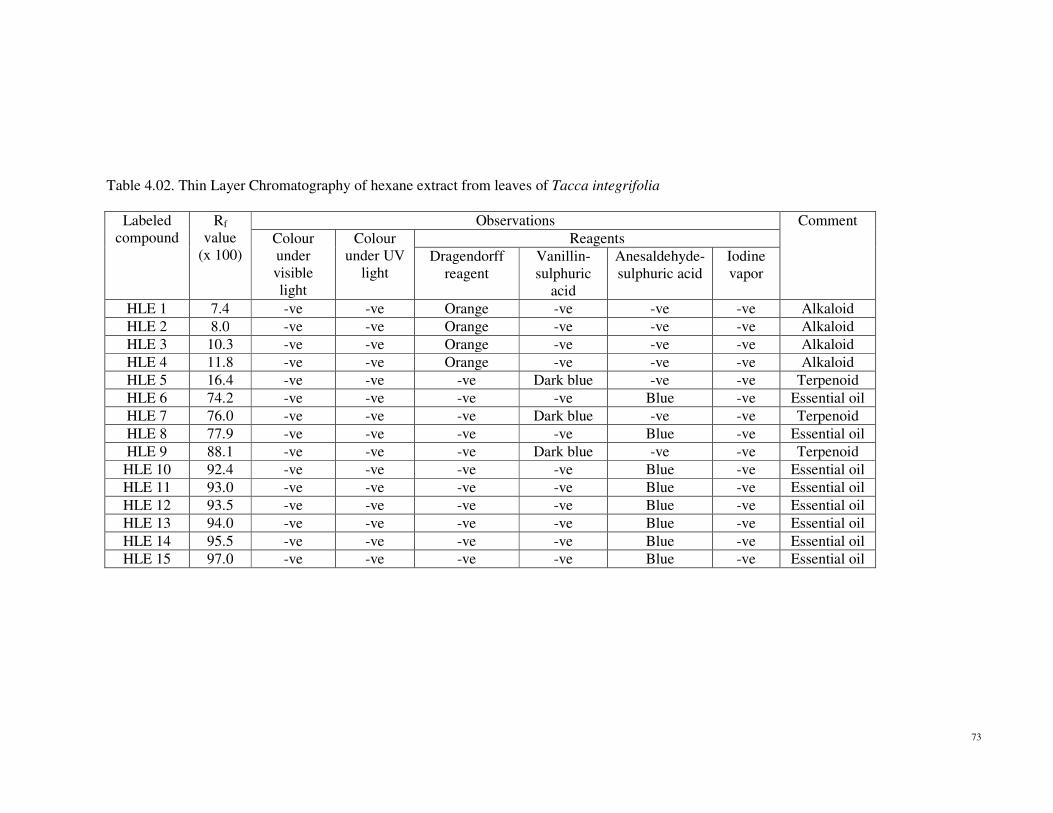
The presence of chemical compounds in the hexane extract from leaves of Tacca integrifolia (HLE) were observed under visible
light and by using reagents including Dragendorff reagents, Vanillin-Sulphuric acid, Anesaldehyde-Sulphuric acid and iodine vapor.
Chloroform was used as solvent system in TLC to separate 15 labeled compounds from hexane extract; HLE 1, HLE 2, HLE 3, HLE 4,
HLE 5, HLE 6, HLE 7, HLE 8, HLE 9, HLE 10, HLE 11, HLE 12, HLE 13, HLE 14, and HLE 15. Table 4.02 showed 8 compounds were
identified as essential oil, 4 compounds identified as alkaloid and 3 compounds identified as terpenoid.
73
Table 4.02. Thin Layer Chromatography of hexane extract from leaves of Tacca integrifolia
Labeled
compound
Rf
value
(x 100)
Observations Comment
Colour
under
visible
light
Colour
under UV
light
Reagents
Dragendorff
reagent
Vanillin-
sulphuric
acid
Anesaldehyde-
sulphuric acid
Iodine
vapor
HLE 1 7.4 -ve -ve Orange -ve -ve -ve Alkaloid
HLE 2 8.0 -ve -ve Orange -ve -ve -ve Alkaloid
HLE 3 10.3 -ve -ve Orange -ve -ve -ve Alkaloid
HLE 4 11.8 -ve -ve Orange -ve -ve -ve Alkaloid
HLE 5 16.4 -ve -ve -ve Dark blue -ve -ve Terpenoid
HLE 6 74.2 -ve -ve -ve -ve Blue -ve Essential oil
HLE 7 76.0 -ve -ve -ve Dark blue -ve -ve Terpenoid
HLE 8 77.9 -ve -ve -ve -ve Blue -ve Essential oil
HLE 9 88.1 -ve -ve -ve Dark blue -ve -ve Terpenoid
HLE 10 92.4 -ve -ve -ve -ve Blue -ve Essential oil
HLE 11 93.0 -ve -ve -ve -ve Blue -ve Essential oil
HLE 12 93.5 -ve -ve -ve -ve Blue -ve Essential oil
HLE 13 94.0 -ve -ve -ve -ve Blue -ve Essential oil
HLE 14 95.5 -ve -ve -ve -ve Blue -ve Essential oil
HLE 15 97.0 -ve -ve -ve -ve Blue -ve Essential oil

74
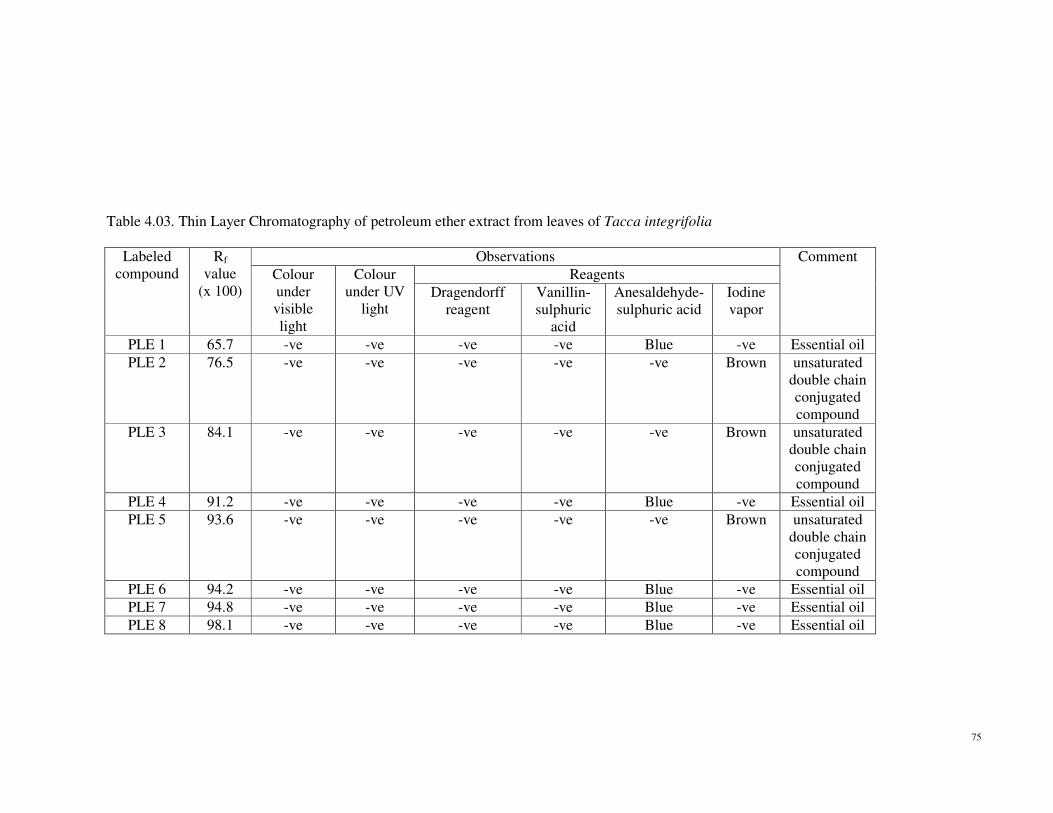
The presence of chemical compounds in the petroleum ether extract from leaves of Tacca integrifolia (PLE) were observed under visible light
and by using reagents including Dragendorff reagents, Vanillin-Sulphuric acid, Anesaldehyde-Sulphuric acid and iodine vapor. Solvent systems used
was chloroform to separate 8 labeled compounds named PLE 1, PLE 2, PLE 3, PLE 4, PLE 5, PLE 6, PLE 7 and PLE 8. Table 4.03 showed 5 labeled
compounds were identified as essential oil and 3 compounds known as unsaturated compound with conjugated double chain.
75
Table 4.03. Thin Layer Chromatography of petroleum ether extract from leaves of Tacca integrifolia
Labeled
compound
Rf
value
(x 100)
Observations Comment
Colour
under
visible
light
Colour
under UV
light
Reagents
Dragendorff
reagent
Vanillin-
sulphuric
acid
Anesaldehyde-
sulphuric acid
Iodine
vapor
PLE 1 65.7 -ve -ve -ve -ve Blue -ve Essential oil
PLE 2 76.5 -ve -ve -ve -ve -ve Brown unsaturated
double chain
conjugated
compound
PLE 3 84.1 -ve -ve -ve -ve -ve Brown unsaturated
double chain
conjugated
compound
PLE 4 91.2 -ve -ve -ve -ve Blue -ve Essential oil
PLE 5 93.6 -ve -ve -ve -ve -ve Brown unsaturated
double chain
conjugated
compound
PLE 6 94.2 -ve -ve -ve -ve Blue -ve Essential oil
PLE 7 94.8 -ve -ve -ve -ve Blue -ve Essential oil
PLE 8 98.1 -ve -ve -ve -ve Blue -ve Essential oil
76
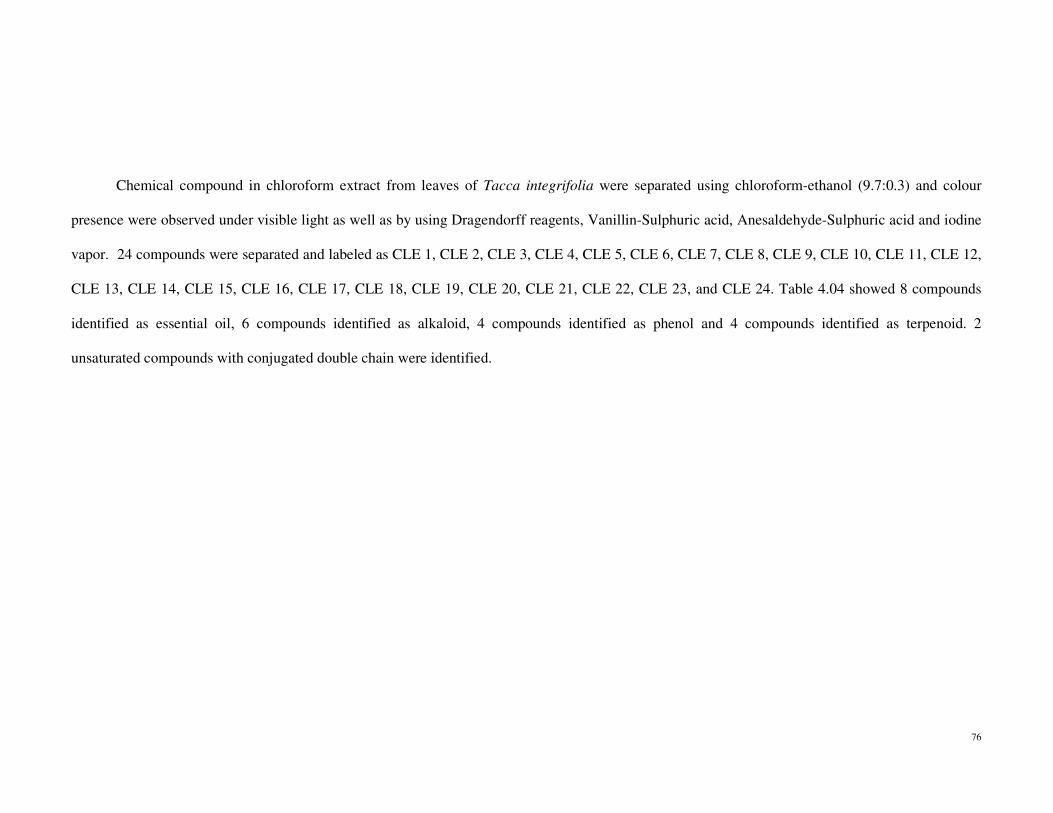
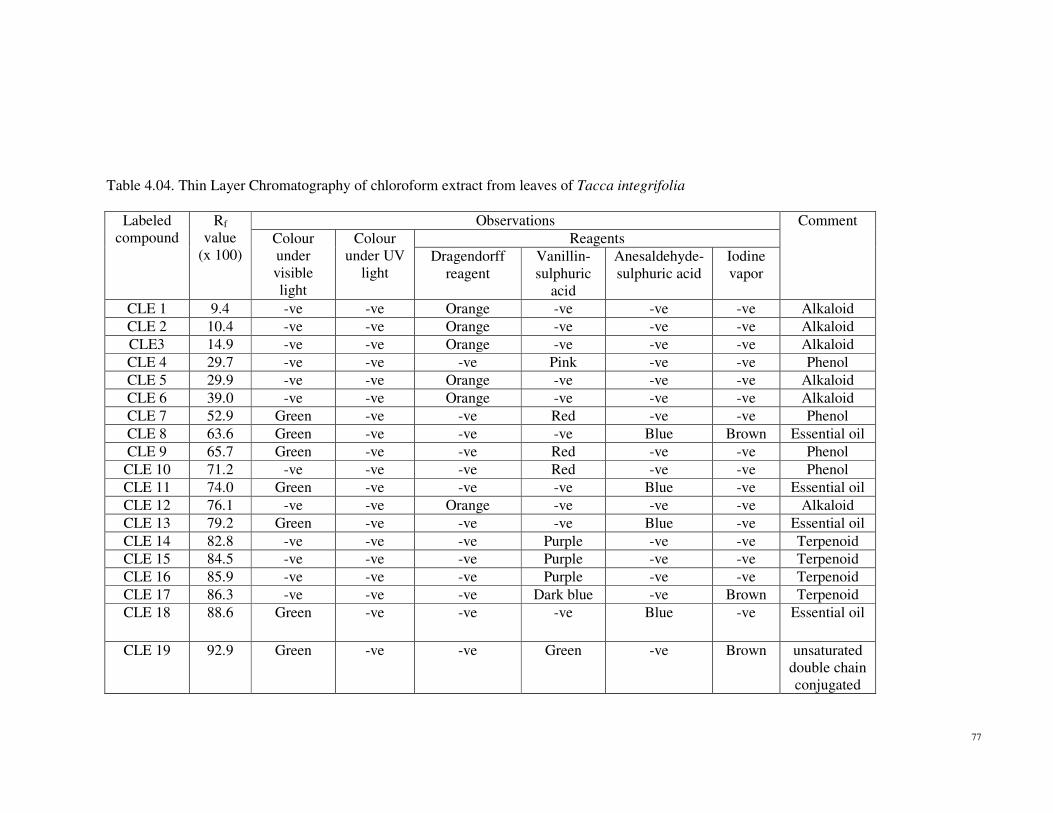
Chemical compound in chloroform extract from leaves of Tacca integrifolia were separated using chloroform-ethanol (9.7:0.3) and colour
presence were observed under visible light as well as by using Dragendorff reagents, Vanillin-Sulphuric acid, Anesaldehyde-Sulphuric acid and iodine
vapor. 24 compounds were separated and labeled as CLE 1, CLE 2, CLE 3, CLE 4, CLE 5, CLE 6, CLE 7, CLE 8, CLE 9, CLE 10, CLE 11, CLE 12,
CLE 13, CLE 14, CLE 15, CLE 16, CLE 17, CLE 18, CLE 19, CLE 20, CLE 21, CLE 22, CLE 23, and CLE 24. Table 4.04 showed 8 compounds
identified as essential oil, 6 compounds identified as alkaloid, 4 compounds identified as phenol and 4 compounds identified as terpenoid. 2
unsaturated compounds with conjugated double chain were identified.
77
Table 4.04. Thin Layer Chromatography of chloroform extract from leaves of Tacca integrifolia
Labeled
compound
Rf
value
(x 100)
Observations Comment
Colour
under
visible
light
Colour
under UV
light
Reagents
Dragendorff
reagent
Vanillin-
sulphuric
acid
Anesaldehyde-
sulphuric acid
Iodine
vapor
CLE 1 9.4 -ve -ve Orange -ve -ve -ve Alkaloid
CLE 2 10.4 -ve -ve Orange -ve -ve -ve Alkaloid
CLE3 14.9 -ve -ve Orange -ve -ve -ve Alkaloid
CLE 4 29.7 -ve -ve -ve Pink -ve -ve Phenol
CLE 5 29.9 -ve -ve Orange -ve -ve -ve Alkaloid
CLE 6 39.0 -ve -ve Orange -ve -ve -ve Alkaloid
CLE 7 52.9 Green -ve -ve Red -ve -ve Phenol
CLE 8 63.6 Green -ve -ve -ve Blue Brown Essential oil
CLE 9 65.7 Green -ve -ve Red -ve -ve Phenol
CLE 10 71.2 -ve -ve -ve Red -ve -ve Phenol
CLE 11 74.0 Green -ve -ve -ve Blue -ve Essential oil
CLE 12 76.1 -ve -ve Orange -ve -ve -ve Alkaloid
CLE 13 79.2 Green -ve -ve -ve Blue -ve Essential oil
CLE 14 82.8 -ve -ve -ve Purple -ve -ve Terpenoid
CLE 15 84.5 -ve -ve -ve Purple -ve -ve Terpenoid
CLE 16 85.9 -ve -ve -ve Purple -ve -ve Terpenoid
CLE 17 86.3 -ve -ve -ve Dark blue -ve Brown Terpenoid
CLE 18 88.6 Green -ve -ve -ve Blue -ve Essential oil
CLE 19 92.9 Green -ve -ve Green -ve Brown unsaturated
double chain
conjugated
78
compound
CLE 20 94.0 -ve -ve -ve -ve -ve Brown unsaturated
double chain
conjugated
compound
CLE 21 95.5 -ve -ve -ve -ve Dark blue Brown Essential oil
CLE 22 96.3 -ve -ve -ve -ve Dark blue -ve Essential oil
CLE 23 97.0 -ve -ve -ve -ve Dark blue Brown Essential oil
CLE 24 97.4 -ve -ve -ve -ve Blue -ve Essential oil
79
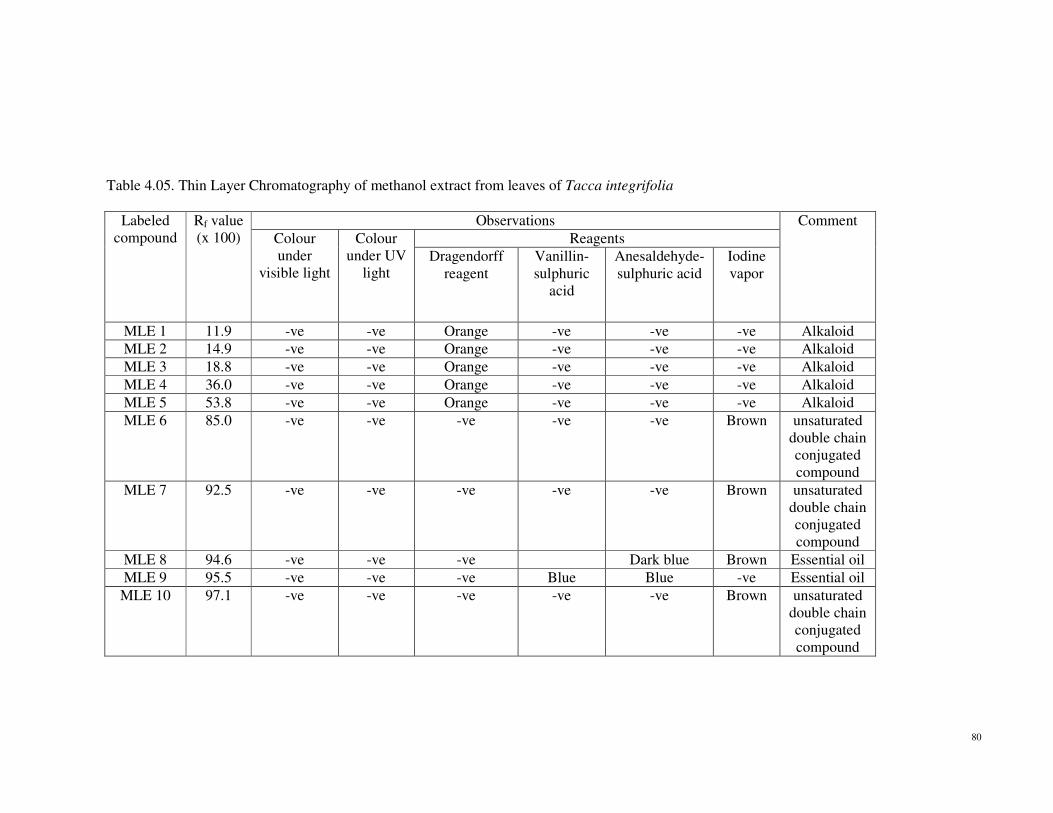
The presence of chemical compounds in the methanol extract from leaves of Tacca integrifolia (MLE) were separated using chloroform-
ethanol (9.7:0.3) and colour presence were observed under visible light and by using Dragendorff reagents, Vanillin-Sulphuric acid, Anesaldehyde-
Sulphuric acid and iodine vapor. 10 compounds were separated and labeled as MLE 1, MLE 2, MLE 3, MLE 4, MLE 5, MLE 6, MLE 7, MLE 8, MLE
9, and MLE 10. Table 4.05 showed 5 compounds were identified as alkaloid, 2 compounds as essential oil, while 3 compounds known as unsaturated
compound with conjugated double chain.
80
Table 4.05. Thin Layer Chromatography of methanol extract from leaves of Tacca integrifolia
Labeled
compound
Rf value
(x 100)
Observations Comment
Colour
under
visible light
Colour
under UV
light
Reagents
Dragendorff
reagent
Vanillin-
sulphuric
acid
Anesaldehyde-
sulphuric acid
Iodine
vapor
MLE 1 11.9 -ve -ve Orange -ve -ve -ve Alkaloid
MLE 2 14.9 -ve -ve Orange -ve -ve -ve Alkaloid
MLE 3 18.8 -ve -ve Orange -ve -ve -ve Alkaloid
MLE 4 36.0 -ve -ve Orange -ve -ve -ve Alkaloid
MLE 5 53.8 -ve -ve Orange -ve -ve -ve Alkaloid
MLE 6 85.0 -ve -ve -ve -ve -ve Brown unsaturated
double chain
conjugated
compound
MLE 7 92.5 -ve -ve -ve -ve -ve Brown unsaturated
double chain
conjugated
compound
MLE 8 94.6 -ve -ve -ve Dark blue Brown Essential oil
MLE 9 95.5 -ve -ve -ve Blue Blue -ve Essential oil
MLE 10 97.1 -ve -ve -ve -ve -ve Brown unsaturated
double chain
conjugated
compound
81
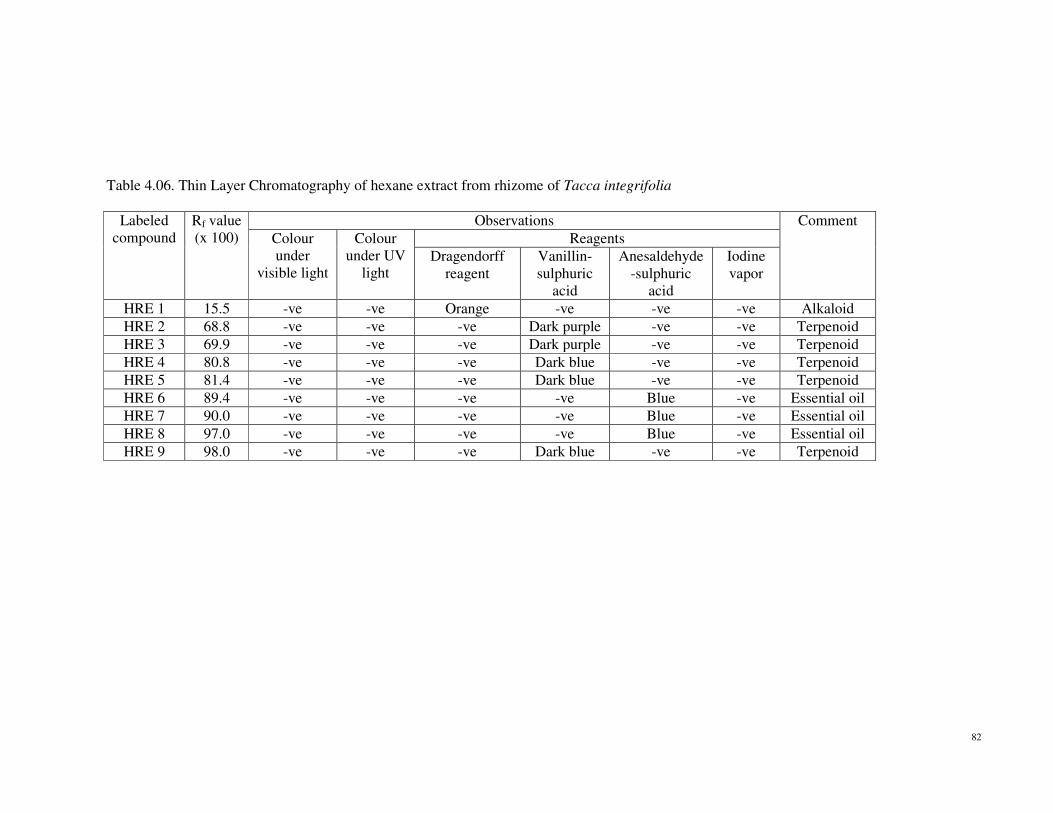
TLC of hexane rhizome extract was done using chloroform as solvent system and the presence of chemical compounds were observed under
visible light and by using Dragendorff reagents, Vanillin-Sulphuric acid, Anesaldehyde-Sulphuric acid and iodine vapor. Separation of 9 labeled
compounds were labeled as HRE 1, HRE 2, HRE 3, HRE 4, HRE 5, HRE 6, HRE 7, HRE 8 and HRE 9. Table 4.06 showed 5 compounds were
identified as terpenoid, 3 compounds identified as essential oil and 1 compound was identified as alkaloid.
82
Table 4.06. Thin Layer Chromatography of hexane extract from rhizome of Tacca integrifolia
Labeled
compound
Rf value
(x 100)
Observations Comment
Colour
under
visible light
Colour
under UV
light
Reagents
Dragendorff
reagent
Vanillin-
sulphuric
acid
Anesaldehyde
-sulphuric
acid
Iodine
vapor
HRE 1 15.5 -ve -ve Orange -ve -ve -ve Alkaloid
HRE 2 68.8 -ve -ve -ve Dark purple -ve -ve Terpenoid
HRE 3 69.9 -ve -ve -ve Dark purple -ve -ve Terpenoid
HRE 4 80.8 -ve -ve -ve Dark blue -ve -ve Terpenoid
HRE 5 81.4 -ve -ve -ve Dark blue -ve -ve Terpenoid
HRE 6 89.4 -ve -ve -ve -ve Blue -ve Essential oil
HRE 7 90.0 -ve -ve -ve -ve Blue -ve Essential oil
HRE 8 97.0 -ve -ve -ve -ve Blue -ve Essential oil
HRE 9 98.0 -ve -ve -ve Dark blue -ve -ve Terpenoid
83
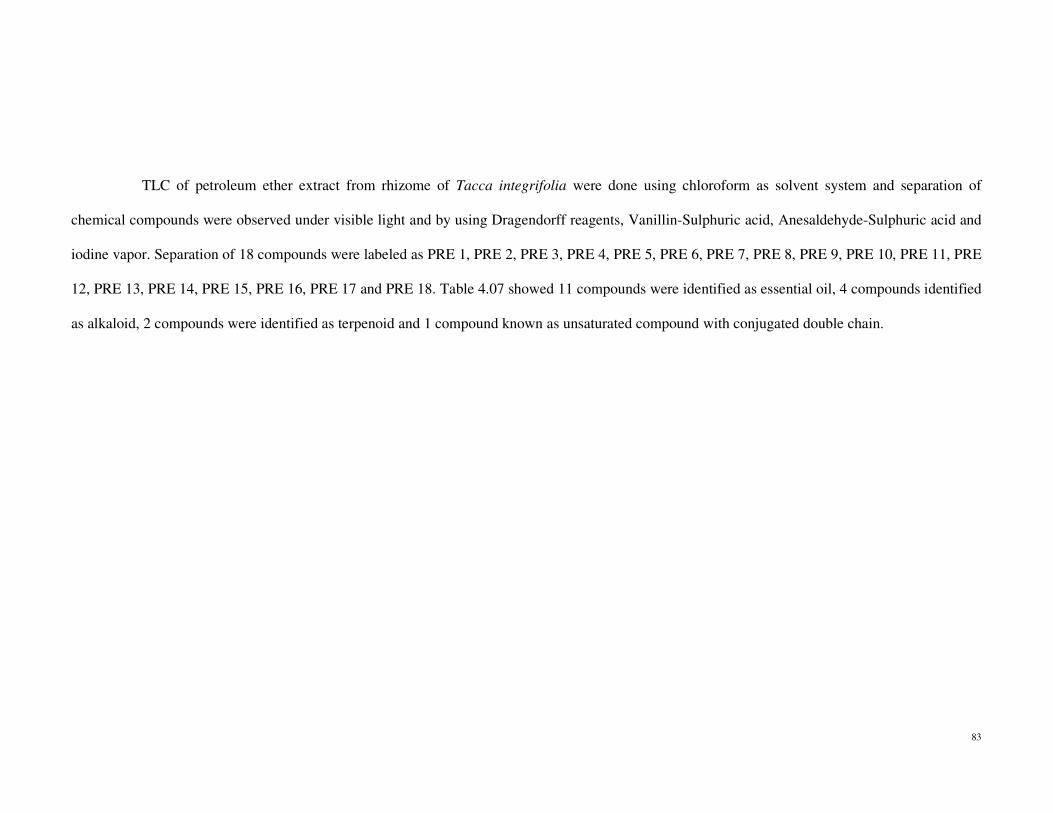
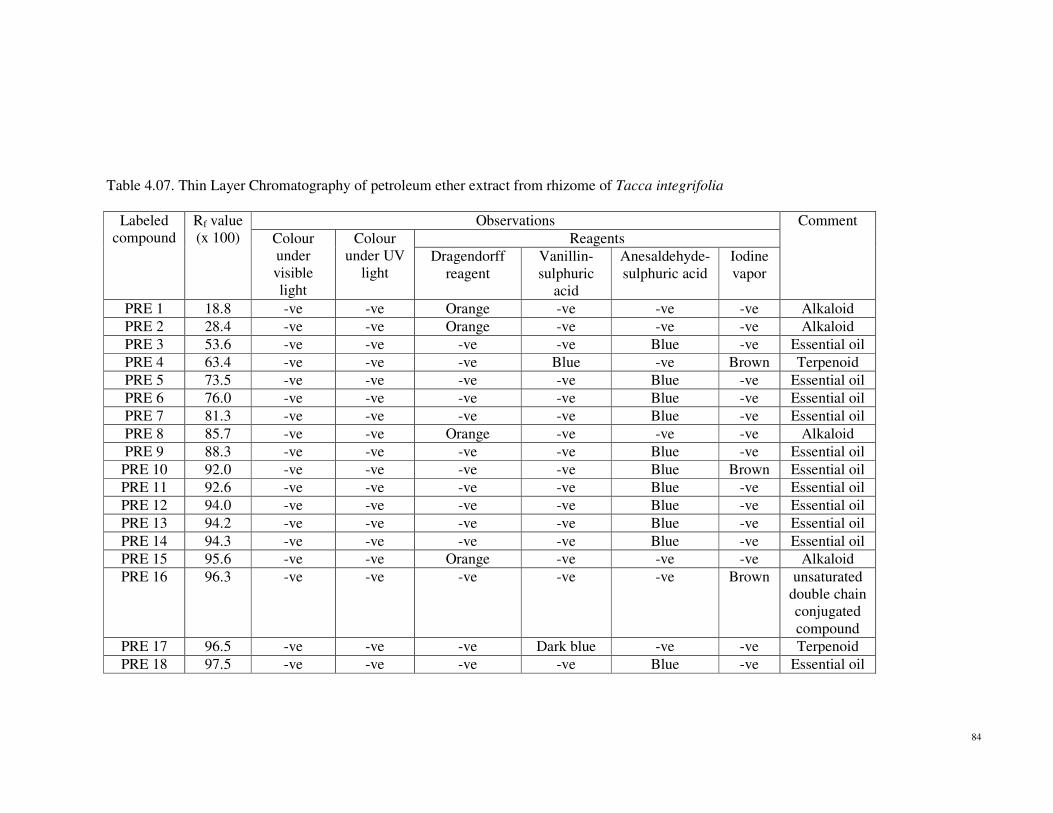
TLC of petroleum ether extract from rhizome of Tacca integrifolia were done using chloroform as solvent system and separation of
chemical compounds were observed under visible light and by using Dragendorff reagents, Vanillin-Sulphuric acid, Anesaldehyde-Sulphuric acid and
iodine vapor. Separation of 18 compounds were labeled as PRE 1, PRE 2, PRE 3, PRE 4, PRE 5, PRE 6, PRE 7, PRE 8, PRE 9, PRE 10, PRE 11, PRE
12, PRE 13, PRE 14, PRE 15, PRE 16, PRE 17 and PRE 18. Table 4.07 showed 11 compounds were identified as essential oil, 4 compounds identified
as alkaloid, 2 compounds were identified as terpenoid and 1 compound known as unsaturated compound with conjugated double chain.
84
Table 4.07. Thin Layer Chromatography of petroleum ether extract from rhizome of Tacca integrifolia
Labeled
compound
Rf value
(x 100)
Observations Comment
Colour
under
visible
light
Colour
under UV
light
Reagents
Dragendorff
reagent
Vanillin-
sulphuric
acid
Anesaldehyde-
sulphuric acid
Iodine
vapor
PRE 1 18.8 -ve -ve Orange -ve -ve -ve Alkaloid
PRE 2 28.4 -ve -ve Orange -ve -ve -ve Alkaloid
PRE 3 53.6 -ve -ve -ve -ve Blue -ve Essential oil
PRE 4 63.4 -ve -ve -ve Blue -ve Brown Terpenoid
PRE 5 73.5 -ve -ve -ve -ve Blue -ve Essential oil
PRE 6 76.0 -ve -ve -ve -ve Blue -ve Essential oil
PRE 7 81.3 -ve -ve -ve -ve Blue -ve Essential oil
PRE 8 85.7 -ve -ve Orange -ve -ve -ve Alkaloid
PRE 9 88.3 -ve -ve -ve -ve Blue -ve Essential oil
PRE 10 92.0 -ve -ve -ve -ve Blue Brown Essential oil
PRE 11 92.6 -ve -ve -ve -ve Blue -ve Essential oil
PRE 12 94.0 -ve -ve -ve -ve Blue -ve Essential oil
PRE 13 94.2 -ve -ve -ve -ve Blue -ve Essential oil
PRE 14 94.3 -ve -ve -ve -ve Blue -ve Essential oil
PRE 15 95.6 -ve -ve Orange -ve -ve -ve Alkaloid
PRE 16 96.3 -ve -ve -ve -ve -ve Brown unsaturated
double chain
conjugated
compound
PRE 17 96.5 -ve -ve -ve Dark blue -ve -ve Terpenoid
PRE 18 97.5 -ve -ve -ve -ve Blue -ve Essential oil
85
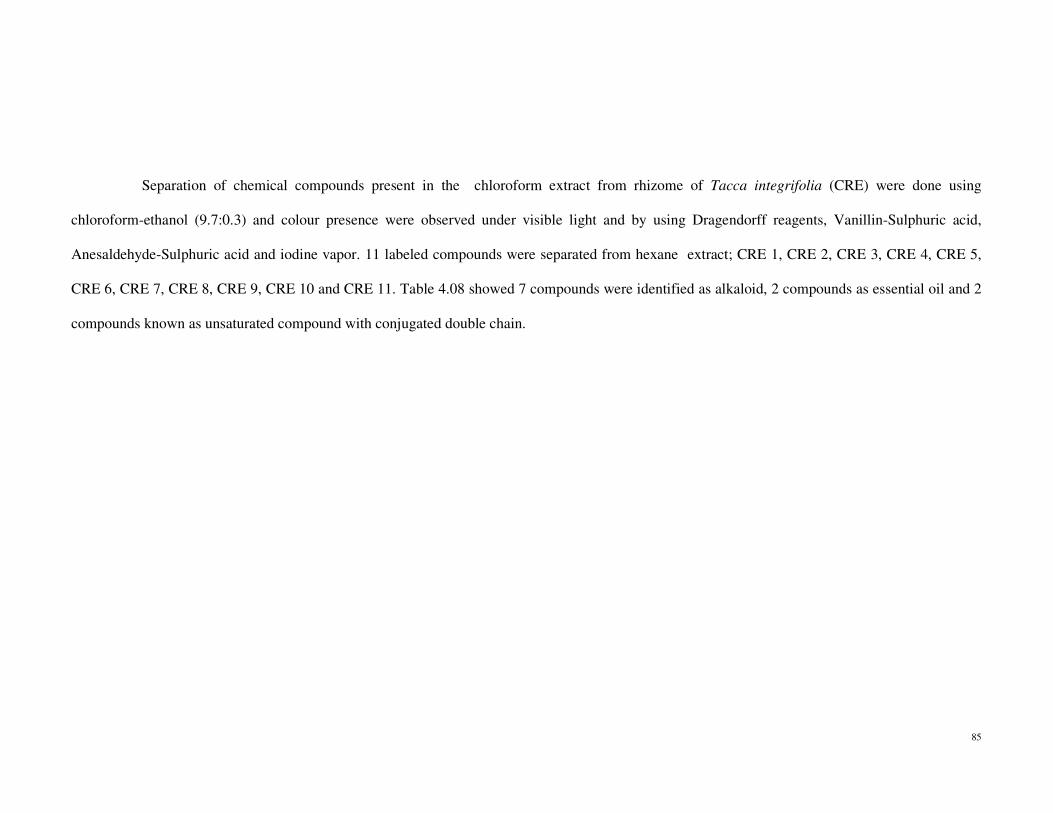
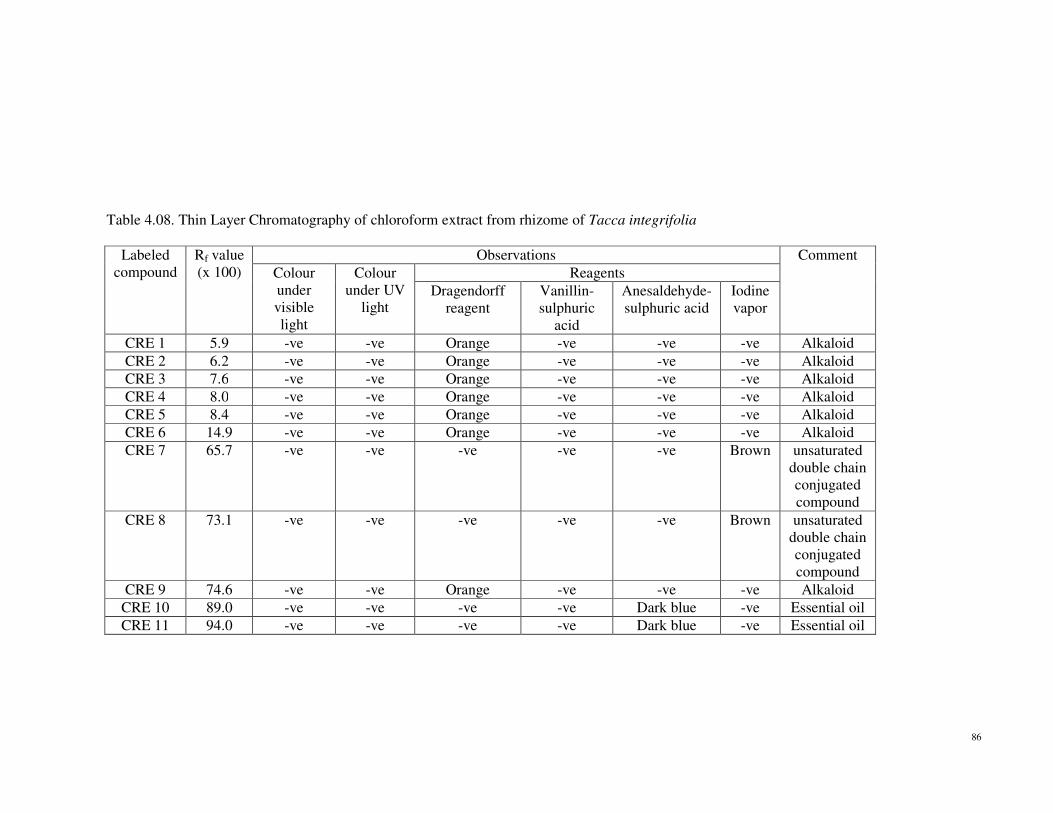
Separation of chemical compounds present in the chloroform extract from rhizome of Tacca integrifolia (CRE) were done using
chloroform-ethanol (9.7:0.3) and colour presence were observed under visible light and by using Dragendorff reagents, Vanillin-Sulphuric acid,
Anesaldehyde-Sulphuric acid and iodine vapor. 11 labeled compounds were separated from hexane extract; CRE 1, CRE 2, CRE 3, CRE 4, CRE 5,
CRE 6, CRE 7, CRE 8, CRE 9, CRE 10 and CRE 11. Table 4.08 showed 7 compounds were identified as alkaloid, 2 compounds as essential oil and 2
compounds known as unsaturated compound with conjugated double chain.
86
Table 4.08. Thin Layer Chromatography of chloroform extract from rhizome of Tacca integrifolia
Labeled
compound
Rf value
(x 100)
Observations Comment
Colour
under
visible
light
Colour
under UV
light
Reagents
Dragendorff
reagent
Vanillin-
sulphuric
acid
Anesaldehyde-
sulphuric acid
Iodine
vapor
CRE 1 5.9 -ve -ve Orange -ve -ve -ve Alkaloid
CRE 2 6.2 -ve -ve Orange -ve -ve -ve Alkaloid
CRE 3 7.6 -ve -ve Orange -ve -ve -ve Alkaloid
CRE 4 8.0 -ve -ve Orange -ve -ve -ve Alkaloid
CRE 5 8.4 -ve -ve Orange -ve -ve -ve Alkaloid
CRE 6 14.9 -ve -ve Orange -ve -ve -ve Alkaloid
CRE 7 65.7 -ve -ve -ve -ve -ve Brown unsaturated
double chain
conjugated
compound
CRE 8 73.1 -ve -ve -ve -ve -ve Brown unsaturated
double chain
conjugated
compound
CRE 9 74.6 -ve -ve Orange -ve -ve -ve Alkaloid
CRE 10 89.0 -ve -ve -ve -ve Dark blue -ve Essential oil
CRE 11 94.0 -ve -ve -ve -ve Dark blue -ve Essential oil
87
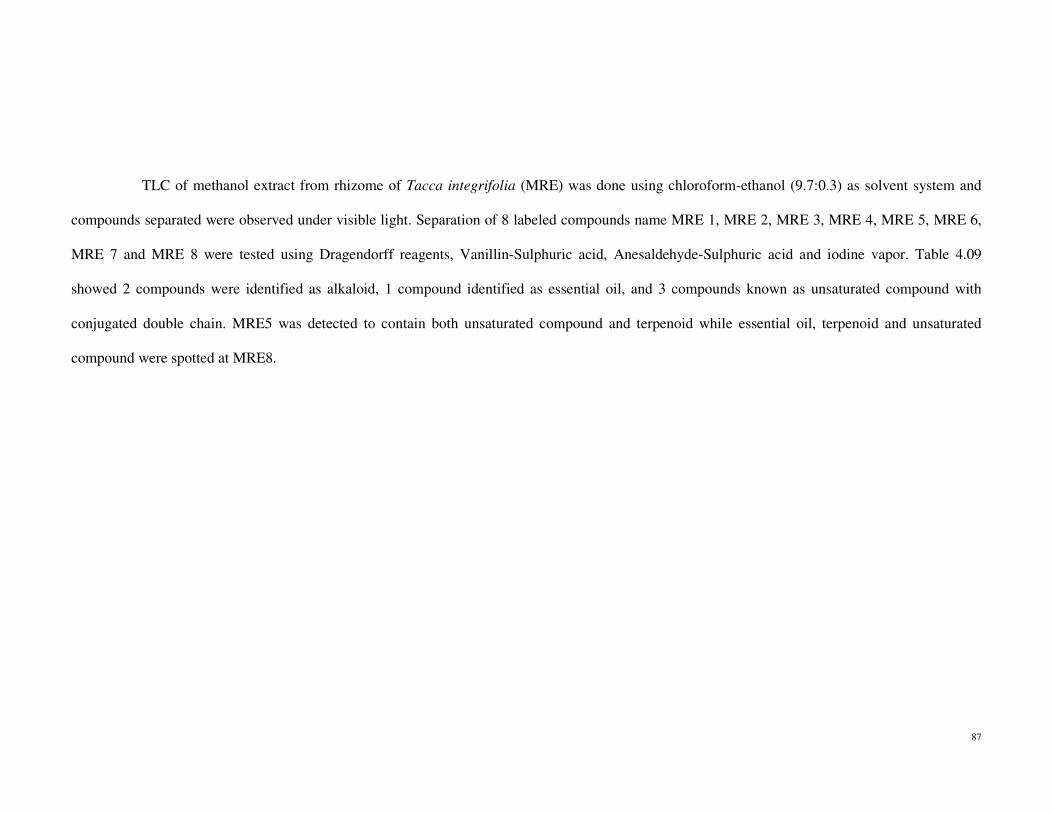
TLC of methanol extract from rhizome of Tacca integrifolia (MRE) was done using chloroform-ethanol (9.7:0.3) as solvent system and
compounds separated were observed under visible light. Separation of 8 labeled compounds name MRE 1, MRE 2, MRE 3, MRE 4, MRE 5, MRE 6,
MRE 7 and MRE 8 were tested using Dragendorff reagents, Vanillin-Sulphuric acid, Anesaldehyde-Sulphuric acid and iodine vapor. Table 4.09
showed 2 compounds were identified as alkaloid, 1 compound identified as essential oil, and 3 compounds known as unsaturated compound with
conjugated double chain. MRE5 was detected to contain both unsaturated compound and terpenoid while essential oil, terpenoid and unsaturated
compound were spotted at MRE8.

88
Table 4.09. Thin Layer Chromatography of methanol extract from rhizome of Tacca integrifolia
Labeled
compound
Rf value
(x 100)
Observations Comment
Colour
under
visible
light
Colour
under UV
light
Reagents
Dragendorff
reagent
Vanillin-
sulphuric
acid
Anesaldehyde-
sulphuric acid
Iodine
vapor
MRE 1 7.5 -ve -ve Orange -ve -ve -ve Alkaloid
MRE 2 8.6 -ve -ve Orange -ve -ve -ve Alkaloid
MRE 3 34.0 -ve -ve -ve -ve -ve Brown unsaturated
double chain
conjugated
compound
MRE 4 82.1 -ve -ve -ve -ve -ve Brown unsaturated
double chain
conjugated
compound
MRE 5 91.0 -ve -ve -ve Purple -ve Brown Terpenoid
and
unsaturated
double chain
conjugated
compound
MRE 6 92.0 -ve -ve -ve -ve -ve Brown unsaturated
double chain
conjugated
compound
MRE 7 94.0 -ve -ve -ve -ve Dark blue -ve Essential oil
MRE 8 95.0 -ve -ve -ve Blue Dark blue Brown Essential oil,
Terpenoid
89
and
unsaturated
double chain
conjugated
compound

90
4.2.2 Column Chromatography (CC)
Maceration method was used to extract 200 g of grind leaves and rhizome of Tacca integrifolia with 500 ml of distilled water. Column
chromatography (CC) of water extract were developed using buthanol-acetic acid-water (60:15:25) as solvent system with slight modifications. 20
fractions were collected with 2 ml each and were dried in fume cupboard before the dry weights were measured. TLC was developed for each fraction
using buthanol-acetic acid-water (60:15:25) as solvent system to detect chemical compounds present.
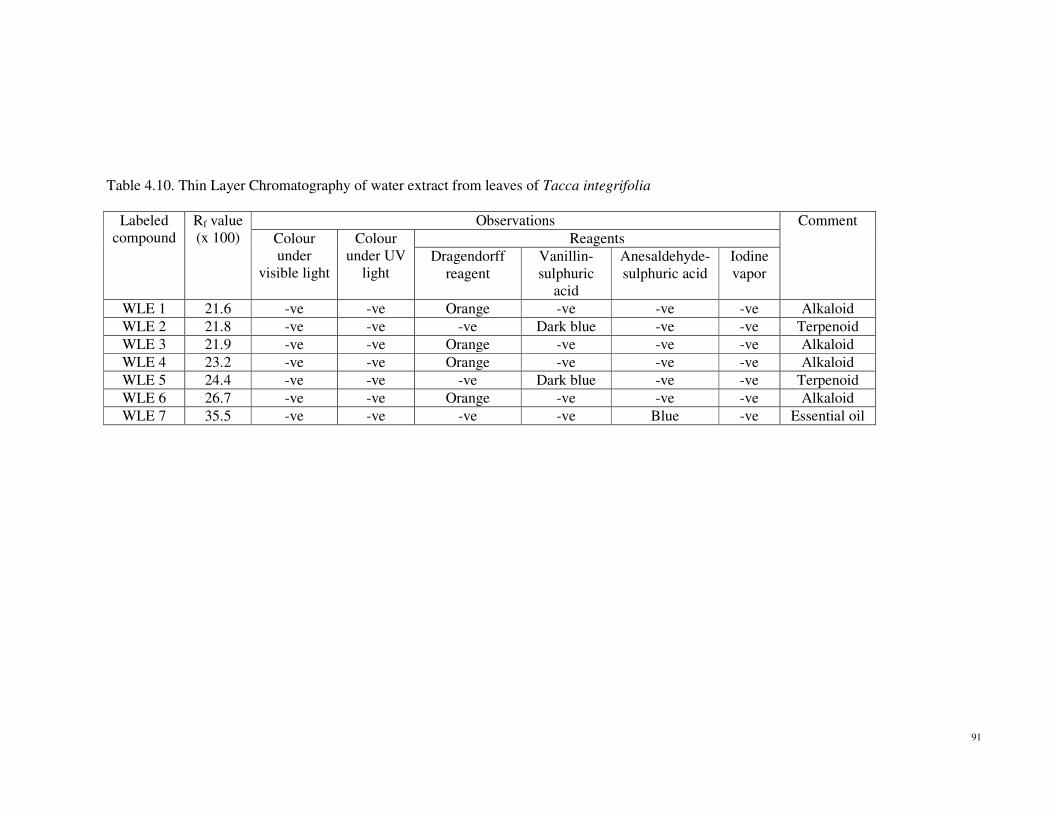
The separation and detection of chemical compounds in the water extract from leaves of Tacca integrifolia (WLE) were observed under
visible light and by using Dragendorff reagents, Vanillin-Sulphuric acid, Anesaldehyde-Sulphuric acid and iodine vapor. 7 compounds were separated
from water extract from leaves of plant studied labeled WLE 1, WLE 2, WLE 3, WLE 4, WLE 5, WLE 6, and WLE 7. Table 4.10 showed 4
compounds were identified as alkaloid, 2 compounds were identified as terpenoid and 1 compound identified as essential oil.
91
Table 4.10. Thin Layer Chromatography of water extract from leaves of Tacca integrifolia
Labeled
compound
Rf value
(x 100)
Observations Comment
Colour
under
visible light
Colour
under UV
light
Reagents
Dragendorff
reagent
Vanillin-
sulphuric
acid
Anesaldehyde-
sulphuric acid
Iodine
vapor
WLE 1 21.6 -ve -ve Orange -ve -ve -ve Alkaloid
WLE 2 21.8 -ve -ve -ve Dark blue -ve -ve Terpenoid
WLE 3 21.9 -ve -ve Orange -ve -ve -ve Alkaloid
WLE 4 23.2 -ve -ve Orange -ve -ve -ve Alkaloid
WLE 5 24.4 -ve -ve -ve Dark blue -ve -ve Terpenoid
WLE 6 26.7 -ve -ve Orange -ve -ve -ve Alkaloid
WLE 7 35.5 -ve -ve -ve -ve Blue -ve Essential oil
92
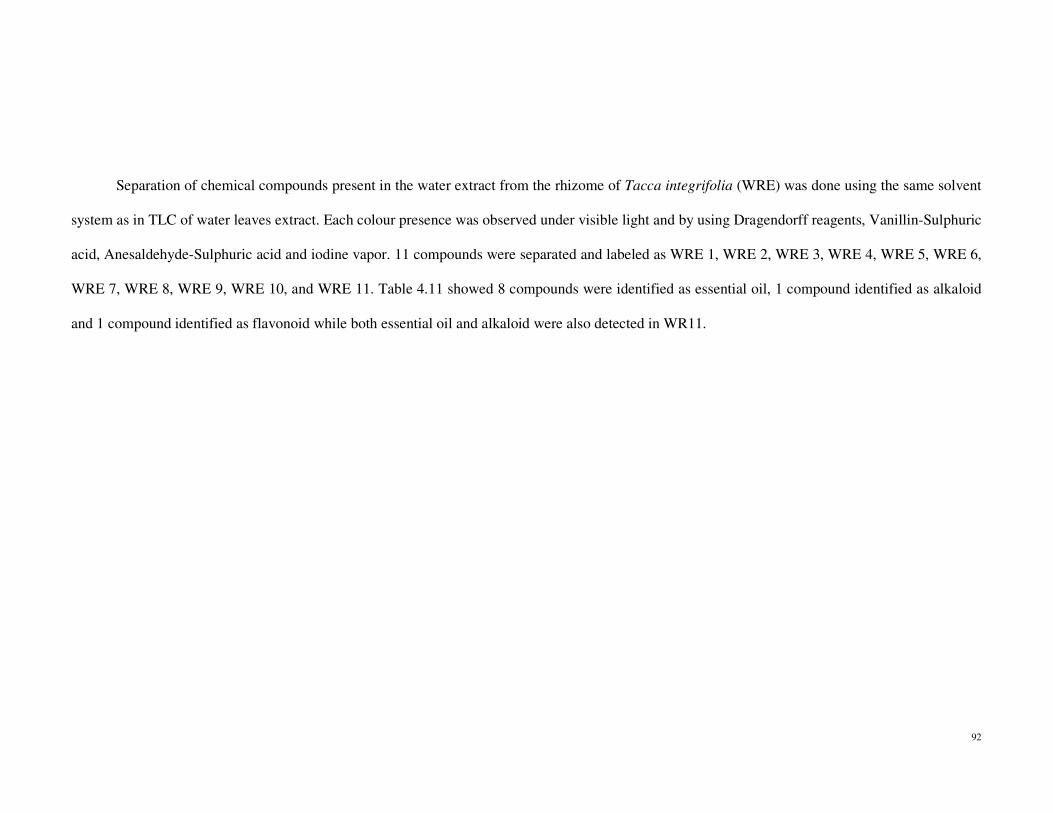
Separation of chemical compounds present in the water extract from the rhizome of Tacca integrifolia (WRE) was done using the same solvent
system as in TLC of water leaves extract. Each colour presence was observed under visible light and by using Dragendorff reagents, Vanillin-Sulphuric
acid, Anesaldehyde-Sulphuric acid and iodine vapor. 11 compounds were separated and labeled as WRE 1, WRE 2, WRE 3, WRE 4, WRE 5, WRE 6,
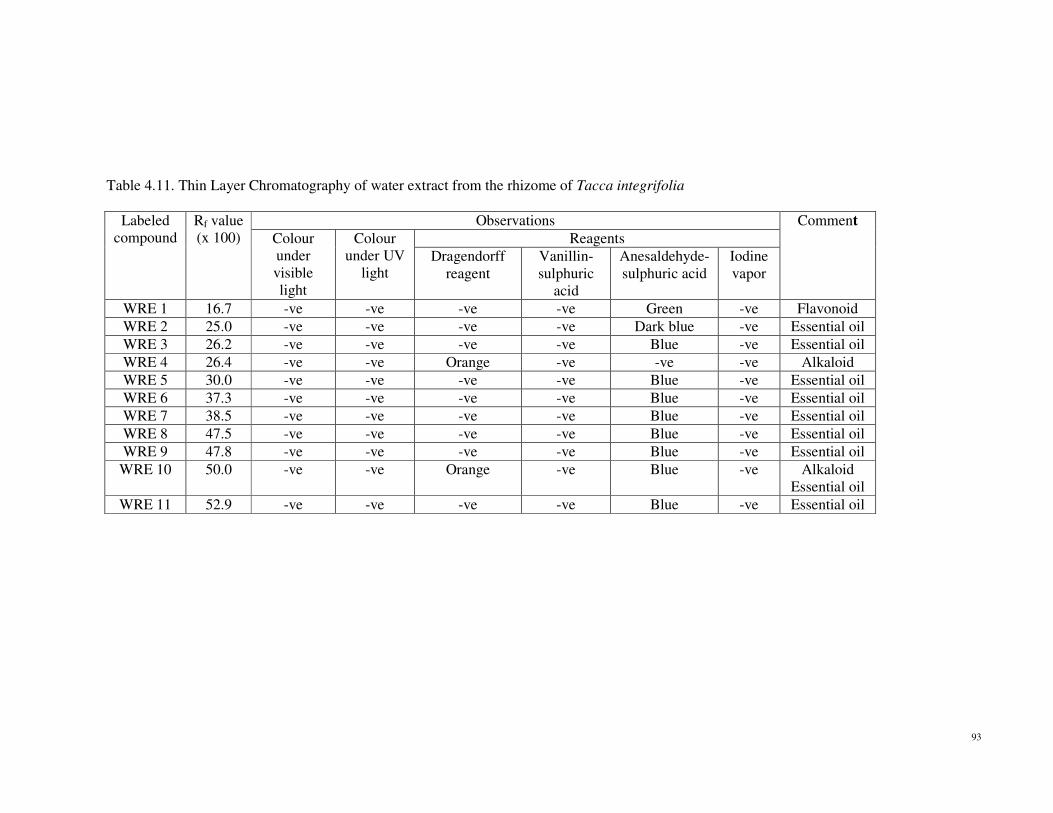
WRE 7, WRE 8, WRE 9, WRE 10, and WRE 11. Table 4.11 showed 8 compounds were identified as essential oil, 1 compound identified as alkaloid
and 1 compound identified as flavonoid while both essential oil and alkaloid were also detected in WR11.
93
Table 4.11. Thin Layer Chromatography of water extract from the rhizome of Tacca integrifolia
Labeled
compound
Rf value
(x 100)
Observations Comment
Colour
under
visible
light
Colour
under UV
light
Reagents
Dragendorff
reagent
Vanillin-
sulphuric
acid
Anesaldehyde-
sulphuric acid
Iodine
vapor
WRE 1 16.7 -ve -ve -ve -ve Green -ve Flavonoid
WRE 2 25.0 -ve -ve -ve -ve Dark blue -ve Essential oil
WRE 3 26.2 -ve -ve -ve -ve Blue -ve Essential oil
WRE 4 26.4 -ve -ve Orange -ve -ve -ve Alkaloid
WRE 5 30.0 -ve -ve -ve -ve Blue -ve Essential oil
WRE 6 37.3 -ve -ve -ve -ve Blue -ve Essential oil
WRE 7 38.5 -ve -ve -ve -ve Blue -ve Essential oil
WRE 8 47.5 -ve -ve -ve -ve Blue -ve Essential oil
WRE 9 47.8 -ve -ve -ve -ve Blue -ve Essential oil
WRE 10 50.0 -ve -ve Orange -ve Blue -ve Alkaloid
Essential oil
WRE 11 52.9 -ve -ve -ve -ve Blue -ve Essential oil

94
Table 4.12. Summary of compounds identified from TLC of extracts from Tacca integrifolia
Extracts Alkaloids Flavonoids Phenols Terpenoids Essential
oils
Leaves hexane
extract
Leaves petroleum
ether extract
Leaves chloroform
extract
Leaves methanol
extract
Leaves water
extract
Rhizome hexane
extract
Rhizome petroleum
ether extract
Rhizome
chloroform extract
Rhizome methanol
extract
Rhizome water
extract
95
4.2.3 High Performance Liquid Chromatography (HPLC)
The extract of leaves and rhizome of Tacca integrifolia was analyzed using
High Performance Liquid Chromatography (HPLC). Extract was filtered using 0.45µm
Regenerated Cellulose (RC) membrane filter before 10µl from each extract were
injected separately to C-18 column for 1 hour with flow rate of 1ml/min. Retention time
obtain from each extracts were compared to standard reference of phenol and flavonoid.
Gallic acid and tannic acid were used for standard phenol while quercetin for standard
flavonoids.
96
i) HPLC profile of standard gallic acid
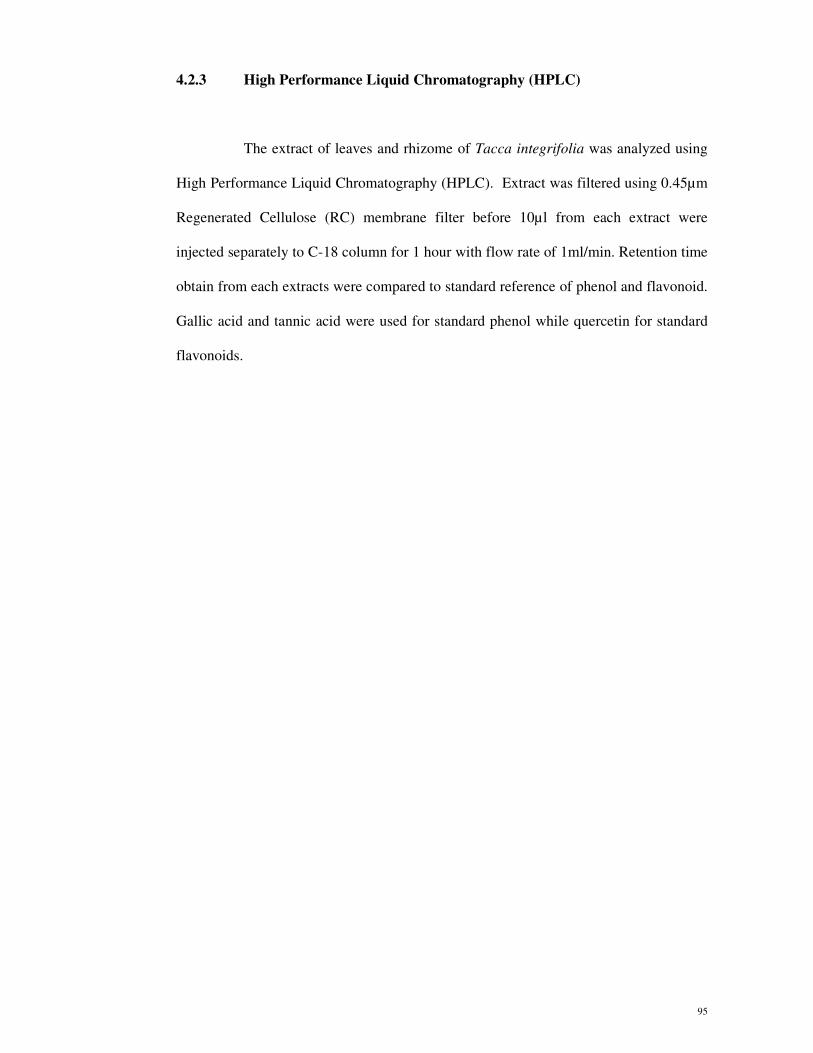
Gallic acid solution was prepared by dissolving 10mg of gallic acid in 1 ml
of HPLC pure water. Gallic acid solution was filtered using 0.45µm Regenerated
Cellulose (RC) membrane filter before was tested for solubility test with a mixture of
water and acetic acid (97:3) as mobile phase A and methanol HPLC grade as mobile
phase B. 10µl of gallic acid was injected to the C-18 column and was left for 10 minutes
for HPLC analysis at 280nm wavelength.
Figure 4.00. High Performance Liquid Chromatography (HPLC) chromatogram of
standard gallic acid.
Retention time of standard gallic acid was detected at 4.966’ at 280 nm wavelength.
97
ii) HPLC profile of standard tannic acid
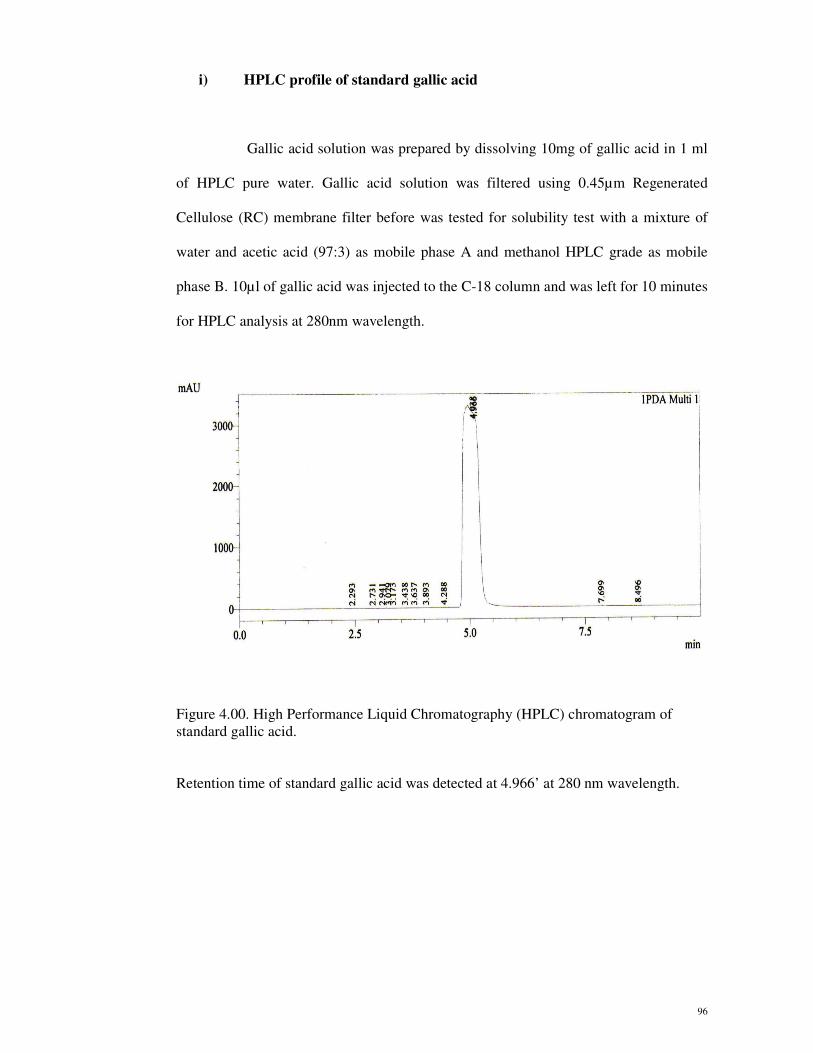
Tannic acid is a type of polyphenols that also known as polymer of gallic acid
molecules and glucose. Tannic acid solution was prepared by dissolving 10mg of tannic
acid in 1 ml of pure water of HPLC before the solution was filtered using 0.45µm
Regenerated Cellulose (RC) membrane filter and tested for solubility test. 10µl of
tannic acid was injected to the C-18 column and was left for HPLC separation for 10
minutes.
Figure 4.01. High Performance Liquid Chromatography (HPLC) chromatogram of
standard tannic acid.
Retention time of standard tannic acid was detected at 4.981’ at 280 nm wavelength.

98
iii) HPLC profile of standard flavonoid Quercetin
Quercetin known as a plant-derived flavonoid that widely distributed in
fruits, vegetables, leaves and grains. Quercetin was used as reference standard in
analysis of plant flavonoid in Tacca integrifolia via HPLC. Stock solution of quercetin
was prepared by dissolving 10mg of quercetin in 1 ml of methanol HPLC grade before
it was filtered and injected through HPLC C18 column.
Figure 4.02. High Performance Liquid Chromatography (HPLC) chromatogram of
standard flavonoid quercetin.
Retention time of quercetin was detected at 5.006’ with 280 nm wavelength.
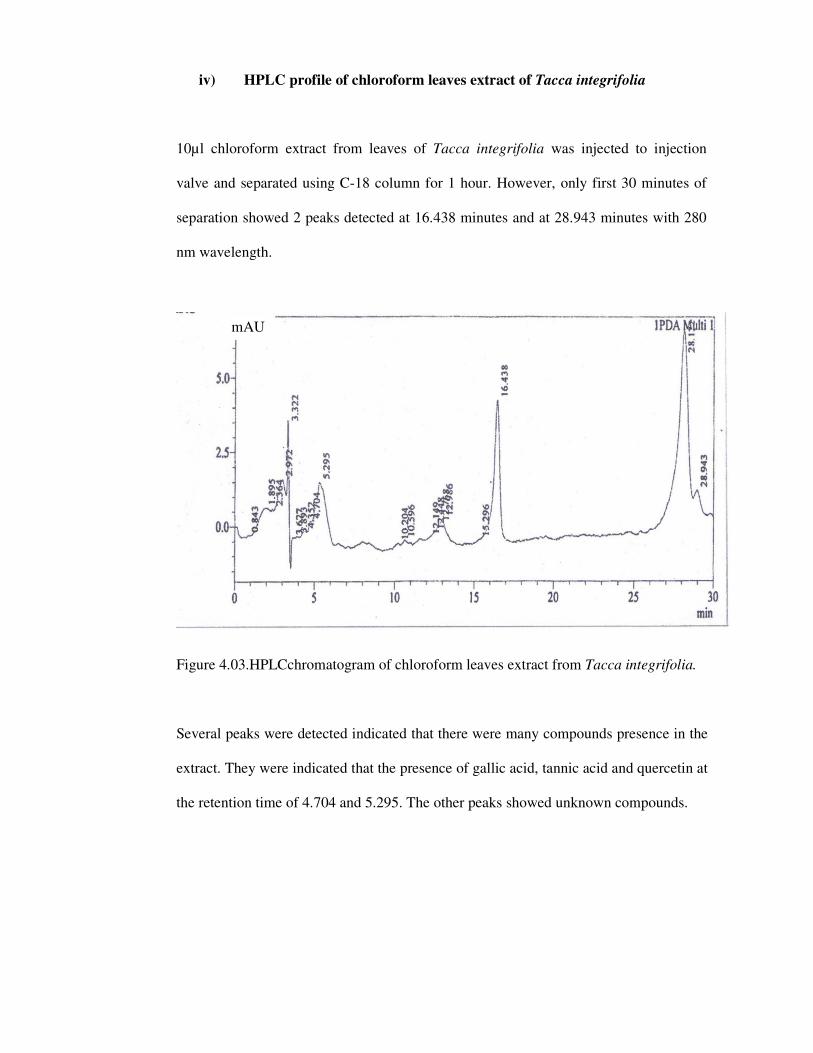
iv) HPLC profile of chloroform leaves extract of Tacca integrifolia
10µl chloroform extract from leaves of Tacca integrifolia was injected to injection
valve and separated using C-18 column for 1 hour. However, only first 30 minutes of
separation showed 2 peaks detected at 16.438 minutes and at 28.943 minutes with 280
nm wavelength.
Figure 4.03.HPLCchromatogram of chloroform leaves extract from Tacca integrifolia.
Several peaks were detected indicated that there were many compounds presence in the
extract. They were indicated that the presence of gallic acid, tannic acid and quercetin at
the retention time of 4.704 and 5.295. The other peaks showed unknown compounds.
mAU
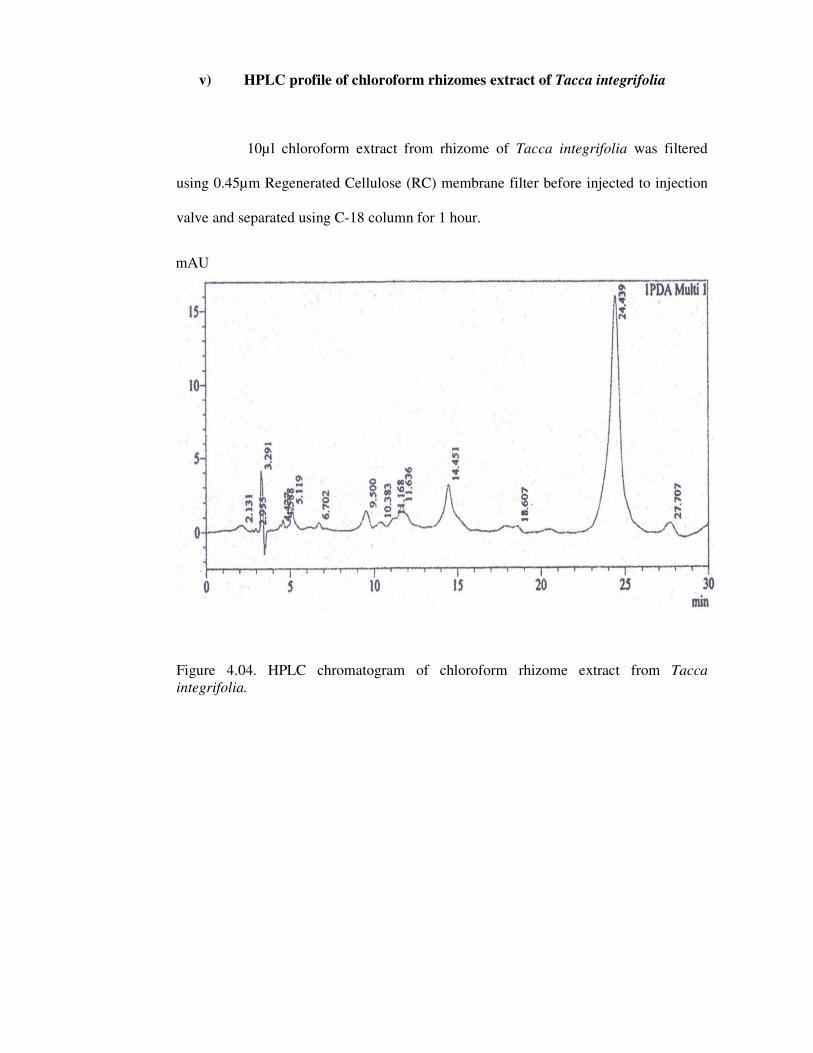
v) HPLC profile of chloroform rhizomes extract of Tacca integrifolia
10µl chloroform extract from rhizome of Tacca integrifolia was filtered
using 0.45µm Regenerated Cellulose (RC) membrane filter before injected to injection
valve and separated using C-18 column for 1 hour.
Figure 4.04. HPLC chromatogram of chloroform rhizome extract from Tacca
integrifolia.
mAU
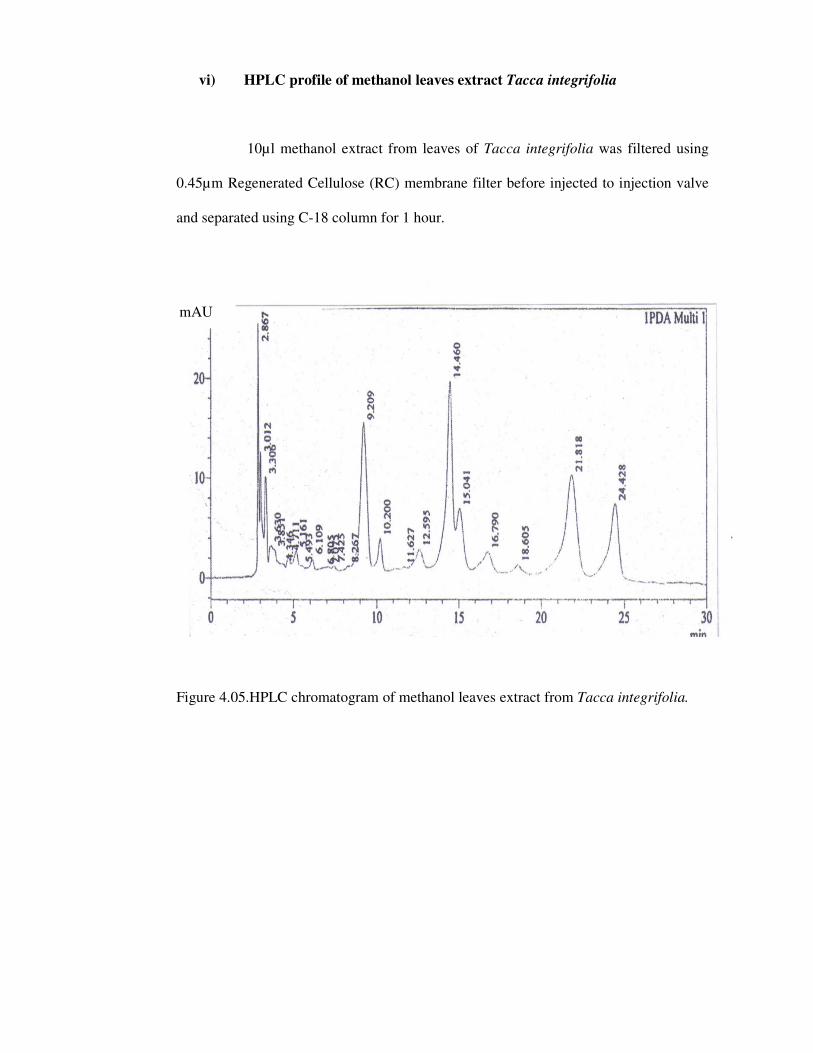
vi) HPLC profile of methanol leaves extract Tacca integrifolia
10µl methanol extract from leaves of Tacca integrifolia was filtered using
0.45µm Regenerated Cellulose (RC) membrane filter before injected to injection valve
and separated using C-18 column for 1 hour.
Figure 4.05.HPLC chromatogram of methanol leaves extract from Tacca integrifolia.
mAU
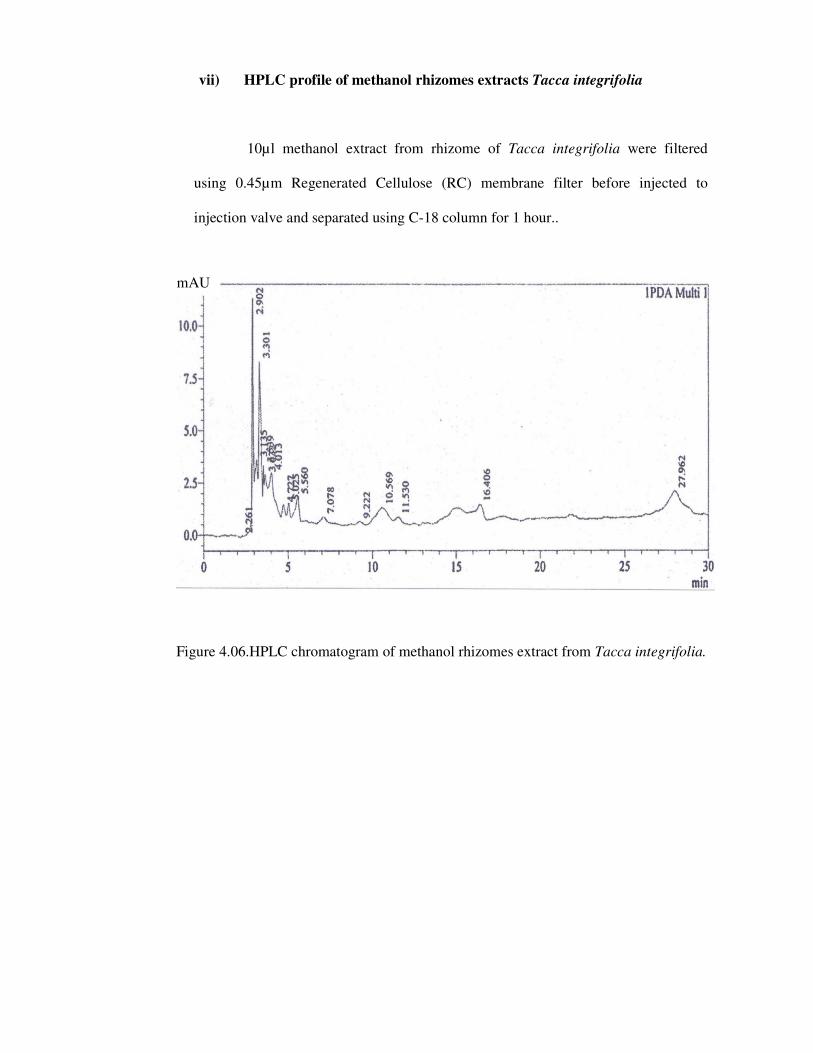
vii) HPLC profile of methanol rhizomes extracts Tacca integrifolia
10µl methanol extract from rhizome of Tacca integrifolia were filtered
using 0.45µm Regenerated Cellulose (RC) membrane filter before injected to
injection valve and separated using C-18 column for 1 hour..
Figure 4.06.HPLC chromatogram of methanol rhizomes extract from Tacca integrifolia.
mAU
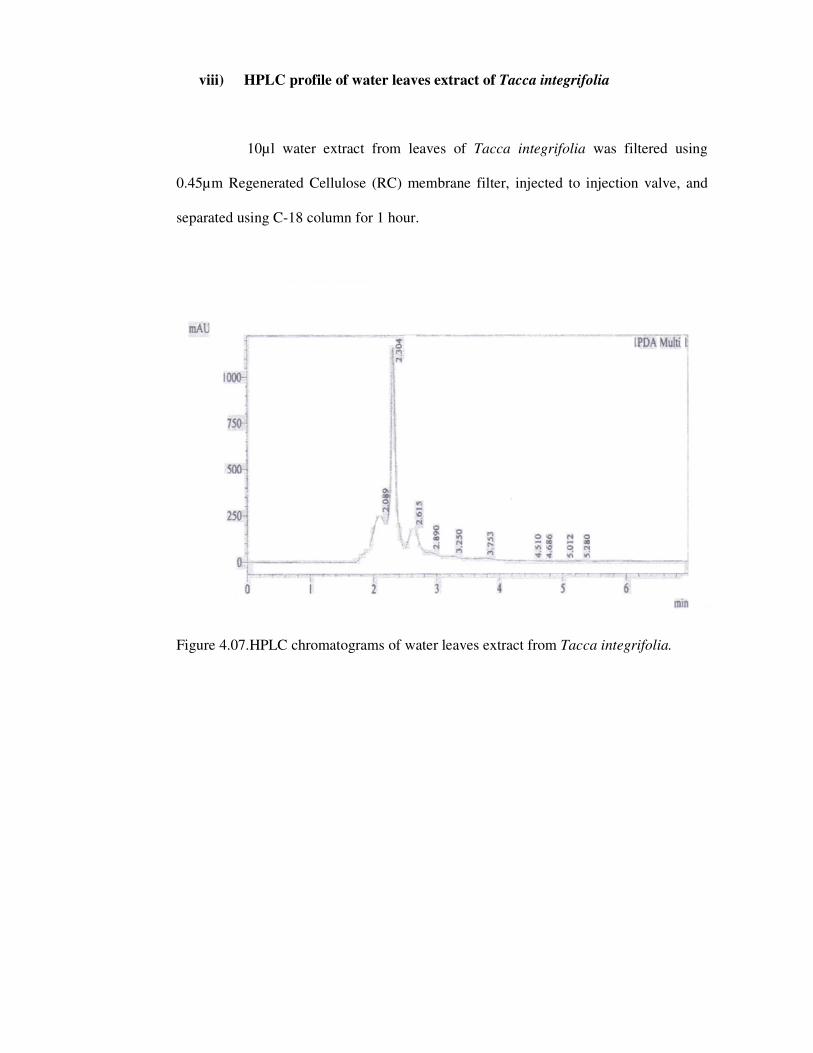
viii) HPLC profile of water leaves extract of
10µl water extract from leaves of
0.45µm Regenerated Cellulose (RC) membrane
separated using C-18 column for 1 hour.
Figure 4.07.HPLC chromatograms of water leaves extract f
profile of water leaves extract of Tacca integrifolia
10µl water extract from leaves of Tacca integrifolia was filtered using
0.45µm Regenerated Cellulose (RC) membrane filter, injected to injection valve,
18 column for 1 hour.
chromatograms of water leaves extract from Tacca integrifolia
Tacca integrifolia
was filtered using
filter, injected to injection valve, and
Tacca integrifolia.
104
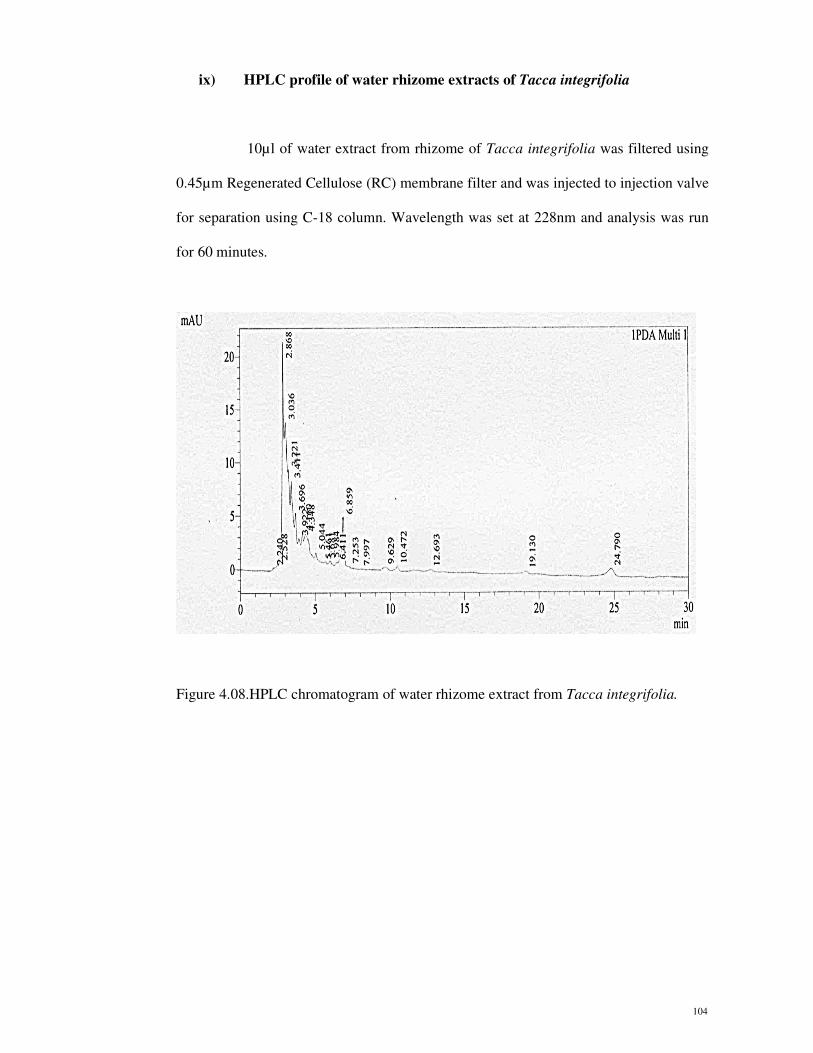
ix) HPLC profile of water rhizome extracts of Tacca integrifolia
10µl of water extract from rhizome of Tacca integrifolia was filtered using
0.45µm Regenerated Cellulose (RC) membrane filter and was injected to injection valve
for separation using C-18 column. Wavelength was set at 228nm and analysis was run
for 60 minutes.
Figure 4.08.HPLC chromatogram of water rhizome extract from Tacca integrifolia.
105
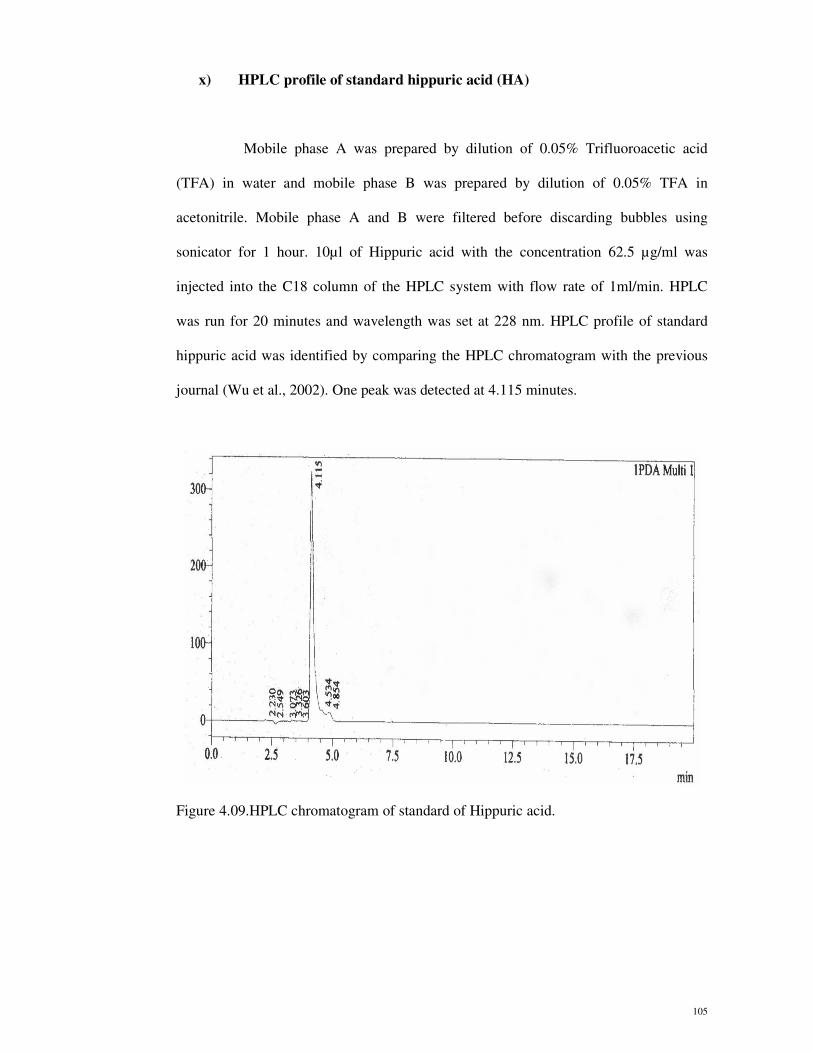
x) HPLC profile of standard hippuric acid (HA)
Mobile phase A was prepared by dilution of 0.05% Trifluoroacetic acid
(TFA) in water and mobile phase B was prepared by dilution of 0.05% TFA in
acetonitrile. Mobile phase A and B were filtered before discarding bubbles using
sonicator for 1 hour. 10µl of Hippuric acid with the concentration 62.5 µg/ml was
injected into the C18 column of the HPLC system with flow rate of 1ml/min. HPLC
was run for 20 minutes and wavelength was set at 228 nm. HPLC profile of standard
hippuric acid was identified by comparing the HPLC chromatogram with the previous
journal (Wu et al., 2002). One peak was detected at 4.115 minutes.
Figure 4.09.HPLC chromatogram of standard of Hippuric acid.
106
4.3 Determination of chemical compounds using Liquid Chromatography
Mass Spectrometry combined with Mass Spectrometry (LCMS/MS)
Liquid Chromatography Mass Spectrometry combined with Mass
Spectrometry (LCMS/MS) was used to determine the chemical compounds found in
extracts of leaves and rhizome of Tacca integrifolia. The extracts have been fully screen
with AB Sciex 3200QTrap LCMS/MS and fully scan with MS/MS data collection. All
samples were appropriately diluted and filtered with 0.22µM nylon filter and injection
volume for all samples is 20µL.Sample were run with gradient mode; 10% A to 90% B
from 0.01 minute to 8.0 minute and were hold for 3 minutes and back to 10% A in 0.1
minute and re-equilibrated for 4 minutes. Pre-run equilibration time was 1.0 minute.

107
4.3.1 Liquid Chromatography Mass Spectrometry/Mass Spectrometry
(LCMS/MS) for leaves extract of Tacca integrifolia
Table 4.13. Compounds detected in Liquid Chromatography Mass Spectrometry
(LCMS/MS) of leaves extract from Tacca integrifolia
Extract Compound detected Reference Figure
Hexane 1) Proanthocyanidin trimer Fig. 4.11
Petroleum Ether 1) Proanthocyanidin trimer Fig. 4.13
Chloroform 1) p hydroxybenzoic acid
2) Proanthocyanidin trimer
3) 1,3,5 tricaffeolquinic acid
4) 2(3,4-Dihydroxyphenyl)-7-
hydroxy-5-benzene propanoic acid
Fig. 4.15
Fig. 4.16
Fig. 4.17
Fig. 4.18
Methanol 1) Quinic Acid
2) 3 caffeolquinic acid
3) p hydroxybenzoic acid
4) Dicaffeolquinic acid conjugate
5) Isoflavone glycoside
6) Proanthocyanidin
Fig. 4.20
Fig. 4.21
Fig. 4.22
Fig. 4.23
Fig. 4.24
Fig. 4.25
Water 1) Quinic acid
2) Protocatechuic acid
3) salicylic acid
4) Phenolic acid conjugate
5) Proanthocyanidin
6) Proanthocyanidin trimer
Fig. 4.27
Fig. 4.28
Fig. 4.29
Fig. 4.30
Fig. 4.31
Fig. 4.32
108
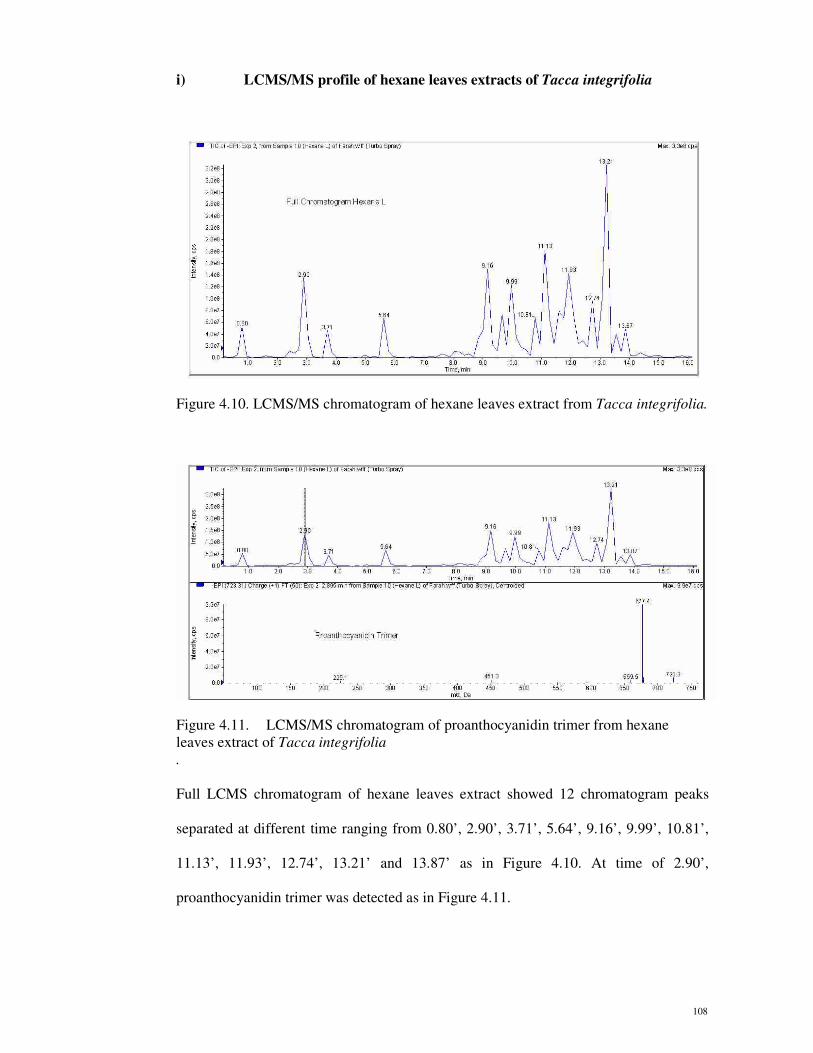
i) LCMS/MS profile of hexane leaves extracts of Tacca integrifolia
Figure 4.10. LCMS/MS chromatogram of hexane leaves extract from Tacca integrifolia.
Figure 4.11. LCMS/MS chromatogram of proanthocyanidin trimer from hexane
leaves extract of Tacca integrifolia
.
Full LCMS chromatogram of hexane leaves extract showed 12 chromatogram peaks
separated at different time ranging from 0.80’, 2.90’, 3.71’, 5.64’, 9.16’, 9.99’, 10.81’,
11.13’, 11.93’, 12.74’, 13.21’ and 13.87’ as in Figure 4.10. At time of 2.90’,
proanthocyanidin trimer was detected as in Figure 4.11.
109
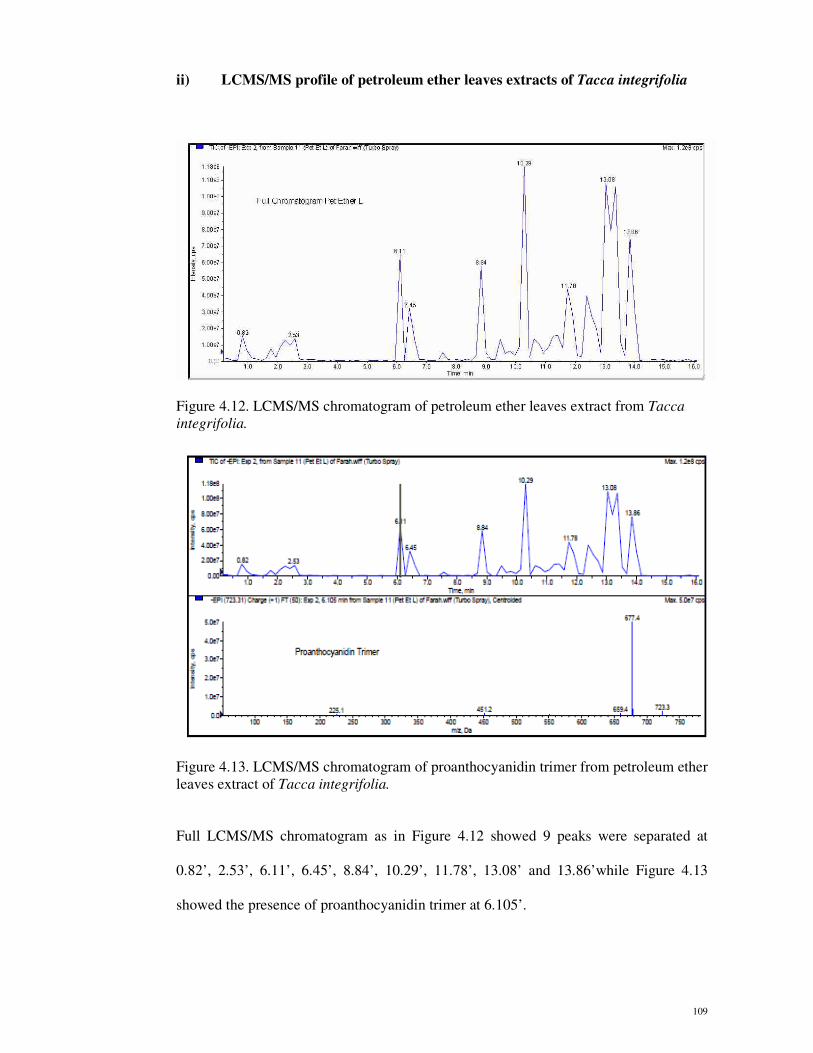
ii) LCMS/MS profile of petroleum ether leaves extracts of Tacca integrifolia
Figure 4.12. LCMS/MS chromatogram of petroleum ether leaves extract from Tacca
integrifolia.
Figure 4.13. LCMS/MS chromatogram of proanthocyanidin trimer from petroleum ether
leaves extract of Tacca integrifolia.
Full LCMS/MS chromatogram as in Figure 4.12 showed 9 peaks were separated at
0.82’, 2.53’, 6.11’, 6.45’, 8.84’, 10.29’, 11.78’, 13.08’ and 13.86’while Figure 4.13
showed the presence of proanthocyanidin trimer at 6.105’.
110
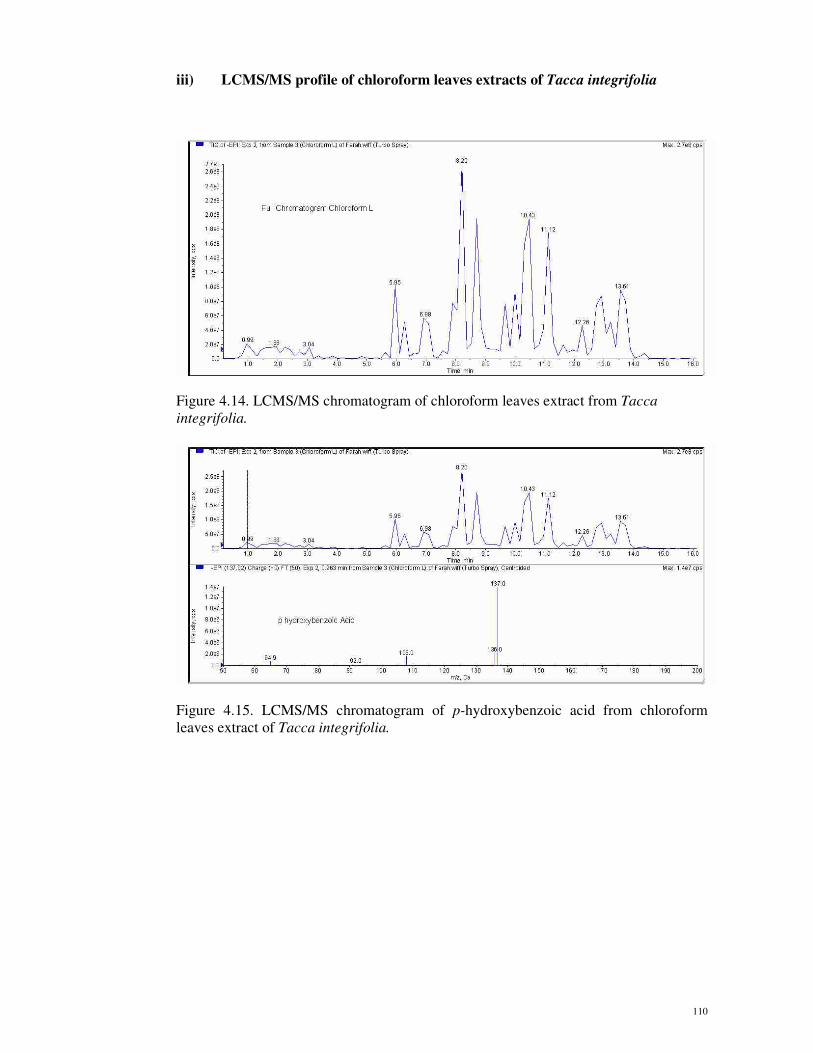
iii) LCMS/MS profile of chloroform leaves extracts of Tacca integrifolia
Figure 4.14. LCMS/MS chromatogram of chloroform leaves extract from Tacca
integrifolia.
Figure 4.15. LCMS/MS chromatogram of p-hydroxybenzoic acid from chloroform
leaves extract of Tacca integrifolia.
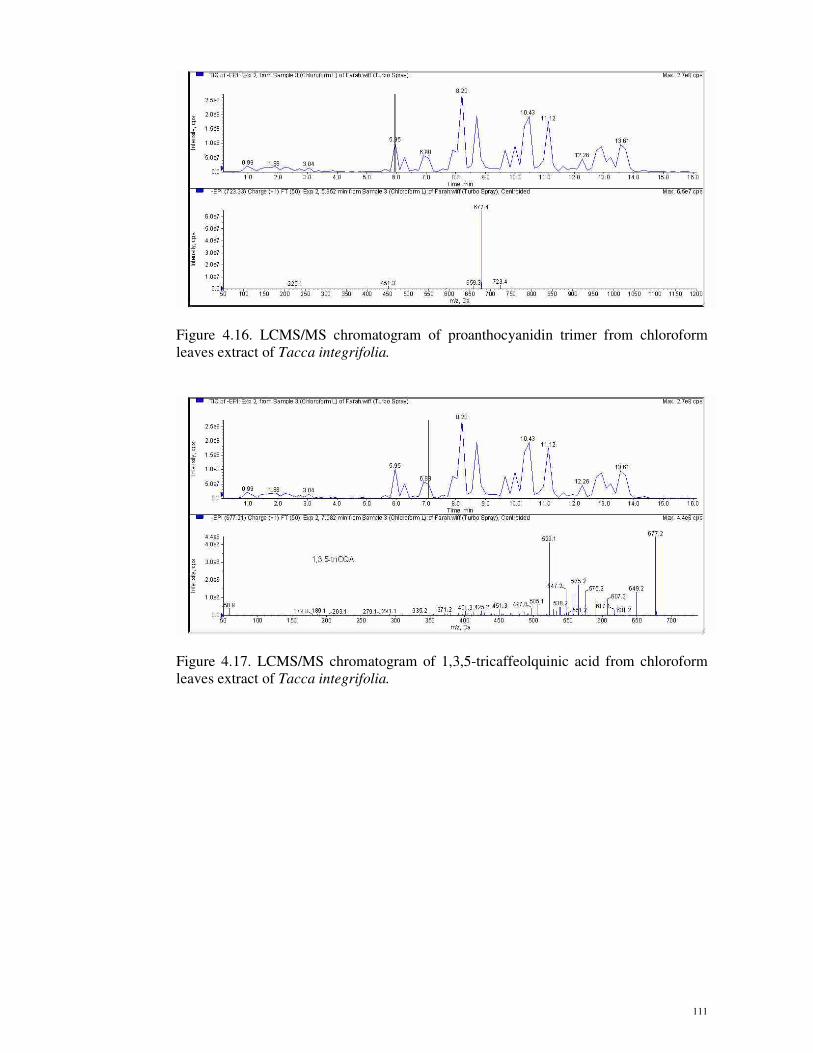
111
Figure 4.16. LCMS/MS chromatogram of proanthocyanidin trimer from chloroform
leaves extract of Tacca integrifolia.
Figure 4.17. LCMS/MS chromatogram of 1,3,5-tricaffeolquinic acid from chloroform
leaves extract of Tacca integrifolia.
112
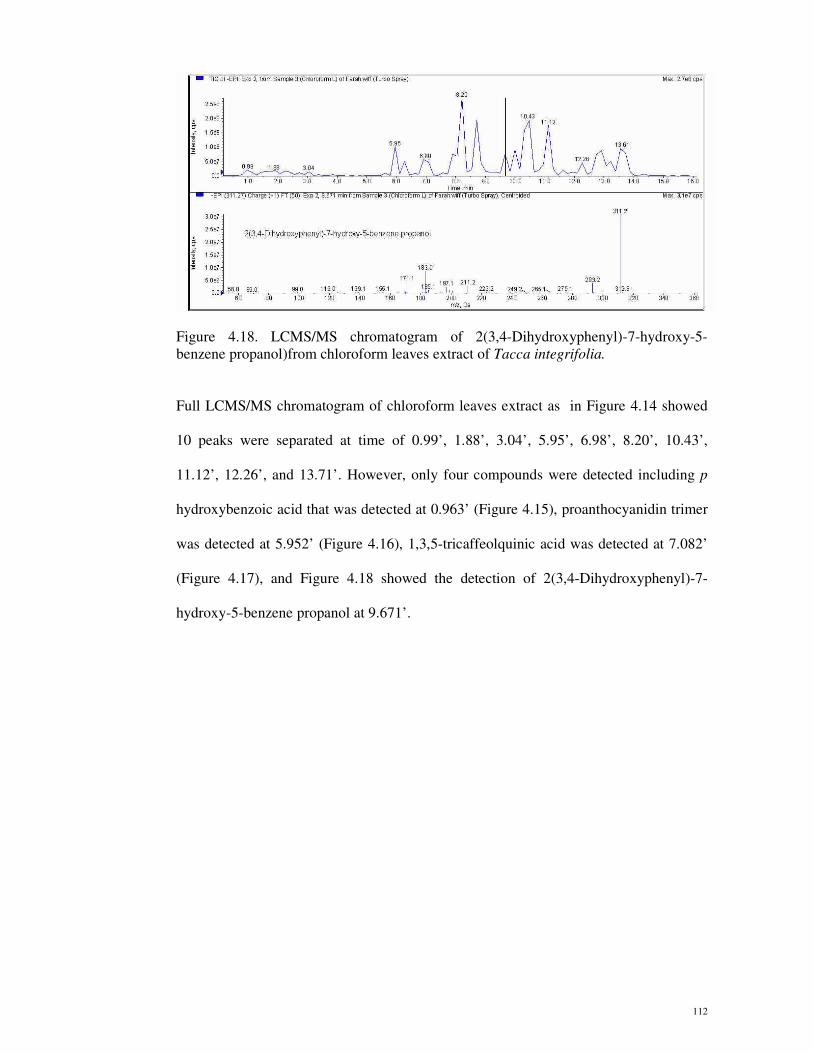
Figure 4.18. LCMS/MS chromatogram of 2(3,4-Dihydroxyphenyl)-7-hydroxy-5-
benzene propanol)from chloroform leaves extract of Tacca integrifolia.
Full LCMS/MS chromatogram of chloroform leaves extract as in Figure 4.14 showed
10 peaks were separated at time of 0.99’, 1.88’, 3.04’, 5.95’, 6.98’, 8.20’, 10.43’,
11.12’, 12.26’, and 13.71’. However, only four compounds were detected including p
hydroxybenzoic acid that was detected at 0.963’ (Figure 4.15), proanthocyanidin trimer
was detected at 5.952’ (Figure 4.16), 1,3,5-tricaffeolquinic acid was detected at 7.082’
(Figure 4.17), and Figure 4.18 showed the detection of 2(3,4-Dihydroxyphenyl)-7-
hydroxy-5-benzene propanol at 9.671’.
113
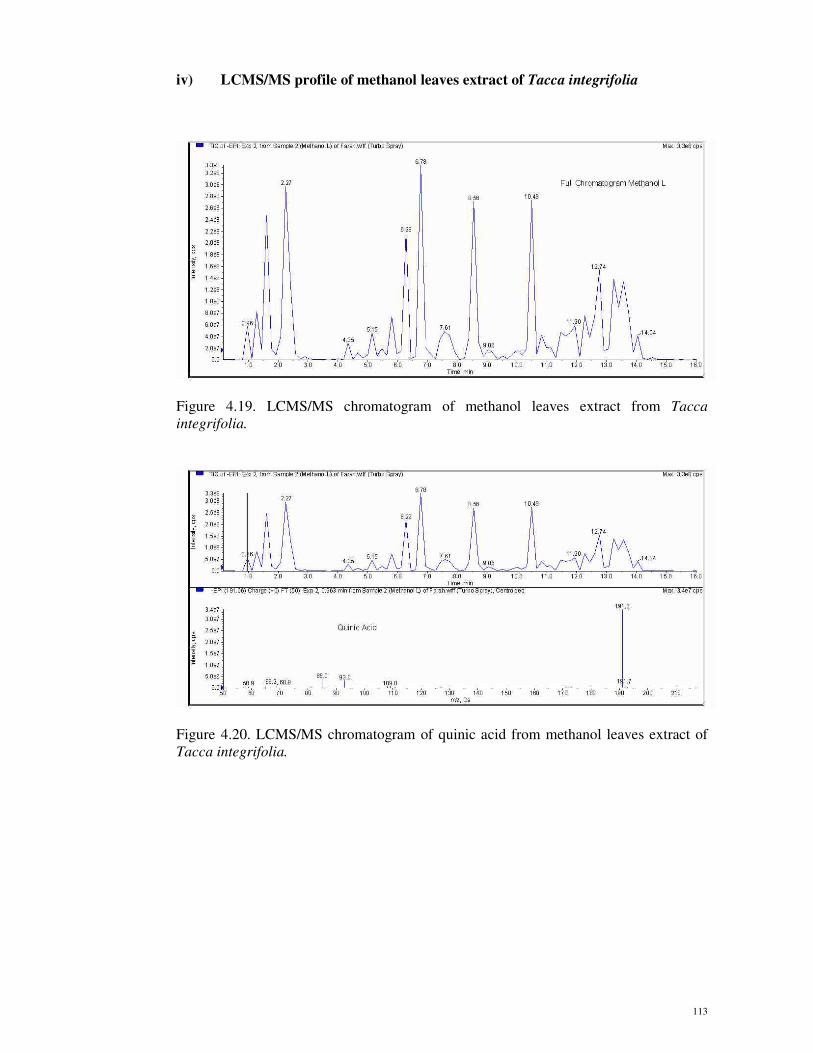
iv) LCMS/MS profile of methanol leaves extract of Tacca integrifolia
Figure 4.19. LCMS/MS chromatogram of methanol leaves extract from Tacca
integrifolia.
Figure 4.20. LCMS/MS chromatogram of quinic acid from methanol leaves extract of
Tacca integrifolia.
114
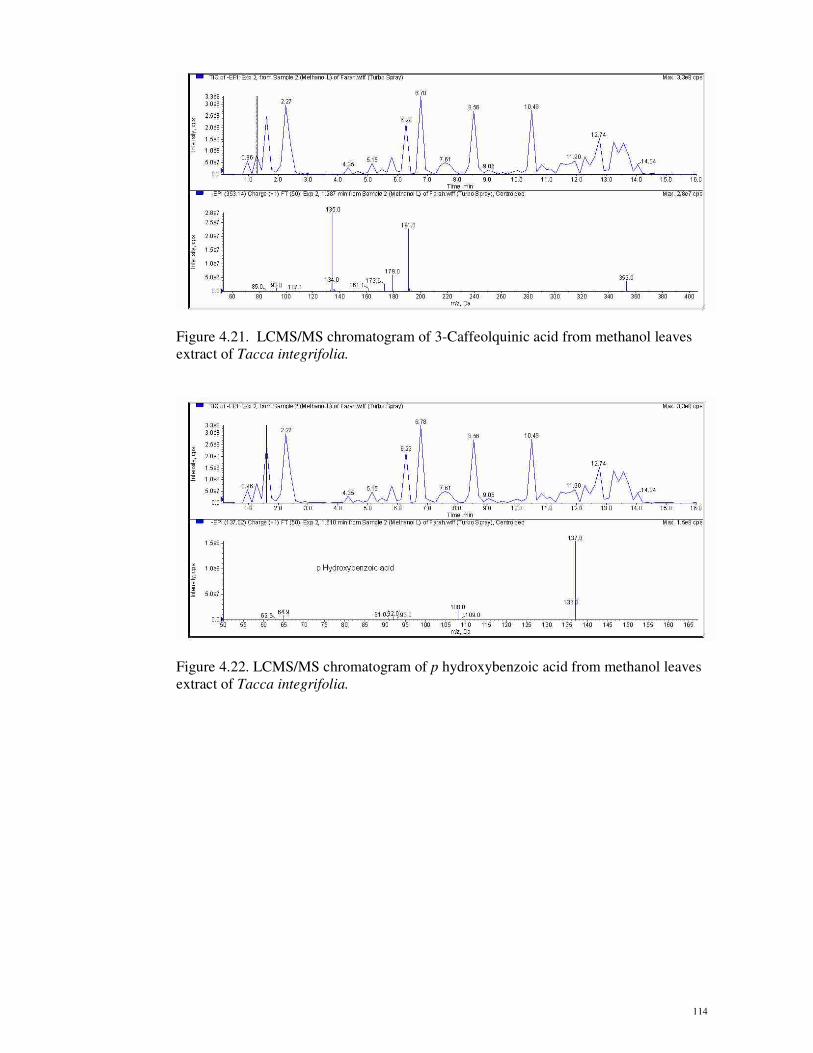
Figure 4.21. LCMS/MS chromatogram of 3-Caffeolquinic acid from methanol leaves
extract of Tacca integrifolia.
Figure 4.22. LCMS/MS chromatogram of p hydroxybenzoic acid from methanol leaves
extract of Tacca integrifolia.
115
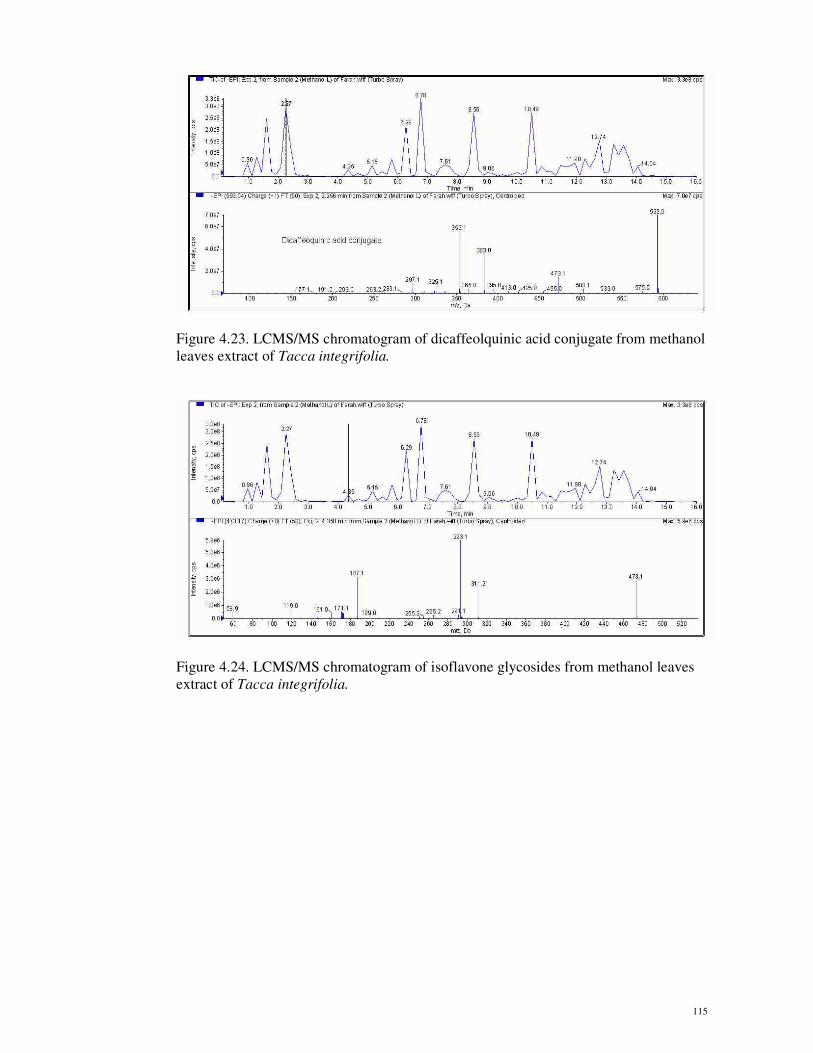
Figure 4.23. LCMS/MS chromatogram of dicaffeolquinic acid conjugate from methanol
leaves extract of Tacca integrifolia.
Figure 4.24. LCMS/MS chromatogram of isoflavone glycosides from methanol leaves
extract of Tacca integrifolia.
116
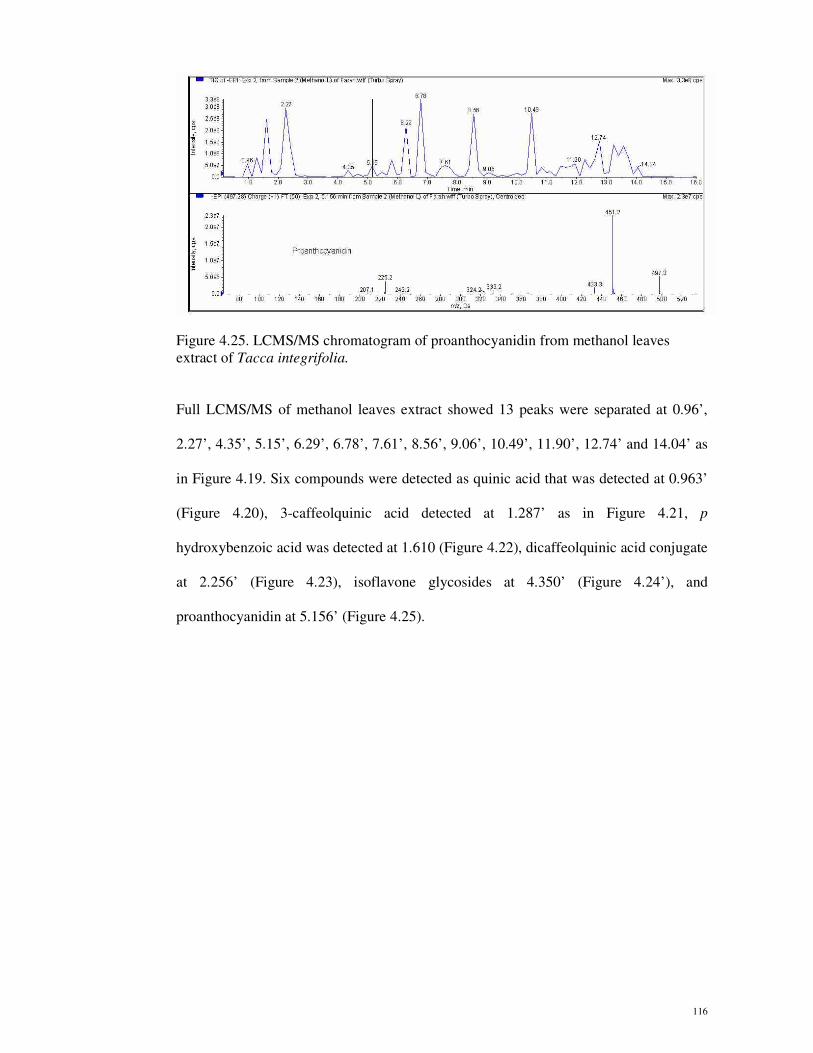
Figure 4.25. LCMS/MS chromatogram of proanthocyanidin from methanol leaves
extract of Tacca integrifolia.
Full LCMS/MS of methanol leaves extract showed 13 peaks were separated at 0.96’,
2.27’, 4.35’, 5.15’, 6.29’, 6.78’, 7.61’, 8.56’, 9.06’, 10.49’, 11.90’, 12.74’ and 14.04’ as
in Figure 4.19. Six compounds were detected as quinic acid that was detected at 0.963’
(Figure 4.20), 3-caffeolquinic acid detected at 1.287’ as in Figure 4.21, p
hydroxybenzoic acid was detected at 1.610 (Figure 4.22), dicaffeolquinic acid conjugate
at 2.256’ (Figure 4.23), isoflavone glycosides at 4.350’ (Figure 4.24’), and
proanthocyanidin at 5.156’ (Figure 4.25).
117
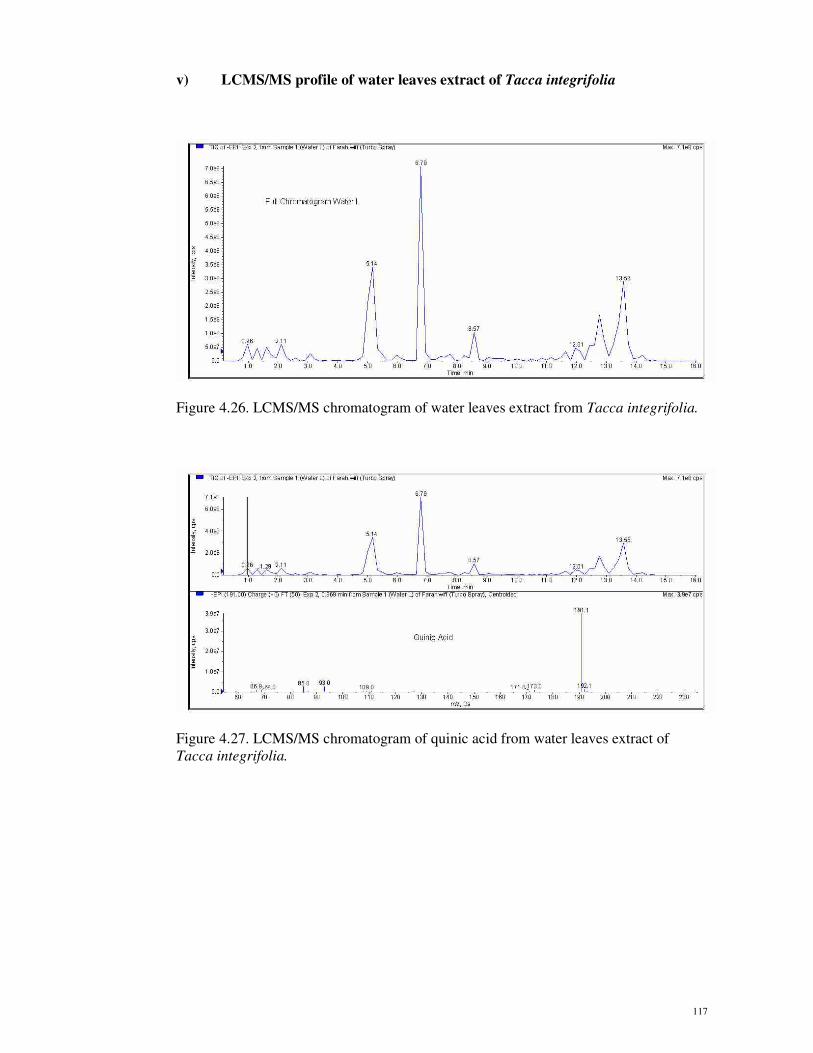
v) LCMS/MS profile of water leaves extract of Tacca integrifolia
Figure 4.26. LCMS/MS chromatogram of water leaves extract from Tacca integrifolia.
Figure 4.27. LCMS/MS chromatogram of quinic acid from water leaves extract of
Tacca integrifolia.

118
Figure 4.28. LCMS/MS chromatogram of protocatechuic acid from water leaves extract
of Tacca integrifolia.
Figure 4.29. LCMS/MS chromatogram of salicylic acid from water leaves extract of
Tacca integrifolia.
119
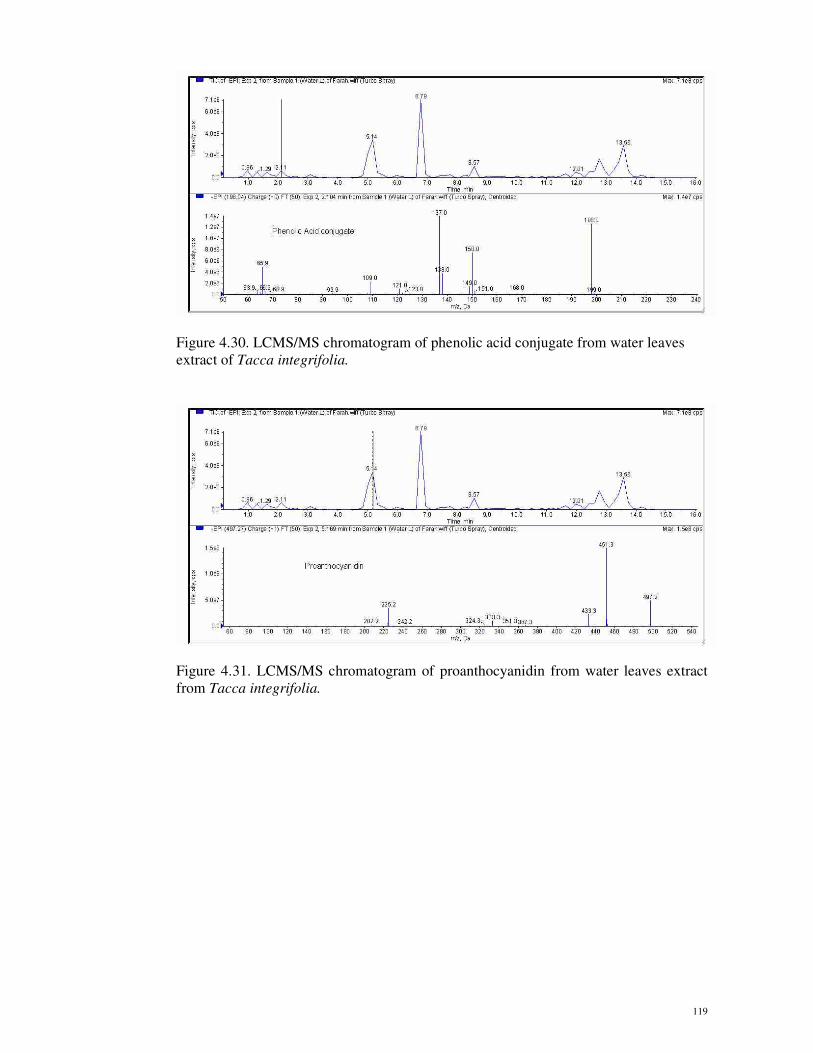
Figure 4.30. LCMS/MS chromatogram of phenolic acid conjugate from water leaves
extract of Tacca integrifolia.
Figure 4.31. LCMS/MS chromatogram of proanthocyanidin from water leaves extract
from Tacca integrifolia.
120
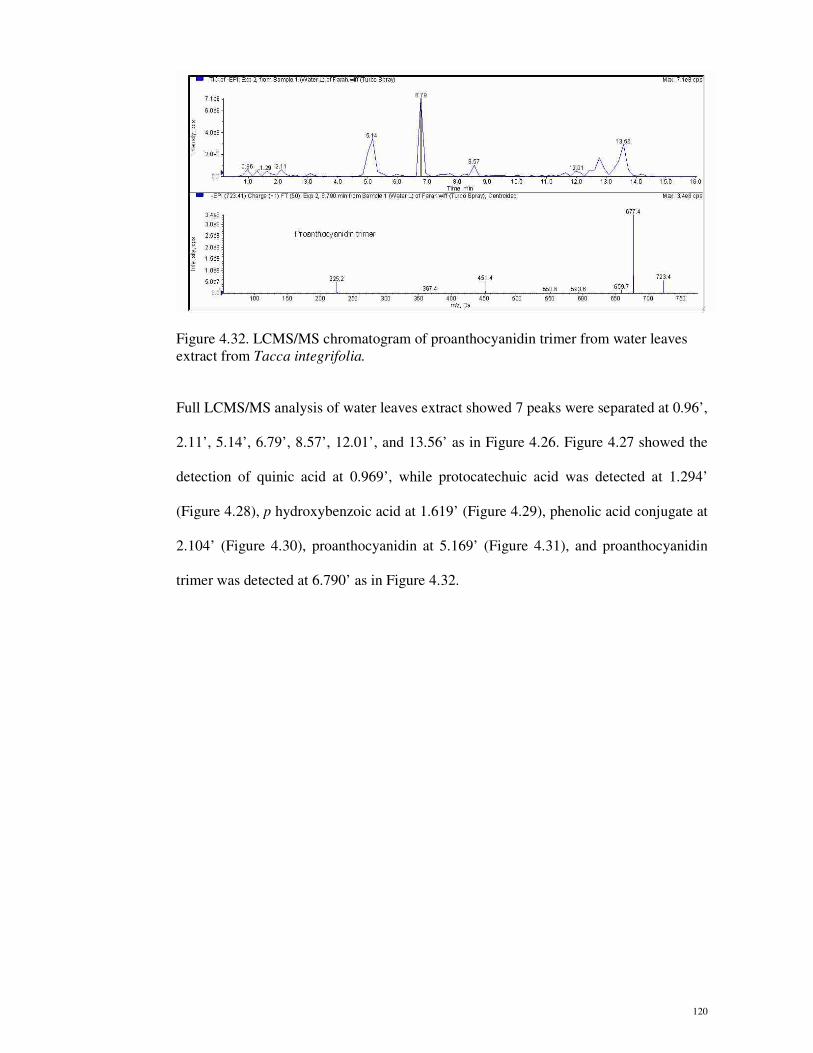
Figure 4.32. LCMS/MS chromatogram of proanthocyanidin trimer from water leaves
extract from Tacca integrifolia.
Full LCMS/MS analysis of water leaves extract showed 7 peaks were separated at 0.96’,
2.11’, 5.14’, 6.79’, 8.57’, 12.01’, and 13.56’ as in Figure 4.26. Figure 4.27 showed the
detection of quinic acid at 0.969’, while protocatechuic acid was detected at 1.294’
(Figure 4.28), p hydroxybenzoic acid at 1.619’ (Figure 4.29), phenolic acid conjugate at
2.104’ (Figure 4.30), proanthocyanidin at 5.169’ (Figure 4.31), and proanthocyanidin
trimer was detected at 6.790’ as in Figure 4.32.
121
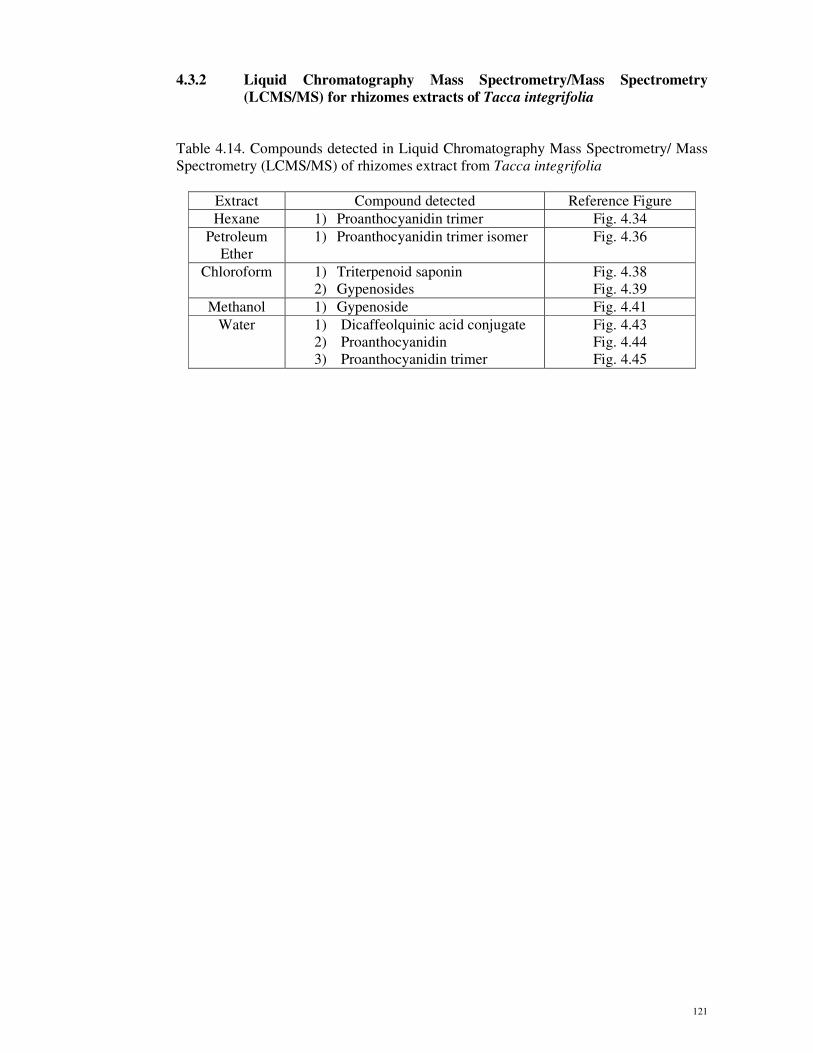
4.3.2 Liquid Chromatography Mass Spectrometry/Mass Spectrometry
(LCMS/MS) for rhizomes extracts of Tacca integrifolia
Table 4.14. Compounds detected in Liquid Chromatography Mass Spectrometry/ Mass
Spectrometry (LCMS/MS) of rhizomes extract from Tacca integrifolia
Extract Compound detected Reference Figure
Hexane 1) Proanthocyanidin trimer Fig. 4.34
Petroleum
Ether
1) Proanthocyanidin trimer isomer Fig. 4.36
Chloroform 1) Triterpenoid saponin
2) Gypenosides
Fig. 4.38
Fig. 4.39
Methanol 1) Gypenoside Fig. 4.41
Water 1) Dicaffeolquinic acid conjugate
2) Proanthocyanidin
3) Proanthocyanidin trimer
Fig. 4.43
Fig. 4.44
Fig. 4.45
122
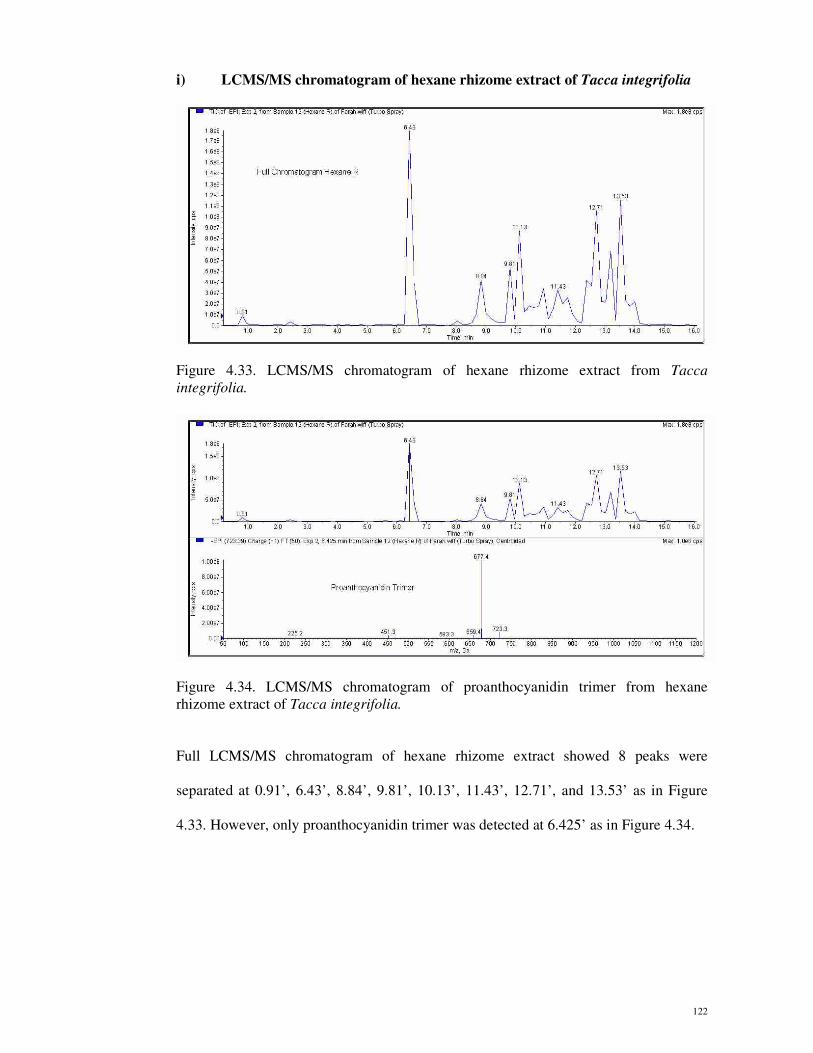
i) LCMS/MS chromatogram of hexane rhizome extract of Tacca integrifolia
Figure 4.33. LCMS/MS chromatogram of hexane rhizome extract from Tacca
integrifolia.
Figure 4.34. LCMS/MS chromatogram of proanthocyanidin trimer from hexane
rhizome extract of Tacca integrifolia.
Full LCMS/MS chromatogram of hexane rhizome extract showed 8 peaks were
separated at 0.91’, 6.43’, 8.84’, 9.81’, 10.13’, 11.43’, 12.71’, and 13.53’ as in Figure
4.33. However, only proanthocyanidin trimer was detected at 6.425’ as in Figure 4.34.
123
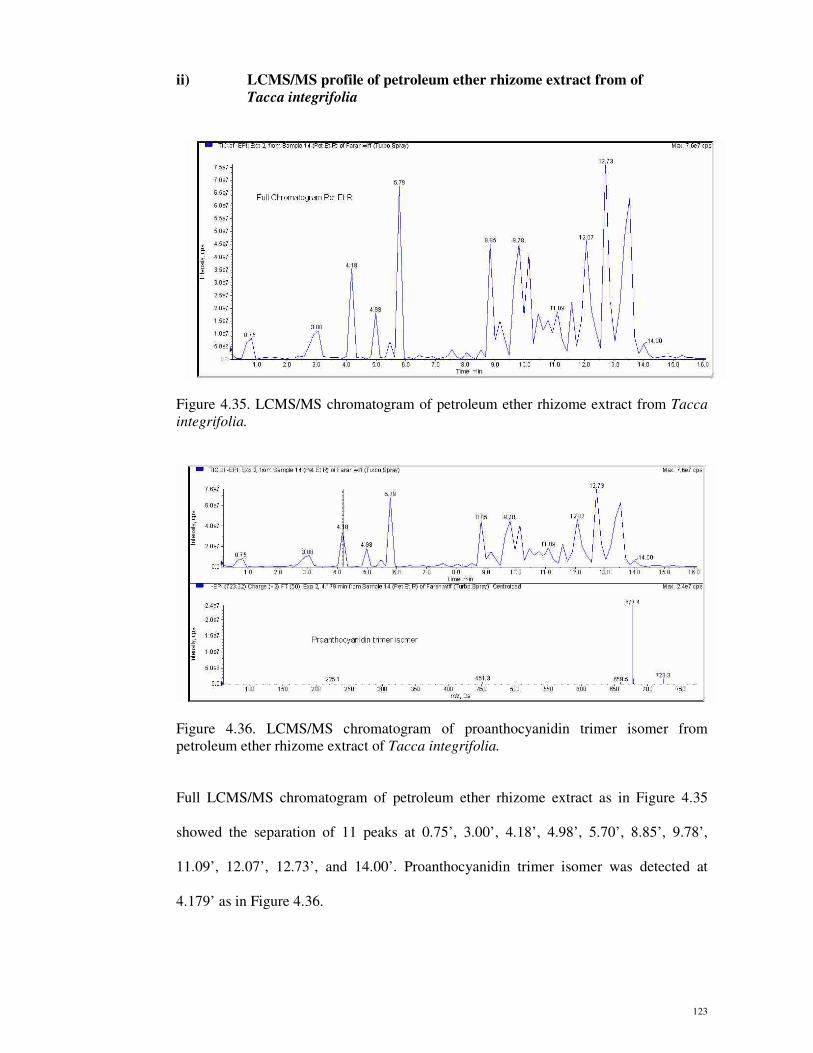
ii) LCMS/MS profile of petroleum ether rhizome extract from of
Tacca integrifolia
Figure 4.35. LCMS/MS chromatogram of petroleum ether rhizome extract from Tacca
integrifolia.
Figure 4.36. LCMS/MS chromatogram of proanthocyanidin trimer isomer from
petroleum ether rhizome extract of Tacca integrifolia.
Full LCMS/MS chromatogram of petroleum ether rhizome extract as in Figure 4.35
showed the separation of 11 peaks at 0.75’, 3.00’, 4.18’, 4.98’, 5.70’, 8.85’, 9.78’,
11.09’, 12.07’, 12.73’, and 14.00’. Proanthocyanidin trimer isomer was detected at
4.179’ as in Figure 4.36.
124
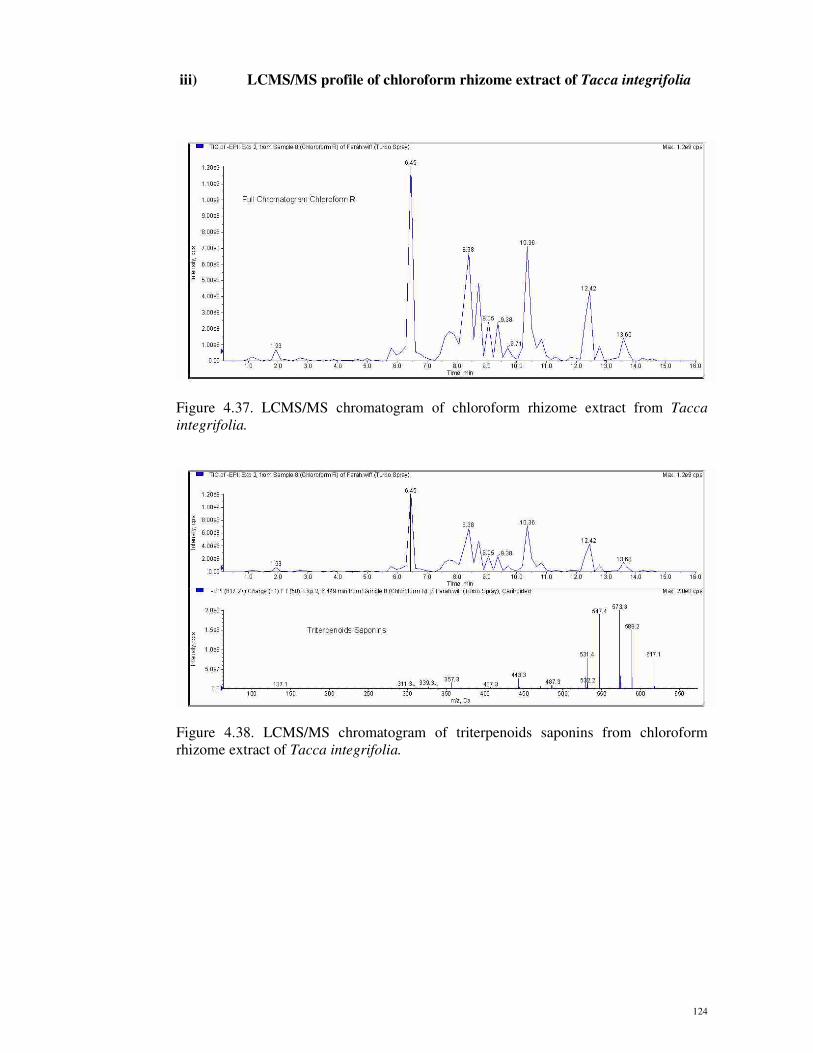
iii) LCMS/MS profile of chloroform rhizome extract of Tacca integrifolia
Figure 4.37. LCMS/MS chromatogram of chloroform rhizome extract from Tacca
integrifolia.
Figure 4.38. LCMS/MS chromatogram of triterpenoids saponins from chloroform
rhizome extract of Tacca integrifolia.
125
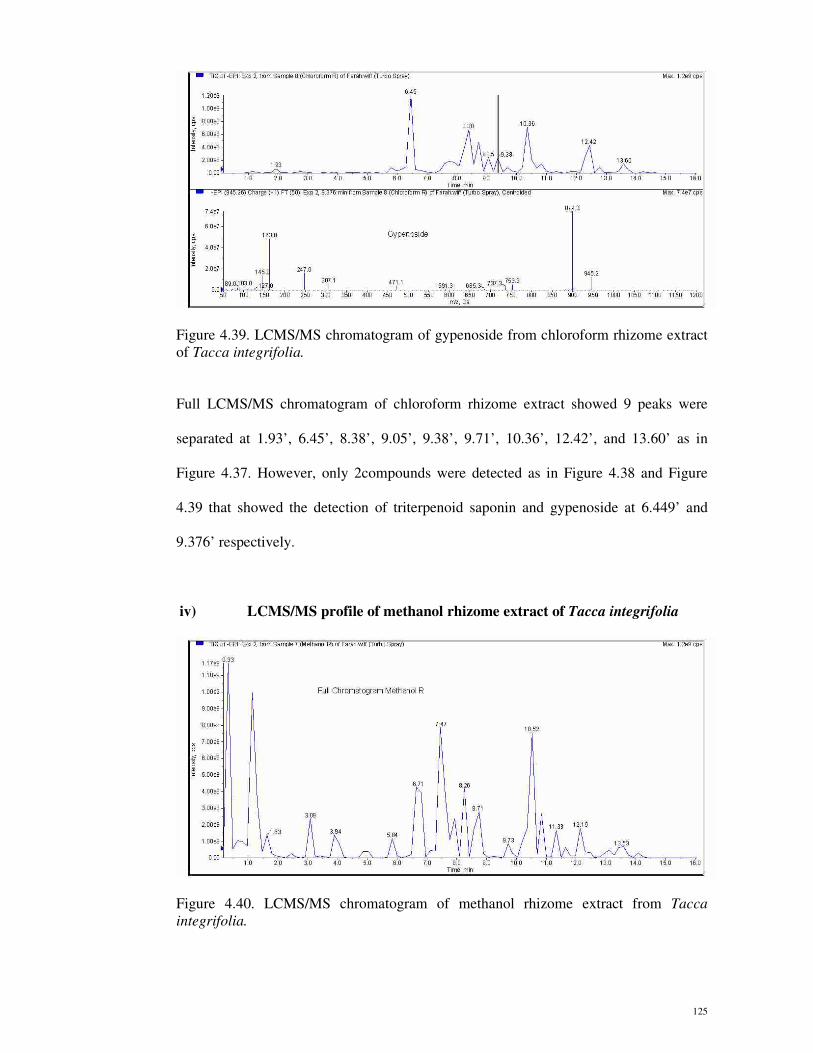
Figure 4.39. LCMS/MS chromatogram of gypenoside from chloroform rhizome extract
of Tacca integrifolia.
Full LCMS/MS chromatogram of chloroform rhizome extract showed 9 peaks were
separated at 1.93’, 6.45’, 8.38’, 9.05’, 9.38’, 9.71’, 10.36’, 12.42’, and 13.60’ as in
Figure 4.37. However, only 2compounds were detected as in Figure 4.38 and Figure
4.39 that showed the detection of triterpenoid saponin and gypenoside at 6.449’ and
9.376’ respectively.
iv) LCMS/MS profile of methanol rhizome extract of Tacca integrifolia
Figure 4.40. LCMS/MS chromatogram of methanol rhizome extract from Tacca
integrifolia.
126
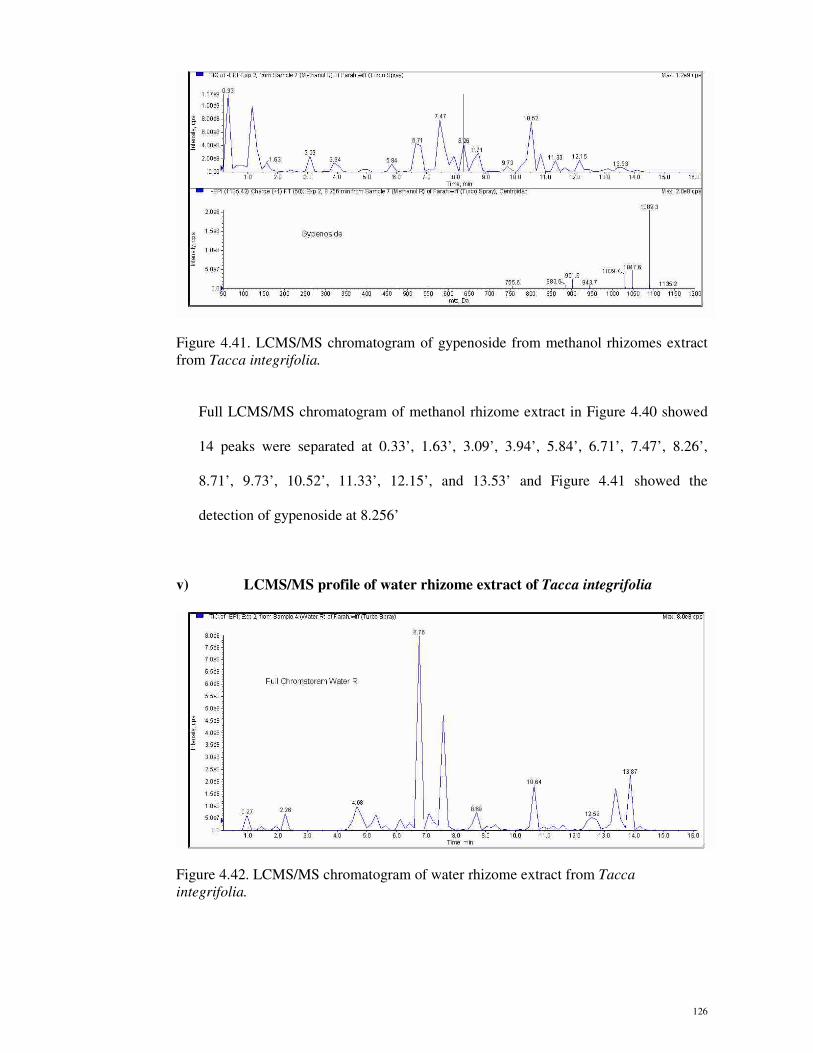
Figure 4.41. LCMS/MS chromatogram of gypenoside from methanol rhizomes extract
from Tacca integrifolia.
Full LCMS/MS chromatogram of methanol rhizome extract in Figure 4.40 showed
14 peaks were separated at 0.33’, 1.63’, 3.09’, 3.94’, 5.84’, 6.71’, 7.47’, 8.26’,
8.71’, 9.73’, 10.52’, 11.33’, 12.15’, and 13.53’ and Figure 4.41 showed the
detection of gypenoside at 8.256’
v) LCMS/MS profile of water rhizome extract of Tacca integrifolia
Figure 4.42. LCMS/MS chromatogram of water rhizome extract from Tacca
integrifolia.
127
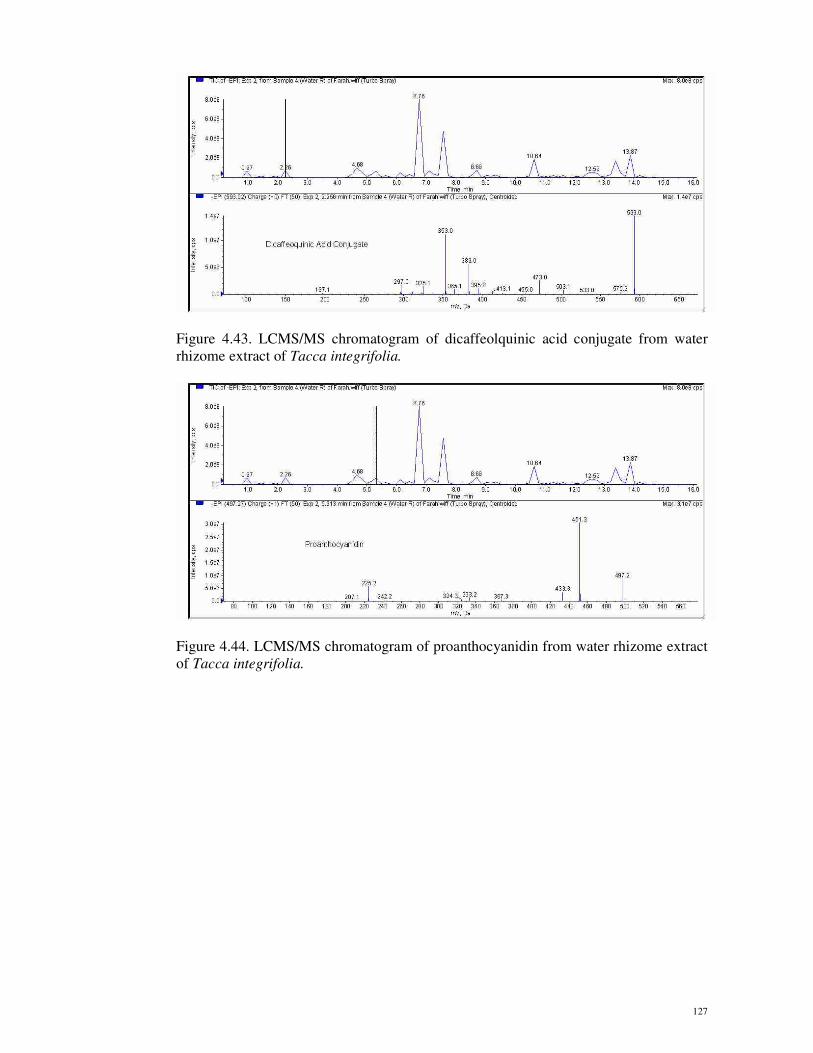
Figure 4.43. LCMS/MS chromatogram of dicaffeolquinic acid conjugate from water
rhizome extract of Tacca integrifolia.
Figure 4.44. LCMS/MS chromatogram of proanthocyanidin from water rhizome extract
of Tacca integrifolia.
128
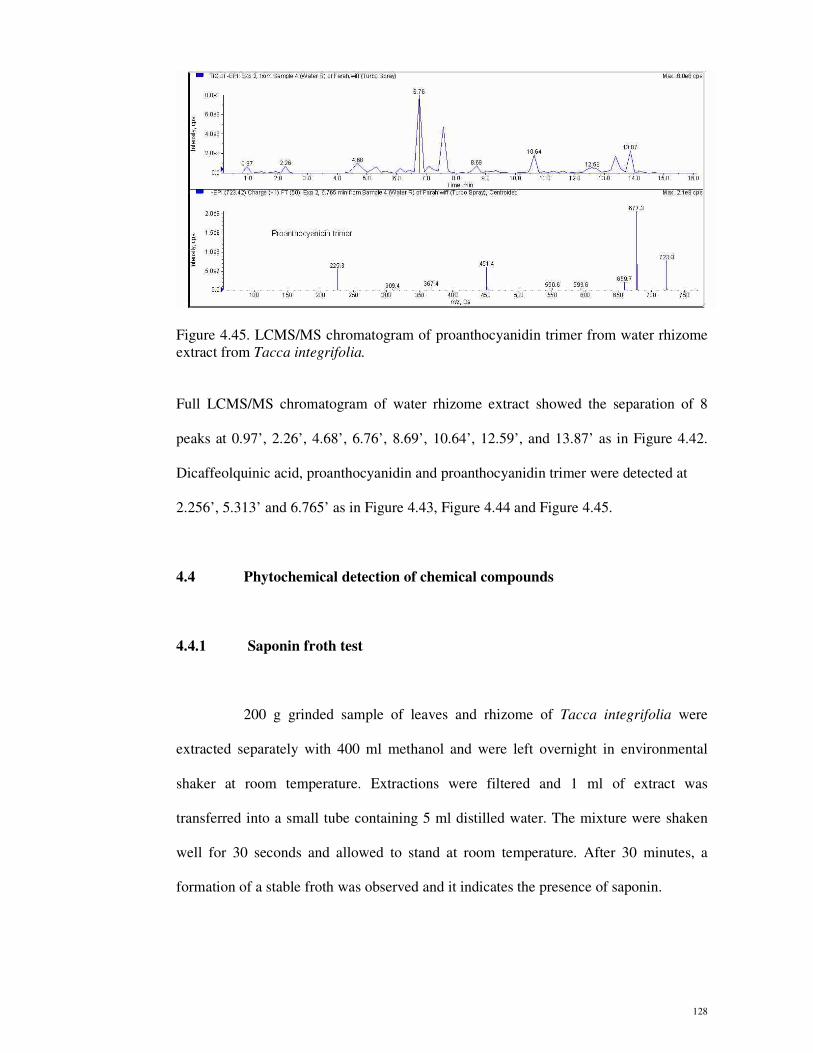
Figure 4.45. LCMS/MS chromatogram of proanthocyanidin trimer from water rhizome
extract from Tacca integrifolia.
Full LCMS/MS chromatogram of water rhizome extract showed the separation of 8
peaks at 0.97’, 2.26’, 4.68’, 6.76’, 8.69’, 10.64’, 12.59’, and 13.87’ as in Figure 4.42.
Dicaffeolquinic acid, proanthocyanidin and proanthocyanidin trimer were detected at
2.256’, 5.313’ and 6.765’ as in Figure 4.43, Figure 4.44 and Figure 4.45.
4.4 Phytochemical detection of chemical compounds
4.4.1 Saponin froth test
200 g grinded sample of leaves and rhizome of Tacca integrifolia were
extracted separately with 400 ml methanol and were left overnight in environmental
shaker at room temperature. Extractions were filtered and 1 ml of extract was
transferred into a small tube containing 5 ml distilled water. The mixture were shaken
well for 30 seconds and allowed to stand at room temperature. After 30 minutes, a
formation of a stable froth was observed and it indicates the presence of saponin.
129
Table 4.15. Saponin froth test
Sample Froth
Leaves methanol extract +ve
Rhizome methanol extract +ve
4.4.2 Tannin and phenolic compounds
200 g grinded sample of leaves and rhizome of Tacca integrifolia were
extracted separately with 400 ml methanol and left overnight in environmental shaker at
room temperature. 2 ml of filtered sample were transferred into test tube separately.
Each test tube was added with 6 drops of 1 % FeCl3. Changes in colour for each extract
were observed.
Table 4.16. Colour changes in tannin and phenolic compound test
Sample Colour changes
Leaves methanol extract Green � dark green
Rhizome methanol extract Light yellow � yellow
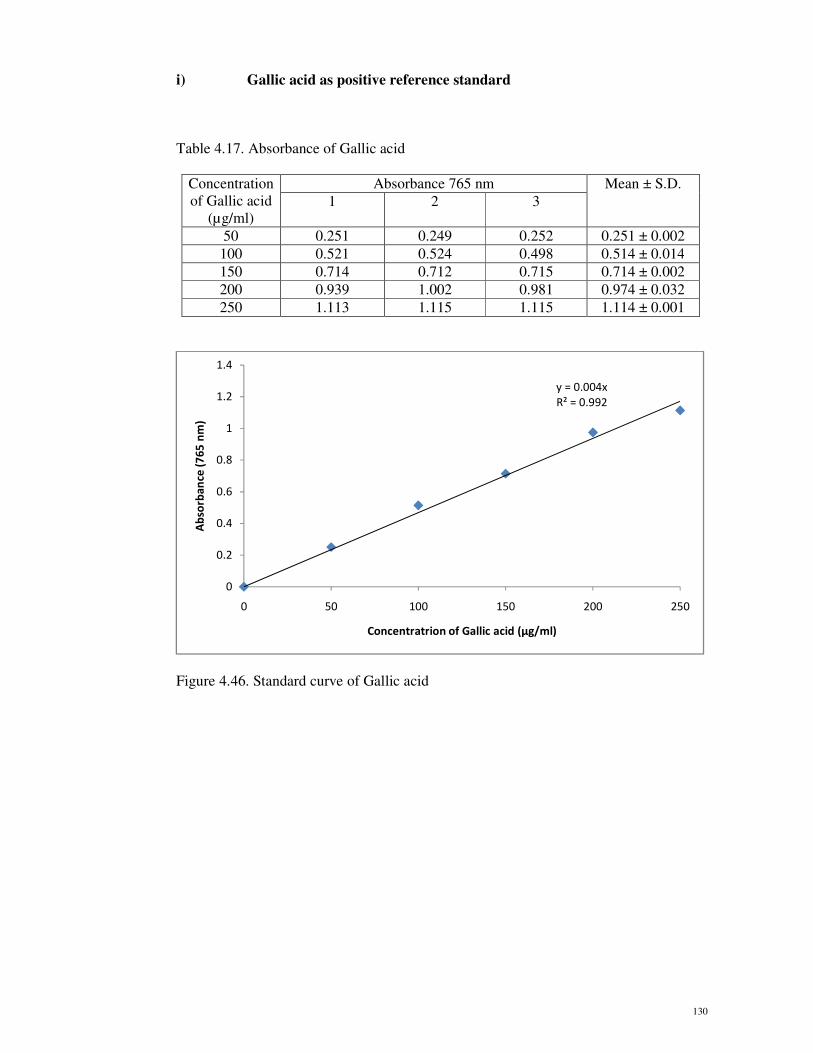
4.5 Determination of Total Phenol Contents
Total phenol content in hexane, petroleum ether, chloroform, methanol and
water extracts from leaves and rhizome of Tacca integrifolia were determined using
standard curve of Gallic acid as positive reference standard. The total phenol content of
each extracts were measured by using equation obtain from the standard curve as
showed in Figure 4.46 while Table 4.18 and 4.19 showed the total phenolic contents of
hexane, petroleum ether, chloroform, methanol and water extracts from the leaves and
rhizomes of Tacca integrifolia.
130
i) Gallic acid as positive reference standard
Table 4.17. Absorbance of Gallic acid
Concentration
of Gallic acid
(µg/ml)
Absorbance 765 nm Mean ± S.D.
1 2 3
50 0.251 0.249 0.252 0.251 ± 0.002
100 0.521 0.524 0.498 0.514 ± 0.014
150 0.714 0.712 0.715 0.714 ± 0.002
200 0.939 1.002 0.981 0.974 ± 0.032
250 1.113 1.115 1.115 1.114 ± 0.001
Figure 4.46. Standard curve of Gallic acid
y = 0.004x
R² = 0.992
0
0.2
0.4
0.6
0.8
1
1.2
1.4
0 50 100 150 200 250
Ab
sorb
an
ce (
76
5 n
m)
Concentratrion of Gallic acid (µg/ml)

131
ii) Total phenolic content of leaves extracts of Tacca integrifolia
Table 4.18. Total phenolic content from leaves extract of Tacca integrifolia
Sample
(2500µg/ml)
Absorbance 765 nm Mean ± SD Total
phenolic
content
(mgGAE/g)
1 2 3
Hexane
extract
0.083 0.080 0.081 0.081 ± 0.002 44.6
Petroleum
ether extract
0.192 0.194 0.190 0.192 ± 0.002 105.7
Chloroform
extract
0.526 0.528 0.525 0.526 ± 0.002 288.6
Methanol
extract
0.127 0.128 0.125 0.127 ± 0.002 69.8
Water
extract
1.446 1.449 1.443 1.446 ± 0.003 792.7
At the concentration of (2500µg/ml), leaves water extract of Tacca integrifolia showed
the highest concentration of phenolic compound (792.7mgGAE/g) followed by leaves
chloroform extract (288.6mgGAE/g), leaves petroleum extract (105.7 mgGAE/g),
leaves methanol extract (69.8 mgGAE/g) and leaves hexane extract (44.6 mgGAE/g).
iii) Total phenolic content from rhizome extract of Tacca integrifolia
Table 4.19. Total phenolic content from rhizome extract of Tacca integrifolia
Sample
(2500µg/ml)
Absorbance 765 nm Mean ± SD Total
phenolic
content
(mgGAE/g)
1 2 3
Hexane
extract
0.239 0.237 0.236 0.237 ± 0.002 130.3
Petroleum
ether extract
0.073 0.069 0.071 0.071 ± 0.002 38.9
Chloroform
extract
0.153 0.157 0.158 0.156 ± 0.003 84.9
Methanol
extract
0.106 0.118 0.119 0.114 ± 0.007 61.3
Water
extract
0.642 0.641 0.639 0.641 ± 0.002 350.8
132
At the concentration of (2500µg/ml), rhizome water extract of Tacca integrifolia
showed the highest concentration of phenolic compound (350.8 mgGAE/g) followed by
rhizome hexane extract (130.3 mgGAE/g), rhizome chloroform extract (84.9
mgGAE/g), rhizome methanol extract (61.3 mgGAE/g) and rhizome petroleum ether
extract (38.9 mgGAE/g).
4.6 Determination of Total flavonoid contents
i. Quercetin as Positive Reference Standard
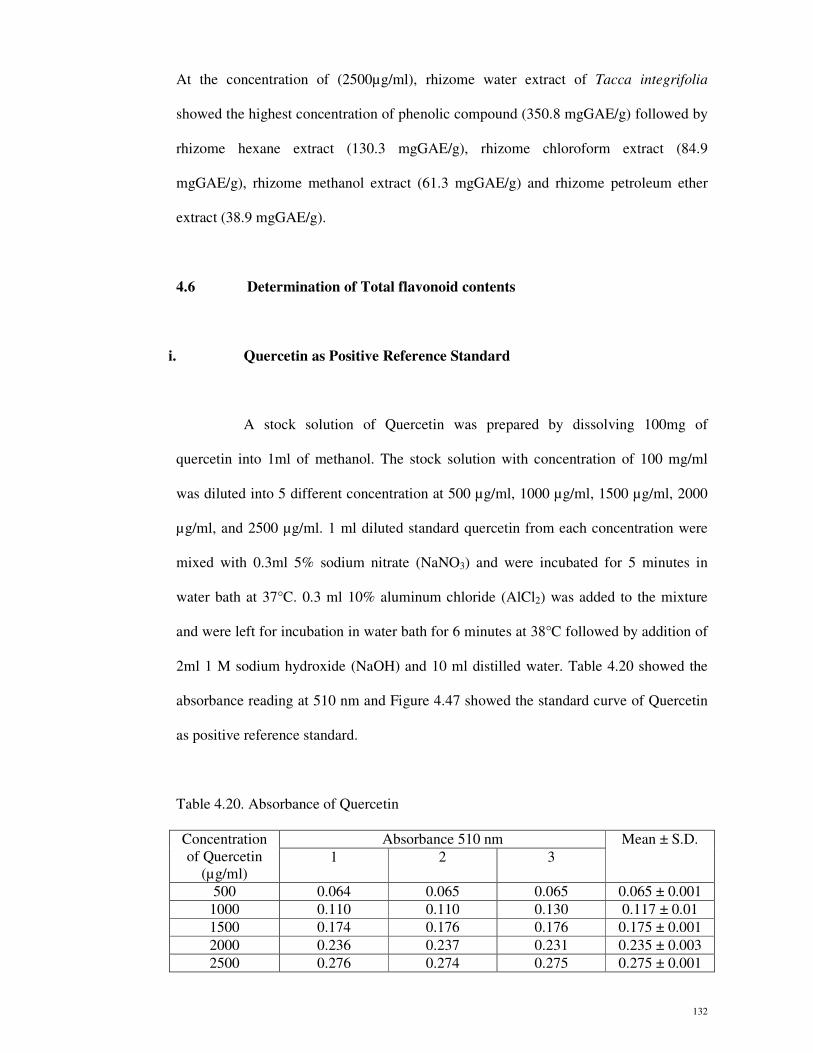
A stock solution of Quercetin was prepared by dissolving 100mg of
quercetin into 1ml of methanol. The stock solution with concentration of 100 mg/ml
was diluted into 5 different concentration at 500 µg/ml, 1000 µg/ml, 1500 µg/ml, 2000
µg/ml, and 2500 µg/ml. 1 ml diluted standard quercetin from each concentration were
mixed with 0.3ml 5% sodium nitrate (NaNO3) and were incubated for 5 minutes in
water bath at 37°C. 0.3 ml 10% aluminum chloride (AlCl2) was added to the mixture
and were left for incubation in water bath for 6 minutes at 38°C followed by addition of
2ml 1 M sodium hydroxide (NaOH) and 10 ml distilled water. Table 4.20 showed the
absorbance reading at 510 nm and Figure 4.47 showed the standard curve of Quercetin
as positive reference standard.
Table 4.20. Absorbance of Quercetin
Concentration
of Quercetin
(µg/ml)
Absorbance 510 nm Mean ± S.D.
1 2 3
500 0.064 0.065 0.065 0.065 ± 0.001
1000 0.110 0.110 0.130 0.117 ± 0.01
1500 0.174 0.176 0.176 0.175 ± 0.001
2000 0.236 0.237 0.231 0.235 ± 0.003
2500 0.276 0.274 0.275 0.275 ± 0.001
133
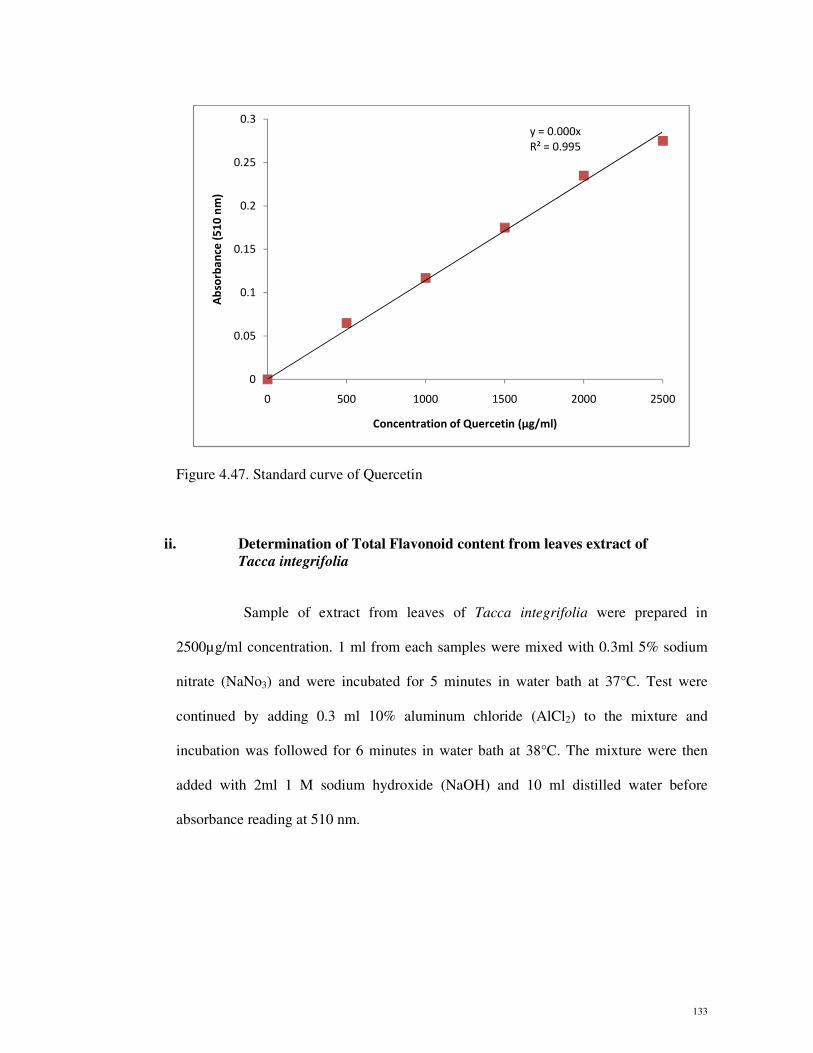
Figure 4.47. Standard curve of Quercetin
ii. Determination of Total Flavonoid content from leaves extract of
Tacca integrifolia
Sample of extract from leaves of Tacca integrifolia were prepared in
2500µg/ml concentration. 1 ml from each samples were mixed with 0.3ml 5% sodium
nitrate (NaNo3) and were incubated for 5 minutes in water bath at 37°C. Test were
continued by adding 0.3 ml 10% aluminum chloride (AlCl2) to the mixture and
incubation was followed for 6 minutes in water bath at 38°C. The mixture were then
added with 2ml 1 M sodium hydroxide (NaOH) and 10 ml distilled water before
absorbance reading at 510 nm.
y = 0.000x
R² = 0.995
0
0.05
0.1
0.15
0.2
0.25
0.3
0 500 1000 1500 2000 2500
Ab
sorb
an
ce (
51
0 n
m)
Concentration of Quercetin (µg/ml)

134
Table 4.21. Total flavonoid content from leaves extract of Tacca integrifolia
Sample
(2500µg/ml)
Absorbance 765 nm Total
flavonoid
content
(mgQE/g)
1 2 3 Mean ± SD
Hexane
extract
0.36 0.41 0.38 0.38 ± 0.025 266.9
Petroleum
ether extract
0.53 0.53 0.53 0.53 ± 0.002 376.7
Chloroform
extract
0.49 0.49 0.49 0.49 ± 0.001 242.5
Methanol
extract
0.22 0.22 0.22 0.22 ± 0.002 154.1
Water
extract
0.12 0.12 0.12 0.12 ± 0.002 89.5
Leaves petroleum ether extract showed the highest concentration of total flavonoid
content (376.7mgQE/g) followed by leaves hexane extract (266.9mgQE/g), leaves
chloroform extract (242.5mgQE/g), leaves methanol extract (154.1mgQE/g) and leaves
water extract (89.5mgQE/g).
iii. Determination of Total Flavonoid content from rhizomes extract of
Tacca integrifolia
Extract from rhizome of Tacca integrifolia were prepared at 2500µg/ml.
Experiment was initially started by adding 1 ml sample with 0.3ml 5% sodium nitrate
(NaNo3). The mixture were left for 5 minutes in water bath at 37°C followed by
addition of 0.3 ml 10% aluminum chloride (AlCl2). The mixtures again were left
incubated in water bath for 6 minutes at 38°C. 2ml 1 M sodium hydroxide (NaOH) and
10 ml distilled water was added to the mixture before absorbance was read at 510 nm.
135
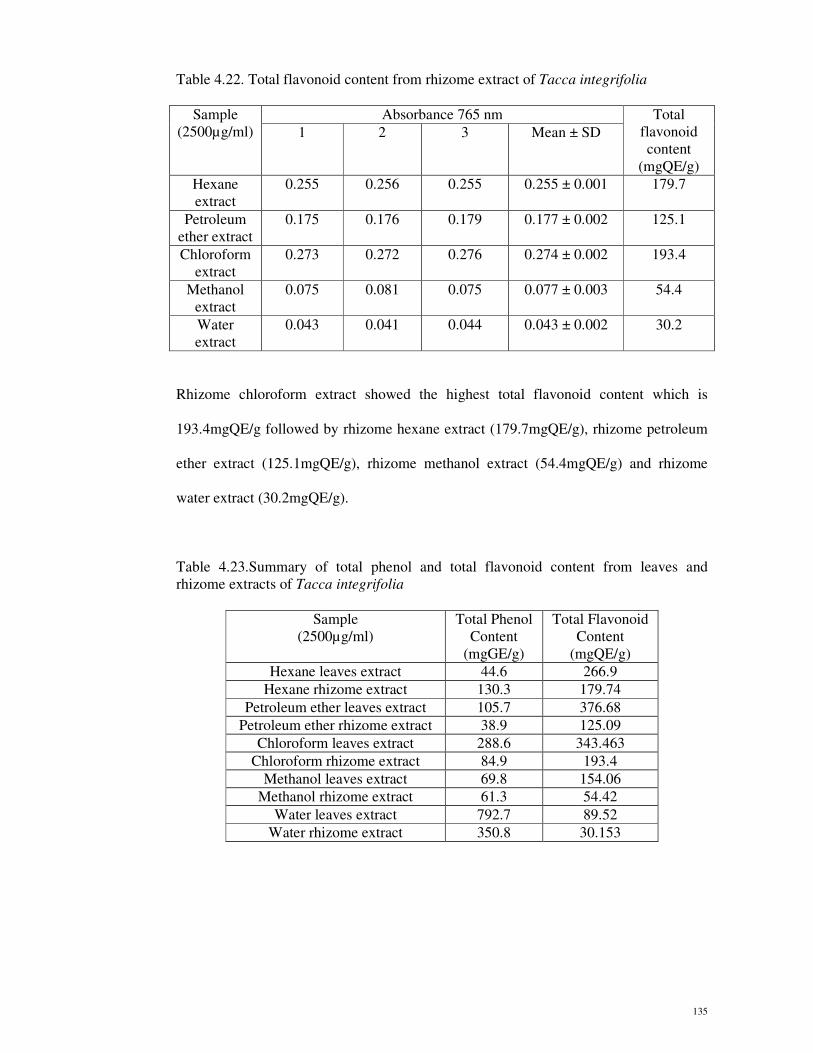
Table 4.22. Total flavonoid content from rhizome extract of Tacca integrifolia
Sample
(2500µg/ml)
Absorbance 765 nm Total
flavonoid
content
(mgQE/g)
1 2 3 Mean ± SD
Hexane
extract
0.255 0.256 0.255 0.255 ± 0.001 179.7
Petroleum
ether extract
0.175 0.176 0.179 0.177 ± 0.002 125.1
Chloroform
extract
0.273 0.272 0.276 0.274 ± 0.002 193.4
Methanol
extract
0.075 0.081 0.075 0.077 ± 0.003 54.4
Water
extract
0.043 0.041 0.044 0.043 ± 0.002 30.2
Rhizome chloroform extract showed the highest total flavonoid content which is
193.4mgQE/g followed by rhizome hexane extract (179.7mgQE/g), rhizome petroleum
ether extract (125.1mgQE/g), rhizome methanol extract (54.4mgQE/g) and rhizome
water extract (30.2mgQE/g).
Table 4.23.Summary of total phenol and total flavonoid content from leaves and
rhizome extracts of Tacca integrifolia
Sample
(2500µg/ml)
Total Phenol
Content
(mgGE/g)
Total Flavonoid
Content
(mgQE/g)
Hexane leaves extract 44.6 266.9
Hexane rhizome extract 130.3 179.74
Petroleum ether leaves extract 105.7 376.68
Petroleum ether rhizome extract 38.9 125.09
Chloroform leaves extract 288.6 343.463
Chloroform rhizome extract 84.9 193.4
Methanol leaves extract 69.8 154.06
Methanol rhizome extract 61.3 54.42
Water leaves extract 792.7 89.52
Water rhizome extract 350.8 30.153
136
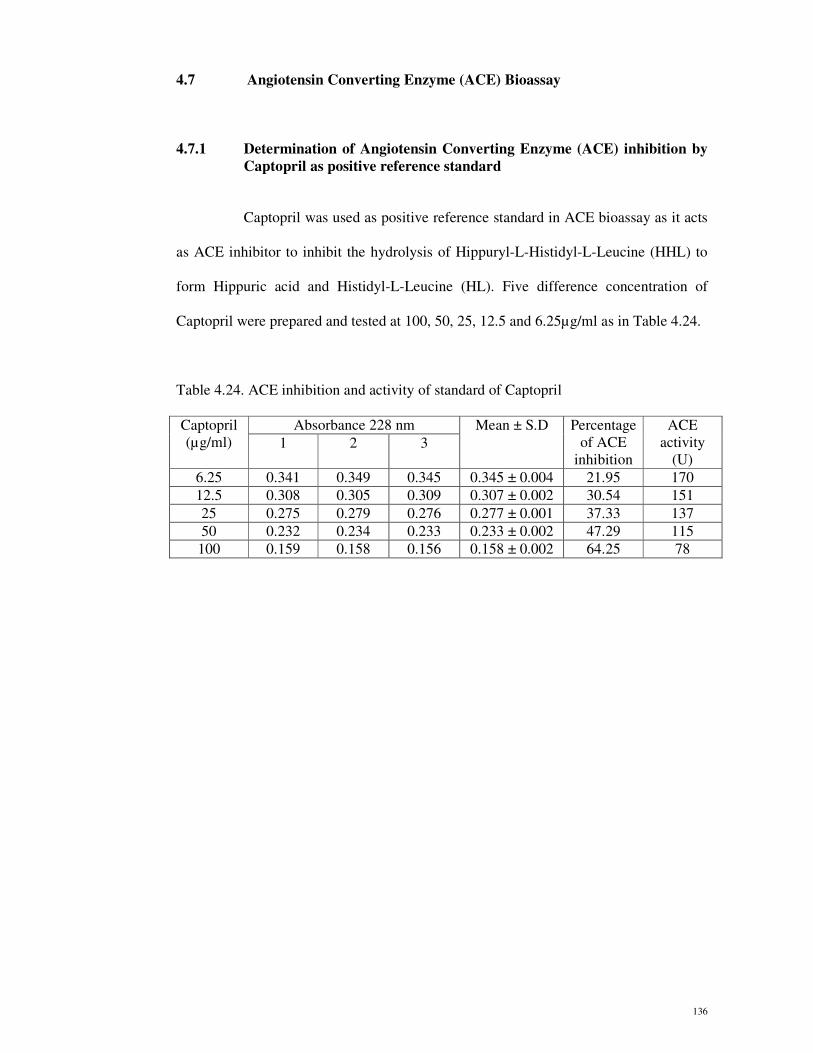
4.7 Angiotensin Converting Enzyme (ACE) Bioassay
4.7.1 Determination of Angiotensin Converting Enzyme (ACE) inhibition by
Captopril as positive reference standard
Captopril was used as positive reference standard in ACE bioassay as it acts
as ACE inhibitor to inhibit the hydrolysis of Hippuryl-L-Histidyl-L-Leucine (HHL) to
form Hippuric acid and Histidyl-L-Leucine (HL). Five difference concentration of
Captopril were prepared and tested at 100, 50, 25, 12.5 and 6.25µg/ml as in Table 4.24.
Table 4.24. ACE inhibition and activity of standard of Captopril
Captopril
(µg/ml)
Absorbance 228 nm Mean ± S.D Percentage
of ACE
inhibition
ACE
activity
(U) 1 2 3
6.25 0.341 0.349 0.345 0.345 ± 0.004 21.95 170
12.5 0.308 0.305 0.309 0.307 ± 0.002 30.54 151
25 0.275 0.279 0.276 0.277 ± 0.001 37.33 137
50 0.232 0.234 0.233 0.233 ± 0.002 47.29 115
100 0.159 0.158 0.156 0.158 ± 0.002 64.25 78
137
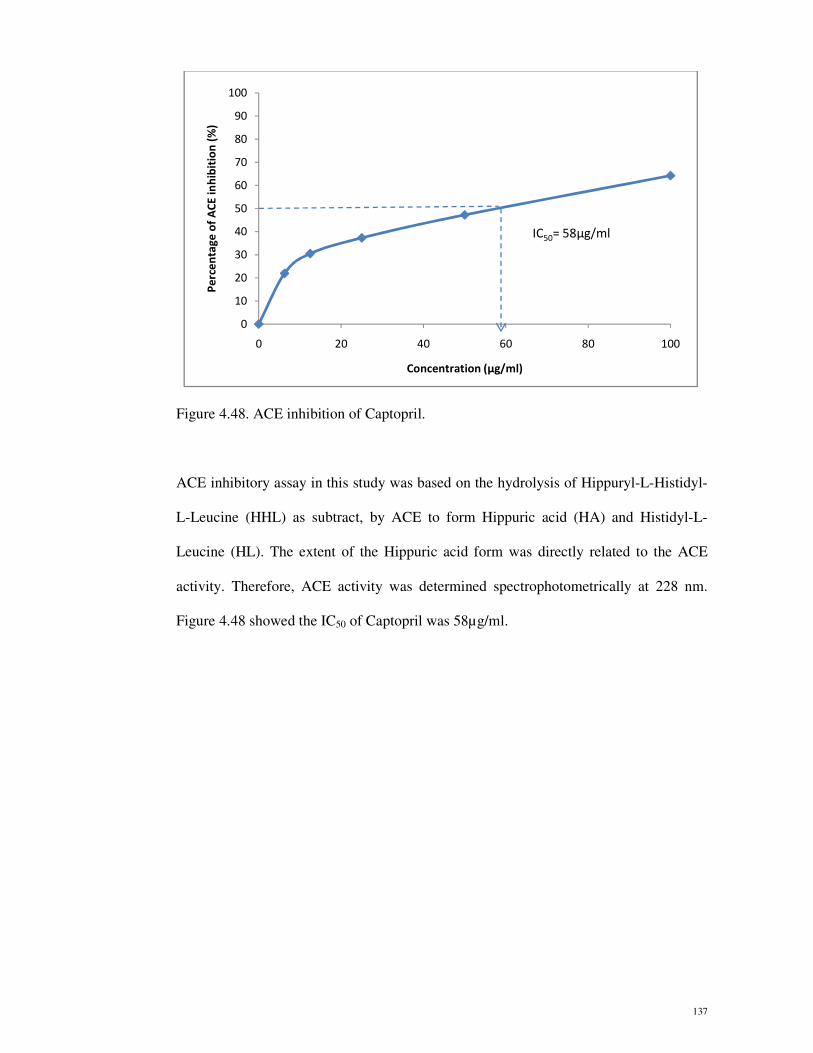
Figure 4.48. ACE inhibition of Captopril.
ACE inhibitory assay in this study was based on the hydrolysis of Hippuryl-L-Histidyl-
L-Leucine (HHL) as subtract, by ACE to form Hippuric acid (HA) and Histidyl-L-
Leucine (HL). The extent of the Hippuric acid form was directly related to the ACE
activity. Therefore, ACE activity was determined spectrophotometrically at 228 nm.
Figure 4.48 showed the IC50 of Captopril was 58µg/ml.
0
10
20
30
40
50
60
70
80
90
100
0 20 40 60 80 100
Pe
rce
nta
ge
of
AC
E i
nh
ibit
ion
(%
)
Concentration (µg/ml)
IC50= 58µg/ml
138
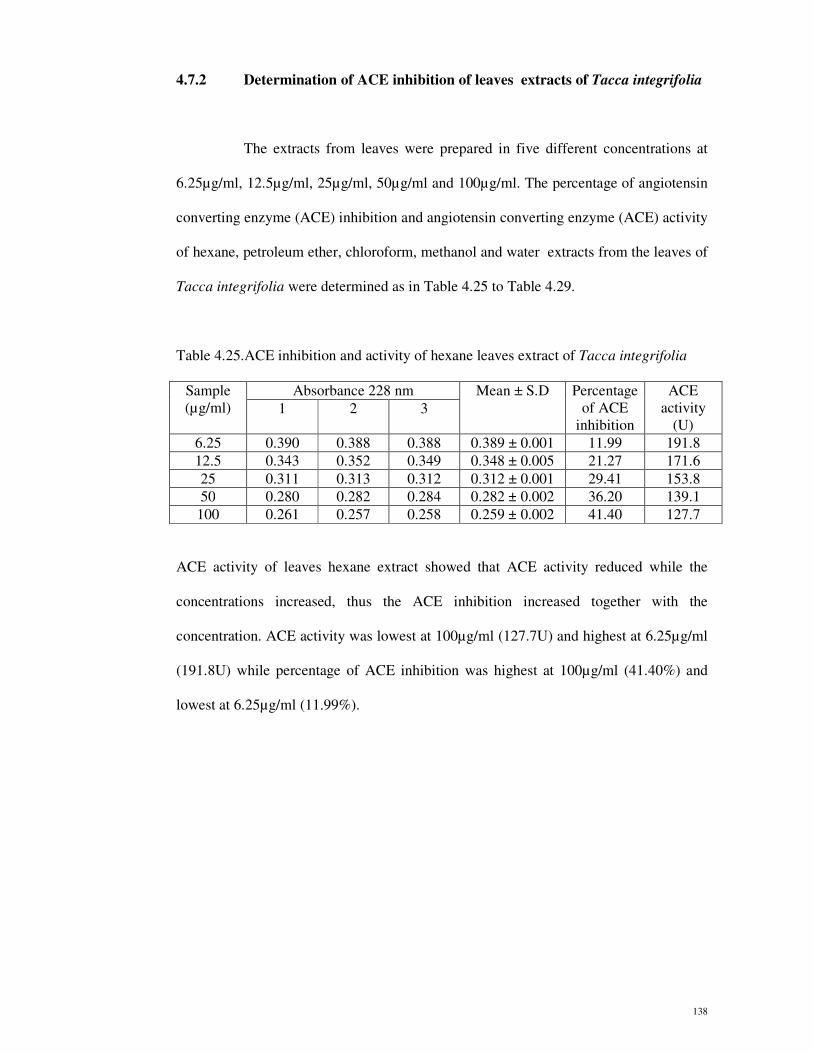
4.7.2 Determination of ACE inhibition of leaves extracts of Tacca integrifolia
The extracts from leaves were prepared in five different concentrations at
6.25µg/ml, 12.5µg/ml, 25µg/ml, 50µg/ml and 100µg/ml. The percentage of angiotensin
converting enzyme (ACE) inhibition and angiotensin converting enzyme (ACE) activity
of hexane, petroleum ether, chloroform, methanol and water extracts from the leaves of
Tacca integrifolia were determined as in Table 4.25 to Table 4.29.
Table 4.25.ACE inhibition and activity of hexane leaves extract of Tacca integrifolia
Sample
(µg/ml)
Absorbance 228 nm Mean ± S.D Percentage
of ACE
inhibition
ACE
activity
(U) 1 2 3
6.25 0.390 0.388 0.388 0.389 ± 0.001 11.99 191.8
12.5 0.343 0.352 0.349 0.348 ± 0.005 21.27 171.6
25 0.311 0.313 0.312 0.312 ± 0.001 29.41 153.8
50 0.280 0.282 0.284 0.282 ± 0.002 36.20 139.1
100 0.261 0.257 0.258 0.259 ± 0.002 41.40 127.7
ACE activity of leaves hexane extract showed that ACE activity reduced while the
concentrations increased, thus the ACE inhibition increased together with the
concentration. ACE activity was lowest at 100µg/ml (127.7U) and highest at 6.25µg/ml
(191.8U) while percentage of ACE inhibition was highest at 100µg/ml (41.40%) and
lowest at 6.25µg/ml (11.99%).
139
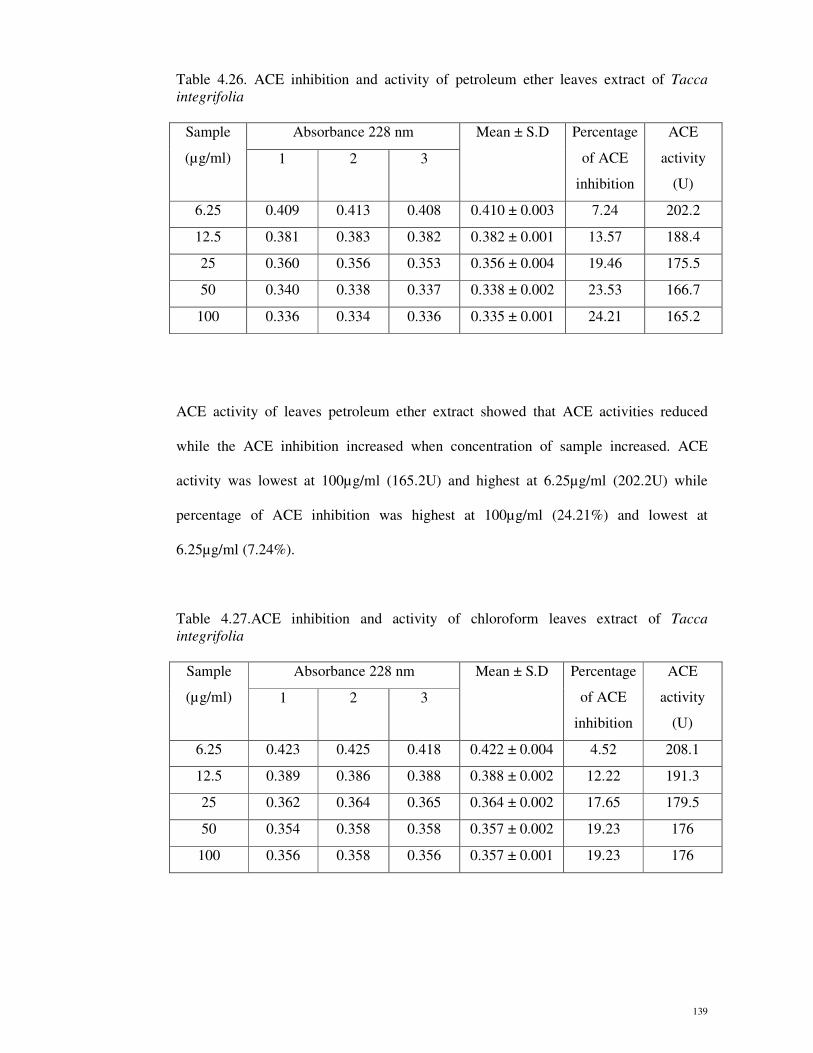
Table 4.26. ACE inhibition and activity of petroleum ether leaves extract of Tacca
integrifolia
Sample
(µg/ml)
Absorbance 228 nm Mean ± S.D Percentage
of ACE
inhibition
ACE
activity
(U)
1 2 3
6.25 0.409 0.413 0.408 0.410 ± 0.003 7.24 202.2
12.5 0.381 0.383 0.382 0.382 ± 0.001 13.57 188.4
25 0.360 0.356 0.353 0.356 ± 0.004 19.46 175.5
50 0.340 0.338 0.337 0.338 ± 0.002 23.53 166.7
100 0.336 0.334 0.336 0.335 ± 0.001 24.21 165.2
ACE activity of leaves petroleum ether extract showed that ACE activities reduced
while the ACE inhibition increased when concentration of sample increased. ACE
activity was lowest at 100µg/ml (165.2U) and highest at 6.25µg/ml (202.2U) while
percentage of ACE inhibition was highest at 100µg/ml (24.21%) and lowest at
6.25µg/ml (7.24%).
Table 4.27.ACE inhibition and activity of chloroform leaves extract of Tacca
integrifolia
Sample
(µg/ml)
Absorbance 228 nm Mean ± S.D Percentage
of ACE
inhibition
ACE
activity
(U)
1 2 3
6.25 0.423 0.425 0.418 0.422 ± 0.004 4.52 208.1
12.5 0.389 0.386 0.388 0.388 ± 0.002 12.22 191.3
25 0.362 0.364 0.365 0.364 ± 0.002 17.65 179.5
50 0.354 0.358 0.358 0.357 ± 0.002 19.23 176
100 0.356 0.358 0.356 0.357 ± 0.001 19.23 176
140
Table 4.27 showed the percentage of ACE inhibition and ACE activity of leaves
chloroform extract in five different concentrations. Percentage of ACE inhibition
increased when concentration increased while ACE activities reduced when
concentration of sample increased. ACE activity was lowest at 100µg/ml (176U) and
highest at 6.25µg/ml (208.1U) while percentage of ACE inhibition was highest at
100µg/ml (19.23%) and lowest at 6.25µg/ml (4.52%).
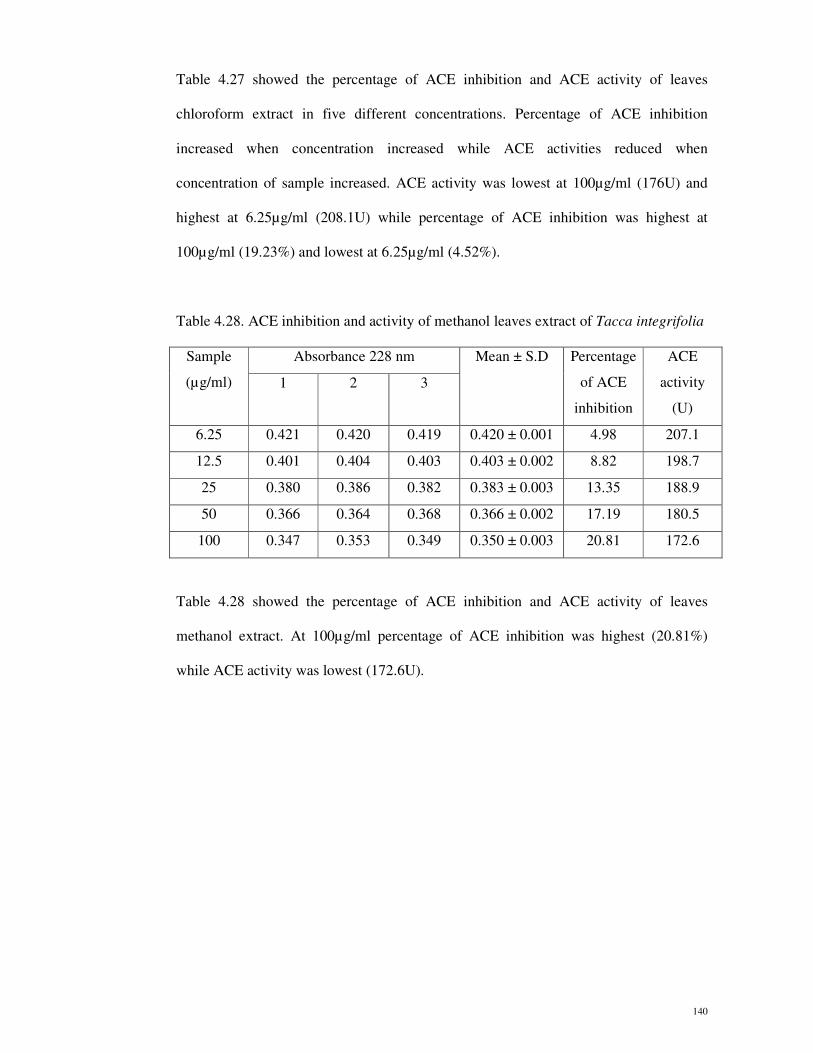
Table 4.28. ACE inhibition and activity of methanol leaves extract of Tacca integrifolia
Sample
(µg/ml)
Absorbance 228 nm Mean ± S.D Percentage
of ACE
inhibition
ACE
activity
(U)
1 2 3
6.25 0.421 0.420 0.419 0.420 ± 0.001 4.98 207.1
12.5 0.401 0.404 0.403 0.403 ± 0.002 8.82 198.7
25 0.380 0.386 0.382 0.383 ± 0.003 13.35 188.9
50 0.366 0.364 0.368 0.366 ± 0.002 17.19 180.5
100 0.347 0.353 0.349 0.350 ± 0.003 20.81 172.6
Table 4.28 showed the percentage of ACE inhibition and ACE activity of leaves
methanol extract. At 100µg/ml percentage of ACE inhibition was highest (20.81%)
while ACE activity was lowest (172.6U).

141
Table 4.29. ACE inhibition and activity of water leaves extract of Tacca integrifolia
Sample
(µg/ml)
Absorbance 228 nm Mean ± S.D Percentage
of ACE
inhibition
ACE
activity
(U) 1 2 3
6.25 0.430 0.434 0.435 0.433 ± 0.003 2.04 213.5
12.5 0.393 0.391 0.392 0.392 ± 0.001 11.31 193.3
25 0.352 0.354 0.357 0.354 ± 0.003 19.91 174.6
50 0.298 0.303 0.301 0.301 ± 0.003 31.90 148.4
100 0.245 0.244 0.241 0.243 ± 0.002 45.02 119.8
Table 4.29 showed the percentage of ACE inhibition and ACE activity of leaves water
extract. At 100µg/ml percentage of ACE inhibition was highest (45.02%) while ACE
activity was lowest (119.8U).
Figure 4.49. ACE inhibitions of leaves extracts from Tacca integrifolia
Figure 4.49 showed the percentage of ACE inhibition of 5 extract from leaves of Tacca
integrifolia compared to the captopril as positive reference standard. All extracts
showed dose dependent manner in ACE inhibition as increasing in sample concentration
has increased the percentage of ACE inhibition significantly at p<0.05.
0
10
20
30
40
50
60
70
0 20 40 60 80 100
Pe
rce
nta
ge
of
AC
E i
nh
ibit
ion
(%
)
Concentration (µg/ml)
Standard
(Captopril)
Hexane
extract
Petroleum
ether
extractChloroform
extract
Methanol
extract
Water
extract
142
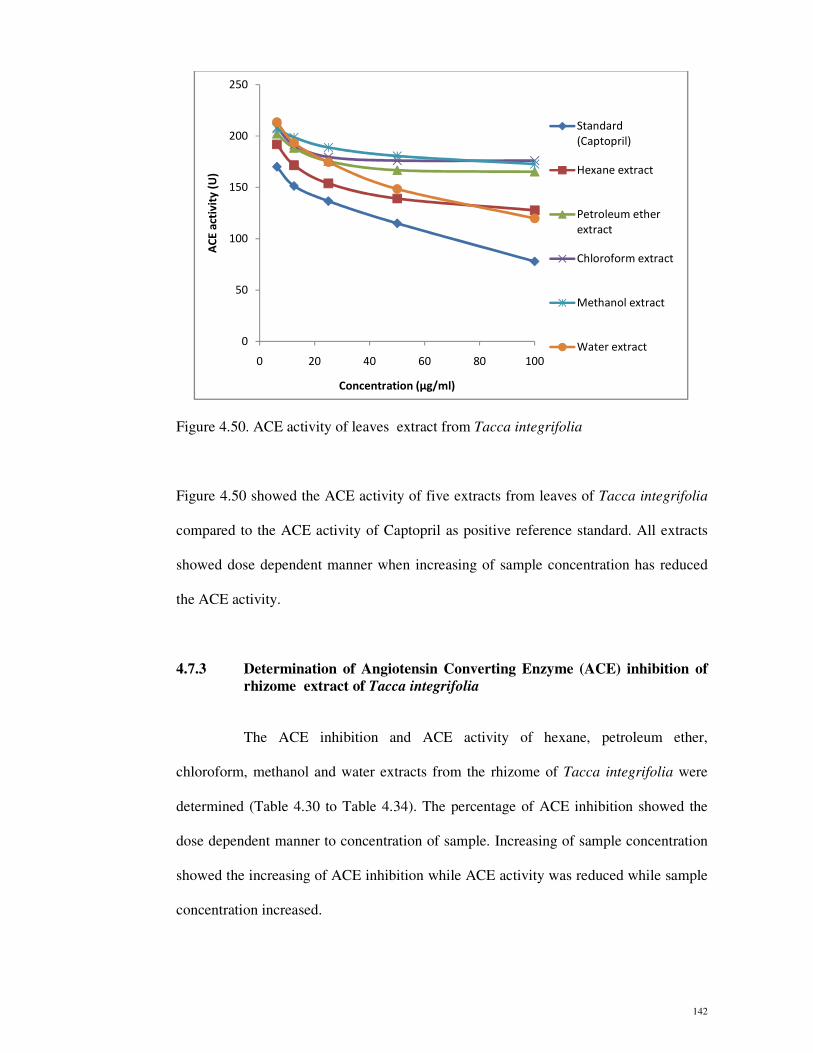
Figure 4.50. ACE activity of leaves extract from Tacca integrifolia
Figure 4.50 showed the ACE activity of five extracts from leaves of Tacca integrifolia
compared to the ACE activity of Captopril as positive reference standard. All extracts
showed dose dependent manner when increasing of sample concentration has reduced
the ACE activity.
4.7.3 Determination of Angiotensin Converting Enzyme (ACE) inhibition of
rhizome extract of Tacca integrifolia
The ACE inhibition and ACE activity of hexane, petroleum ether,
chloroform, methanol and water extracts from the rhizome of Tacca integrifolia were
determined (Table 4.30 to Table 4.34). The percentage of ACE inhibition showed the
dose dependent manner to concentration of sample. Increasing of sample concentration
showed the increasing of ACE inhibition while ACE activity was reduced while sample
concentration increased.
0
50
100
150
200
250
0 20 40 60 80 100
AC
E a
ctiv
ity
(U
)
Concentration (µg/ml)
Standard
(Captopril)
Hexane extract
Petroleum ether
extract
Chloroform extract
Methanol extract
Water extract
143
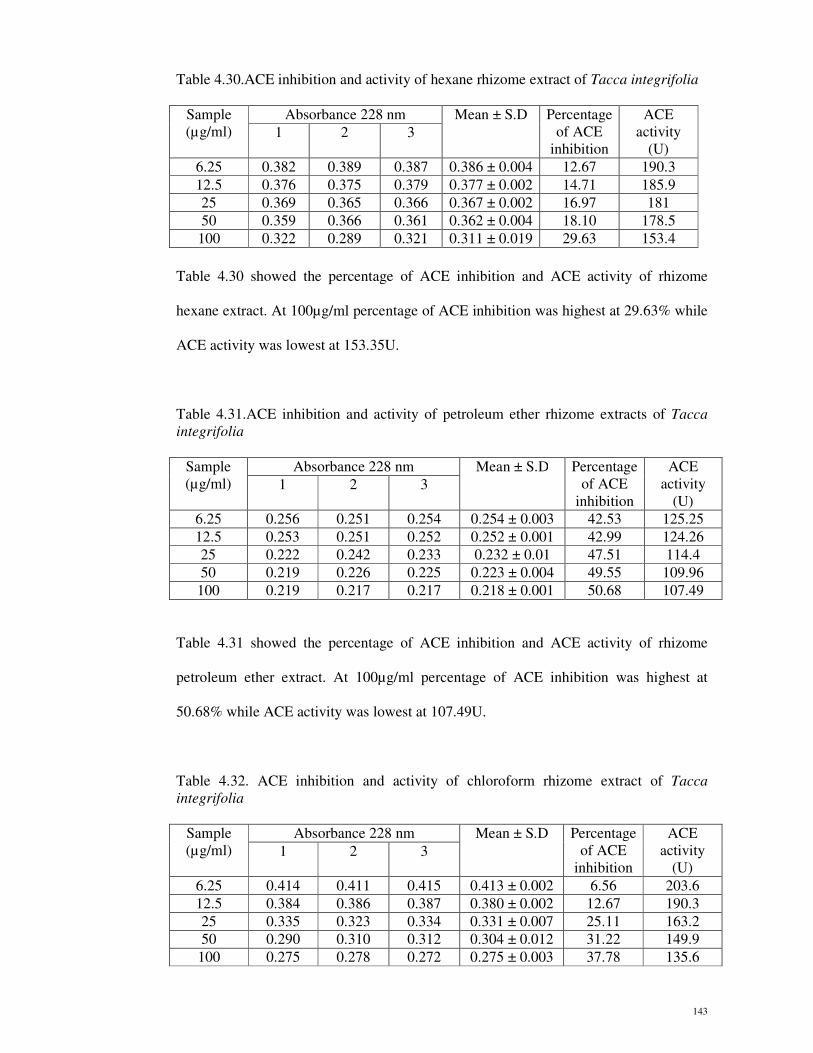
Table 4.30.ACE inhibition and activity of hexane rhizome extract of Tacca integrifolia
Sample
(µg/ml)
Absorbance 228 nm Mean ± S.D Percentage
of ACE
inhibition
ACE
activity
(U) 1 2 3
6.25 0.382 0.389 0.387 0.386 ± 0.004 12.67 190.3
12.5 0.376 0.375 0.379 0.377 ± 0.002 14.71 185.9
25 0.369 0.365 0.366 0.367 ± 0.002 16.97 181
50 0.359 0.366 0.361 0.362 ± 0.004 18.10 178.5
100 0.322 0.289 0.321 0.311 ± 0.019 29.63 153.4
Table 4.30 showed the percentage of ACE inhibition and ACE activity of rhizome
hexane extract. At 100µg/ml percentage of ACE inhibition was highest at 29.63% while
ACE activity was lowest at 153.35U.
Table 4.31.ACE inhibition and activity of petroleum ether rhizome extracts of Tacca
integrifolia
Sample
(µg/ml)
Absorbance 228 nm Mean ± S.D Percentage
of ACE
inhibition
ACE
activity
(U) 1 2 3
6.25 0.256 0.251 0.254 0.254 ± 0.003 42.53 125.25
12.5 0.253 0.251 0.252 0.252 ± 0.001 42.99 124.26
25 0.222 0.242 0.233 0.232 ± 0.01 47.51 114.4
50 0.219 0.226 0.225 0.223 ± 0.004 49.55 109.96
100 0.219 0.217 0.217 0.218 ± 0.001 50.68 107.49
Table 4.31 showed the percentage of ACE inhibition and ACE activity of rhizome
petroleum ether extract. At 100µg/ml percentage of ACE inhibition was highest at
50.68% while ACE activity was lowest at 107.49U.
Table 4.32. ACE inhibition and activity of chloroform rhizome extract of Tacca
integrifolia
Sample
(µg/ml)
Absorbance 228 nm Mean ± S.D Percentage
of ACE
inhibition
ACE
activity
(U) 1 2 3
6.25 0.414 0.411 0.415 0.413 ± 0.002 6.56 203.6
12.5 0.384 0.386 0.387 0.380 ± 0.002 12.67 190.3
25 0.335 0.323 0.334 0.331 ± 0.007 25.11 163.2
50 0.290 0.310 0.312 0.304 ± 0.012 31.22 149.9
100 0.275 0.278 0.272 0.275 ± 0.003 37.78 135.6

144
Table 4.32 showed the percentage of ACE inhibition and ACE activity of rhizome
chloroform extract. At 100µg/ml percentage of ACE inhibition was highest at 37.78%
while ACE activity was lowest at 135.6U.
Table 4.33. ACE inhibition and activity of methanol rhizome extract of Tacca
integrifolia
Sample
(µg/ml)
Absorbance 228 nm Mean ± S.D Percentage
of ACE
inhibition
ACE
activity
(U) 1 2 3
6.25 0.238 0.244 0.241 0.241 ± 0.003 45.48 118.8
12.5 0.219 0.221 0.222 0.221 ± 0.002 50.0 108.97
25 0.215 0.219 0.216 0.217 ± 0.002 50.9 107
50 0.215 0.214 0.216 0.215 ± 0.001 51.36 106
100 0.204 0.205 0.206 0.205 ± 0.001 53.62 101.1
Table 4.33 showed the percentage of ACE inhibition and ACE activity of rhizome
methanol extract. At 100µg/ml percentage of ACE inhibition was highest (53.62%)
while ACE activity was lowest (101.1U).
Table 4.34. ACE inhibition and activity of water rhizome extract of Tacca integrifolia
Sample
(µg/ml)
Absorbance 228 nm Mean ± S.D Percentage
of ACE
inhibition
ACE
activity
(U) 1 2 3
6.25 0.298 0.296 0.295 0.296 ± 0.002 33.03 146
12.5 0.249 0.258 0.256 0.254 ± 0.005 42.53 125.2
25 0.242 0.249 0.246 0.246 ± 0.004 44.34 121.3
50 0.239 0.241 0.243 0.241 ± 0.002 45.48 118.8
100 0.219 0.226 0.225 0.223 ± 0.004 49.55 110
Table 4.34 showed the percentage of ACE inhibition and ACE activity of rhizome water
extract. At 100µg/ml percentage of ACE inhibition was highest at 49.55% while ACE
activity was lowest at 110U.
145
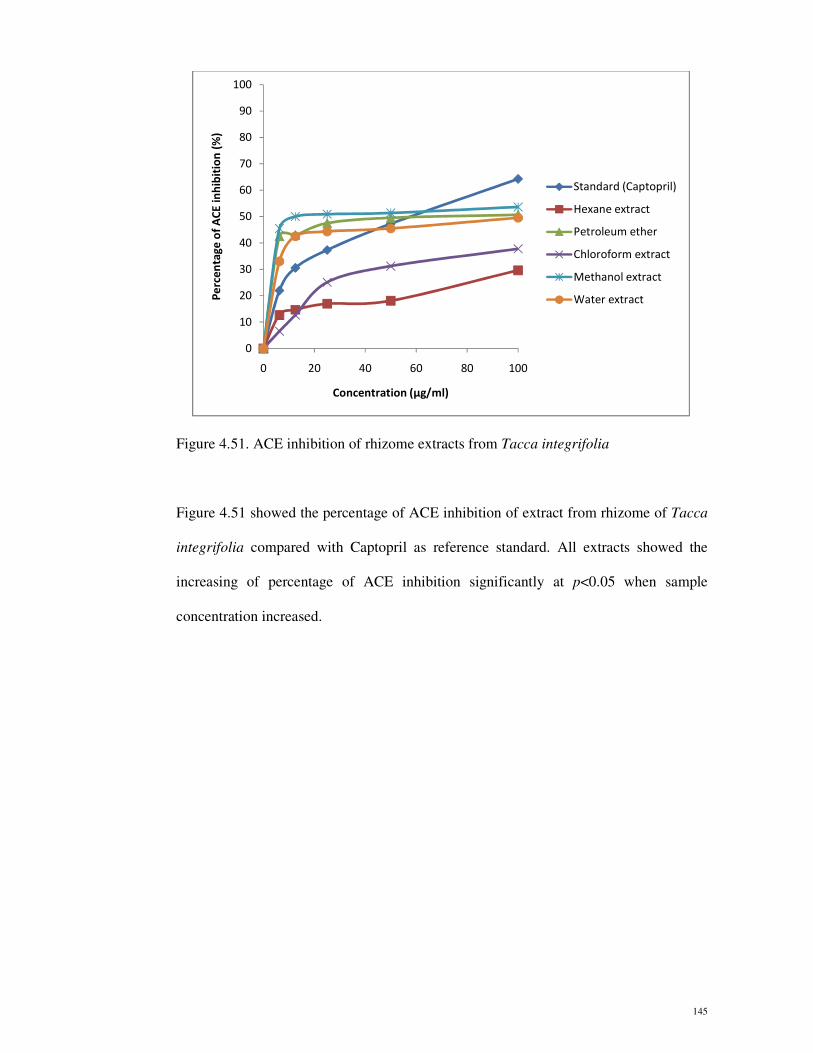
Figure 4.51. ACE inhibition of rhizome extracts from Tacca integrifolia
Figure 4.51 showed the percentage of ACE inhibition of extract from rhizome of Tacca
integrifolia compared with Captopril as reference standard. All extracts showed the
increasing of percentage of ACE inhibition significantly at p<0.05 when sample
concentration increased.
0
10
20
30
40
50
60
70
80
90
100
0 20 40 60 80 100
Pe
rce
nta
ge
of
AC
E i
nh
ibit
ion
(%
)
Concentration (µg/ml)
Standard (Captopril)
Hexane extract
Petroleum ether
Chloroform extract
Methanol extract
Water extract
146
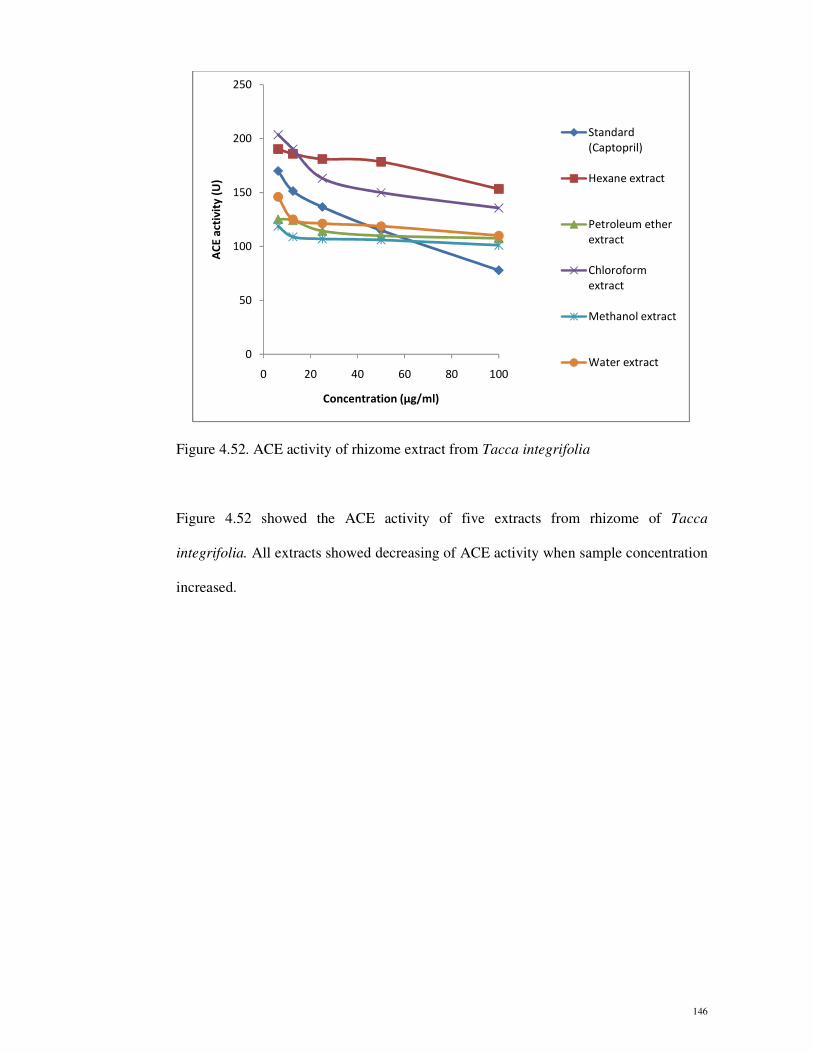
Figure 4.52. ACE activity of rhizome extract from Tacca integrifolia
Figure 4.52 showed the ACE activity of five extracts from rhizome of Tacca
integrifolia. All extracts showed decreasing of ACE activity when sample concentration
increased.
0
50
100
150
200
250
0 20 40 60 80 100
AC
E a
ctiv
ity
(U
)
Concentration (µg/ml)
Standard
(Captopril)
Hexane extract
Petroleum ether
extract
Chloroform
extract
Methanol extract
Water extract
147
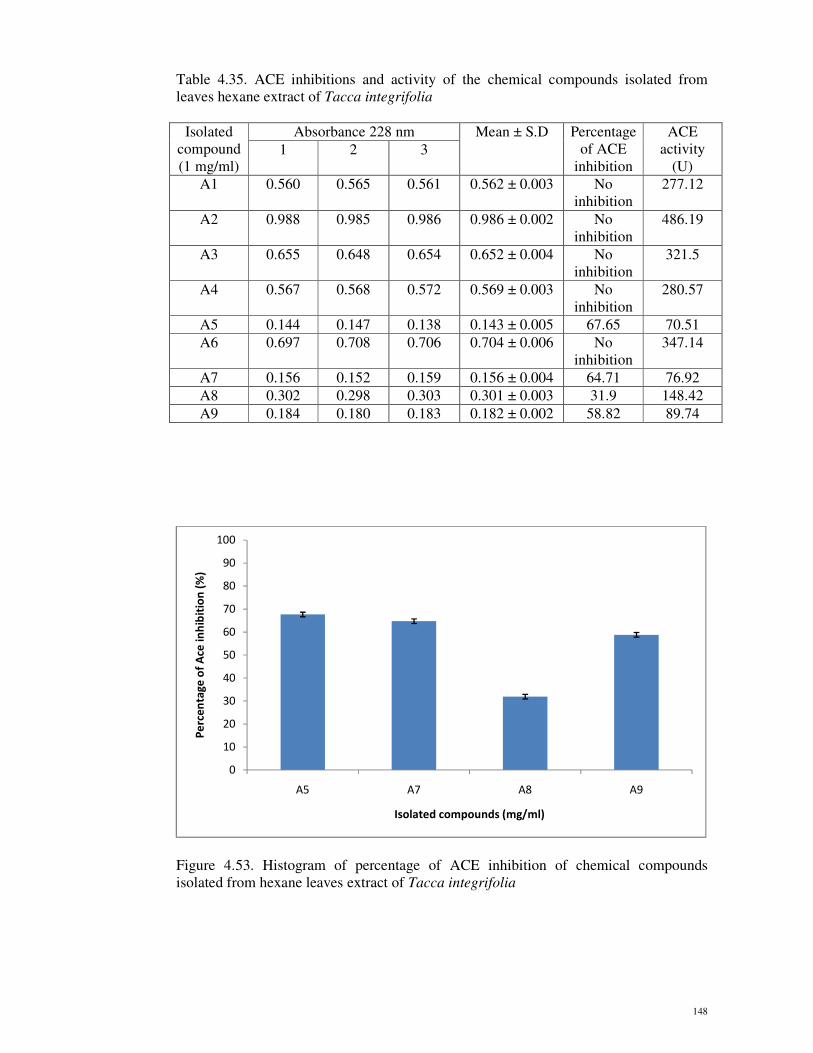
4.7.4 Determination of ACE inhibition of compounds isolated from extracts
of Tacca integrifolia
Thin Layer Chromatography (TLC) of extracts of Tacca integrifolia has
been developed using TLC plate size 20 x 20 cm. Each spotted colour presences were
scrap separately before dissolved with distilled water in 1.5 ml vial. The mixtures were
centrifuge using micro centrifuge and were kept for further use in ACE inhibitory
activity assay. Table 4.35 to Table 4.42 showed the ACE inhibition and activity from
the isolated chemical compounds from extract of Tacca integrifolia while Figure 4.53 to
Figure 4.58 illustrated the histogram of the ACE inhibition of the isolated chemical
compounds from extracts of Tacca integrifolia.
148
Table 4.35. ACE inhibitions and activity of the chemical compounds isolated from
leaves hexane extract of Tacca integrifolia
Isolated
compound
(1 mg/ml)
Absorbance 228 nm Mean ± S.D Percentage
of ACE
inhibition
ACE
activity
(U) 1 2 3
A1 0.560 0.565 0.561 0.562 ± 0.003 No
inhibition
277.12
A2 0.988 0.985 0.986 0.986 ± 0.002 No
inhibition
486.19
A3 0.655 0.648 0.654 0.652 ± 0.004 No
inhibition
321.5
A4 0.567 0.568 0.572 0.569 ± 0.003 No
inhibition
280.57
A5 0.144 0.147 0.138 0.143 ± 0.005 67.65 70.51
A6 0.697 0.708 0.706 0.704 ± 0.006 No
inhibition
347.14
A7 0.156 0.152 0.159 0.156 ± 0.004 64.71 76.92
A8 0.302 0.298 0.303 0.301 ± 0.003 31.9 148.42
A9 0.184 0.180 0.183 0.182 ± 0.002 58.82 89.74
Figure 4.53. Histogram of percentage of ACE inhibition of chemical compounds
isolated from hexane leaves extract of Tacca integrifolia
0
10
20
30
40
50
60
70
80
90
100
A5 A7 A8 A9
Pe
rce
nta
ge
of
Ace
in
hib
itio
n (
%)
Isolated compounds (mg/ml)
149
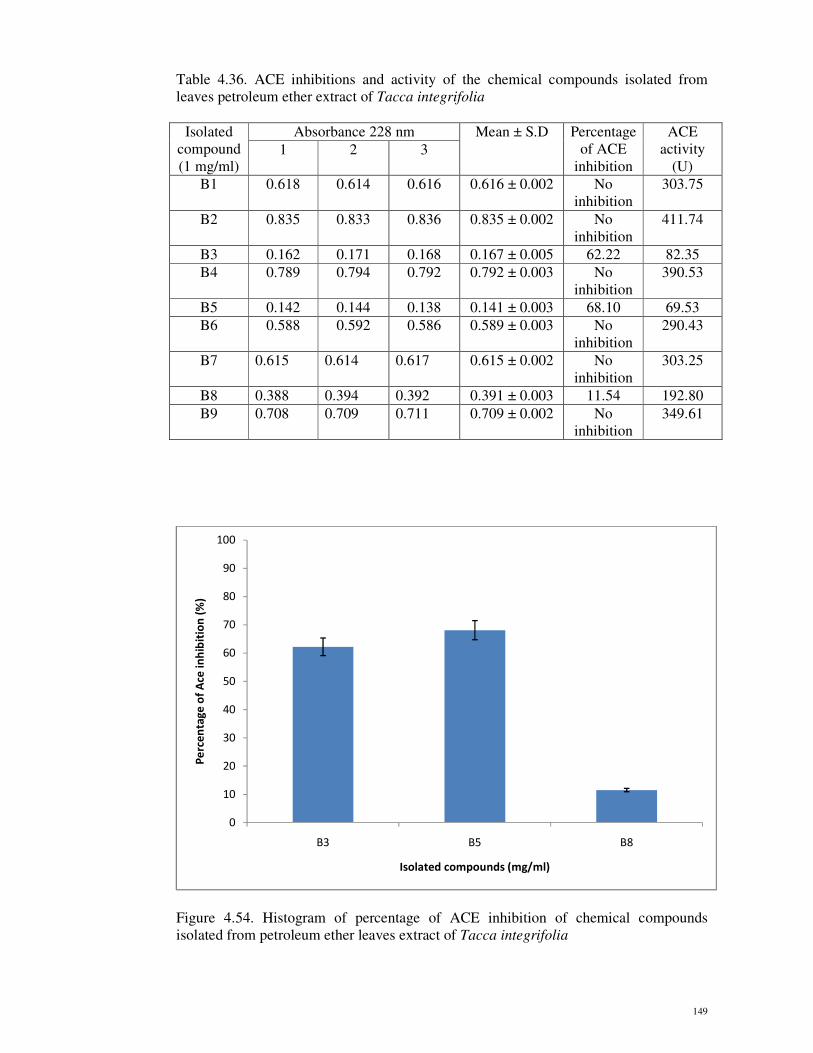
Table 4.36. ACE inhibitions and activity of the chemical compounds isolated from
leaves petroleum ether extract of Tacca integrifolia
Isolated
compound
(1 mg/ml)
Absorbance 228 nm Mean ± S.D Percentage
of ACE
inhibition
ACE
activity
(U) 1 2 3
B1 0.618 0.614 0.616 0.616 ± 0.002 No
inhibition
303.75
B2 0.835 0.833 0.836 0.835 ± 0.002 No
inhibition
411.74
B3 0.162 0.171 0.168 0.167 ± 0.005 62.22 82.35
B4 0.789 0.794 0.792 0.792 ± 0.003 No
inhibition
390.53
B5 0.142 0.144 0.138 0.141 ± 0.003 68.10 69.53
B6 0.588 0.592 0.586 0.589 ± 0.003 No
inhibition
290.43
B7 0.615 0.614 0.617 0.615 ± 0.002 No
inhibition
303.25
B8 0.388 0.394 0.392 0.391 ± 0.003 11.54 192.80
B9 0.708 0.709 0.711 0.709 ± 0.002 No
inhibition
349.61
Figure 4.54. Histogram of percentage of ACE inhibition of chemical compounds
isolated from petroleum ether leaves extract of Tacca integrifolia
0
10
20
30
40
50
60
70
80
90
100
B3 B5 B8
Pe
rce
nta
ge
of
Ace
in
hib
itio
n (
%)
Isolated compounds (mg/ml)
150
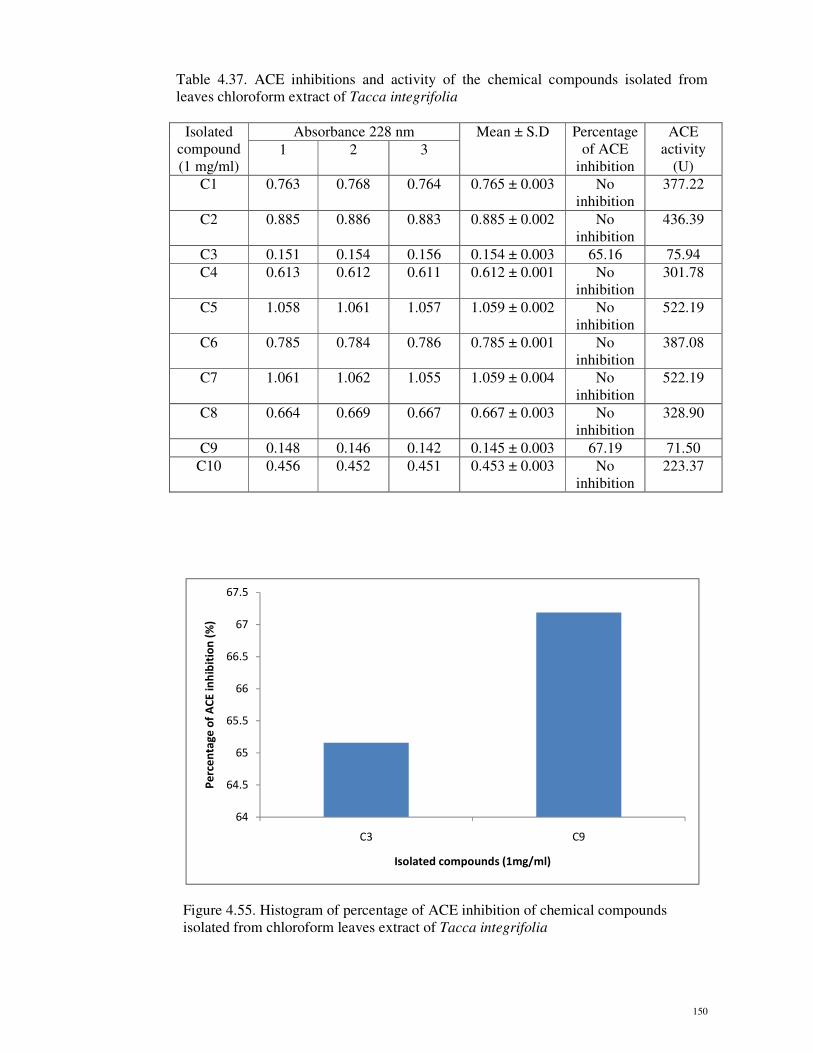
Table 4.37. ACE inhibitions and activity of the chemical compounds isolated from
leaves chloroform extract of Tacca integrifolia
Isolated
compound
(1 mg/ml)
Absorbance 228 nm Mean ± S.D Percentage
of ACE
inhibition
ACE
activity
(U) 1 2 3
C1 0.763 0.768 0.764 0.765 ± 0.003 No
inhibition
377.22
C2 0.885 0.886 0.883 0.885 ± 0.002 No
inhibition
436.39
C3 0.151 0.154 0.156 0.154 ± 0.003 65.16 75.94
C4 0.613 0.612 0.611 0.612 ± 0.001 No
inhibition
301.78
C5 1.058 1.061 1.057 1.059 ± 0.002 No
inhibition
522.19
C6 0.785 0.784 0.786 0.785 ± 0.001 No
inhibition
387.08
C7 1.061 1.062 1.055 1.059 ± 0.004 No
inhibition
522.19
C8 0.664 0.669 0.667 0.667 ± 0.003 No
inhibition
328.90
C9 0.148 0.146 0.142 0.145 ± 0.003 67.19 71.50
C10 0.456 0.452 0.451 0.453 ± 0.003 No
inhibition
223.37
Figure 4.55. Histogram of percentage of ACE inhibition of chemical compounds
isolated from chloroform leaves extract of Tacca integrifolia
64
64.5
65
65.5
66
66.5
67
67.5
C3 C9
Pe
rce
nta
ge
of
AC
E i
nh
ibit
ion
(%
)
Isolated compounds (1mg/ml)
151
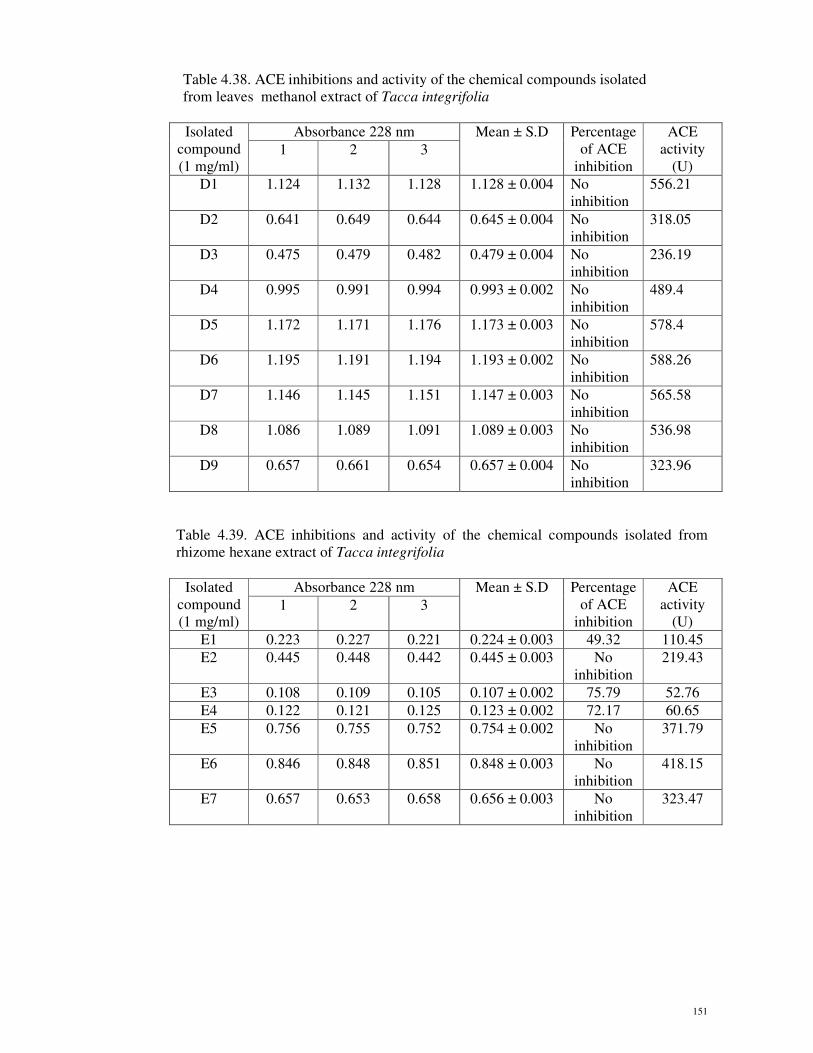
Table 4.38. ACE inhibitions and activity of the chemical compounds isolated
from leaves methanol extract of Tacca integrifolia
Isolated
compound
(1 mg/ml)
Absorbance 228 nm Mean ± S.D Percentage
of ACE
inhibition
ACE
activity
(U) 1 2 3
D1 1.124 1.132 1.128 1.128 ± 0.004 No
inhibition
556.21
D2 0.641 0.649 0.644 0.645 ± 0.004 No
inhibition
318.05
D3 0.475 0.479 0.482 0.479 ± 0.004 No
inhibition
236.19
D4 0.995 0.991 0.994 0.993 ± 0.002 No
inhibition
489.4
D5 1.172 1.171 1.176 1.173 ± 0.003 No
inhibition
578.4
D6 1.195 1.191 1.194 1.193 ± 0.002 No
inhibition
588.26
D7 1.146 1.145 1.151 1.147 ± 0.003 No
inhibition
565.58
D8 1.086 1.089 1.091 1.089 ± 0.003 No
inhibition
536.98
D9 0.657 0.661 0.654 0.657 ± 0.004 No
inhibition
323.96
Table 4.39. ACE inhibitions and activity of the chemical compounds isolated from
rhizome hexane extract of Tacca integrifolia
Isolated
compound
(1 mg/ml)
Absorbance 228 nm Mean ± S.D Percentage
of ACE
inhibition
ACE
activity
(U) 1 2 3
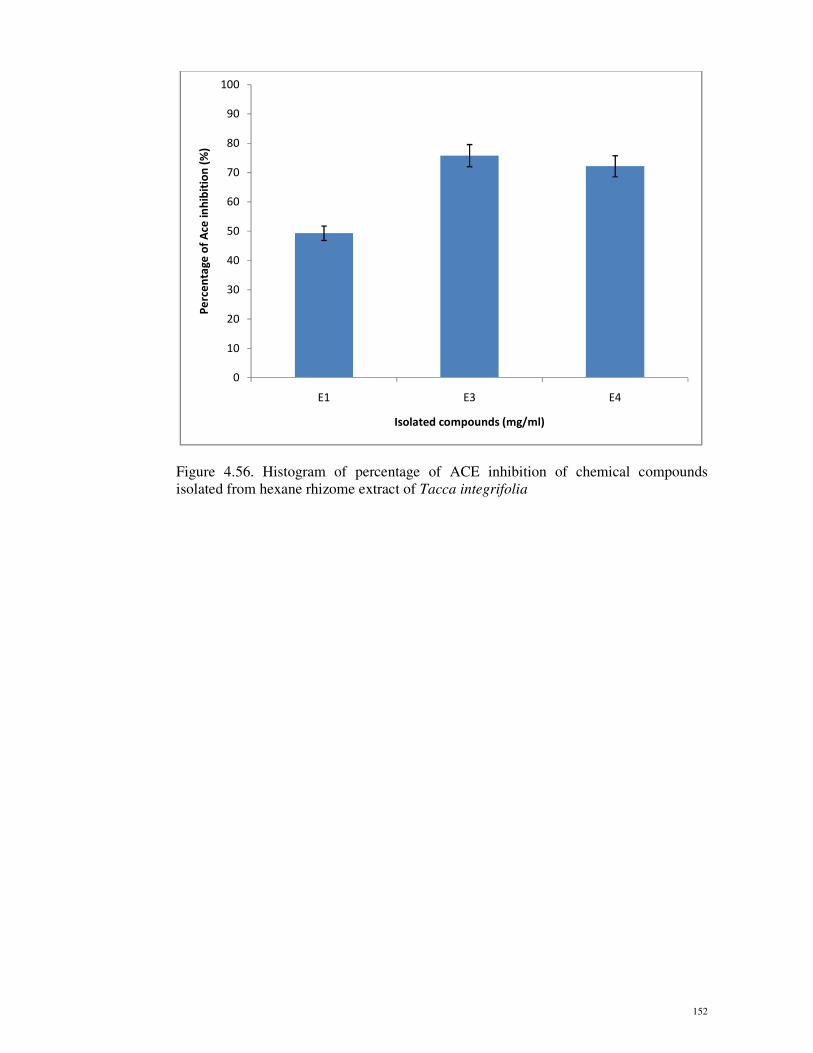
E1 0.223 0.227 0.221 0.224 ± 0.003 49.32 110.45
E2 0.445 0.448 0.442 0.445 ± 0.003 No
inhibition
219.43
E3 0.108 0.109 0.105 0.107 ± 0.002 75.79 52.76
E4 0.122 0.121 0.125 0.123 ± 0.002 72.17 60.65
E5 0.756 0.755 0.752 0.754 ± 0.002 No
inhibition
371.79
E6 0.846 0.848 0.851 0.848 ± 0.003 No
inhibition
418.15
E7 0.657 0.653 0.658 0.656 ± 0.003 No
inhibition
323.47
152
Figure 4.56. Histogram of percentage of ACE inhibition of chemical compounds
isolated from hexane rhizome extract of Tacca integrifolia
0
10
20
30
40
50
60
70
80
90
100
E1 E3 E4
Pe
rce
nta
ge
of
Ace
in
hib
itio
n (
%)
Isolated compounds (mg/ml)
153
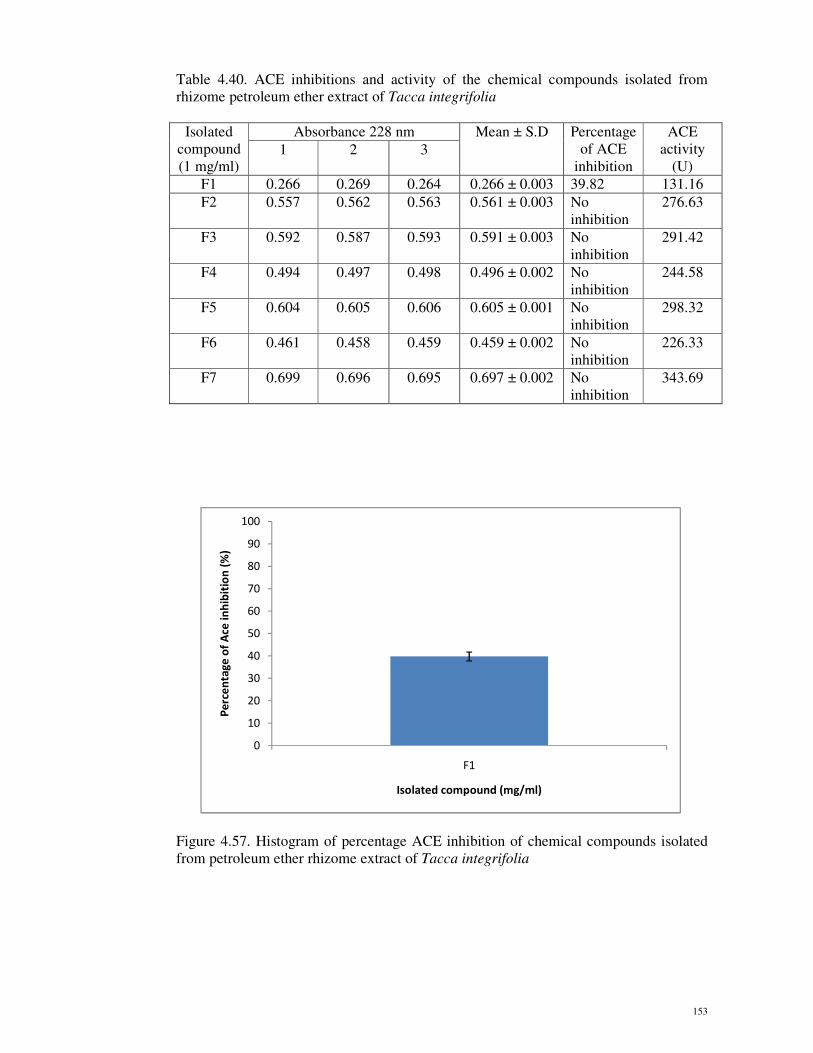
Table 4.40. ACE inhibitions and activity of the chemical compounds isolated from
rhizome petroleum ether extract of Tacca integrifolia
Isolated
compound
(1 mg/ml)
Absorbance 228 nm Mean ± S.D Percentage
of ACE
inhibition
ACE
activity
(U) 1 2 3
F1 0.266 0.269 0.264 0.266 ± 0.003 39.82 131.16
F2 0.557 0.562 0.563 0.561 ± 0.003 No
inhibition
276.63
F3 0.592 0.587 0.593 0.591 ± 0.003 No
inhibition
291.42
F4 0.494 0.497 0.498 0.496 ± 0.002 No
inhibition
244.58
F5 0.604 0.605 0.606 0.605 ± 0.001 No
inhibition
298.32
F6 0.461 0.458 0.459 0.459 ± 0.002 No
inhibition
226.33
F7 0.699 0.696 0.695 0.697 ± 0.002 No
inhibition
343.69
Figure 4.57. Histogram of percentage ACE inhibition of chemical compounds isolated
from petroleum ether rhizome extract of Tacca integrifolia
0
10
20
30
40
50
60
70
80
90
100
F1
Pe
rce
nta
ge
of
Ace
in
hib
itio
n (
%)
Isolated compound (mg/ml)
154
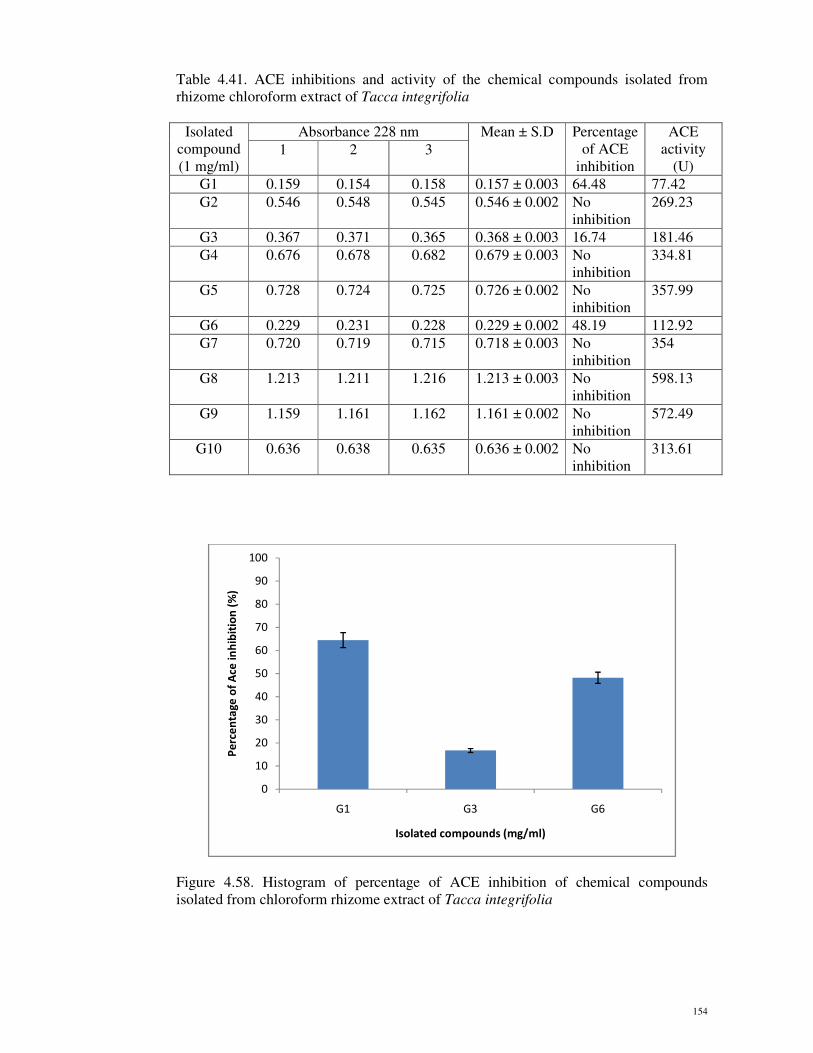
Table 4.41. ACE inhibitions and activity of the chemical compounds isolated from
rhizome chloroform extract of Tacca integrifolia
Isolated
compound
(1 mg/ml)
Absorbance 228 nm Mean ± S.D Percentage
of ACE
inhibition
ACE
activity
(U) 1 2 3
G1 0.159 0.154 0.158 0.157 ± 0.003 64.48 77.42
G2 0.546 0.548 0.545 0.546 ± 0.002 No
inhibition
269.23
G3 0.367 0.371 0.365 0.368 ± 0.003 16.74 181.46
G4 0.676 0.678 0.682 0.679 ± 0.003 No
inhibition
334.81
G5 0.728 0.724 0.725 0.726 ± 0.002 No
inhibition
357.99
G6 0.229 0.231 0.228 0.229 ± 0.002 48.19 112.92
G7 0.720 0.719 0.715 0.718 ± 0.003 No
inhibition
354
G8 1.213 1.211 1.216 1.213 ± 0.003 No
inhibition
598.13
G9 1.159 1.161 1.162 1.161 ± 0.002 No
inhibition
572.49
G10 0.636 0.638 0.635 0.636 ± 0.002 No
inhibition
313.61
Figure 4.58. Histogram of percentage of ACE inhibition of chemical compounds
isolated from chloroform rhizome extract of Tacca integrifolia
0
10
20
30
40
50
60
70
80
90
100
G1 G3 G6
Pe
rce
nta
ge
of
Ace
in
hib
itio
n (
%)
Isolated compounds (mg/ml)
155
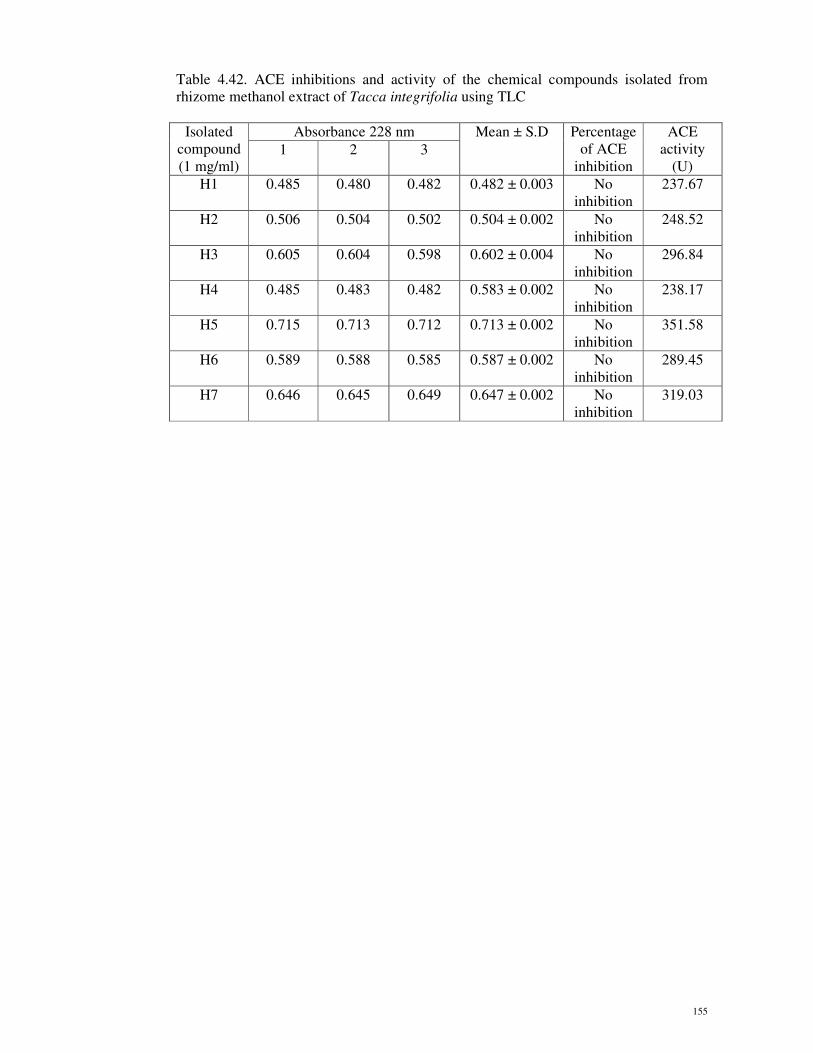
Table 4.42. ACE inhibitions and activity of the chemical compounds isolated from
rhizome methanol extract of Tacca integrifolia using TLC
Isolated
compound
(1 mg/ml)
Absorbance 228 nm Mean ± S.D Percentage
of ACE
inhibition
ACE
activity
(U) 1 2 3
H1 0.485 0.480 0.482 0.482 ± 0.003 No
inhibition
237.67
H2 0.506 0.504 0.502 0.504 ± 0.002 No
inhibition
248.52
H3 0.605 0.604 0.598 0.602 ± 0.004 No
inhibition
296.84
H4 0.485 0.483 0.482 0.583 ± 0.002 No
inhibition
238.17
H5 0.715 0.713 0.712 0.713 ± 0.002 No
inhibition
351.58
H6 0.589 0.588 0.585 0.587 ± 0.002 No
inhibition
289.45
H7 0.646 0.645 0.649 0.647 ± 0.002 No
inhibition
319.03
156
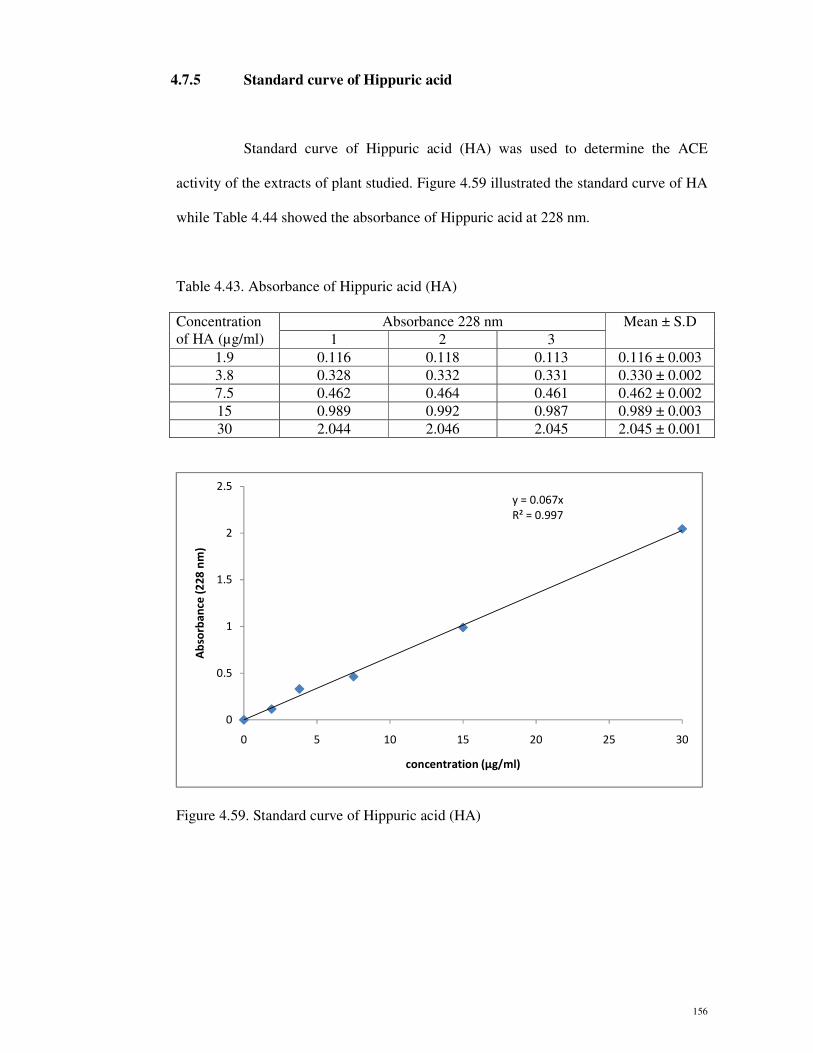
4.7.5 Standard curve of Hippuric acid
Standard curve of Hippuric acid (HA) was used to determine the ACE
activity of the extracts of plant studied. Figure 4.59 illustrated the standard curve of HA
while Table 4.44 showed the absorbance of Hippuric acid at 228 nm.
Table 4.43. Absorbance of Hippuric acid (HA)
Concentration
of HA (µg/ml)
Absorbance 228 nm Mean ± S.D
1 2 3
1.9 0.116 0.118 0.113 0.116 ± 0.003
3.8 0.328 0.332 0.331 0.330 ± 0.002
7.5 0.462 0.464 0.461 0.462 ± 0.002
15 0.989 0.992 0.987 0.989 ± 0.003
30 2.044 2.046 2.045 2.045 ± 0.001
Figure 4.59. Standard curve of Hippuric acid (HA)
y = 0.067x
R² = 0.997
0
0.5
1
1.5
2
2.5
0 5 10 15 20 25 30
Ab
sorb
an
ce (
22
8 n
m)
concentration (µg/ml)
157
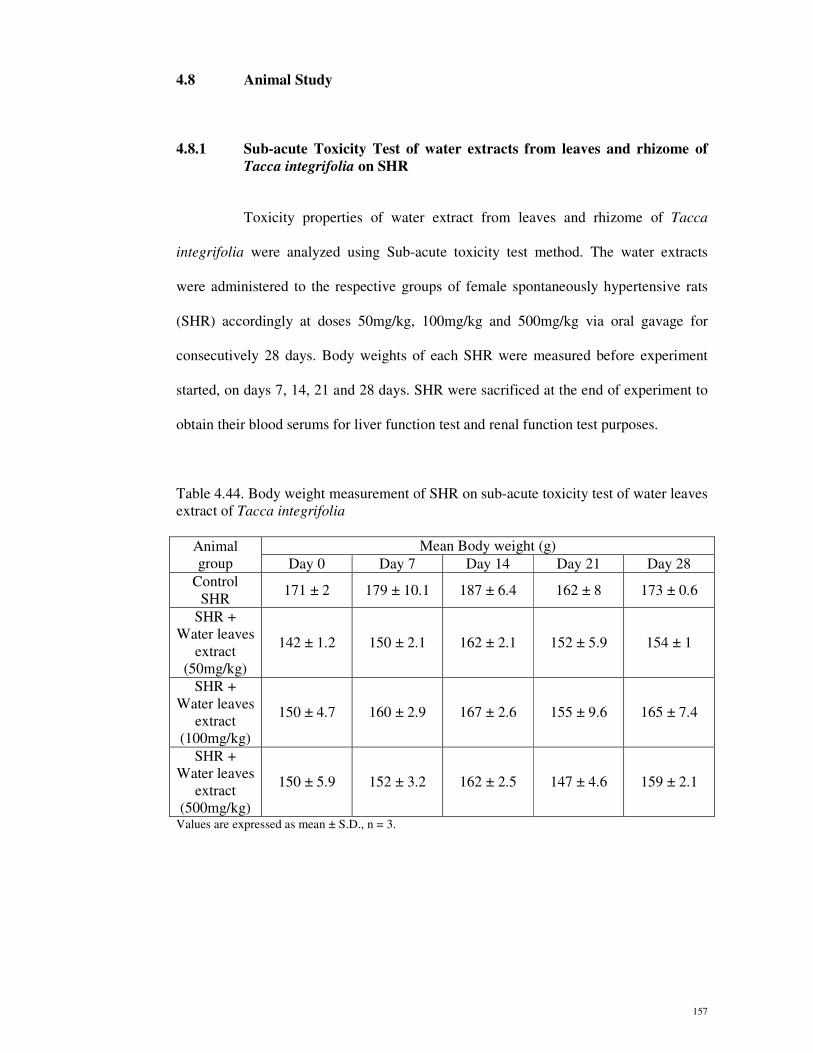
4.8 Animal Study
4.8.1 Sub-acute Toxicity Test of water extracts from leaves and rhizome of
Tacca integrifolia on SHR
Toxicity properties of water extract from leaves and rhizome of Tacca
integrifolia were analyzed using Sub-acute toxicity test method. The water extracts
were administered to the respective groups of female spontaneously hypertensive rats
(SHR) accordingly at doses 50mg/kg, 100mg/kg and 500mg/kg via oral gavage for
consecutively 28 days. Body weights of each SHR were measured before experiment
started, on days 7, 14, 21 and 28 days. SHR were sacrificed at the end of experiment to
obtain their blood serums for liver function test and renal function test purposes.
Table 4.44. Body weight measurement of SHR on sub-acute toxicity test of water leaves
extract of Tacca integrifolia
Animal
group
Mean Body weight (g)
Day 0 Day 7 Day 14 Day 21 Day 28
Control
SHR 171 ± 2 179 ± 10.1 187 ± 6.4 162 ± 8 173 ± 0.6
SHR +
Water leaves
extract
(50mg/kg)
142 ± 1.2 150 ± 2.1 162 ± 2.1 152 ± 5.9 154 ± 1
SHR +
Water leaves
extract
(100mg/kg)
150 ± 4.7 160 ± 2.9 167 ± 2.6 155 ± 9.6 165 ± 7.4
SHR +
Water leaves
extract
(500mg/kg)
150 ± 5.9 152 ± 3.2 162 ± 2.5 147 ± 4.6 159 ± 2.1
Values are expressed as mean ± S.D., n = 3.
158
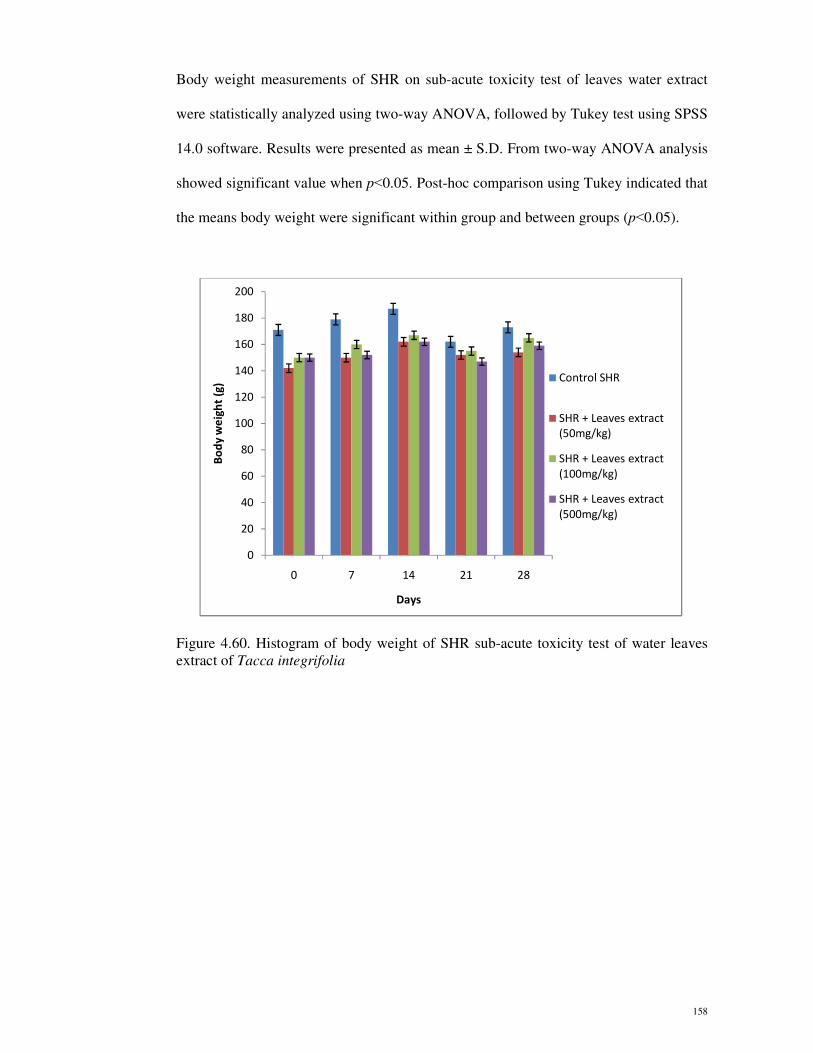
Body weight measurements of SHR on sub-acute toxicity test of leaves water extract
were statistically analyzed using two-way ANOVA, followed by Tukey test using SPSS
14.0 software. Results were presented as mean ± S.D. From two-way ANOVA analysis
showed significant value when p˂0.05. Post-hoc comparison using Tukey indicated that
the means body weight were significant within group and between groups (p˂0.05).
Figure 4.60. Histogram of body weight of SHR sub-acute toxicity test of water leaves
extract of Tacca integrifolia
0
20
40
60
80
100
120
140
160
180
200
0 7 14 21 28
Bo
dy
we
igh
t (g
)
Days
Control SHR
SHR + Leaves extract
(50mg/kg)
SHR + Leaves extract
(100mg/kg)
SHR + Leaves extract
(500mg/kg)
159
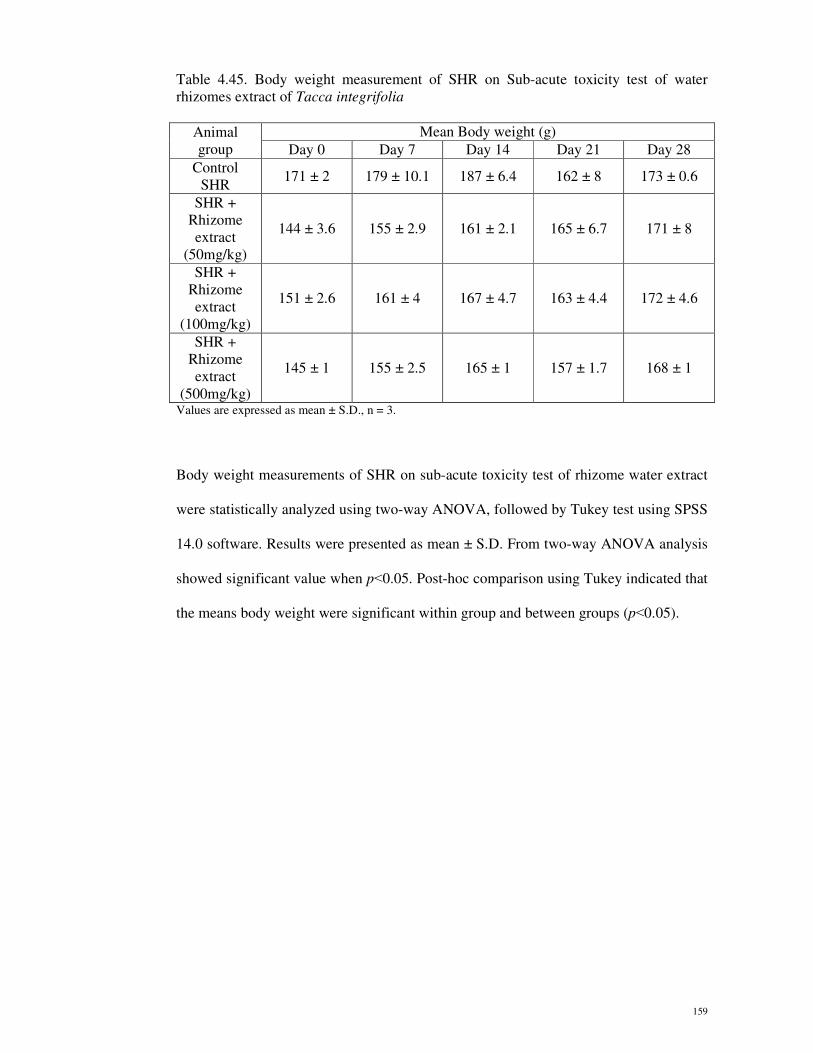
Table 4.45. Body weight measurement of SHR on Sub-acute toxicity test of water
rhizomes extract of Tacca integrifolia
Animal
group
Mean Body weight (g)
Day 0 Day 7 Day 14 Day 21 Day 28
Control
SHR 171 ± 2 179 ± 10.1 187 ± 6.4 162 ± 8 173 ± 0.6
SHR +
Rhizome
extract
(50mg/kg)
144 ± 3.6 155 ± 2.9 161 ± 2.1 165 ± 6.7 171 ± 8
SHR +
Rhizome
extract
(100mg/kg)
151 ± 2.6 161 ± 4 167 ± 4.7 163 ± 4.4 172 ± 4.6
SHR +
Rhizome
extract
(500mg/kg)
145 ± 1 155 ± 2.5 165 ± 1 157 ± 1.7 168 ± 1
Values are expressed as mean ± S.D., n = 3.
Body weight measurements of SHR on sub-acute toxicity test of rhizome water extract
were statistically analyzed using two-way ANOVA, followed by Tukey test using SPSS
14.0 software. Results were presented as mean ± S.D. From two-way ANOVA analysis
showed significant value when p˂0.05. Post-hoc comparison using Tukey indicated that
the means body weight were significant within group and between groups (p˂0.05).
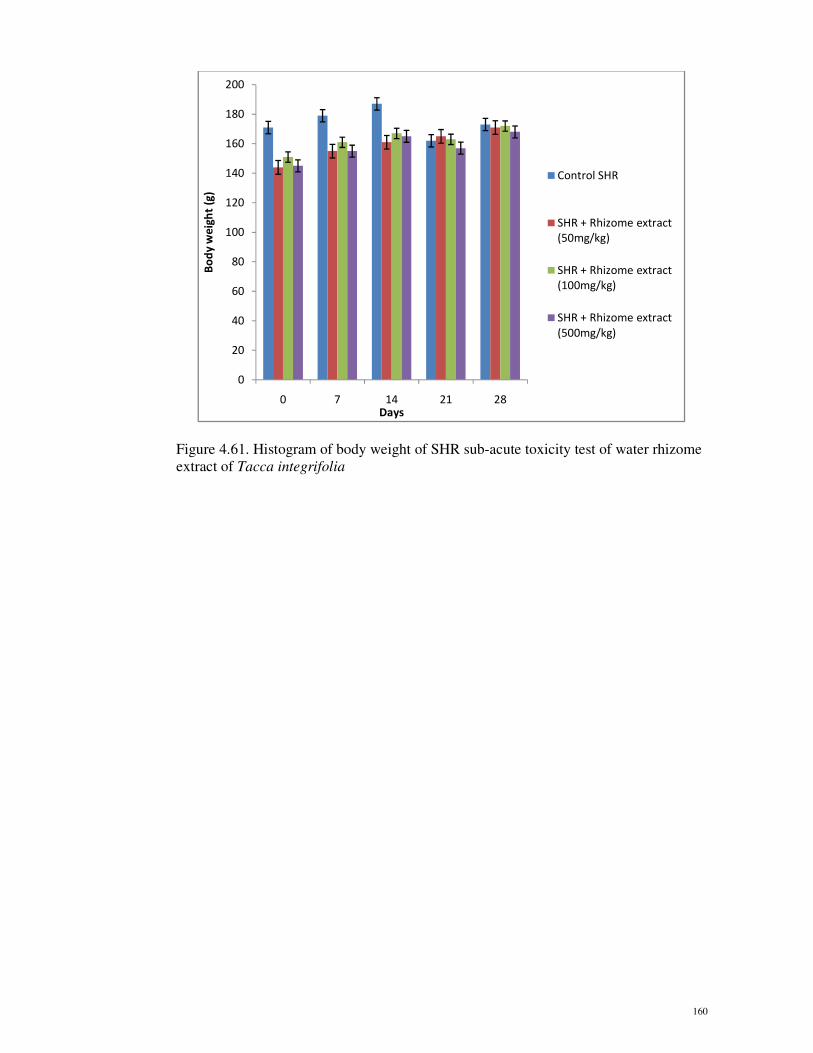
160
Figure 4.61. Histogram of body weight of SHR sub-acute toxicity test of water rhizome
extract of Tacca integrifolia
0
20
40
60
80
100
120
140
160
180
200
0 7 14 21 28
Bo
dy
we
igh
t (g
)
Days
Control SHR
SHR + Rhizome extract
(50mg/kg)
SHR + Rhizome extract
(100mg/kg)
SHR + Rhizome extract
(500mg/kg)

161
Table 4.46. Liver function test of spontaneously hypertensive rats (SHR) undergoing
sub-acute toxicity test
SHR group Mean Total Protein
(g/dL) Mean ALT (IU/L) Mean AST (IU/L)
Control
SHR 6.7 ± 0.2 53.67 ± 0.6 16.87 ± 0.2
SHR + Leaves
water extract
(50mg/kg)
6.9 ± 0.1 52.3 ± 0.6 20.27 ± 0.2
SHR + Leaves
water extract
(100mg/kg)
7.0 ± 0.2 51.3 ± 0.6 15.37 ± 1.1
SHR + Leaves
water extract
(500mg/kg)
8.8 ± 0.1 68.3 ± 0.6 36.6 ± 1.1
SHR + Rhizome
water extract
(50mg/kg)
6.8 ± 0.1 53.3 ± 0.6 19.3 ± 1.3
SHR + Rhizome
water extract
(100mg/kg)
7.1 ± 0.1 52.3 ± 0.6 16.9 ± 0.2
SHR + Rhizome
water extract
(500mg/kg)
8.9 ± 0.3 68.7 ± 0.6 35.7 ± 0.4
Values are expressed as mean ± S.D., n = 3.
Liver function test of SHR undergoing sub-acute toxicity test of leaves and rhizome
water extract were statistically analyzed using one-way ANOVA, followed by Tukey
test using SPSS 14.0 software. Results were presented as mean ± S.D. From one-way
ANOVA analysis showed significant value when p˂0.05. Post-hoc comparison using
Tukey indicated that the means total protein, AST and ALT were not significant
compared to control SHR group.
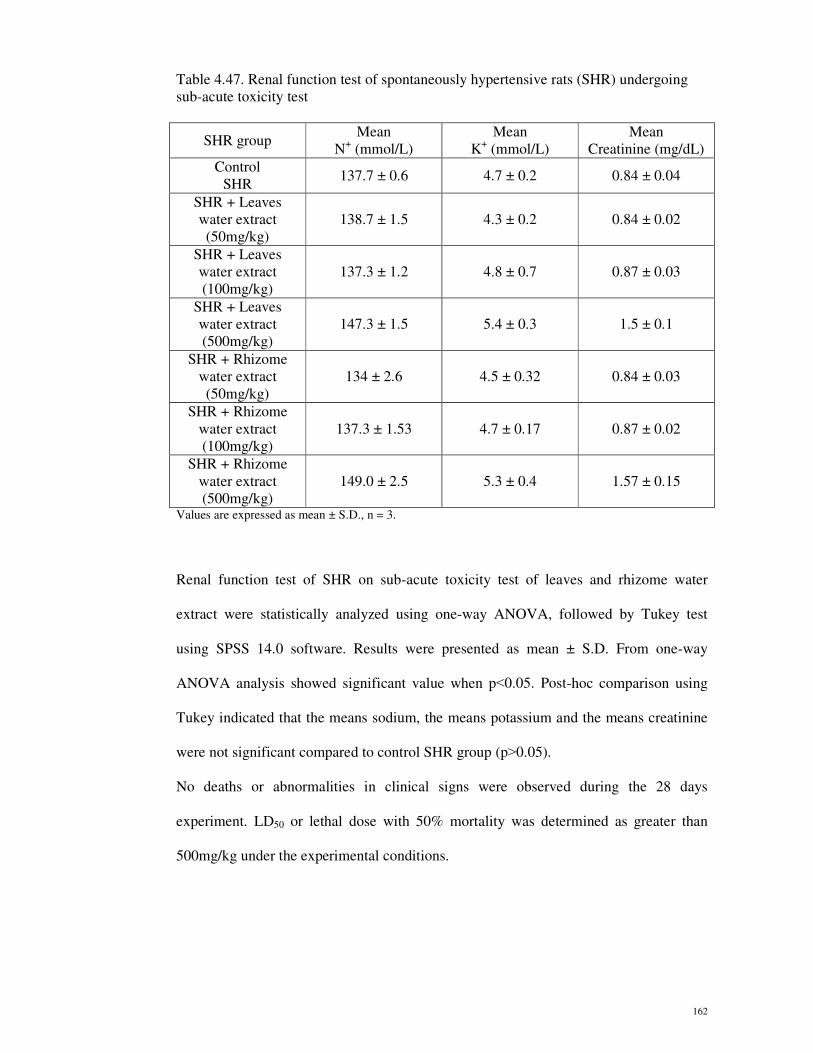
162
Table 4.47. Renal function test of spontaneously hypertensive rats (SHR) undergoing
sub-acute toxicity test
SHR group Mean
N+ (mmol/L)
Mean
K+ (mmol/L)
Mean
Creatinine (mg/dL)
Control
SHR 137.7 ± 0.6 4.7 ± 0.2 0.84 ± 0.04
SHR + Leaves
water extract
(50mg/kg)
138.7 ± 1.5 4.3 ± 0.2 0.84 ± 0.02
SHR + Leaves
water extract
(100mg/kg)
137.3 ± 1.2 4.8 ± 0.7 0.87 ± 0.03
SHR + Leaves
water extract
(500mg/kg)
147.3 ± 1.5 5.4 ± 0.3 1.5 ± 0.1
SHR + Rhizome
water extract
(50mg/kg)
134 ± 2.6 4.5 ± 0.32 0.84 ± 0.03
SHR + Rhizome
water extract
(100mg/kg)
137.3 ± 1.53 4.7 ± 0.17 0.87 ± 0.02
SHR + Rhizome
water extract
(500mg/kg)
149.0 ± 2.5 5.3 ± 0.4 1.57 ± 0.15
Values are expressed as mean ± S.D., n = 3.
Renal function test of SHR on sub-acute toxicity test of leaves and rhizome water
extract were statistically analyzed using one-way ANOVA, followed by Tukey test
using SPSS 14.0 software. Results were presented as mean ± S.D. From one-way
ANOVA analysis showed significant value when p˂0.05. Post-hoc comparison using
Tukey indicated that the means sodium, the means potassium and the means creatinine
were not significant compared to control SHR group (p˃0.05).
No deaths or abnormalities in clinical signs were observed during the 28 days
experiment. LD50 or lethal dose with 50% mortality was determined as greater than
500mg/kg under the experimental conditions.
163
4.8.2 Anti-hypertension treatment of water extract from leaves and rhizome
of Tacca integrifolia
42 Spontaneously Hypertensive Rats (SHR) age between 6 weeks to 7 weeks
were group into 7 groups with 6 rats in each group and all SHR were acclimatized for
two weeks before experiment started. Group A were orally feed with normal saline as
SHR control group (NS), Group B with low dose of Captopril (50mg/kg), Group C with
high dose of Captopril (100mg/kg), both as positive reference standard, Group D were
fed with low dose of water leaves extract (50mg/kg), Group E fed with high dose of
water leaves extract(100mg/kg), Group F fed with low dose of water rhizome extract
(50mg/kg)and Group G fed with high dose of water rhizome extract (100mg/kg).
Systolic blood pressure and body weight of 42 SHR were measured on day 0, 7, 14, 21
and day 28. Water and food were given ad libitum and all 42 SHR were fasting before
experiment started and at the end of experiment. SHR were sacrificed using neck
dislocation method to collect blood serum for liver and renal function test purposes.
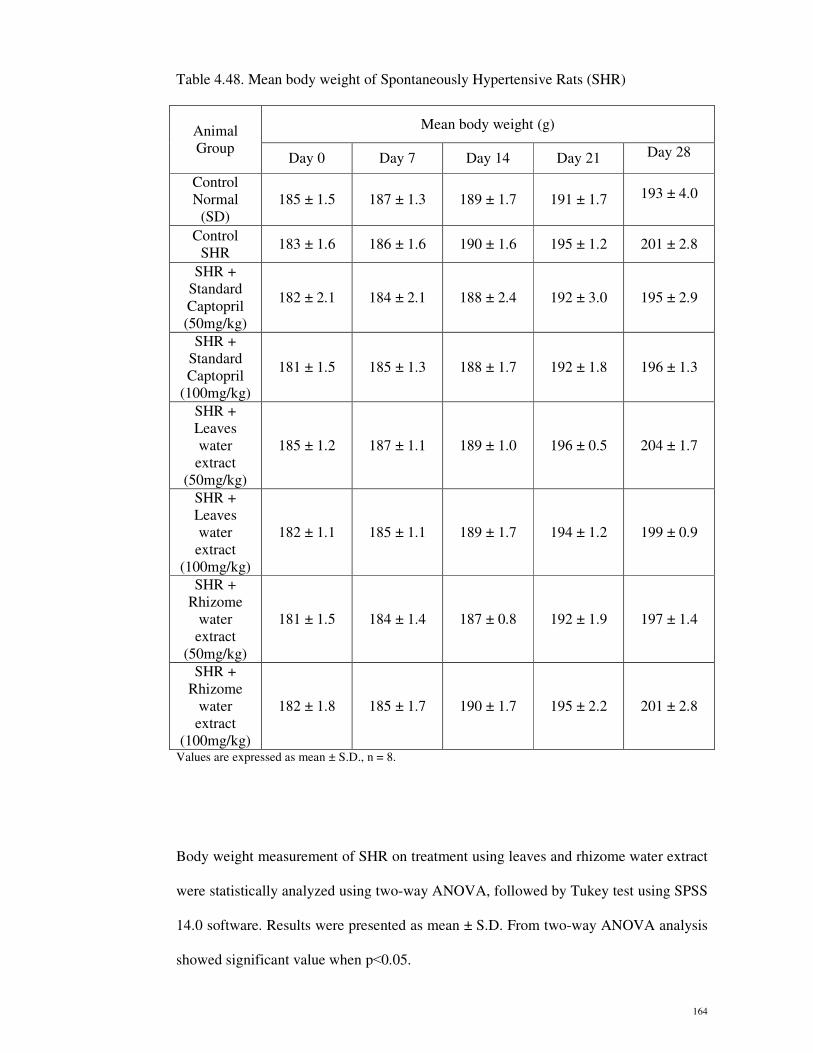
164
Table 4.48. Mean body weight of Spontaneously Hypertensive Rats (SHR)
Animal
Group
Mean body weight (g)
Day 0 Day 7 Day 14 Day 21 Day 28
Control
Normal
(SD)
185 ± 1.5 187 ± 1.3 189 ± 1.7 191 ± 1.7 193 ± 4.0
Control
SHR 183 ± 1.6 186 ± 1.6 190 ± 1.6 195 ± 1.2 201 ± 2.8
SHR +
Standard
Captopril
(50mg/kg)
182 ± 2.1 184 ± 2.1 188 ± 2.4 192 ± 3.0 195 ± 2.9
SHR +
Standard
Captopril
(100mg/kg)
181 ± 1.5 185 ± 1.3 188 ± 1.7 192 ± 1.8 196 ± 1.3
SHR +
Leaves
water
extract
(50mg/kg)
185 ± 1.2 187 ± 1.1 189 ± 1.0 196 ± 0.5 204 ± 1.7
SHR +
Leaves
water
extract
(100mg/kg)
182 ± 1.1 185 ± 1.1 189 ± 1.7 194 ± 1.2 199 ± 0.9
SHR +
Rhizome
water
extract
(50mg/kg)
181 ± 1.5 184 ± 1.4 187 ± 0.8 192 ± 1.9 197 ± 1.4
SHR +
Rhizome
water
extract
(100mg/kg)
182 ± 1.8 185 ± 1.7 190 ± 1.7 195 ± 2.2 201 ± 2.8
Values are expressed as mean ± S.D., n = 8.
Body weight measurement of SHR on treatment using leaves and rhizome water extract
were statistically analyzed using two-way ANOVA, followed by Tukey test using SPSS
14.0 software. Results were presented as mean ± S.D. From two-way ANOVA analysis
showed significant value when p˂0.05.
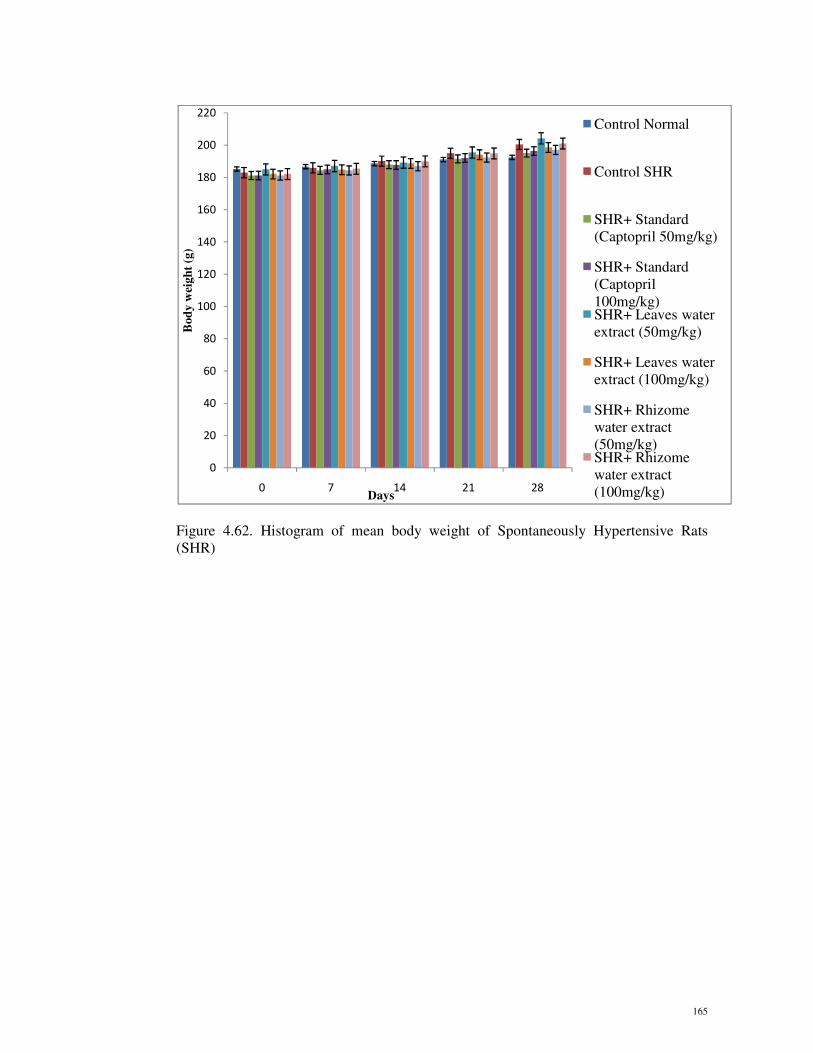
165
Figure 4.62. Histogram of mean body weight of Spontaneously Hypertensive Rats
(SHR)
0
20
40
60
80
100
120
140
160
180
200
220
0 7 14 21 28
Bod
y w
eigh
t (g
)
Days
Control Normal
Control SHR
SHR+ Standard
(Captopril 50mg/kg)
SHR+ Standard
(Captopril
100mg/kg)SHR+ Leaves water
extract (50mg/kg)
SHR+ Leaves water
extract (100mg/kg)
SHR+ Rhizome
water extract
(50mg/kg)SHR+ Rhizome
water extract
(100mg/kg)
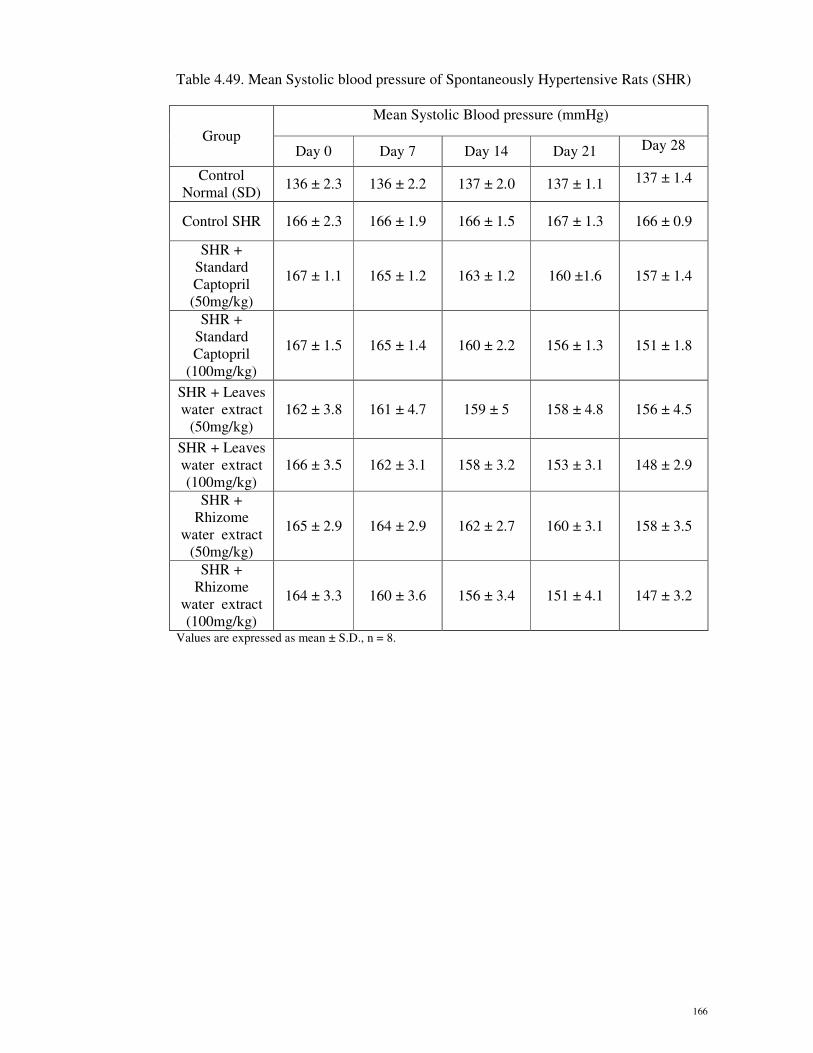
166
Table 4.49. Mean Systolic blood pressure of Spontaneously Hypertensive Rats (SHR)
Group
Mean Systolic Blood pressure (mmHg)
Day 0 Day 7 Day 14 Day 21 Day 28
Control
Normal (SD) 136 ± 2.3 136 ± 2.2 137 ± 2.0 137 ± 1.1 137 ± 1.4
Control SHR 166 ± 2.3 166 ± 1.9 166 ± 1.5 167 ± 1.3 166 ± 0.9
SHR +
Standard
Captopril
(50mg/kg)
167 ± 1.1 165 ± 1.2 163 ± 1.2 160 ±1.6 157 ± 1.4
SHR +
Standard
Captopril
(100mg/kg)
167 ± 1.5 165 ± 1.4 160 ± 2.2 156 ± 1.3 151 ± 1.8
SHR + Leaves
water extract
(50mg/kg)
162 ± 3.8 161 ± 4.7 159 ± 5 158 ± 4.8 156 ± 4.5
SHR + Leaves
water extract
(100mg/kg)
166 ± 3.5 162 ± 3.1 158 ± 3.2 153 ± 3.1 148 ± 2.9
SHR +
Rhizome
water extract
(50mg/kg)
165 ± 2.9 164 ± 2.9 162 ± 2.7 160 ± 3.1 158 ± 3.5
SHR +
Rhizome
water extract
(100mg/kg)
164 ± 3.3 160 ± 3.6 156 ± 3.4 151 ± 4.1 147 ± 3.2
Values are expressed as mean ± S.D., n = 8.
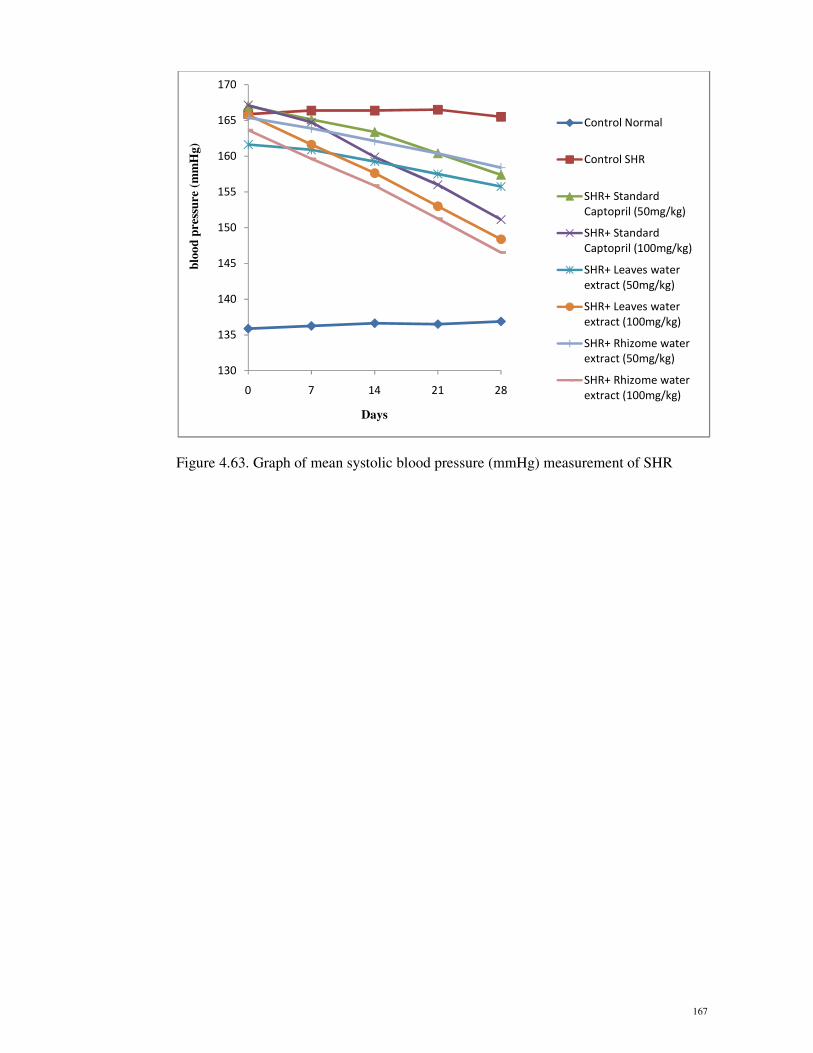
167
Figure 4.63. Graph of mean systolic blood pressure (mmHg) measurement of SHR
130
135
140
145
150
155
160
165
170
0 7 14 21 28
blo
od
pre
ssu
re (
mm
Hg)
Days
Control Normal
Control SHR
SHR+ Standard
Captopril (50mg/kg)
SHR+ Standard
Captopril (100mg/kg)
SHR+ Leaves water
extract (50mg/kg)
SHR+ Leaves water
extract (100mg/kg)
SHR+ Rhizome water
extract (50mg/kg)
SHR+ Rhizome water
extract (100mg/kg)

168
Table 4.50. Liver function test of blood serum collected from Spontaneously
Hypertensive Rats (SHR)
Group of SHR Mean Total
Protein (g/L)
Mean ALT
(IU/L)
Mean AST
(IU/L)
Control
Normal (SD) 6.4 ± 0.18
46.56 ± 1.82 14.6 ± 0.27
Control
SHR 6.7 ± 0.07 53.5 ± 0.35 16.86 ± 0.05
SHR + Standard Captopril
(50mg/kg) 5.8 ± 0.12 46 ± 1.12 16.95 ± 0.26
SHR + Standard Captopril
(100mg/kg) 5.7 ± 0.13 45 ± 0.83 17.7 ± 0.08
SHR + Leaves water extract
(50mg/kg) 6.86 ± 0.04 53.3 ± 0.43 20.22 ± 0.08
SHR + Leaves water extract
(100mg/kg) 7.05 ± 0.06 52.2 ± 0.47 15.37 ± 0.05
SHR + Rhizome water extract
(50mg/kg) 6.88 ± 0.09 52.28 ± 0.79 18.6 ± 0.18
SHR + Rhizome water extract
(100mg/kg) 7.11 ± 0.08 54.3 ± 1.09 16.79 ± 0.08
Values are expressed as mean ± S.D., n = 8.
Liver function test were analyzed using one-way ANOVA followed by Tukey test using
SPSS 14.0. Post-hoc comparison using Tukey has indicated that the means difference of
Total protein and AST were not significant compared to control group, however mean
difference in ALT was significance at p˃0.05.
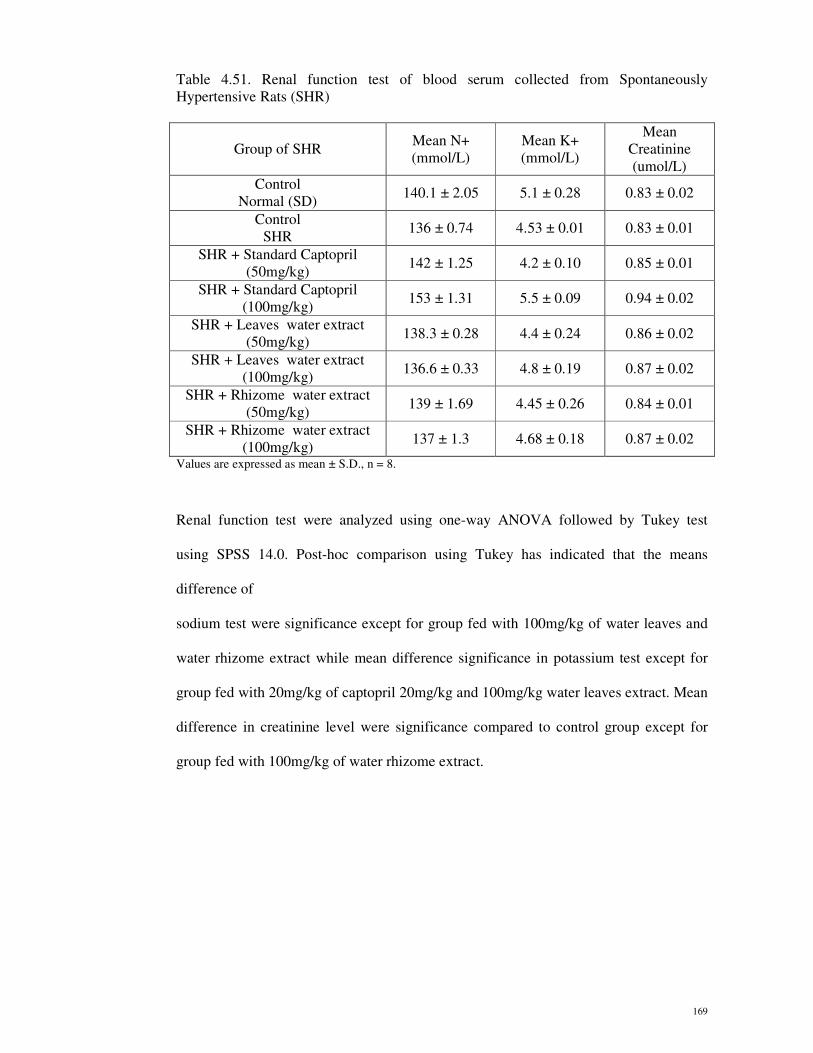
169
Table 4.51. Renal function test of blood serum collected from Spontaneously
Hypertensive Rats (SHR)
Group of SHR Mean N+
(mmol/L)
Mean K+
(mmol/L)
Mean
Creatinine
(umol/L)
Control
Normal (SD) 140.1 ± 2.05 5.1 ± 0.28 0.83 ± 0.02
Control
SHR 136 ± 0.74 4.53 ± 0.01 0.83 ± 0.01
SHR + Standard Captopril
(50mg/kg) 142 ± 1.25 4.2 ± 0.10 0.85 ± 0.01
SHR + Standard Captopril
(100mg/kg) 153 ± 1.31 5.5 ± 0.09 0.94 ± 0.02
SHR + Leaves water extract
(50mg/kg) 138.3 ± 0.28 4.4 ± 0.24 0.86 ± 0.02
SHR + Leaves water extract
(100mg/kg) 136.6 ± 0.33 4.8 ± 0.19 0.87 ± 0.02
SHR + Rhizome water extract
(50mg/kg) 139 ± 1.69 4.45 ± 0.26 0.84 ± 0.01
SHR + Rhizome water extract
(100mg/kg) 137 ± 1.3 4.68 ± 0.18 0.87 ± 0.02
Values are expressed as mean ± S.D., n = 8.
Renal function test were analyzed using one-way ANOVA followed by Tukey test
using SPSS 14.0. Post-hoc comparison using Tukey has indicated that the means
difference of
sodium test were significance except for group fed with 100mg/kg of water leaves and
water rhizome extract while mean difference significance in potassium test except for
group fed with 20mg/kg of captopril 20mg/kg and 100mg/kg water leaves extract. Mean
difference in creatinine level were significance compared to control group except for
group fed with 100mg/kg of water rhizome extract.
170
4.9 Antioxidants
4.9.1 DPPH radical scavenging activity
DPPH radical scavenging assay was used to determine the ability of hexane,
petroleum ether, chloroform, methanol and water extracts from the leaves and rhizome
of Tacca integrifolia to scavenge the free radical activity. Percentage inhibitions of
DPPH radical were determined using ELISA with absorbance reading at 517 nm. IC50
value is the concentration which the extracts inhibit 50% of DPPH radical was obtained
from the graph.
i) Ascorbic acid as positive reference standard
In the DPPH radical scavenging assay, ascorbic acid was used as positive
reference standard. Table 4.52 showed the scavenging ability of the ascorbic acid on
DPPH radicals. At 500ug/ml, the percentage inhibition of ascorbic acid against DPPH
radicals was 91.45% and its IC50 value was determined at 5.5ug/ml.
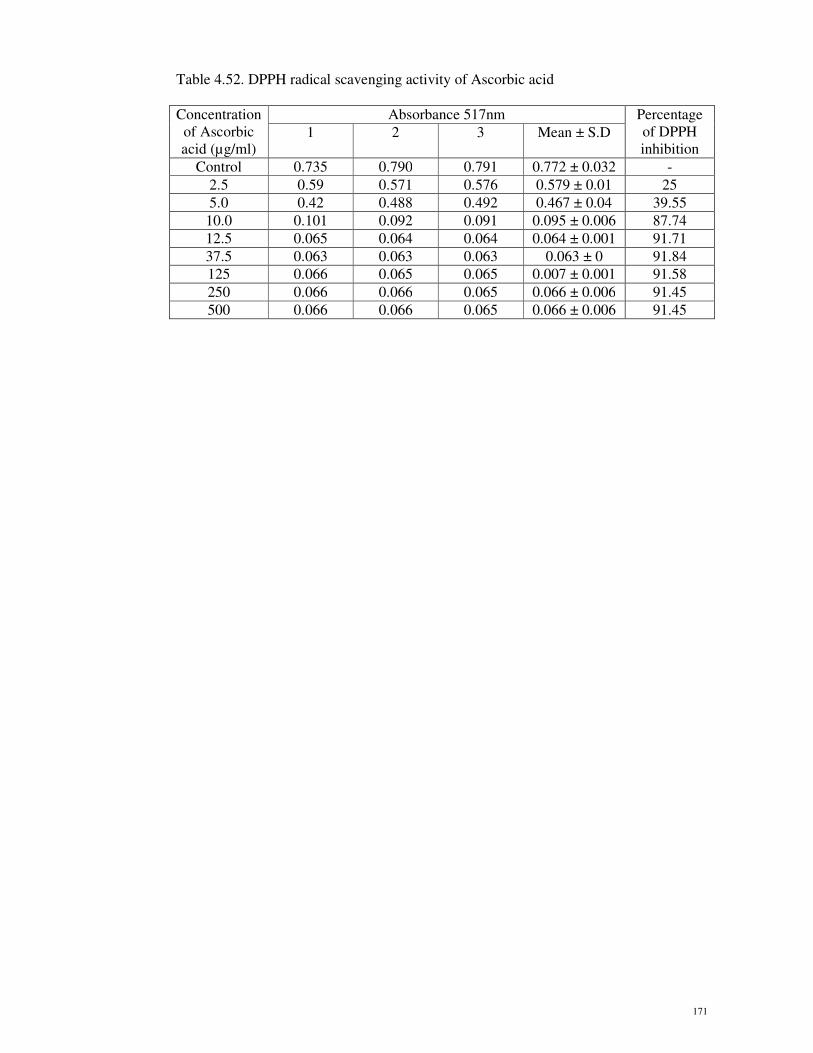
171
Table 4.52. DPPH radical scavenging activity of Ascorbic acid
Concentration
of Ascorbic
acid (µg/ml)
Absorbance 517nm Percentage
of DPPH
inhibition 1 2 3 Mean ± S.D
Control 0.735 0.790 0.791 0.772 ± 0.032 -
2.5 0.59 0.571 0.576 0.579 ± 0.01 25
5.0 0.42 0.488 0.492 0.467 ± 0.04 39.55
10.0 0.101 0.092 0.091 0.095 ± 0.006 87.74
12.5 0.065 0.064 0.064 0.064 ± 0.001 91.71
37.5 0.063 0.063 0.063 0.063 ± 0 91.84
125 0.066 0.065 0.065 0.007 ± 0.001 91.58
250 0.066 0.066 0.065 0.066 ± 0.006 91.45
500 0.066 0.066 0.065 0.066 ± 0.006 91.45
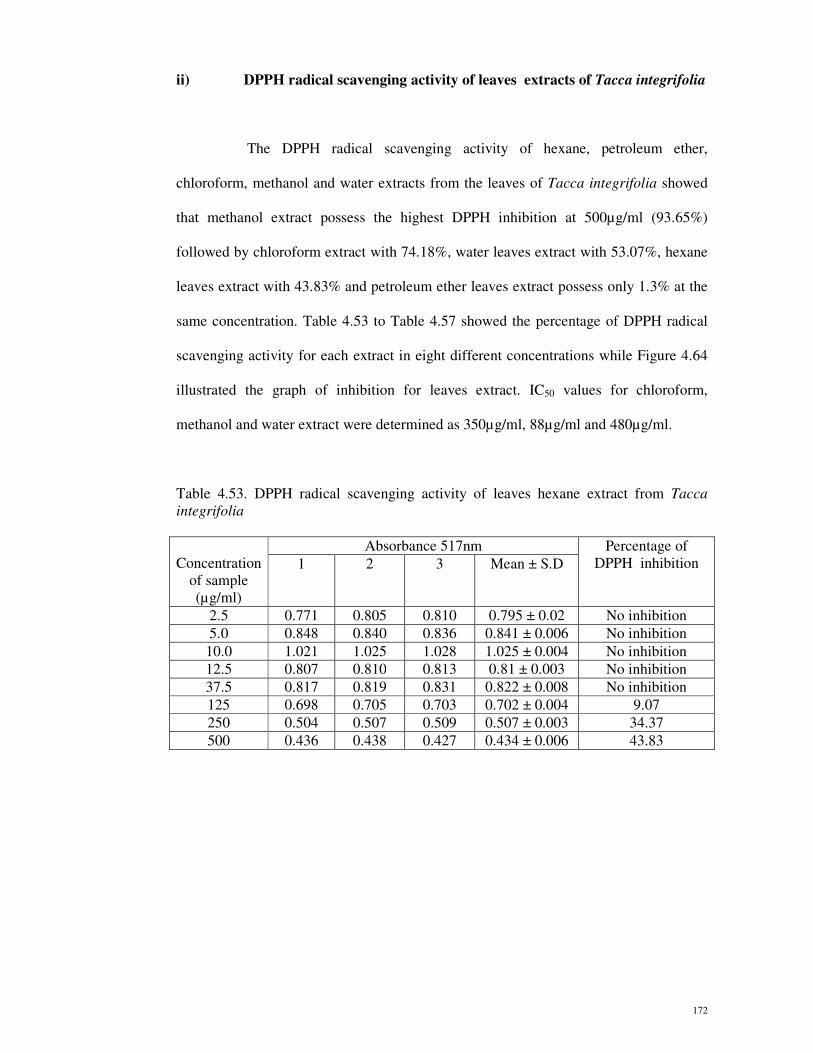
172
ii) DPPH radical scavenging activity of leaves extracts of Tacca integrifolia
The DPPH radical scavenging activity of hexane, petroleum ether,
chloroform, methanol and water extracts from the leaves of Tacca integrifolia showed
that methanol extract possess the highest DPPH inhibition at 500µg/ml (93.65%)
followed by chloroform extract with 74.18%, water leaves extract with 53.07%, hexane
leaves extract with 43.83% and petroleum ether leaves extract possess only 1.3% at the
same concentration. Table 4.53 to Table 4.57 showed the percentage of DPPH radical
scavenging activity for each extract in eight different concentrations while Figure 4.64
illustrated the graph of inhibition for leaves extract. IC50 values for chloroform,
methanol and water extract were determined as 350µg/ml, 88µg/ml and 480µg/ml.
Table 4.53. DPPH radical scavenging activity of leaves hexane extract from Tacca
integrifolia
Concentration
of sample
(µg/ml)
Absorbance 517nm Percentage of
DPPH inhibition 1 2 3 Mean ± S.D
2.5 0.771 0.805 0.810 0.795 ± 0.02 No inhibition
5.0 0.848 0.840 0.836 0.841 ± 0.006 No inhibition
10.0 1.021 1.025 1.028 1.025 ± 0.004 No inhibition
12.5 0.807 0.810 0.813 0.81 ± 0.003 No inhibition
37.5 0.817 0.819 0.831 0.822 ± 0.008 No inhibition
125 0.698 0.705 0.703 0.702 ± 0.004 9.07
250 0.504 0.507 0.509 0.507 ± 0.003 34.37
500 0.436 0.438 0.427 0.434 ± 0.006 43.83
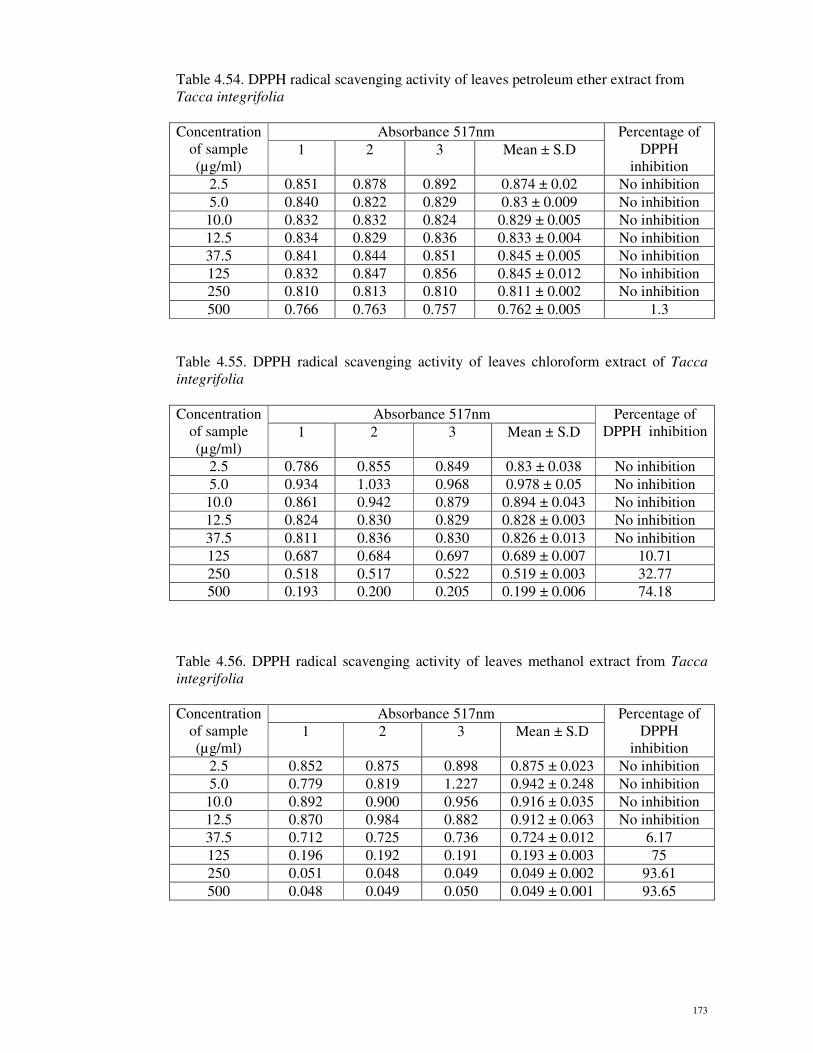
173
Table 4.54. DPPH radical scavenging activity of leaves petroleum ether extract from
Tacca integrifolia
Concentration
of sample
(µg/ml)
Absorbance 517nm Percentage of
DPPH
inhibition 1 2 3 Mean ± S.D
2.5 0.851 0.878 0.892 0.874 ± 0.02 No inhibition
5.0 0.840 0.822 0.829 0.83 ± 0.009 No inhibition
10.0 0.832 0.832 0.824 0.829 ± 0.005 No inhibition
12.5 0.834 0.829 0.836 0.833 ± 0.004 No inhibition
37.5 0.841 0.844 0.851 0.845 ± 0.005 No inhibition
125 0.832 0.847 0.856 0.845 ± 0.012 No inhibition
250 0.810 0.813 0.810 0.811 ± 0.002 No inhibition
500 0.766 0.763 0.757 0.762 ± 0.005 1.3
Table 4.55. DPPH radical scavenging activity of leaves chloroform extract of Tacca
integrifolia
Concentration
of sample
(µg/ml)
Absorbance 517nm Percentage of
DPPH inhibition 1 2 3 Mean ± S.D
2.5 0.786 0.855 0.849 0.83 ± 0.038 No inhibition
5.0 0.934 1.033 0.968 0.978 ± 0.05 No inhibition
10.0 0.861 0.942 0.879 0.894 ± 0.043 No inhibition
12.5 0.824 0.830 0.829 0.828 ± 0.003 No inhibition
37.5 0.811 0.836 0.830 0.826 ± 0.013 No inhibition
125 0.687 0.684 0.697 0.689 ± 0.007 10.71
250 0.518 0.517 0.522 0.519 ± 0.003 32.77
500 0.193 0.200 0.205 0.199 ± 0.006 74.18
Table 4.56. DPPH radical scavenging activity of leaves methanol extract from Tacca
integrifolia
Concentration
of sample
(µg/ml)
Absorbance 517nm Percentage of
DPPH
inhibition 1 2 3 Mean ± S.D
2.5 0.852 0.875 0.898 0.875 ± 0.023 No inhibition
5.0 0.779 0.819 1.227 0.942 ± 0.248 No inhibition
10.0 0.892 0.900 0.956 0.916 ± 0.035 No inhibition
12.5 0.870 0.984 0.882 0.912 ± 0.063 No inhibition
37.5 0.712 0.725 0.736 0.724 ± 0.012 6.17
125 0.196 0.192 0.191 0.193 ± 0.003 75
250 0.051 0.048 0.049 0.049 ± 0.002 93.61
500 0.048 0.049 0.050 0.049 ± 0.001 93.65
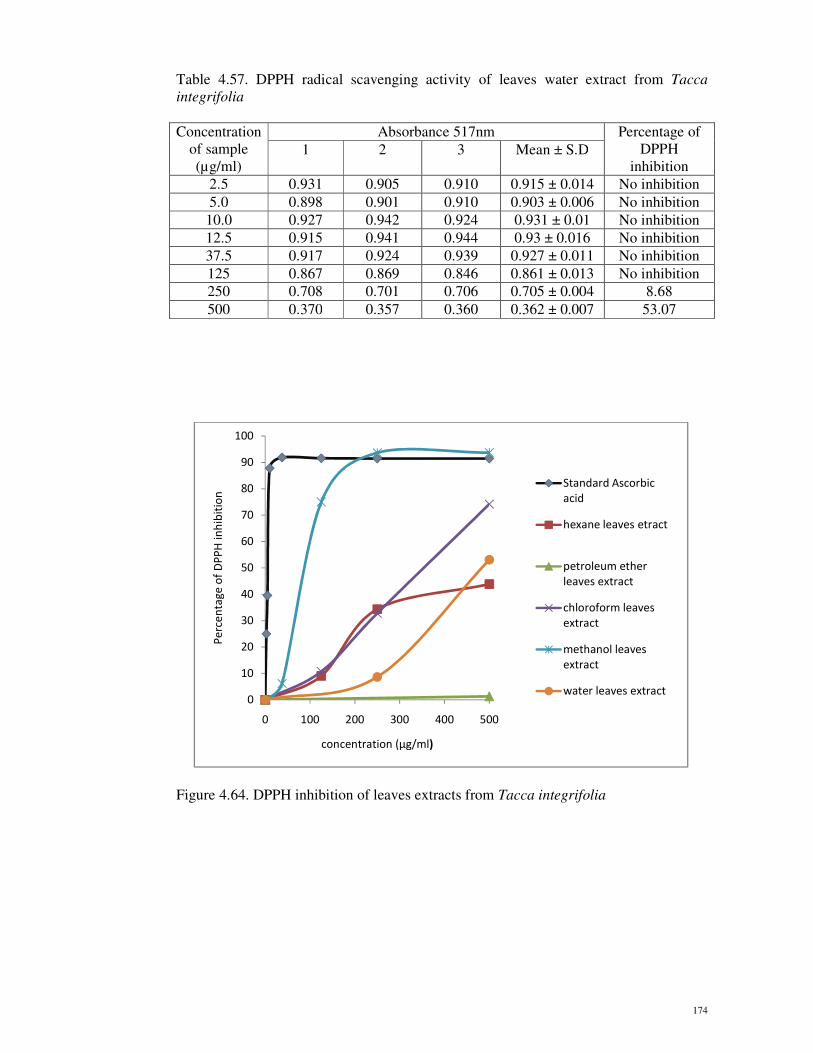
174
Table 4.57. DPPH radical scavenging activity of leaves water extract from Tacca
integrifolia
Concentration
of sample
(µg/ml)
Absorbance 517nm Percentage of
DPPH
inhibition 1 2 3 Mean ± S.D
2.5 0.931 0.905 0.910 0.915 ± 0.014 No inhibition
5.0 0.898 0.901 0.910 0.903 ± 0.006 No inhibition
10.0 0.927 0.942 0.924 0.931 ± 0.01 No inhibition
12.5 0.915 0.941 0.944 0.93 ± 0.016 No inhibition
37.5 0.917 0.924 0.939 0.927 ± 0.011 No inhibition
125 0.867 0.869 0.846 0.861 ± 0.013 No inhibition
250 0.708 0.701 0.706 0.705 ± 0.004 8.68
500 0.370 0.357 0.360 0.362 ± 0.007 53.07
Figure 4.64. DPPH inhibition of leaves extracts from Tacca integrifolia
0
10
20
30
40
50
60
70
80
90
100
0 100 200 300 400 500
Pe
rce
nta
ge
of
DP
PH
in
hib
itio
n
concentration (µg/ml)
Standard Ascorbic
acid
hexane leaves etract
petroleum ether
leaves extract
chloroform leaves
extract
methanol leaves
extract
water leaves extract
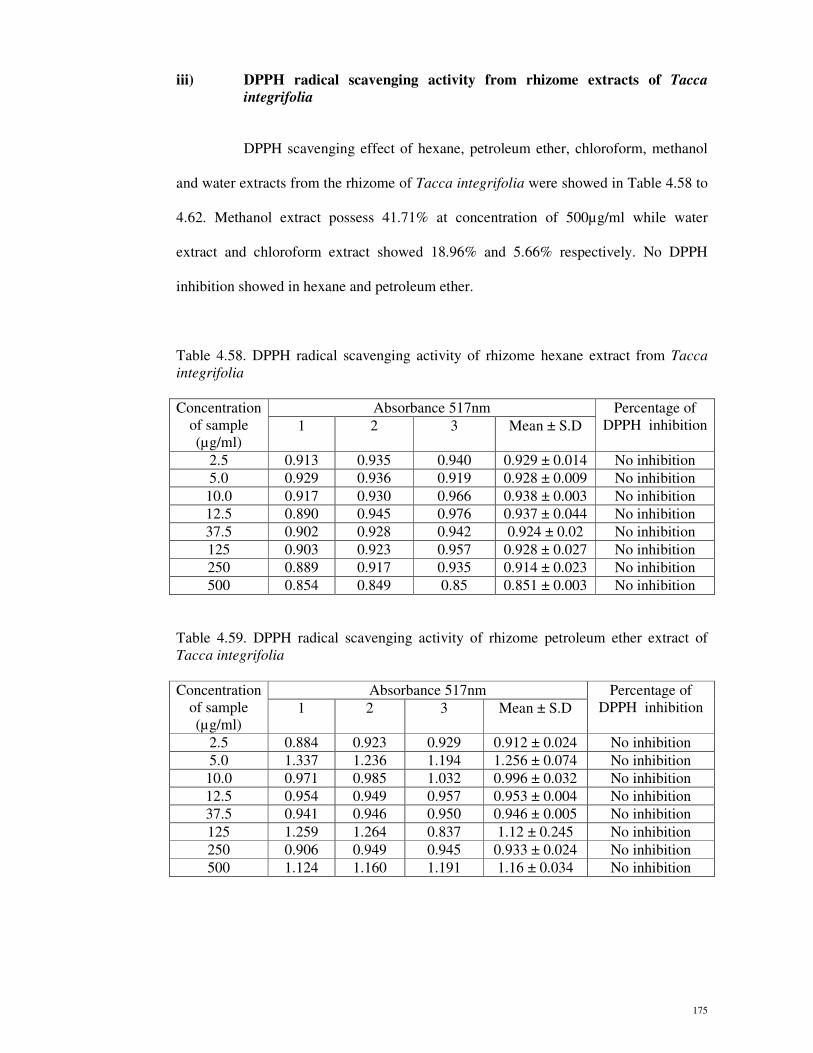
175
iii) DPPH radical scavenging activity from rhizome extracts of Tacca
integrifolia
DPPH scavenging effect of hexane, petroleum ether, chloroform, methanol
and water extracts from the rhizome of Tacca integrifolia were showed in Table 4.58 to
4.62. Methanol extract possess 41.71% at concentration of 500µg/ml while water
extract and chloroform extract showed 18.96% and 5.66% respectively. No DPPH
inhibition showed in hexane and petroleum ether.
Table 4.58. DPPH radical scavenging activity of rhizome hexane extract from Tacca
integrifolia
Concentration
of sample
(µg/ml)
Absorbance 517nm Percentage of
DPPH inhibition 1 2 3 Mean ± S.D
2.5 0.913 0.935 0.940 0.929 ± 0.014 No inhibition
5.0 0.929 0.936 0.919 0.928 ± 0.009 No inhibition
10.0 0.917 0.930 0.966 0.938 ± 0.003 No inhibition
12.5 0.890 0.945 0.976 0.937 ± 0.044 No inhibition
37.5 0.902 0.928 0.942 0.924 ± 0.02 No inhibition
125 0.903 0.923 0.957 0.928 ± 0.027 No inhibition
250 0.889 0.917 0.935 0.914 ± 0.023 No inhibition
500 0.854 0.849 0.85 0.851 ± 0.003 No inhibition
Table 4.59. DPPH radical scavenging activity of rhizome petroleum ether extract of
Tacca integrifolia
Concentration
of sample
(µg/ml)
Absorbance 517nm Percentage of
DPPH inhibition 1 2 3 Mean ± S.D
2.5 0.884 0.923 0.929 0.912 ± 0.024 No inhibition
5.0 1.337 1.236 1.194 1.256 ± 0.074 No inhibition
10.0 0.971 0.985 1.032 0.996 ± 0.032 No inhibition
12.5 0.954 0.949 0.957 0.953 ± 0.004 No inhibition
37.5 0.941 0.946 0.950 0.946 ± 0.005 No inhibition
125 1.259 1.264 0.837 1.12 ± 0.245 No inhibition
250 0.906 0.949 0.945 0.933 ± 0.024 No inhibition
500 1.124 1.160 1.191 1.16 ± 0.034 No inhibition
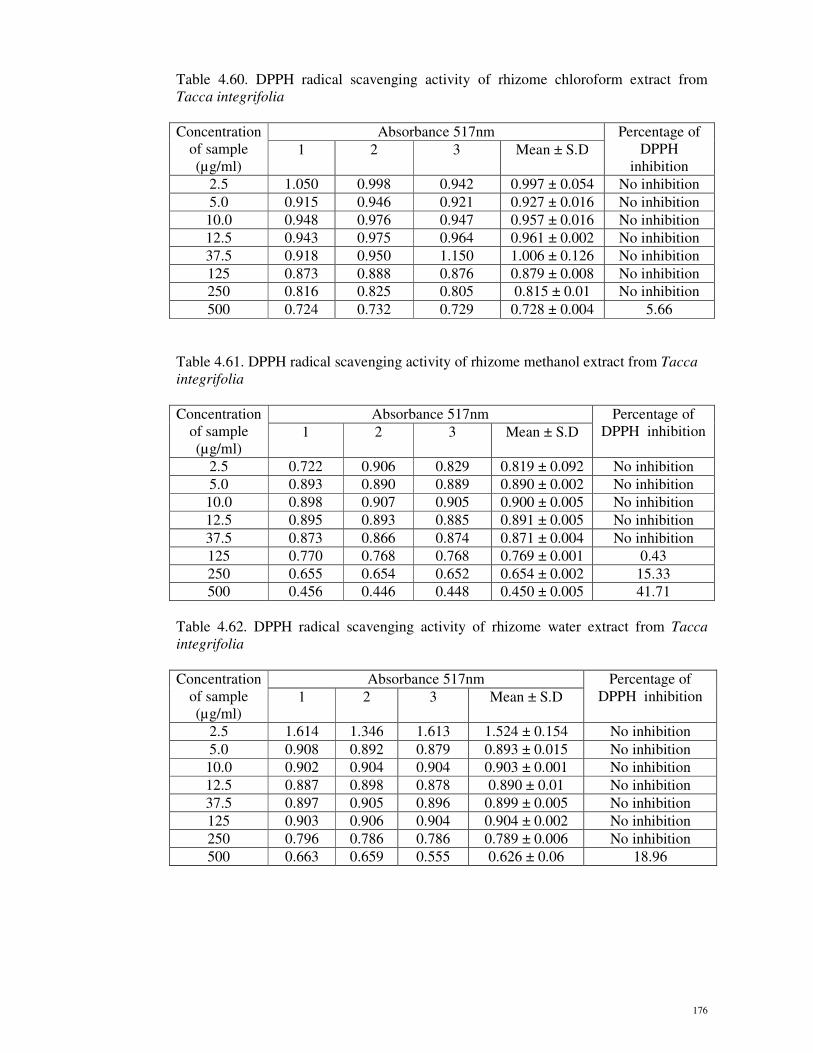
176
Table 4.60. DPPH radical scavenging activity of rhizome chloroform extract from
Tacca integrifolia
Concentration
of sample
(µg/ml)
Absorbance 517nm Percentage of
DPPH
inhibition 1 2 3 Mean ± S.D
2.5 1.050 0.998 0.942 0.997 ± 0.054 No inhibition
5.0 0.915 0.946 0.921 0.927 ± 0.016 No inhibition
10.0 0.948 0.976 0.947 0.957 ± 0.016 No inhibition
12.5 0.943 0.975 0.964 0.961 ± 0.002 No inhibition
37.5 0.918 0.950 1.150 1.006 ± 0.126 No inhibition
125 0.873 0.888 0.876 0.879 ± 0.008 No inhibition
250 0.816 0.825 0.805 0.815 ± 0.01 No inhibition
500 0.724 0.732 0.729 0.728 ± 0.004 5.66
Table 4.61. DPPH radical scavenging activity of rhizome methanol extract from Tacca
integrifolia
Concentration
of sample
(µg/ml)
Absorbance 517nm Percentage of
DPPH inhibition 1 2 3 Mean ± S.D
2.5 0.722 0.906 0.829 0.819 ± 0.092 No inhibition
5.0 0.893 0.890 0.889 0.890 ± 0.002 No inhibition
10.0 0.898 0.907 0.905 0.900 ± 0.005 No inhibition
12.5 0.895 0.893 0.885 0.891 ± 0.005 No inhibition
37.5 0.873 0.866 0.874 0.871 ± 0.004 No inhibition
125 0.770 0.768 0.768 0.769 ± 0.001 0.43
250 0.655 0.654 0.652 0.654 ± 0.002 15.33
500 0.456 0.446 0.448 0.450 ± 0.005 41.71
Table 4.62. DPPH radical scavenging activity of rhizome water extract from Tacca
integrifolia
Concentration
of sample
(µg/ml)
Absorbance 517nm Percentage of
DPPH inhibition 1 2 3 Mean ± S.D
2.5 1.614 1.346 1.613 1.524 ± 0.154 No inhibition
5.0 0.908 0.892 0.879 0.893 ± 0.015 No inhibition
10.0 0.902 0.904 0.904 0.903 ± 0.001 No inhibition
12.5 0.887 0.898 0.878 0.890 ± 0.01 No inhibition
37.5 0.897 0.905 0.896 0.899 ± 0.005 No inhibition
125 0.903 0.906 0.904 0.904 ± 0.002 No inhibition
250 0.796 0.786 0.786 0.789 ± 0.006 No inhibition
500 0.663 0.659 0.555 0.626 ± 0.06 18.96
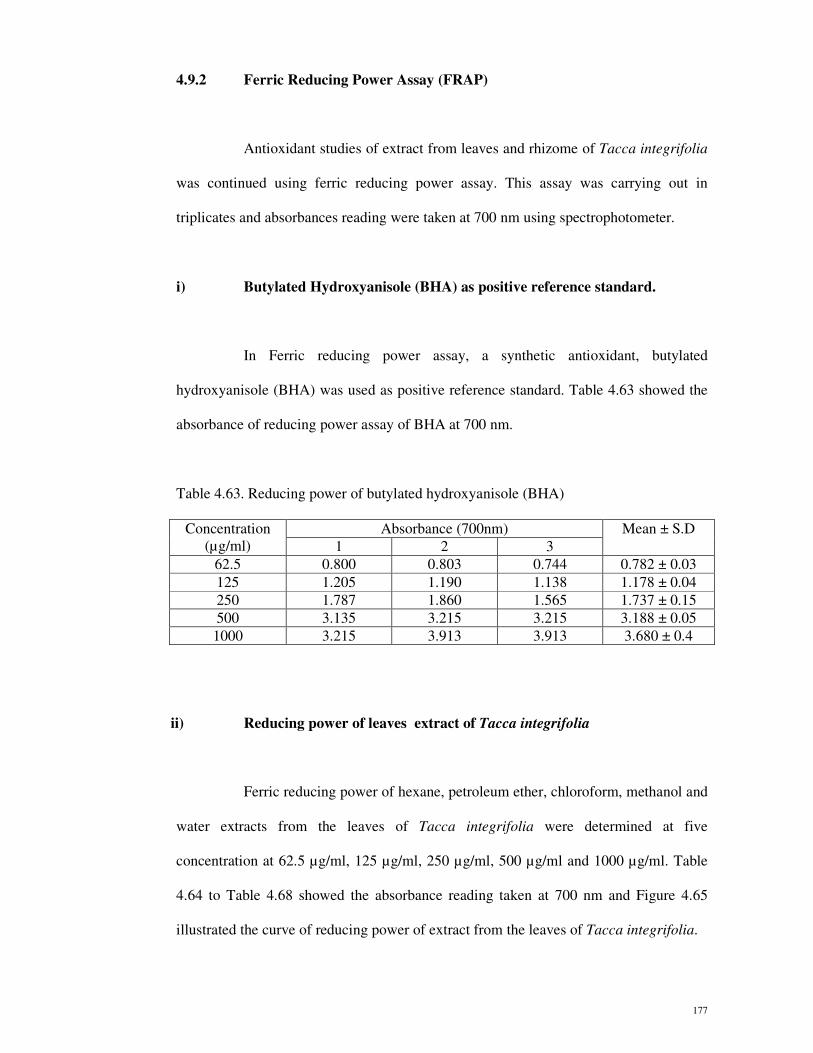
177
4.9.2 Ferric Reducing Power Assay (FRAP)
Antioxidant studies of extract from leaves and rhizome of Tacca integrifolia
was continued using ferric reducing power assay. This assay was carrying out in
triplicates and absorbances reading were taken at 700 nm using spectrophotometer.
i) Butylated Hydroxyanisole (BHA) as positive reference standard.
In Ferric reducing power assay, a synthetic antioxidant, butylated
hydroxyanisole (BHA) was used as positive reference standard. Table 4.63 showed the
absorbance of reducing power assay of BHA at 700 nm.
Table 4.63. Reducing power of butylated hydroxyanisole (BHA)
Concentration
(µg/ml)
Absorbance (700nm) Mean ± S.D
1 2 3
62.5 0.800 0.803 0.744 0.782 ± 0.03
125 1.205 1.190 1.138 1.178 ± 0.04
250 1.787 1.860 1.565 1.737 ± 0.15
500 3.135 3.215 3.215 3.188 ± 0.05
1000 3.215 3.913 3.913 3.680 ± 0.4
ii) Reducing power of leaves extract of Tacca integrifolia
Ferric reducing power of hexane, petroleum ether, chloroform, methanol and
water extracts from the leaves of Tacca integrifolia were determined at five
concentration at 62.5 µg/ml, 125 µg/ml, 250 µg/ml, 500 µg/ml and 1000 µg/ml. Table
4.64 to Table 4.68 showed the absorbance reading taken at 700 nm and Figure 4.65
illustrated the curve of reducing power of extract from the leaves of Tacca integrifolia.
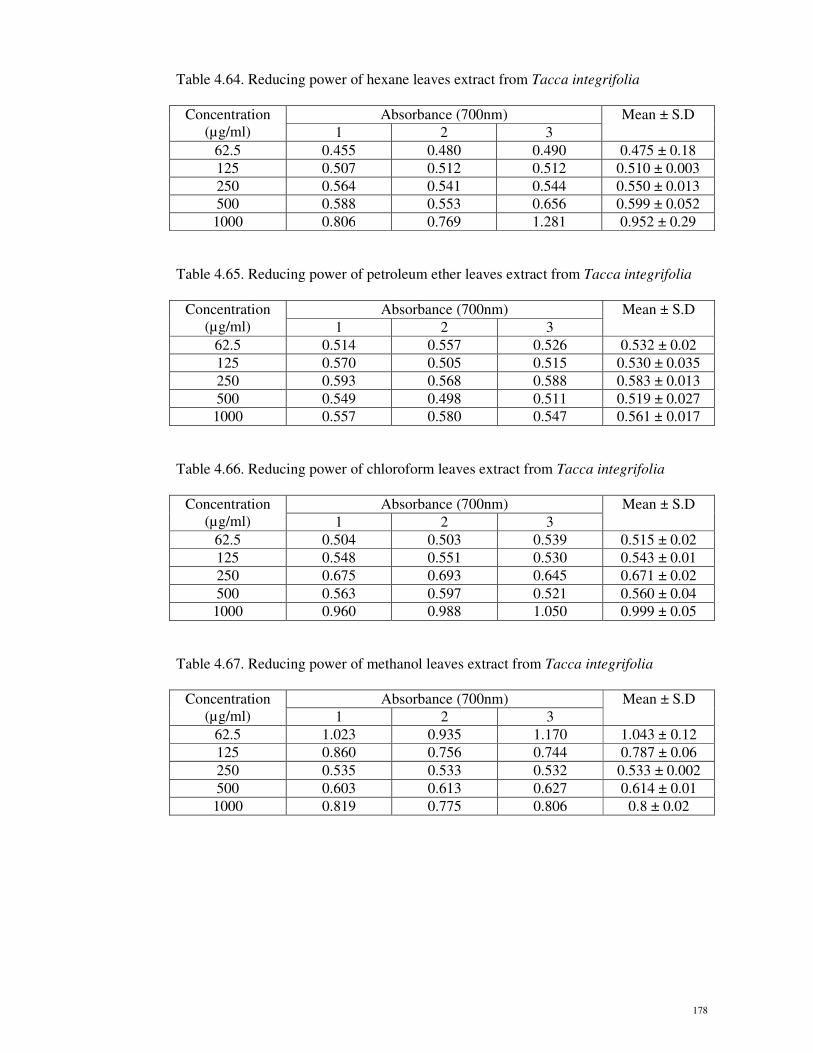
178
Table 4.64. Reducing power of hexane leaves extract from Tacca integrifolia
Concentration
(µg/ml)
Absorbance (700nm) Mean ± S.D
1 2 3
62.5 0.455 0.480 0.490 0.475 ± 0.18
125 0.507 0.512 0.512 0.510 ± 0.003
250 0.564 0.541 0.544 0.550 ± 0.013
500 0.588 0.553 0.656 0.599 ± 0.052
1000 0.806 0.769 1.281 0.952 ± 0.29
Table 4.65. Reducing power of petroleum ether leaves extract from Tacca integrifolia
Concentration
(µg/ml)
Absorbance (700nm) Mean ± S.D
1 2 3
62.5 0.514 0.557 0.526 0.532 ± 0.02
125 0.570 0.505 0.515 0.530 ± 0.035
250 0.593 0.568 0.588 0.583 ± 0.013
500 0.549 0.498 0.511 0.519 ± 0.027
1000 0.557 0.580 0.547 0.561 ± 0.017
Table 4.66. Reducing power of chloroform leaves extract from Tacca integrifolia
Concentration
(µg/ml)
Absorbance (700nm) Mean ± S.D
1 2 3
62.5 0.504 0.503 0.539 0.515 ± 0.02
125 0.548 0.551 0.530 0.543 ± 0.01
250 0.675 0.693 0.645 0.671 ± 0.02
500 0.563 0.597 0.521 0.560 ± 0.04
1000 0.960 0.988 1.050 0.999 ± 0.05
Table 4.67. Reducing power of methanol leaves extract from Tacca integrifolia
Concentration
(µg/ml)
Absorbance (700nm) Mean ± S.D
1 2 3
62.5 1.023 0.935 1.170 1.043 ± 0.12
125 0.860 0.756 0.744 0.787 ± 0.06
250 0.535 0.533 0.532 0.533 ± 0.002
500 0.603 0.613 0.627 0.614 ± 0.01
1000 0.819 0.775 0.806 0.8 ± 0.02
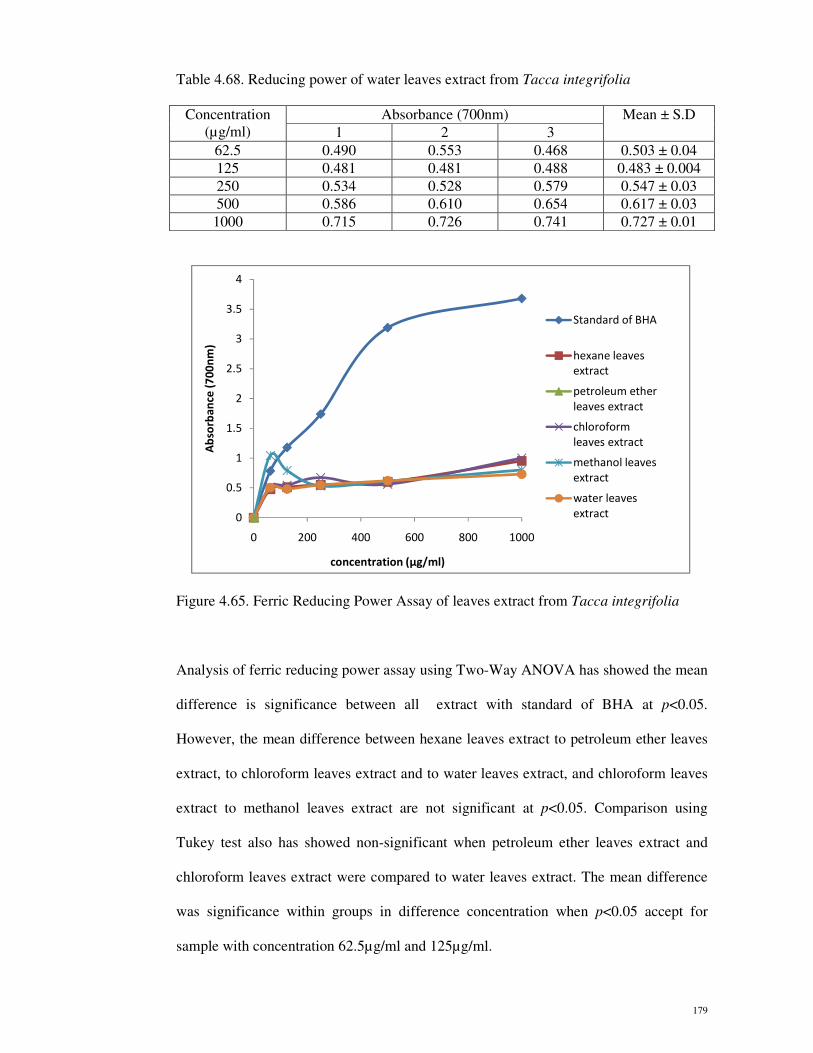
179
Table 4.68. Reducing power of water leaves extract from Tacca integrifolia
Concentration
(µg/ml)
Absorbance (700nm) Mean ± S.D
1 2 3
62.5 0.490 0.553 0.468 0.503 ± 0.04
125 0.481 0.481 0.488 0.483 ± 0.004
250 0.534 0.528 0.579 0.547 ± 0.03
500 0.586 0.610 0.654 0.617 ± 0.03
1000 0.715 0.726 0.741 0.727 ± 0.01
Figure 4.65. Ferric Reducing Power Assay of leaves extract from Tacca integrifolia
Analysis of ferric reducing power assay using Two-Way ANOVA has showed the mean
difference is significance between all extract with standard of BHA at p<0.05.
However, the mean difference between hexane leaves extract to petroleum ether leaves
extract, to chloroform leaves extract and to water leaves extract, and chloroform leaves
extract to methanol leaves extract are not significant at p<0.05. Comparison using
Tukey test also has showed non-significant when petroleum ether leaves extract and
chloroform leaves extract were compared to water leaves extract. The mean difference
was significance within groups in difference concentration when p<0.05 accept for
sample with concentration 62.5µg/ml and 125µg/ml.
0
0.5
1
1.5
2
2.5
3
3.5
4
0 200 400 600 800 1000
Ab
sorb
an
ce (
70
0n
m)
concentration (µg/ml)
Standard of BHA
hexane leaves
extract
petroleum ether
leaves extract
chloroform
leaves extract
methanol leaves
extract
water leaves
extract
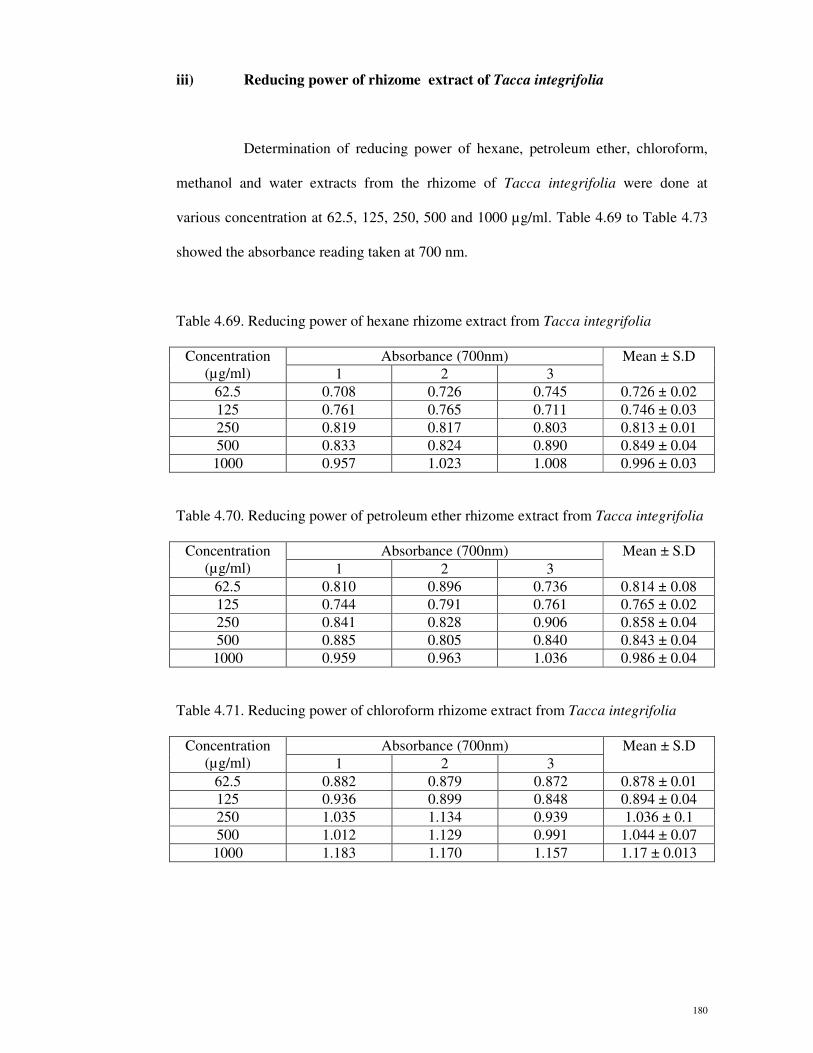
180
iii) Reducing power of rhizome extract of Tacca integrifolia
Determination of reducing power of hexane, petroleum ether, chloroform,
methanol and water extracts from the rhizome of Tacca integrifolia were done at
various concentration at 62.5, 125, 250, 500 and 1000 µg/ml. Table 4.69 to Table 4.73
showed the absorbance reading taken at 700 nm.
Table 4.69. Reducing power of hexane rhizome extract from Tacca integrifolia
Concentration
(µg/ml)
Absorbance (700nm) Mean ± S.D
1 2 3
62.5 0.708 0.726 0.745 0.726 ± 0.02
125 0.761 0.765 0.711 0.746 ± 0.03
250 0.819 0.817 0.803 0.813 ± 0.01
500 0.833 0.824 0.890 0.849 ± 0.04
1000 0.957 1.023 1.008 0.996 ± 0.03
Table 4.70. Reducing power of petroleum ether rhizome extract from Tacca integrifolia
Concentration
(µg/ml)
Absorbance (700nm) Mean ± S.D
1 2 3
62.5 0.810 0.896 0.736 0.814 ± 0.08
125 0.744 0.791 0.761 0.765 ± 0.02
250 0.841 0.828 0.906 0.858 ± 0.04
500 0.885 0.805 0.840 0.843 ± 0.04
1000 0.959 0.963 1.036 0.986 ± 0.04
Table 4.71. Reducing power of chloroform rhizome extract from Tacca integrifolia
Concentration
(µg/ml)
Absorbance (700nm) Mean ± S.D
1 2 3
62.5 0.882 0.879 0.872 0.878 ± 0.01
125 0.936 0.899 0.848 0.894 ± 0.04
250 1.035 1.134 0.939 1.036 ± 0.1
500 1.012 1.129 0.991 1.044 ± 0.07
1000 1.183 1.170 1.157 1.17 ± 0.013
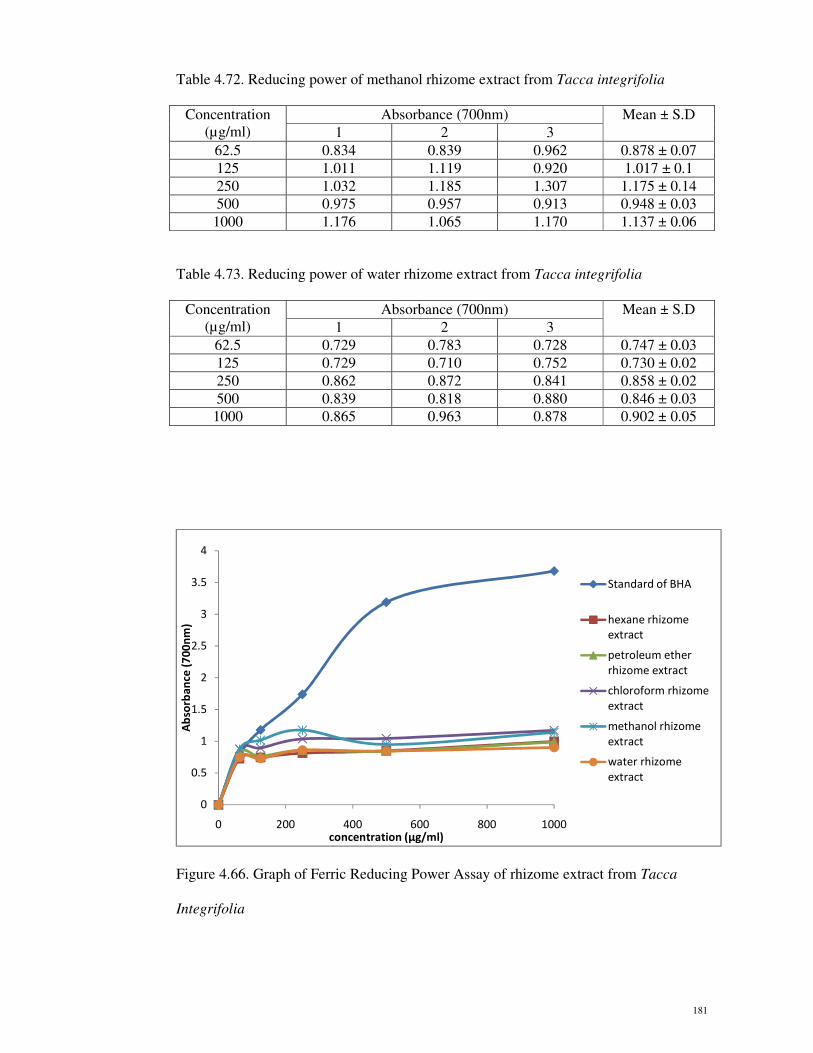
181
Table 4.72. Reducing power of methanol rhizome extract from Tacca integrifolia
Concentration
(µg/ml)
Absorbance (700nm) Mean ± S.D
1 2 3
62.5 0.834 0.839 0.962 0.878 ± 0.07
125 1.011 1.119 0.920 1.017 ± 0.1
250 1.032 1.185 1.307 1.175 ± 0.14
500 0.975 0.957 0.913 0.948 ± 0.03
1000 1.176 1.065 1.170 1.137 ± 0.06
Table 4.73. Reducing power of water rhizome extract from Tacca integrifolia
Concentration
(µg/ml)
Absorbance (700nm) Mean ± S.D
1 2 3
62.5 0.729 0.783 0.728 0.747 ± 0.03
125 0.729 0.710 0.752 0.730 ± 0.02
250 0.862 0.872 0.841 0.858 ± 0.02
500 0.839 0.818 0.880 0.846 ± 0.03
1000 0.865 0.963 0.878 0.902 ± 0.05
Figure 4.66. Graph of Ferric Reducing Power Assay of rhizome extract from Tacca
Integrifolia
0
0.5
1
1.5
2
2.5
3
3.5
4
0 200 400 600 800 1000
Ab
sorb
an
ce (
70
0n
m)
concentration (µg/ml)
Standard of BHA
hexane rhizome
extract
petroleum ether
rhizome extract
chloroform rhizome
extract
methanol rhizome
extract
water rhizome
extract

182
Analysis of ferric reducing power assay using Two-Way ANOVA has showed the mean
difference is significance between all extract with standard of BHA at p<0.05.
However, the mean difference between hexane rhizome extract to petroleum ether
rhizome extract, and to water rhizome extract, and between chloroform rhizome extract
to methanol rhizome extract are not significant at p<0.05. Comparison using Tukey test
also has showed non-significant in the mean difference of concentration 62.5µg/ml and
125µg/ml while other had showed significance at p<0.05.
4.9.3 Metal Chelating Power Assay
The antioxidant activity of hexane, petroleum ether, chloroform, methanol
and water from the leaves and rhizome of Tacca integrifolia were determined using
metal chelating assay that was based on the chelating effects of Fr2+
ions by ferrozine
reagent. Assay was carried out in triplicates and the absorbance reading was read using
ELISA.
i) Ethylenediaminetetraacetic acid (EDTA) as standard
Ethylenediaminetetraacetic acid (EDTA) was used as positive reference standard in
Metal Chelating activity. Five different concentration of EDTA were prepared at
1mg/ml, 2mg/ml, 3mg/ml, 4mg/ml and 5mg/ml and was added with ferrozine and FeCl2
followed by absorbance reading at 562nm ELISA. Reading was carried out in triplicate
to obtain mean absorbance, thus determined the percentage of inhibition.
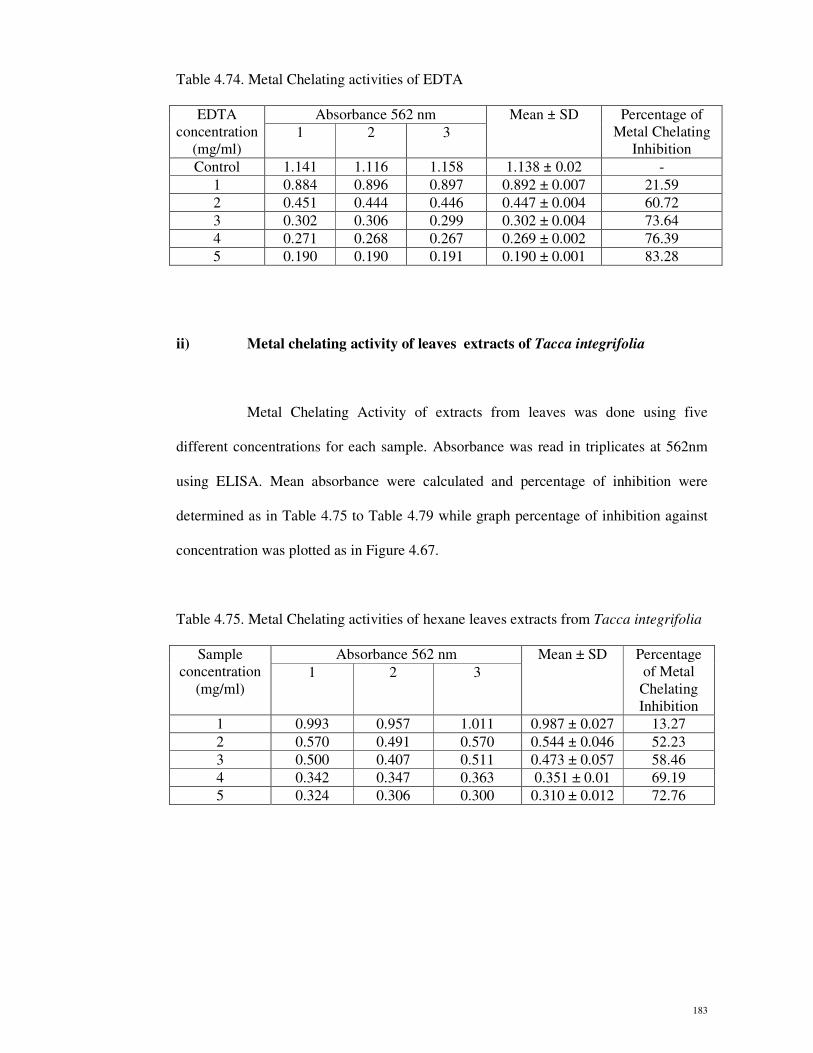
183
Table 4.74. Metal Chelating activities of EDTA
EDTA
concentration
(mg/ml)
Absorbance 562 nm Mean ± SD Percentage of
Metal Chelating
Inhibition 1 2 3
Control 1.141 1.116 1.158 1.138 ± 0.02 -
1 0.884 0.896 0.897 0.892 ± 0.007 21.59
2 0.451 0.444 0.446 0.447 ± 0.004 60.72
3 0.302 0.306 0.299 0.302 ± 0.004 73.64
4 0.271 0.268 0.267 0.269 ± 0.002 76.39
5 0.190 0.190 0.191 0.190 ± 0.001 83.28
ii) Metal chelating activity of leaves extracts of Tacca integrifolia
Metal Chelating Activity of extracts from leaves was done using five
different concentrations for each sample. Absorbance was read in triplicates at 562nm
using ELISA. Mean absorbance were calculated and percentage of inhibition were
determined as in Table 4.75 to Table 4.79 while graph percentage of inhibition against
concentration was plotted as in Figure 4.67.
Table 4.75. Metal Chelating activities of hexane leaves extracts from Tacca integrifolia
Sample
concentration
(mg/ml)
Absorbance 562 nm Mean ± SD Percentage
of Metal
Chelating
Inhibition
1 2 3
1 0.993 0.957 1.011 0.987 ± 0.027 13.27
2 0.570 0.491 0.570 0.544 ± 0.046 52.23
3 0.500 0.407 0.511 0.473 ± 0.057 58.46
4 0.342 0.347 0.363 0.351 ± 0.01 69.19
5 0.324 0.306 0.300 0.310 ± 0.012 72.76
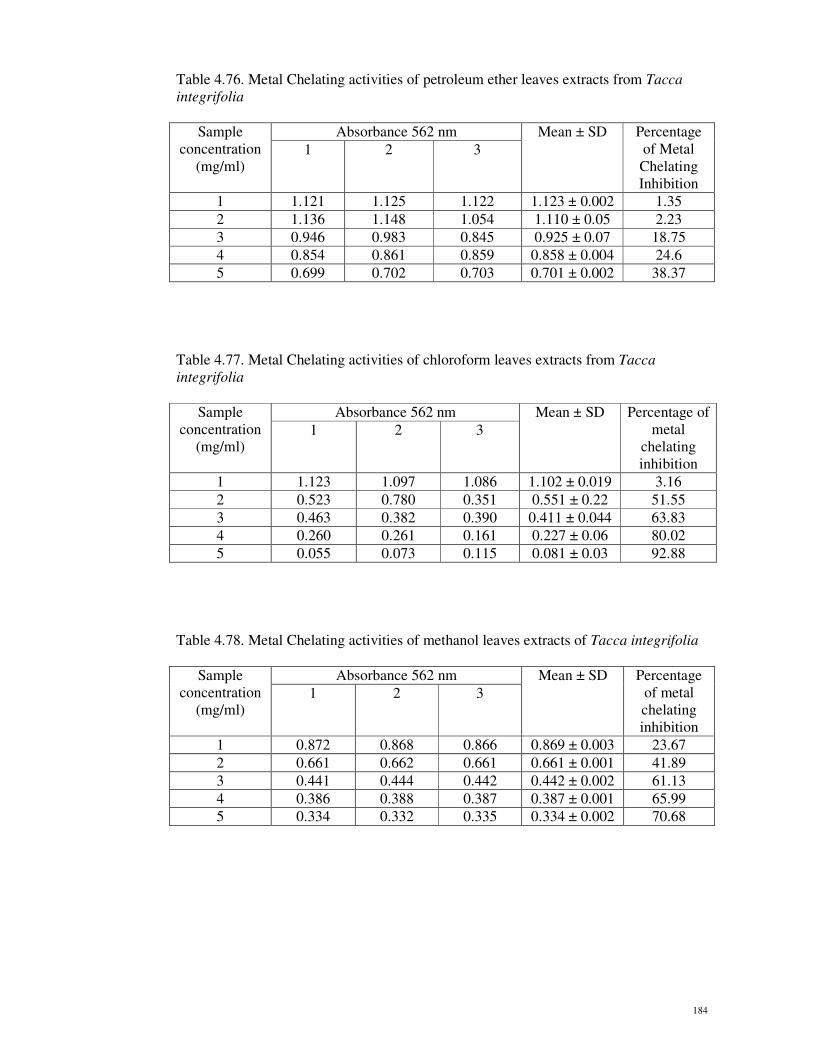
184
Table 4.76. Metal Chelating activities of petroleum ether leaves extracts from Tacca
integrifolia
Sample
concentration
(mg/ml)
Absorbance 562 nm Mean ± SD Percentage
of Metal
Chelating
Inhibition
1 2 3
1 1.121 1.125 1.122 1.123 ± 0.002 1.35
2 1.136 1.148 1.054 1.110 ± 0.05 2.23
3 0.946 0.983 0.845 0.925 ± 0.07 18.75
4 0.854 0.861 0.859 0.858 ± 0.004 24.6
5 0.699 0.702 0.703 0.701 ± 0.002 38.37
Table 4.77. Metal Chelating activities of chloroform leaves extracts from Tacca
integrifolia
Sample
concentration
(mg/ml)
Absorbance 562 nm Mean ± SD Percentage of
metal
chelating
inhibition
1 2 3
1 1.123 1.097 1.086 1.102 ± 0.019 3.16
2 0.523 0.780 0.351 0.551 ± 0.22 51.55
3 0.463 0.382 0.390 0.411 ± 0.044 63.83
4 0.260 0.261 0.161 0.227 ± 0.06 80.02
5 0.055 0.073 0.115 0.081 ± 0.03 92.88
Table 4.78. Metal Chelating activities of methanol leaves extracts of Tacca integrifolia
Sample
concentration
(mg/ml)
Absorbance 562 nm Mean ± SD Percentage
of metal
chelating
inhibition
1 2 3
1 0.872 0.868 0.866 0.869 ± 0.003 23.67
2 0.661 0.662 0.661 0.661 ± 0.001 41.89
3 0.441 0.444 0.442 0.442 ± 0.002 61.13
4 0.386 0.388 0.387 0.387 ± 0.001 65.99
5 0.334 0.332 0.335 0.334 ± 0.002 70.68
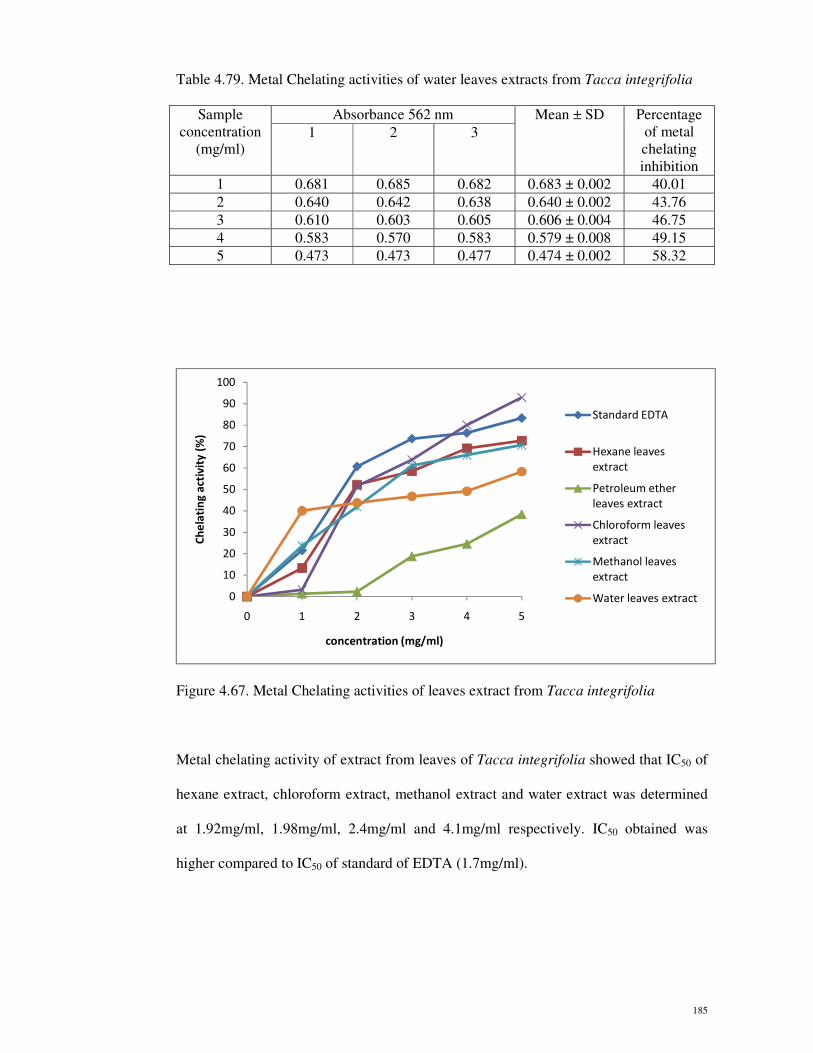
185
Table 4.79. Metal Chelating activities of water leaves extracts from Tacca integrifolia
Sample
concentration
(mg/ml)
Absorbance 562 nm Mean ± SD Percentage
of metal
chelating
inhibition
1 2 3
1 0.681 0.685 0.682 0.683 ± 0.002 40.01
2 0.640 0.642 0.638 0.640 ± 0.002 43.76
3 0.610 0.603 0.605 0.606 ± 0.004 46.75
4 0.583 0.570 0.583 0.579 ± 0.008 49.15
5 0.473 0.473 0.477 0.474 ± 0.002 58.32
Figure 4.67. Metal Chelating activities of leaves extract from Tacca integrifolia
Metal chelating activity of extract from leaves of Tacca integrifolia showed that IC50 of
hexane extract, chloroform extract, methanol extract and water extract was determined
at 1.92mg/ml, 1.98mg/ml, 2.4mg/ml and 4.1mg/ml respectively. IC50 obtained was
higher compared to IC50 of standard of EDTA (1.7mg/ml).
0
10
20
30
40
50
60
70
80
90
100
0 1 2 3 4 5
Ch
ela
tin
g a
ctiv
ity
(%
)
concentration (mg/ml)
Standard EDTA
Hexane leaves
extract
Petroleum ether
leaves extract
Chloroform leaves
extract
Methanol leaves
extract
Water leaves extract

186
iii) Metal chelating activity of rhizome extracts of Tacca integrifolia
Metal Chelating Activity of rhizome extracts was determined in five different
concentrations at 1mg/ml, 2mg/ml, 3mg/ml, 4mg/ml and 5mg/ml. Absorbance 562nm
was read using ELISA and reading was carried out in triplicate. Mean absorbance were
calculated and percentage of inhibition were determine as in Table 4.80 to Table 4.84.
Table 4.80. Metal Chelating activities of hexane rhizome extracts from Tacca
integrifolia
Sample
concentration
(mg/ml)
Absorbance 562 nm Mean ± SD Percentage
of metal
chelating
inhibition
1 2 3
1 1.065 1.066 1.064 1.065 ± 0.001 6.41
2 0.762 0.761 0.762 0.762 ± 0.001 33.07
3 0.703 0.701 0.702 0.702 ± 0.001 38.31
4 0.587 0.599 0.603 0.596 ± 0.008 47.6
5 0.578 0.576 0.579 0.578 ± 0.002 49.24
Table 4.81. Metal Chelating activities of petroleum ether rhizome extracts from Tacca
integrifolia
Sample
concentration
(mg/ml)
Absorbance 562 nm Mean ± SD Percentage
of metal
chelating
inhibition
1 2 3
1 1.031 1.032 1.031 1.03 ± 0.001 9.37
2 0.899 0.896 0.898 0.898 ± 0.002 21.12
3 0.864 0.866 0.865 0.865 ± 0.001 23.99
4 0.807 0.803 0.804 0.805 ± 0.002 29.29
5 0.566 0.564 0.568 0.566 ± 0.002 50.26
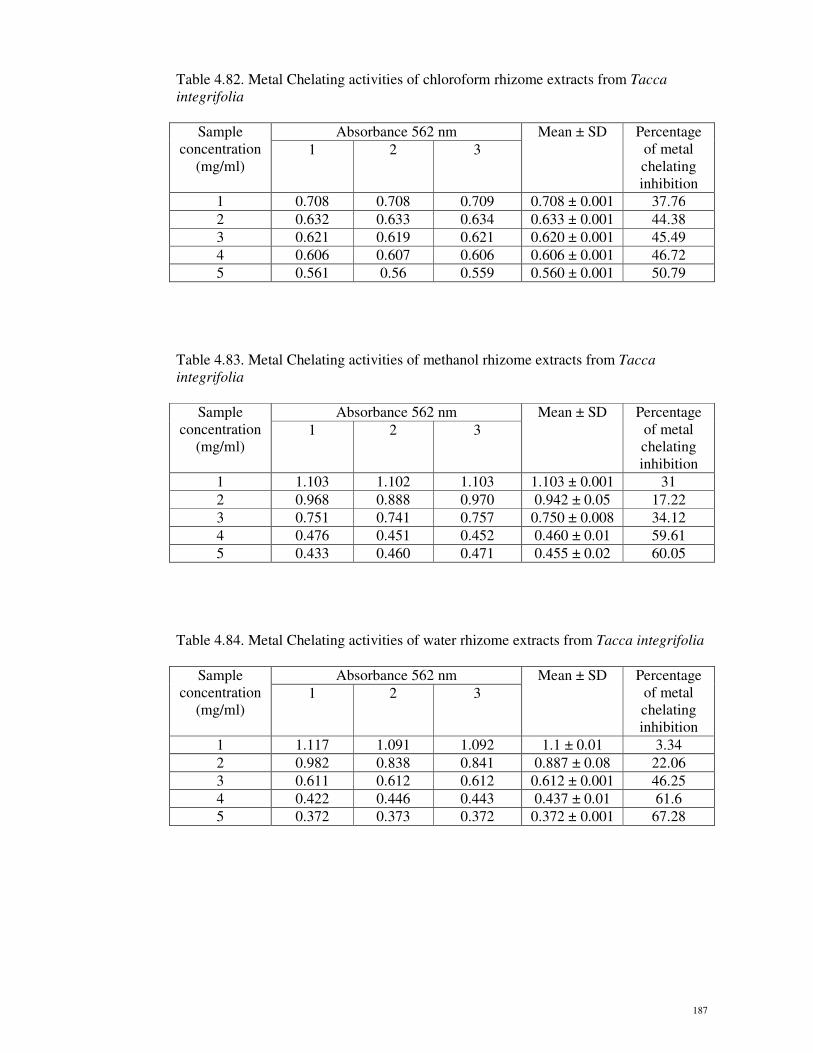
187
Table 4.82. Metal Chelating activities of chloroform rhizome extracts from Tacca
integrifolia
Sample
concentration
(mg/ml)
Absorbance 562 nm Mean ± SD Percentage
of metal
chelating
inhibition
1 2 3
1 0.708 0.708 0.709 0.708 ± 0.001 37.76
2 0.632 0.633 0.634 0.633 ± 0.001 44.38
3 0.621 0.619 0.621 0.620 ± 0.001 45.49
4 0.606 0.607 0.606 0.606 ± 0.001 46.72
5 0.561 0.56 0.559 0.560 ± 0.001 50.79
Table 4.83. Metal Chelating activities of methanol rhizome extracts from Tacca
integrifolia
Sample
concentration
(mg/ml)
Absorbance 562 nm Mean ± SD Percentage
of metal
chelating
inhibition
1 2 3
1 1.103 1.102 1.103 1.103 ± 0.001 31
2 0.968 0.888 0.970 0.942 ± 0.05 17.22
3 0.751 0.741 0.757 0.750 ± 0.008 34.12
4 0.476 0.451 0.452 0.460 ± 0.01 59.61
5 0.433 0.460 0.471 0.455 ± 0.02 60.05
Table 4.84. Metal Chelating activities of water rhizome extracts from Tacca integrifolia
Sample
concentration
(mg/ml)
Absorbance 562 nm Mean ± SD Percentage
of metal
chelating
inhibition
1 2 3
1 1.117 1.091 1.092 1.1 ± 0.01 3.34
2 0.982 0.838 0.841 0.887 ± 0.08 22.06
3 0.611 0.612 0.612 0.612 ± 0.001 46.25
4 0.422 0.446 0.443 0.437 ± 0.01 61.6
5 0.372 0.373 0.372 0.372 ± 0.001 67.28
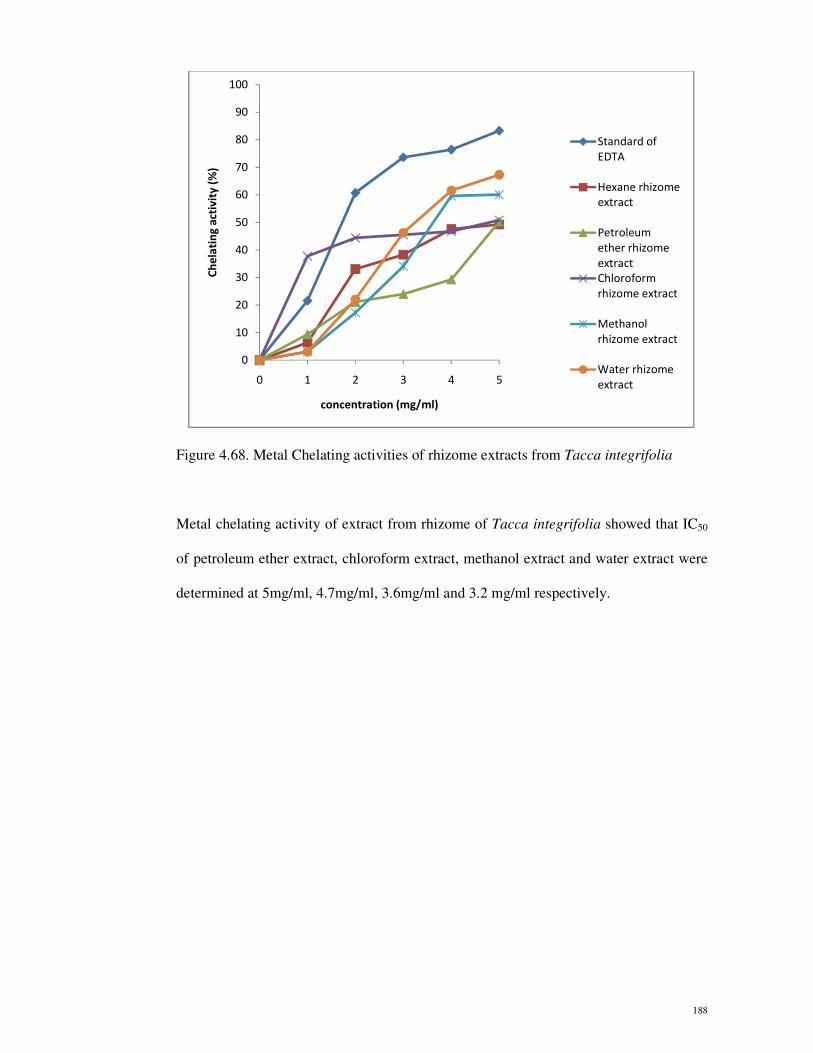
188
Figure 4.68. Metal Chelating activities of rhizome extracts from Tacca integrifolia
Metal chelating activity of extract from rhizome of Tacca integrifolia showed that IC50
of petroleum ether extract, chloroform extract, methanol extract and water extract were
determined at 5mg/ml, 4.7mg/ml, 3.6mg/ml and 3.2 mg/ml respectively.
0
10
20
30
40
50
60
70
80
90
100
0 1 2 3 4 5
Ch
ela
tin
g a
ctiv
ity
(%
)
concentration (mg/ml)
Standard of
EDTA
Hexane rhizome
extract
Petroleum
ether rhizome
extract
Chloroform
rhizome extract
Methanol
rhizome extract
Water rhizome
extract
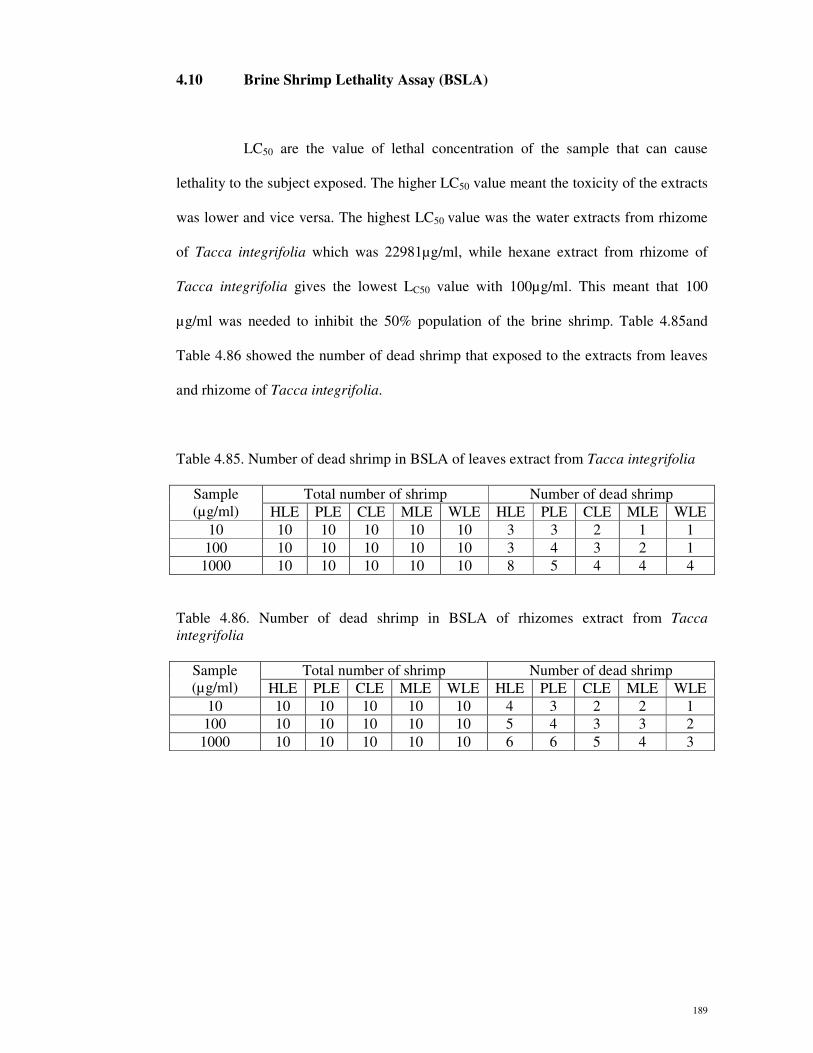
189
4.10 Brine Shrimp Lethality Assay (BSLA)
LC50 are the value of lethal concentration of the sample that can cause
lethality to the subject exposed. The higher LC50 value meant the toxicity of the extracts
was lower and vice versa. The highest LC50 value was the water extracts from rhizome
of Tacca integrifolia which was 22981µg/ml, while hexane extract from rhizome of
Tacca integrifolia gives the lowest LC50 value with 100µg/ml. This meant that 100
µg/ml was needed to inhibit the 50% population of the brine shrimp. Table 4.85and
Table 4.86 showed the number of dead shrimp that exposed to the extracts from leaves
and rhizome of Tacca integrifolia.
Table 4.85. Number of dead shrimp in BSLA of leaves extract from Tacca integrifolia
Sample
(µg/ml)
Total number of shrimp Number of dead shrimp
HLE PLE CLE MLE WLE HLE PLE CLE MLE WLE
10 10 10 10 10 10 3 3 2 1 1
100 10 10 10 10 10 3 4 3 2 1
1000 10 10 10 10 10 8 5 4 4 4
Table 4.86. Number of dead shrimp in BSLA of rhizomes extract from Tacca
integrifolia
Sample
(µg/ml)
Total number of shrimp Number of dead shrimp
HLE PLE CLE MLE WLE HLE PLE CLE MLE WLE
10 10 10 10 10 10 4 3 2 2 1
100 10 10 10 10 10 5 4 3 3 2
1000 10 10 10 10 10 6 6 5 4 3
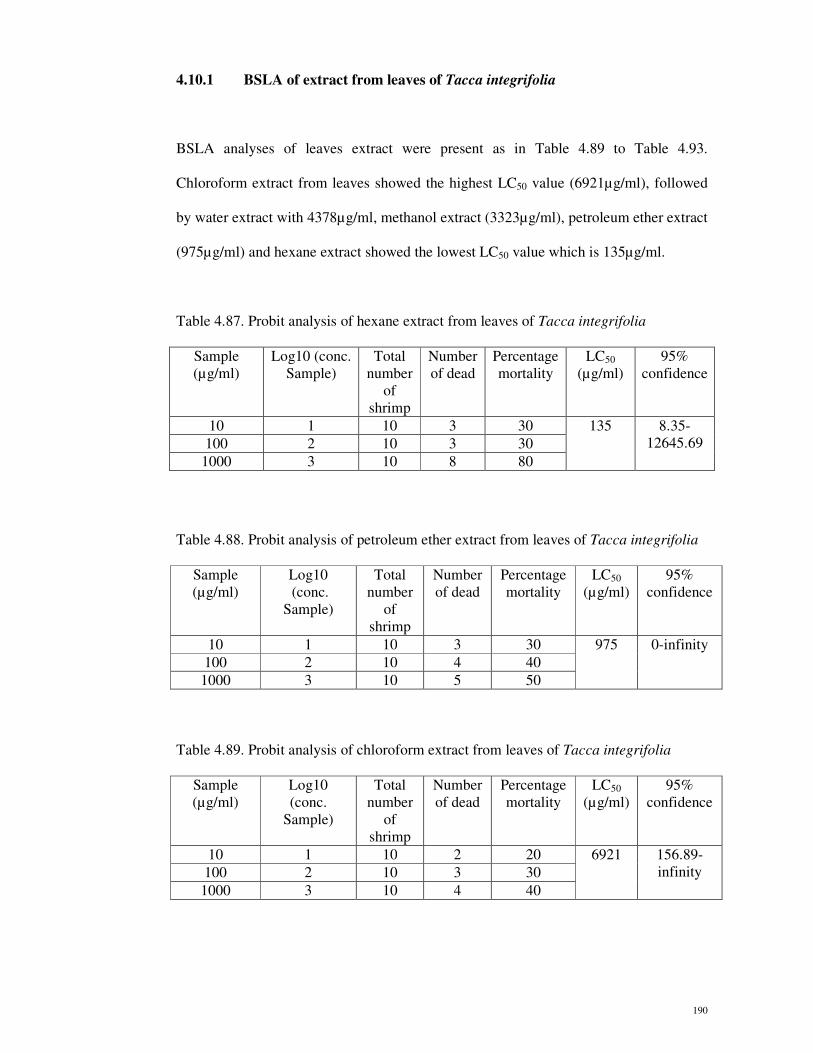
190
4.10.1 BSLA of extract from leaves of Tacca integrifolia
BSLA analyses of leaves extract were present as in Table 4.89 to Table 4.93.
Chloroform extract from leaves showed the highest LC50 value (6921µg/ml), followed
by water extract with 4378µg/ml, methanol extract (3323µg/ml), petroleum ether extract
(975µg/ml) and hexane extract showed the lowest LC50 value which is 135µg/ml.
Table 4.87. Probit analysis of hexane extract from leaves of Tacca integrifolia
Sample
(µg/ml)
Log10 (conc.
Sample)
Total
number
of
shrimp
Number
of dead
Percentage
mortality
LC50
(µg/ml)
95%
confidence
10 1 10 3 30 135 8.35-
12645.69 100 2 10 3 30
1000 3 10 8 80
Table 4.88. Probit analysis of petroleum ether extract from leaves of Tacca integrifolia
Sample
(µg/ml)
Log10
(conc.
Sample)
Total
number
of
shrimp
Number
of dead
Percentage
mortality
LC50
(µg/ml)
95%
confidence
10 1 10 3 30 975 0-infinity
100 2 10 4 40
1000 3 10 5 50
Table 4.89. Probit analysis of chloroform extract from leaves of Tacca integrifolia
Sample
(µg/ml)
Log10
(conc.
Sample)
Total
number
of
shrimp
Number
of dead
Percentage
mortality
LC50
(µg/ml)
95%
confidence
10 1 10 2 20 6921 156.89-
infinity 100 2 10 3 30
1000 3 10 4 40
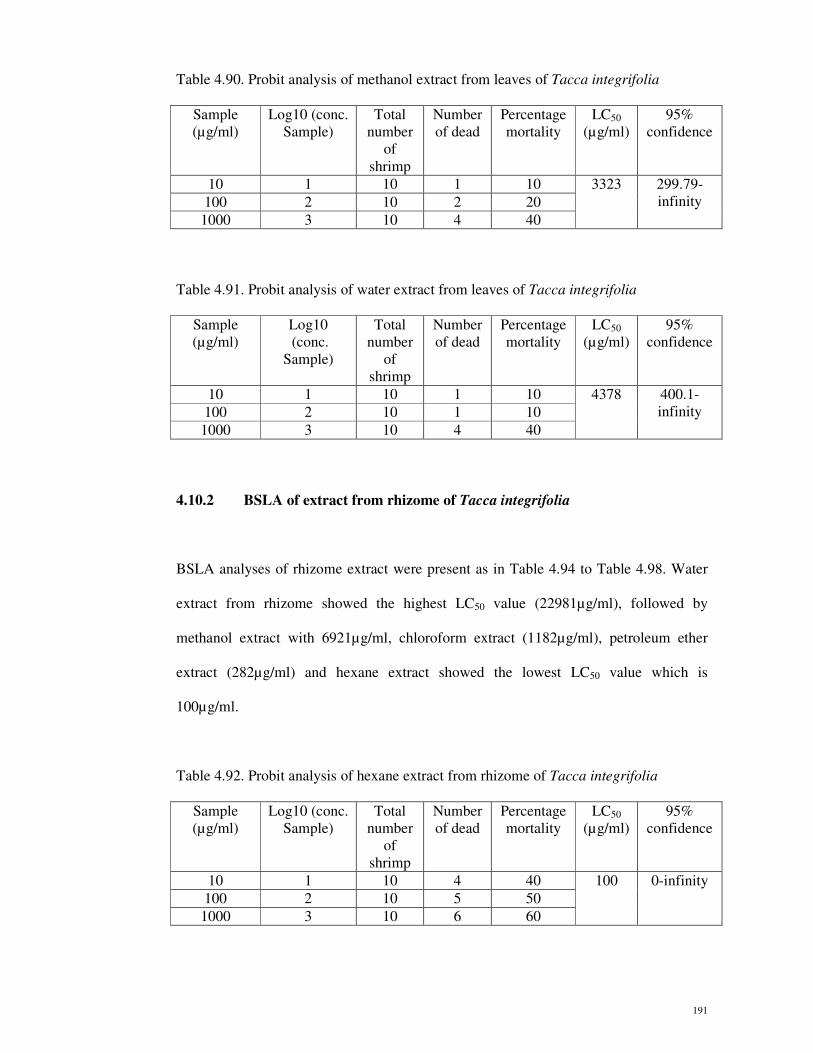
191
Table 4.90. Probit analysis of methanol extract from leaves of Tacca integrifolia
Sample
(µg/ml)
Log10 (conc.
Sample)
Total
number
of
shrimp
Number
of dead
Percentage
mortality
LC50
(µg/ml)
95%
confidence
10 1 10 1 10 3323 299.79-
infinity 100 2 10 2 20
1000 3 10 4 40
Table 4.91. Probit analysis of water extract from leaves of Tacca integrifolia
Sample
(µg/ml)
Log10
(conc.
Sample)
Total
number
of
shrimp
Number
of dead
Percentage
mortality
LC50
(µg/ml)
95%
confidence
10 1 10 1 10 4378 400.1-
infinity 100 2 10 1 10
1000 3 10 4 40
4.10.2 BSLA of extract from rhizome of Tacca integrifolia
BSLA analyses of rhizome extract were present as in Table 4.94 to Table 4.98. Water
extract from rhizome showed the highest LC50 value (22981µg/ml), followed by
methanol extract with 6921µg/ml, chloroform extract (1182µg/ml), petroleum ether
extract (282µg/ml) and hexane extract showed the lowest LC50 value which is
100µg/ml.
Table 4.92. Probit analysis of hexane extract from rhizome of Tacca integrifolia
Sample
(µg/ml)
Log10 (conc.
Sample)
Total
number
of
shrimp
Number
of dead
Percentage
mortality
LC50
(µg/ml)
95%
confidence
10 1 10 4 40 100 0-infinity
100 2 10 5 50
1000 3 10 6 60
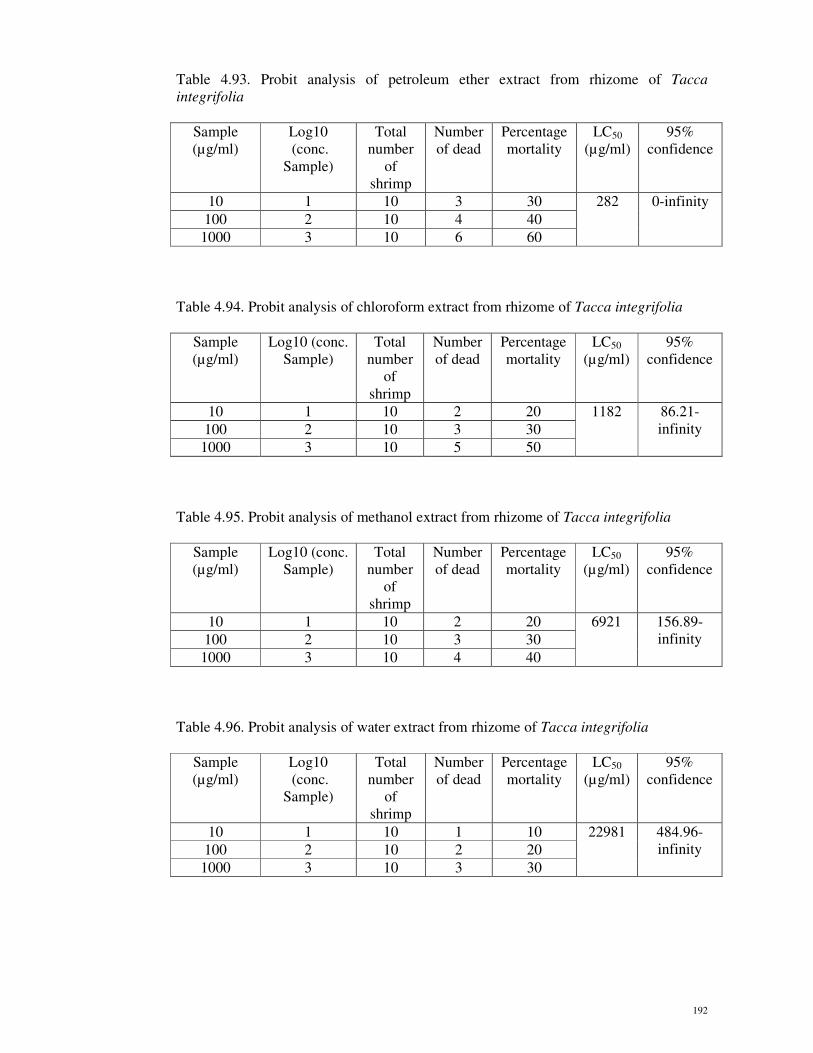
192
Table 4.93. Probit analysis of petroleum ether extract from rhizome of Tacca
integrifolia
Sample
(µg/ml)
Log10
(conc.
Sample)
Total
number
of
shrimp
Number
of dead
Percentage
mortality
LC50
(µg/ml)
95%
confidence
10 1 10 3 30 282 0-infinity
100 2 10 4 40
1000 3 10 6 60
Table 4.94. Probit analysis of chloroform extract from rhizome of Tacca integrifolia
Sample
(µg/ml)
Log10 (conc.
Sample)
Total
number
of
shrimp
Number
of dead
Percentage
mortality
LC50
(µg/ml)
95%
confidence
10 1 10 2 20 1182 86.21-
infinity 100 2 10 3 30
1000 3 10 5 50
Table 4.95. Probit analysis of methanol extract from rhizome of Tacca integrifolia
Sample
(µg/ml)
Log10 (conc.
Sample)
Total
number
of
shrimp
Number
of dead
Percentage
mortality
LC50
(µg/ml)
95%
confidence
10 1 10 2 20 6921 156.89-
infinity 100 2 10 3 30
1000 3 10 4 40
Table 4.96. Probit analysis of water extract from rhizome of Tacca integrifolia
Sample
(µg/ml)
Log10
(conc.
Sample)
Total
number
of
shrimp
Number
of dead
Percentage
mortality
LC50
(µg/ml)
95%
confidence
10 1 10 1 10 22981 484.96-
infinity 100 2 10 2 20
1000 3 10 3 30