chapter 4 profile of the study area:...
TRANSCRIPT

59
CHAPTER 4
PROFILE OF THE STUDY AREA: KANCHEEPURAM DISTRICT
Significance of providing the profile of the study area.
It is customary to give an overview of the study area before entering into the
details of the study. The salient features of the study area, Kancheepuram District
will help us to understand the issues related to the rural women. The following will
provide clear understanding of the features of the Kancheepuram District in Tamil
Nadu.
The chapter is classified on the following aspects..
1. History of the District.
2. Geographical features of the district.
3. Demographic details of the district.
4. Family Planning in the district and Tamil Nadu.
4.1 History of the District
Kancheepuram district is one among the 32 Districts of Tamil Nadu.
This district was formed with effect from 1st July 1997 after the bifurcation of
the erstwhile Chengalpet district into Thiruvallur and Kancheepuram Districts .
It enjoys a great historical background
Kancheepuram District has its origin from a very long period. The district
was administered by the Pallavas, Cholas, Vijayanagar rulers and the British before
Independence. It was a part of Tondaimandalam, a division of the ancient Tamil
country, comprising the present day districts of Kancheepuram, Chennai, Tiruvallur,

60
Vellore and Thiruvannamalai. The capital of Thondaimandalam was Kancheepuram
city. From the 3rd to the 9th century AD. Kanchi was the capital of the Pallavas who
ruled over the territory extending from the river Krishna in the north to the river
Kaveri in the south. The Pallavas fortified the city with ramparts, moats, etc., with
wide and well laid out roads and fine temples. They had contacts with far-off China,
Siam, Fiji, etc., through their chief Port Mamallapuram (Mahabalipuram). The
Cholas ruled this region from the 10th century to the 13th century. Kings of
Vijayanagar dynasty ruled from 14th century to 17th century.
Before the British administration
Kanchi was a major seat of Tamil learning as well as an important place of
pilgrimage for Buddhists, Jains and Hindus. Kalidasa has described it to be the best
among the cities .One of the kings of Kanchi, Mahendravarman-I, belongs to this
district who was a great scholar and musician, a man of great intelligence and also a
great playwright. In the 7th century Yuan Chwang, the great Chinese traveler,
visited Kanchipuram city observed that this city was 6 miles in circumference and
recorded that people were brave , just and had great veneration for learning. It is said
that Buddha had visited the place. After Banaras, Kanchi stood second in in learning
in the olden days. During the Mughal invasions followed by three centuries of
colonial rule under the British, this district began its downfall.
During the British administration
The British called it Conjeevaram, and under the British regime, in 1778, a
Collector was appointed. The district was further split up into two divisions,
Northern and Southern, and was placed under the administration of two Collectors.
During 1794 1799, Clerk and Balfour. Lionel Placecreated the posts of
Sharistadars, and they were in the control of the Collector. Clerks were also

61
appointed to assist the Sharistadars. The famous Madurantakam and Uthiramerur
tanks were created by Place. Hodgson and in 1800, Hodgson was succeeded by his
Senior Assistant, Greenway.
In the 19th century, Karunguzhi became the headquarters of the district till
1859 ; then it was shifted to 'Home Garden' Saidapettai. from 1825-1835
Kancheepuram served as the district headquarters. From 1859 to 1968, the
Collector's office was located in Saidapettai.
Post Independence period
Kancheepuram city became the headquarters of Chengalpattu district with
effect from 1 July 1968. Then the Chengalpattu-MGR district was split into two as
Kancheepuram and Tiruvallur Districts from 1 July 1997. Thus the new
Kancheepuram District was formed from 1 July 1997, consisting of 8 Taluks, viz,
Kancheepuram, Sriperumbudur, Uthiramerur, Chengalpattu, Tambaram,
Tirukalukundram, Madrandakam and Cheyyur.
4.2 Geographical features of the district
Location
Kancheepuram district is situated on the northern East Coast of Tamil Nadu
and is adjacent by Bay of Bengal and Chennai city and is bounded in the west by
Vellore and Thiruvannamalai district, in the north by Thiruvallur district and
Chennai district, in the south by Villuppuram district in the east by Bay of Bangal. It
lies between 11° 00' to
longitudes. The district has a total geographical area of 4393.37 Sq.Kms and
coastline of 57 Kms. Kancheepuram, the temple town is the district headquarters.
For administrative reasons, the district has been divided into 4 revenue divisions

62
comprising of 11 taluks with 1137 revenue villages. For development reasons, it is
divided into 13 development blocks with 648 Village Panchayats.
4.3 Physical Features
According to the census of India 2011, Kanchipuram district covers an area
of 4433Sq. km. surrounded by Vellore and Thiruvannamalai district in west, in the
north by Thiruvallur district and Chennai district, in the south by Villuppuram
district in the east by Bay of Bengal.
4.4 Geography
Kancheepuram district is situated on the North East coast of Tamil Nadu. It
is bound by Bay of Bengal in the East, Vellore and Thiruvannamalai districts in the
west, Thiruvallur and Chennai districts in the north, and Villuppuram district in the
south. It lies between 11° 00' to 12° 00' latitudes and 77° 28' to 78° 50' longitudes.
The district has a total geographical area of 4,43,210 hectares and a coastline of
57 km. The table below shows the maximum and minimum temperatures
experienced in the district during different seasons.
4.5 Rainfall and Climate
Kancheepuram district generally experiences hot and humid climatic
conditions. The district receives the rain under the influence of both southeast and
northeast monsoons. Most of the precipitation occurs in the form of cyclonic storm
caused due to the depressions in Bay of Bengal chiefly during northeast monsoon
period. The southwest monsoon rainfall is highly erratic and summer rains are
negligible.
The normal annual rainfall over the district varies from 1105 mm to
1214mm. It is the minimum in the western and northwestern parts of the district

63
around Uttiramerur (1105 mm) and it isthe maximum around Kovalam (1214.2
mm). High relative humidities between 58 and 84% prevail through out the year.
Relative humidity is maximum in the morning and minimum in the evening. Higher
rates of relative humidity are observed between November and January i.e., 83 to
84%. In the months of June, the humidity is lower i.e., around 58%.Average relative
humidity in the morning and evening 74 and 64%. The minimum and maximum
temperature are 20°C & 37°C. The daytime heat is oppressive and the temperature is
as high as 43°C.
The Table 4.5.1 gives details of seasons during the last 14 years in our state.
Table 4.5.1 Details of Rainfall (in mm)
Year
South West Monsoon
North East Monsoon
Winter seasons Hot Weather Season
Total Total
Nor
mal
Act
ual
Nor
mal
Act
ual
Nor
mal
Act
ual
Nor
mal
Act
ual
Act
ual
Nor
mal
2000-01 322.8 314.5 470.3 335.6 47.3 16.8 138.9 118.4 979.3 785.4 -19.8
2001-02 322.8 260.0 470.3 379.4 47.3 70.0 134.2 83.3 974.6 792.7 -18.4
2002-03 329.5 185.4 468.1 407.1 36.8 8.7 129.8 129.8 964.1 731.0 - -24.2
2003-04 331.5 336.5 464.6 403.1 37.4 12.1 128.4 283.4 961.8 1034.6 7.6
2004-05 331.5 360.7 464.6 472.1 37.4 14.3 128.4 231.7 961.8 1078.9 12.2
2005-06 332.9 308.5 459.2 828.8 36.8 15.9 129.6 150.9 958.5 1304.1 36.1
2006-07 316.1 250.9 431.1 497.5 35.3 10.9 129.1 100.4 911.6 859.7 -5.5
2007-08 316.1 341.6 431.1 515.4 35.3 46.6 129.1 261.2 911.6 1164.8 27.8
2008-09 316.1 333.5 431.1 552.7 35.3 7.7 129.1 129.2 911.6 1023.1 12.2
2009-10 316.0 317.0 431.1 482.6 35.3 11.5 129.1 126.7 911.6 937.8 2.9
2010-11 319.2 383.6 430.3 605.2 31.3 36.3 127.8 140.0 908.6 1165.1 28.2
2011-12 321.2 300.5 441.2 540.8 31.3 9.5 127.9 86.3 921.6 937.1 11.7
Source Department of Economics and Statistics, Chennai 6.

64
Table 4.5.1 shows the rainfall statistics of the state from 1985-2011. Both the
South west and North east monsoon rainfall were erratic and also deficient. The
North West Monsoon was lowest in1988-89 (217.7mm) and highest in 1993-94
(709.9mm) and South West monsoon was very low in 1994-95(224.3mm).and more
in 1996-97 (454.8mm). The rainfall is not evenly spread through out the year.
4.6 Climate
Summer Winter
Max. 48.8 °C (119.8 °F) 38.7 °C (101.7 °F)
Min. 20.1 °C (68.2 °F) 10.0 °C (50.0 °F)
The weather is hot during March to May. Entire district is tropical in nature;
temperature is bound to be high having a temperature within the limit of 21°C to
37°C.Monsoon is from June to September, and it brings heavy pouring rains in the
area coupled with cool breeze. Monsoon Winters are much cooler in comparison
with other places in Southern India. The temperature varies between19°C to 29°C.
4.6.1 Climate Climate data
Month
Jan Feb Mar Apr May Jun Jul Aug Sep Oct Nov Dec Year
Average high °C
(°F)
28.9 (84)
30.6 (87.1)
32.7 (90.9)
34.7 (94.5)
37.5 (99.5)
37.3 (99.1)
35.4 (95.7)
34.5 (94.1)
33.9 (93)
31.9 (89.4
)
29.5 (85.1
)
28.5 (83.3)
37.5 (99.5
)
Average low °C
(°F)
20.4 (68.7)
21.2 (70.2)
23.1 (73.6)
25.8 (78.4)
27.6 (81.7)
27.4 (81.3)
26.2 (79.2)
25.6 (78.1)
25.3 (77.5)
24.3 (75.7
)
22.7 (72.9
)
21.2 (70.2)
20.4 (68.7
)
Rainfall
mm (inch
es)
34.5 (1.358)
12.5 (0.492)
15.3 (0.602)
17.7 (0.697)
42.9 (1.689)
53.7 (2.114)
100.8
(3.969)
129.2
(5.087)
125.3
(4.933)
290.9 (11.453)
348.9 (13.736)
145.6
(5.732)
1,317.3
(51.862)
Avg. rainy days
2.7 0.9 0.7 1.1 2.4 7.5 12.8 14.2 10.2 13.5 12.9 8.4 87.3
Mean daily sunsh
ine hours
8.7 9.6 9.5 9.7 9.0 6.8 6.0 6.2 6.6 6.3 6.1 6.6 7.59
Source WMO

65
4.7 Rivers
The Palar river is the most important river running through the district. River
Palar is the main river in the district, which is not perennial. Cheyyar and Vegavathy
rivers are tributaries of Palar and join it at Thirumakkudal. Through most of the year
it remains dry, attributed to the construction of dams across the river in Andhra
Pradesh. There are only a few hills of considerable elevation in the district. The
southern part of Maduranthakam taluk contains small hills.
4.8 Languages, Religion and Caste
The early Pallava royal inscriptions are either in Prakrit or in Sanskrit
Kanchipuram is a cosmopolitan city with people speaking several languages. Other
than the native Tamil, languages like Telugu, Kannada, and Saurashtra are also
prevalent in the city. Tamil is the mother tongue for about 84.5 percent, Telugu
8.7percent, Kannada 2.6percent , Urdu 1.8 percent , Malayalam 1.4 percent and
Gujerati 0.5 percent . Maximum population belong to the Hindus 88.9 percent , 5.8
percent are Christians. 5.2 percent are Muslims 0.1 percent is other religion like
Jains.
4.9 Administrative Details
Kancheepuram, the temple town is the district headquarters. For
administrative reasons, the district has been divided into 4 revenue divisions
comprising of 11 taluks with 1137 revenue villages. For development reasons, it is
divided into 13 development blocks with 648 Village Panchayats.

66
Table 4.9. giving details of the villages and the Taluk and Block they belong to
Revenue Divisions Taluk Block Kancheepuram
Kancheepuram Sriperumbudur Uthiramerur
Acharapakkam Chithamur Kanchipuram Kattangulathur
Thambaram
Thambaram Sholinganallur Alanthur
Kunnattur Lathur Madurantakam
Chengalpattu
Chengalpattu Tirukalukundram
Sriperumbudur St. Thomas Mount Thirupporur
Maduranthakam
Maduranthakam Cheyyur
Tirukalukundram Uttiramerur Walajabad
Source: District Statistical Handbook for the year February 2012
Kancheepuram district is having administrative divisions of 8 taluks, 13 blocks, 648
panchayats and 1137 villages as detailed below:

67
Table 4.9.1 giving details of the villages and the Taluk and Block they belong to
S. No. Taluk No. of
Villages Block No. of Villages
1 Kancheepuram 207 1.Kancheepuram 2 Walajabad
91
2 Uthiramerur 124 Uthiramerur 124 3 Madurantakam 195 1.Madurantakam
2.Acharapakkam 101 94
4 Cheyyur 128 1.Chittamur 2.Lattur
65 63
5 Sriperumpudur 198 1.Sriperumpudur 2.Kundrathur
101 91
6 Tambaram 66 St.Thomas Mount 66 7 Chingleput 198 1.Kattankolathur
2.Tirupporur 101 97
8 Tirukkalukkundram 104 Tirukkalukkundram 104 Total 1214 1214
For the local administration, the district is divided into 10 municipalities, 24
town panchayats and 8 Census Towns. The name of the Municipalities, town
Panchayats and Census Towns are given in Table 4.9.1

68
Table 4.9.2 gives the allocation of municipalities , Town Panchayats
and Villages
Municipalities Town Panchayats No Of Census Villages
Alandur Acharapakkam Sriperumbudur
Anakaputhur Chitlapakkam Thambaram
Chengalpattu Edakalinadu Chengalpattu
Kanchipuram Karunguzhi Kancheepuram
Maduranthagam Kundrathur Uthiramerur
Maraimalainagar Madambakkam Tirukalukundram
Pallavapuram Mamallapuram Madhuranthangam
Pammal Mangadu Cheyyur
Puzhuthivakkam Meenambakkam
Tambaram Nandambakkam
Nandivaram - Guduvancheri
Pallikaranai
Peerkankaranai
Perungalathur
Perungudi
Sembakkam
Sevilimedu
Sholinganallur
Sriperumbudur
Thiruneermalai
Thiruporur
Tirukalukundram
Uthiramerur
Walajabad Source: District Statistical Handbook for the year 2012 -2013.

69

70

71

72
III Demographic details of the districts
4.10 Population
Table 4.10.1 gives the particulars of country, state and district urban and ruralwise population during the 2001 and 2011 census.
Census as on 2011
NAME TRU TOT_
Population
Total Males Total Females
INDIA Total 1,028,610,328 532,156,772 496,453,556
INDIA Rural 742,490,639 381,602,674 360,887,965
INDIA Urban 286,119,689 150,554,098 135,565,591
TAMIL NADU Total 62,405,679 31,400,909 31,004,770
TAMIL NADU Rural 34,921,681 17,531,494 17,390,187
TAMIL NADU Urban 27,483,998 13,869,415 13,614,583
KANCHEEPURAM Total 2877468 1457242 1420226
KANCHEEPURAM Rural 1342502 676095 666407
KANCHEEPURAM Urban 1534966 781147 753819
Census 2001
NAME TRU TOT_P TOT_M TOT_F
INDIA Total 1210854977 623270258 587584719
INDIA Rural 833748852 427781058 405967794
INDIA Urban 377106125 195489200 181616925
TAMIL NADU Total 72147030 36137975 36009055
TAMIL NADU Rural 37229590 18679065 18550525
TAMIL NADU Urban 34917440 17458910 17458530
KANCHEEPURAM Total 3998252 2012958 1985294
KANCHEEPURAM Rural 1459916 734979 724937
KANCHEEPURAM Urban 2538336 1277979 1260357
73
Source: Census. Gov.nic.in
According to 2011 census, the population of Kancheepuram District is
3,998,897 comprising of 2,012,958 males and 1,985,294. Females. Which is 50.37
percent and 49.63 percent respectively. Further rural population is 1,459,916 which
is 36.51 percent and urban 2,538,336 and is 63.49 percent approximately. The
density of population is 892 per Sq.km according to 2011 census of which people in
the rural region is 1,277,979. When compared to that of urban is 2,538,336.
According to 2011 census, the population of Tamil Nadu is 62,405,67914,
comprising of 31,400,909 males and31,004,770 Females. Which is 50.37 percent
and 49.63 percent respectively. Further rural population is 34,921,681which is 36.51
percent and urban 2,538,336and is 63.49 percent approximately. The density of
population is 555 per Sq.km according to 2011 census of which people in the rural
region is 1,277,979. When compared to that of urban is286,119,689.
According to 2011 census, the population of India is 1,028,610,328
comprising of 532,156,772 males and 496,453,556 Females. Which is 53.37
percent and 49.65 percent respectively. Further rural population is 1,459,916 which
is 36.51 percent and urban 2,538,336 and is 63.49 percent approximately. The
density of population is 324per Sq.km according to 2011 census of which people in
the rural region is 742,490,639When compared to that of urban is 2,538,336.

74
Source: Census Gov. India - 2011

75

76

77
4.2 BIRTH,DEATH AND INFANT MORTALITY RATES IN
TAMIL NADU ALL INDIA

78

79
Table 4.10.2 : Distribution of Population, Decadal Growth Rate, Sex-Ratio and Population Density
2001 2011
State/District Population 2011
Percentage Decadal Growth Rate of
Population
Sex- Ratio
(Number of Females per 1000 Males
Population Density per
sq. km.
Persons Males Females 1991-01
2001-11
1991-01
2001-11
1991-01
2001-11
India 1,21,01,93,422 62,37,24,248 58,64,69,174 21.15 17.64 933 940 325 382
Tamil Nadu 72138958 36158871 35980087 15.60 17.64 986 996 324 480
Kancheepuram 3990897 2010309 1980588 6.96 6.49 975 985 688 927
Source: Census of india,2011, Volume XII, Page 2
The total population of India in 2011 is 1,21,01,93,422 of which
62,37,24,248 and 58,64,69,174 are Females; whereas in Tamil Nadu, total
population 72138958 ; Males 36158871 and Females 35980087; in Kancheepuram,
total population is 3990897 ; Males 2010309 and Females 1980588 .
Percentage Decadal Growth Rate of Population in India is 21.15 in 1901
2001 and 17.64 in 2011.In Tamil nadu it is 15.6 in 1901-2001 and 17.64 in 2011. In
Kancheepuram, it was 6.96 in 1901-2001 and 6.49.
Sex- Ratio in India during 1901-2001 was 933 and it improved to 940 by the
next decade, 2011 ; in Tamil Nadu it was 986 in 1901- 2001 period and went up by
10 numbers as 996 in 2011. In Kancheepuram, during 1901 -2001 it was 985 and in
2011 it increased to 985.
Population Density per sq.km.in India during the period 1901-2001 was 325
and during 2011 it was 382; In Tamil Nadu during 1901-2001 it was 324 and during
2011 480. This shows a remarkable increase. In kancheepuram District, in 1901-
2001 it was 688 and in 2011 census there is a steep increase as 927 per sq.km.


1

85
In 2011, Kancheepuram had population of of which male and female were
2,537,825and 1,453,072respectively. In 2001 census, Kancheepuram had a
population of 2,877,468 of which males were 1,457,242 and remaining 1,420,226
were females. Kancheepuram District population constituted 5.54 percent of total
Maharashtra population. In 2001 census, this figure for Kancheepuram District was
at 4.61 percent of Maharashtra population. The initial provisional data released by
census India 2011, shows that density of Kancheepuram district for 2011 is 892
people per sq. km. In 2001, Kancheepuram district density was at 668 people per sq.
km. Kancheepuram district administers 4,483 square kilometers of areas. The rural
population of Kancheepuram is 36.51 percent and that of the urban 63.49 percent .
There was change of 38.95 percent in the population compared to population
as per 2001. In the previous census of India 2001, Kancheepuram District recorded
increase of 19.15 percent to its population compared to 1991.
The initial provisional data released by census India 2011, shows that density
of Kancheepuram district for 2011 is 892 people per sq. km. In 2001, Kancheepuram
36.51
63.49
Rural Urban Kancheepuram
Rural
Urban

86
district density was at 668 people per sq. km. Kancheepuram district administers
4,483 square kilometers of areas.
Table 4.11 shows the area , and population by block/ Municipalitieswise in
Kancheepuram District.
Table 4.11 Population by of the 5 villages in Kancheepuram District.
S.No. Name of
Blocks/Municiplaities
Population Population %
Persons Male Female Male Female
1 Edayarapakkam 1398 704 694 53.8 46.2
2 Mevalurkuppam 5798 3315 2483 67.6 33.4
3 Orathur 1549 763 786 49.6 51.4
4 Kunnappattu 892 456 436 50.6 49.4
5 Manamai 2328 1189 1139 57.3 42.7
From the above table it is found that in terms of percentage the male
population and female population are more or less equal in number with a minor
difference of 7.6percent in Edayarapakkam ; 1.2 percent in Kunnappattu ; 14.6
percent in Manamai ; in Orathur it is female with high percentage and the difference
is 1.8 percent and highest is in Mavalurkuppam with 34.2 percent . In the entire
case of male population in terms of percentage it ranges from 49.6 to 67.6. In the
case of female population in terms of percentage it ranges from 33.4 to 51.4. Thus
the range is less in the case of female population which implies that the female
population is uniformly distributed among the rural areas.

87
4.12 Literacy Rate
Literacy Rate 1961-2011 India, Tamil Nadu and Kancheepuram district.
Year
India Tamil Nadu Kancheepuram
Persons Males Females Persons Males Females Persons Males Females
1961 28.30 40.4 36.39 59.54 21.06 15.35 36.39 25.1 30.5
1971 34.45 45.96 45.50 68.05 30.92 21.97
1981 43.57 29.76 54.39 73.75 40.43 56.38
1991 52.21 64.13 62.66 82.33 51.33 39.29 62,66
2001 64.84 75.26 73.47 86.81 64.55 53.67 82.53 88.97 75.99
2011 74.04 82.14 80.33 86.81 73.86 65.46 80.02 77.07 55.22
In Kancheepuram district, among the total population, 80.09% are literates
and the remaining 20 percent are illiterates as per 2011 census. In respect to literacy
3,065,799 are literates comprising of 1,611,461 males and 1,401,921 females. This
amounts to 86.77 percent and 73.14 percent respectively. In the rural region
988,378 are literates among them male are 546,994 and Female are 441,384.
Similarly, in the the urban region of the district, number of literates are 2,025,004
and among them 1,064,467 are males and 960,537 are females.

88
The table 4.13 gives the details of Literacy rate of the males and females to the block and municipalities in Kancheepuram District.
Literacy rate by villages in Kancheepuram District.
Name of village Population Population %
Persons Male Female Male Female
Edayarapakkam 334 112 222 33.5 66.5
Mevalurkuppam 412 339 173 82.9 17.1
Orathur 125 62 63 49.6 50.4
Kunnappattu 130 37 93 28.4 71.6
Manamai 2044 1181 863 50.2 49.8
Sources:Census of India 2011
From the above Table it is found that the literacy rate among males is the
least 125 persons in Orathur. Similarly, the literacy rate among males is highest
in Mevalurkuppam with 82.9 percent . Thus the literacy rate among males in the 5
villages ranges from 28.4 percent to 82.9 percent. The literacy rate among the
females is highest Kunnappattu with 71.6 percent and lowest literacy rate is in
Mevalurkuppam with 17.1 percent. Thus the literacy rate is more among male with
82.9 percent and female with 71.6 percent.
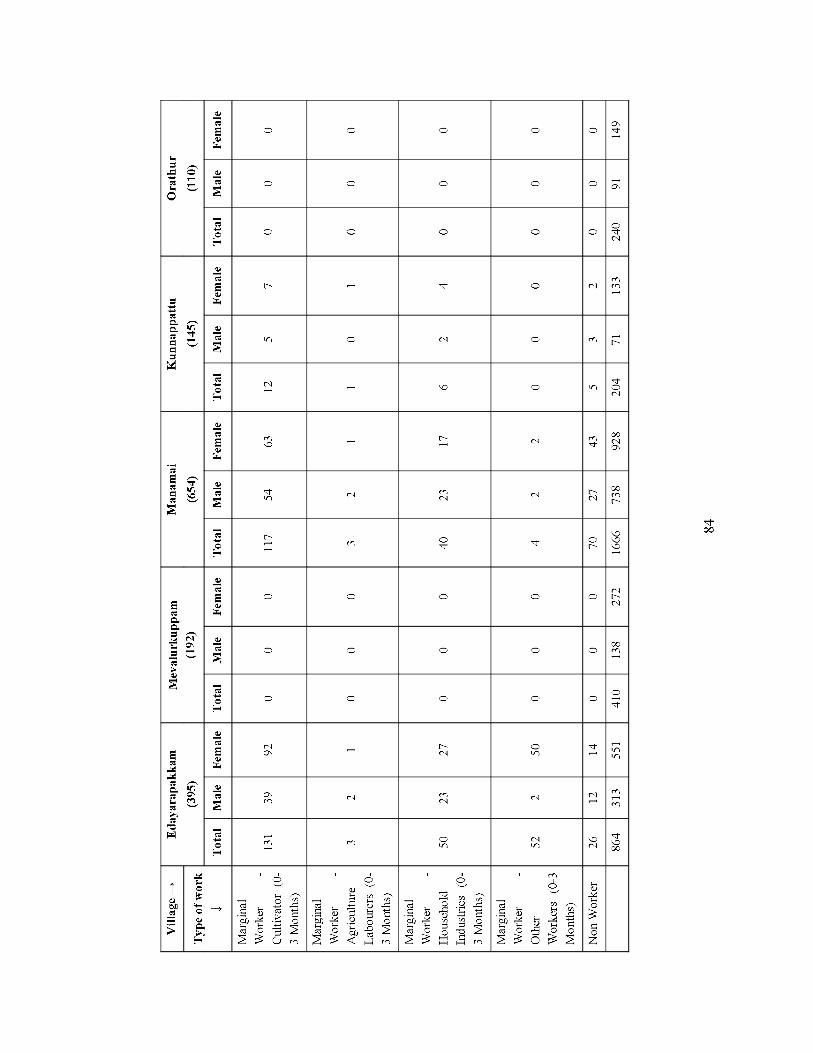
According to the 2011 census of workers 633 in Edayarapakkam out of
which male are 432 and female 201. In Mevalurkuppam the total number of
workers are 174 out of which 64 are men and 110 are female. In Irapercent of the
populations are main workers. From 5.5 table it is observed that among the total
workers (Total Workers 1144929 605612 539317), 16295 are main workers and
28634 are marginal workers which amounts to31.84 percent and 7.95 percent. The

89
total main workers comprise of cultivators 113591, agricultural labourers 169970,
workers in household industry 53232, and other workers579502 , 31.84 percent
main workers, main Cultivators 12.4 percent, Agricultural Labourers 18.55 percent,
Household Industries Workers 5.81 percent and other workers 63.24 percent .
Further it is observed that at the state level 85% (i.e. 23757783) of workers come
under Main workers and the remaining 15% (i.e 4120499) workers come under
Marginal workers.
While comparing the percentage of main workers workers in Kancheepram
District with that of the Tamil Nadu , The Tamil Nadu as a whole the percentage of
main workers is 85.22, and the Kancheepuram District is 38.06 percent. On the other
hand the percentage of marginal workers is greater in kancheepuram district to that
of Tamil Nadu as a whole to the extent of 9.1percent.. In the case of agricultural
labourers the percentage is less in Kancheepuram district 28.28 percent while
compared to the whole of Tamil Nadu 30.98 percent. Hence it may be derived that
the Kancheepuram District comprises high percentage of marginal workers and less
percentage of cultivators while compared with that of Tamil Nadu as a whole. Such
characterstics are reasonable indicators of the poor economic condition of the rural
people in Kancheepuram district.

90
Table 4.14. gives the details regarding density of population, literacy
rates, work participation and other details in the rural and urban areas of
Kancheepuram District.
Table 4.14 Details regarding population
Indicators Rural Urban
Persons Male %
Female % Persons Male
% Female
% Population 1,459,916 46.93 63.49 2,538,336 87.45% 70.83% Density of Population (person per Km2)
882
Literates 988,578
546,994 441,384 2,025,004 1,064.467 960.537
Literacy rate and
85.29
76.60
65.52 2,064,374
91.82 82.67
Work Participation Rate
38.06 40.60 11.13%
2,73,518
62.23 27.45
cultivators 8,48,000 21.05 5.70 34,000 2.03 0.26 Agricultural labourers
5,86,533 28.28% 14.27% 3,52,371 2.88 15.07
Household industrial workers
39,571 3.09 0.81 61,000 1.85 8.05
Other workers 47.58 11.63 17,90,000 93.24 76.63 Source: Census of India 2001 demographic Atlas of Tamil Nadu
From the Table 4.11.4 it is found that in Kancheepuram District among the
rural population 46.93 percent are males and 63.49 are females. Further rural
population is 1,459,916 which is 36.51percent and urban 2,538,336 and is 63.49
percent approximately. The density of population is 882 per Sq.km according to
2011 census of which people in the rural region is 46.1 percent and 53.9 percent

91
When compared to that of urban is 53.9 percent .In the rural region 988,378 are
literates among them male are and Female are 441,384. Similarly, in the the urban
region of the district, number of literates are 2,025,004 and among them 1,064,467
are males and 960,537 are females. In the case of males the work participation rate
is 40.60 percent and rural and 59.40 in urban and that in the case of female is -62.23
in rural and 27.45in urban. It must be noted that in the case of females the work
participation rate is 27.45 is high in rural as compared to to that11.13 in Urban. In
rural 21.5 percent male are culyivators and 2.03 percent are in Urban. Similarly, in
Rural 5.7 percent are female cultivators, and 0.26 percent are in Urban. On
comparison it is found that the percentage of cultivators in both case of males and
females is more in rural as compared to that in Urban both in the case of males and
Females. In respect to agriculture labourers 28.28 percent males are in Rural and
2.88 percent in Urban. Similarly, 14.27 percent females in rural and 15.27 percent
in Urban. Comparing the figures related to cultivators and agricultural labourers the
percentage is high in the case of females as compared to that of Urban.
Table 4.14 gives the details regarding the workers in Kancheepuram district
and Tamil Nadu.
From Table 4.14 it is observed that the total work force of 1144929, main
workers are 28634 and 28634 which amounts to 31.84 percent and 7.95 percent
marginal workers respectively. In the District, the The total main workers comprise
of cultivators 113591, agricultural labourers 169970, workers in household industry
53232, and other workers 579502 , 31.84 percent main workers, main Cultivators
12.4 percent, Agricultural Labourers 18.55 percent, Household Industries Workers
5.81 percent and other workers 63.24 percent . Further it is observed that at the state
level 85 percent (i.e. 23757783) of workers come under Main workers and the

92
remaining 15 percent (i.e 4120499) workers come under Marginal workers. In the
case of marginal workers, there is not much difference district and the state.
Table 4.15 gives the details regarding density of population, literacy
rates, work participation and other details in the rural and urban areas of
Kancheepuram District.
Table 4.15 Details regarding population
Rural Urban
Population (%) 36.51 % 63.49 %
Total Population 1,459,916 2,538,336
Male Population 734,979 1,277,979
Female Population 724,937 1,260,357
Sex Ratio 986 986
Child Sex Ratio (0-6) 961 957
Child Population (0-6) 158,626 272,948
Male Child(0-6) 80,899 139,442
Female Child(0-6) 77,727 133,506
Child Percentage (0-6) 10.87 % 10.75 %
Male Child Percentage 11.01 % 10.91 %
Female Child Percentage 10.72 % 10.59 %
Literates 988,378 2,025,004
Male Literates 546,994 1,064,467
Female Literates 441,384 960,537
Average Literacy 75.95 % 89.39 %
Male Literacy 83.63 % 93.49 %
Female Literacy 68.20 % 85.24 %
Source: Census of India 2001 demographic Atlas of Tamil Nadu

93
From the Table 4.6, it is found that in Kancheepuram District among the
rural population 46.93 percent are males and 63.49 are females. Further rural
population is 1,459,916 which is 36.51% and urban 2,538,336 and is 63.49%
approximately. The density of population is 882 per Sq.km according to 2011
census In the rural region 988,378 are literates among them male are and Female are
441,384. Similarly, in the the urban region of the district, number of literates are
2,025,004 and among them 1,064,467 are males and 960,537 are females.
4.16 Forest Region
The total forest area in the district is 23,586 hectares accounting for 16.2%
of the total geographical area of the state. The total forest area in the district is
23,586 hectares, it spread interior regions and around the district. In this forest area
there are 366.675 hectares for Reserved Land. 76.50 Metric Tonnes lands are
cultivated in Fuelwood and 8.039 Tonnes in Cashew.
Erode district with an extent of 228749 ha under forest is the highest among
districts in their contribution to the forest area of the state. This works out to 10.8%
of the state s total forest area. This is followed by Krishnagiri district with 202409
ha (9.6%) and Dharmapuri with 164177 ha (7.8%).
4.17 Agriculture
The major occupation of Kancheepuram District is agriculture and 47% of
the total main workers are engaged in agriculture. Out of the total geographical area
of the district

94
AREA UNDER MAJOR FIELD CROPS & HORTICULTURE ETC.
Major Field
Crops cultivated
Kharif Rabi Summer Total
Irrigated Rainfed Irrigated Rainfed
Paddy 18.1 0.4 59.8 0.7 12.4 91.4
Ground Nut 4.6 1.3 15.3 0.7 21.9
Sugar cane 1.5 3.3 4.8
Black gram - 0.2 0.2 0.4 0.4 0.6
Green gram
Others
Horticulture
crops - Fruits
ha)
Mango 2.4
Banana 0.3
Watermelon 1.6
Guava 0.2
Citrus 0.2
4.18 Basin and sub-basin
Kancheepuram district is part of the composite east flowing river basin and
spread over a part of Palar and Cheyyar sub-basin.

95
4.19 Drainage
Palar and Cheyyar are the important rivers. The drainage pattern in general is
sub-dendritic and radial. All the rivers are seasonal and carry substantial flows
during monsoon period. River Palar, a major river course, which drains this district
originates from Western Ghats in Karnataka state, and discharges in Bay of Bengal
near Pudupattinam. The Cheyyar, a tributary of Palar originates from the Jawadu
Hills of Tiruvannamalai district. It has a northeasterly flow in Kancheepuram district
and confluences with the Palar near Pazhaiyaseevaram. Other seasonal river like
Korattalaiar and Tandiardrain this district partly on the northern and southern part
respectively.
4.20 Irrigation Practices
Table 4.20 gives the extent of land in Kancheepuram district The nine-fold lands use classification for the district is given below.(2005-06)
S. No Classification Area (Ha)
1 Forests 23856
2 Barren & Uncultivable Lands 10948
3 Land put to non-agricultural uses 146085
4 Cultivable Waste 10430
5 Permanent Pastures & other grazing lands 18328
6 Groves not included in the area sown 16273
7 Current Fallows 8156
8 Other Fallow Lands 73136
9 Net Area sown 135998
Total 443210
Source: Department of Economics & Statistics, Govt. of Tamil Nadu

96
The chief irrigation sources in the area are the tanks, wells, tube wells and
canal. Tank irrigation is highest in Madurantakam block followed by
Thirukalukkundram, Acharapakkam, Sriperumpudur, Tirupporur, Walajabad,
Chittamur, Lattur, Kattankolathur, Lathur, Kundrathur, Kancheepuram, St. Thomas
Mount blocks.
4.21 The block wise and source wise net area irrigated in Ha is given below (2005-06).
S. No Block
Net area irrigated by Total Net
area irrigated Canals Tanks Tube
wells ordinary
wells other
sources
1 Kancheepuram 24 2809 1878 3206 - 7917
2 Walajabad 30 4493 1831 2260 - 9214
3 Uttiramerur 0 3719 282 7162 - 11163
4 Sriperumpudur 0 6535 508 1692 - 8735
5 Kundrathur 0 2801 1464 2798 - 7063
6 Tiruporur 0 5925 405 1967 - 8297
7 Kattankolathur 0 3070 242 1878 - 5190
8 Thirukalukkundram 0 7205 840 2425 - 10648
9 Thamasmalai 0 1036 2 1518 - 2556
10 Madhurantagam 220 8345 439 4774 - 13778
11 Acharapakkam 220 7076 518 4874 - 12688
12 Chittamur 0 4020 2357 8301 - 14678
13 Lathur 56 3700 1400 3797 - 8953
Total 550 60732 12166 47252 120700
Source: Department of Economics & Statistics, Govt. of Tamil Nadu

97
4.22 Soil Types
Geomorphology
The prominent geomorphic units identified in the district through
interpretation of satellite imagery are i) Chingleput-Tirukkalukkunram Surface
(Erosional) ii) Palar Surface (fluvial and iii) Mamallapuram (Mahabalipuram)
surface (Marina) etc.
The elevation of the area ranges from 100 m amsl inthe west to a sea level in
the east. The major part of the area is characterised by an undulating topography
with innumerable depressions,which are used as irrigation tanks. Three beach
terraces ranging in elevation between 4mark the coastal tract and 12 m with broad
inter terrace depressions
The coastal plain displays a fairly low level or gently rolling surface and
only lightly elevated above the local water surfaces on rivers. The straight trend of
the coastline is a result of development of a vast alluvial plain. There are a number
of sand dunes in the coastal tract. The coastal landforms include estuarine tidal, mud
flats or lagoons and salt marsh etc.
Types of Soils
Soils have been classified into 1) clayey soil, 2) red sandy or red loamy soil
3) Red sandy brown clayey soil and 4) Alluvial soil. Of the above soils brown
clayey soil is the most predominant, covering more than 71 percent of the areal
extent of Kancheepuram district.

98
Alluvial soils are found on the banks of Palar, Cheyyar and other rivers. The
river alluvium is transported and is seen in coastal area of this district. Sandy coastal
alluvial (arenacious soil) occurs along the seacoast as a narrow belt.
4.23 Human rights
Kanchipuram has a rate than the national average of child labour and bonded
labour. The local administration is accused of aiding child labour by opening night
schools in Kanchipuram from 1999. There is an estimated 40,000 to 50,000 child
workers in Kanchipuram compared to 85,000 in the same industry in Varanasi
Children are commonly traded for sums of between 10,000 and 15,000 (200
300$) and there are cases where whole families are held in bondage. Child labour is
prohibited in India by the Children (Pledging of Labour) Act and Child Labour
(Prohibition and Regulation) Act, but these laws are not strictly enforced.
4.24 Religion
Buddhism
Buddhism is believed to have flourished in Kanchipuram between the 1st
and 5th centuries.[98] Some notable Buddhists associated with Kanchipuram are
(2nd 3rd centuries) a successor of of Nalanda University,
Dignaga and the Pali commentators Buddhaghosa and Dhammapala.[9 Bodhidharma
is believed to have spread Zen school of Buddhism from India to China
Jainism
Jainism was introduced into Kanchipuram by Kunda Kundacharya (1st
century).[99] Jainism spread to the city by Akalanka (3rd century). Kalbhras, the
rulers of Kanchipuram before the Pallavas, followed Jainism which gained

99
popularity from royal patronage.[99] The Pallava kings, Simhavishnu, Mahendra
Varman and Simhavarman (550 560) followed Jainism, until the advent of
Nayanmars and Azhwars during the 6th and 7th centuries.[
Hinduism
Hindus regard Kanchipuram to be one of the seven holiest cities in India.
According to Hinduism, a k etra is a sacred ground, a field of active power, and a
place where final attainment, or moksha, can be obtained. The Garuda Purana says
that seven cities, including Kanchipuram are providers of moksha.[66] The city is
considered a pilgrimage site for both Saivites and Vaishnavites.[6
4.25 Tourism
Kanchipuram district is a spectacular site of temples and the district
headquarters is also known as the temple city. The temples of Kanchipuram district
reflect the glorious traditions of South India. Mammalappuram was a flourishing
port-town during the time of Pallavas. This is one of the most famous tourist
attractions in the district of Kanchipuram. The monuments of Mamallapuram are
excellent specimen of Dravidian temple architecture and Pallava art. Sriperumpudur
is another place of tourist interest in the district. It is 29 kilometres from Chennai on
the way to Kanchipuram. It is the birth place of Saint Ramanuja, the father of
Visishtadvaida philosophy of Vaishnavism and hence, an important pilgrim centre
for the Vaishnavites. Kamakodi Peetham and Kammakshi Amman temple are
closely associated with the life of Shankaracharya.

100
4.26 Education
Kanchipuram is traditionally a centre of religious education for the Hindu,
Jainism and Buddhism faiths. The Buddhist monasteries acted as nucleus of the
Buddhist educational system. With the gradual resurrection of Hinduism during the
reign of Mahendra Varman I, the Hindu educational system gained prominence with
Sanskrit emerging as the official language.[5]
As of 2011 Kanchipuram has 49 registered schools, 16 of which are run by
the city municipality. The district administration opened night schools for educating
children employed in the silk weaving industry as of December 2001, these
schools together were educating 127 people and 260 registered students from
September 1999.[ Larsen and Tubro inaugurated the first rail construction training
centre in India at Kanchipuram on May 24, 2012, that can train 300 technicians and
180 middle level managers and engineers each year Sri Chandrasekharendra
Saraswathi Viswa Mahavidyalaya and Chettinad Academy of Research and
Education (CARE) are the two Deemed universities present in Kanchipuram.
Kanchipuram is home to one of the four Indian Institute of Information of
Technology, a public private partnered institute, offering under graduate and post
graduate programs in information technologyThe city has two medical colleges
Arignar Anna Memorial Cancer Institute and Hospital, established in 1969 is
operated by the Department of Health, Government of Tamil Nadu and the privately
owned Meenakshi Medical College. The city has 6 engineering colleges, 3
polytechnic institutes and 6 arts and science colleges.

101
4.27 Thinking on Population Issues
Family Planning Programme and Current Population Situation in India
India was the first country in the world to formulate a National Family
necessary to stabilize the population at a level consistent with requirement of
co
Five Year Plans have been providing the policy framework and funding for planned
development of nationwide health care infrastructure and manpower for provision of
health care services.
The technological advances and improved quality and converge of health
care resulted in a rapid fall in Crude Death Rate (CDR) from 25.1 in 1951 to 9.8 in
1991. In contrast, the reduction in Crude Birth Rate (CBR) has been less steep,
declining from 40.8 in 1951 to 29.5 in 1991. As a result, the annual exponential
population growth rate has been over 2% in the period between 1971-1991. India
while celebrating its golden Jubilee of Independence in 1997 made a commitment to
accelerate the process of population stabilization. India had already become, by then,
a signatory to the Programme of Action (PoA) of International Conference on
Population and Development (ICPD) held in Cairo in 1994, and committed to a new
holistic programme of Reproductive and Child Health (RCH), in October 1997. The
essential components undertaken for nationwide implementation include:-
Prevention and management of unwanted pregnancy
Services to promote safe motherhood
Services to promote child survival

102
Prevention and treatment of RTI/STI
Efforts were made to provide adequate inputs to improve availability and
access RCH services and to improve performance especially in the states/districts
where access to RCH services is sub optimal. Attempts to reduce disparities between
states/districts and achieve tangible improvement in the indices by replication of
better performing districts were encouraged.
Current Population Situation :
As per Census of India 2001
was 1028 million. Viewed globally, India constitutes 16.87% of the
World Population. The current population (estimate) is about 1111
million
The current high population growth rate in some parts of the country
is due to:
The large size of the population in the reproductive age group
(estimated contribution 60%).
Higher fertility due to unmet need for contraception (estimated
contribution 20%)
High wanted fertility due to prevailing high Infant Mortality Rate
(IMR) (estimated contribution about 20%).
E
Programmes since independence are as follows:

103
1952The Fist Five Year Plan
rate to stabilize population at a level consistent with the needs of the economy.
1956 The Second Five Year Plan proposed expansion of family planning
clinics in both rural and urban areas and recommended a more or less autonomous
Central Family Planning Board, with similar state level boards.
1961 The Third Five Year Plan envisaged the provision of sterilization
facilities in district hospitals, sub-divisional hospitals and primary health centers as a
1963 The Director of Family Planning proposed a shift from the clinic
approach to a community extension approach to be implemented by auxiliary nurse
midwives (one per 10,000 population) located in PHCs. Other proposals include : (a)
a goal of lowering the birth rate from an estimated 40 to 25 by 1973; and (b) a
cafeteria approach to the provision of contraceptive methods, wit an emphasis on
free choice.
1965The Intra Uterine Device (IUD) was introduced in the Indian Family
Planning Programme.
1966 A full-fledged Department of Family Planning was set up in the
Ministry of Health. Condoms began to be distributed through the established
channels of leading distributors of consumer goods.
In1976, during emergency, the Congress Government under Smt. Indira
Gandhi formulated a Population Policy (in a form of Policy Statement) which

104
became counter-productive because of a clause, which permitted States to go for
Compulsory Sterilization.
In1977, A revised population policy statement was tabled in Parliament by
In 1983 National Health Policy was announced in which mention was made
in passing about Population and Family Welfare Programmes.
In1991, the Government under Shri Narasimha Rao appointed a
Committee headed by Shri K Karunakaran, which submitted a report to the National
Development Council in 1993 in which it pleaded for National Population Policy.
In1993, the Government appointed Dr. M S Swaminathan as Chairman of
an Expert Group to draft a Population Policy. The draft Population Policy was
submitted to the then P M in 1994, which was subsequently tabled in Parliament but
could not be passed.
Again in 1997, an Attempt was made by the Government under Shri I K
Gujaral to table and get the Population Policy passed. However, it could not be
done.
In1999 the Government, under Shri A B Vajpayee, asked a Group of
Ministers to examine the Policy draft prepared by the Department of Family
Welfare, Ministry of Health & Family Welfare.
In February 2000, the Government of India announced the National
Population Policy (NPP), 2000

105
Family Planning Performance
The year 2010-11 ended with 34.9 million family planning acceptors at
national level comprising of 5.0 million Sterilizations, 5.6 million IUD insertions,
16.0 million condom users and 8.3 million O.P. users as against 35.6 million family
planning acceptors in 2009-10.

106
The age and parity of the acceptors of contraception, and the continuation rates of temporary methods of contraception are some of the important factors that determine birth rates. The trends in CPR and CBR over the last 25 years suggest that over the years there has been an improvement in the acceptance of appropriate contraception at appropriate time. Currently the FW Programme is focusing its attention on need assessment, balanced presentation of advantages and disadvantages about all the available methods of contraception counseling, provision of appropriate contraceptive at the right time and good follow up services. Effective implementation of the FW programme and ensuring that all the unmet needs for contraception are met will result in substantial improvement in CPR and enable rapid reduction in CBR
ACCEPTORS OF VASECTOMY & TUBECTOMY ( Figure : 4.9)
Over the last two decades there has been a steep fall in number of vasectomies (Figure-4.9). At the moment, over 97% of all sterilizations are tubectomies. If, over the next decade, attempts are made to repopularise vasectomy so that this safe, simple procedure forms at least 50% of all sterilizations, there will be a further improvement in access to sterilization in the primary health care settings, substantial reduction both in the morbidity/mortality associated with terminal methods of contraception and reduction in the cost of permanent

107