chapter 4 natural gas - gov.uk · pdf filechapter 4 natural gas long the ... vast bulk arrive...
TRANSCRIPT

89
Chapter 4 Natural Gas
Introduction 4.1 Gas is one of the key pillars of the UK’s energy mix, accounting for over 30 per cent of the UK’s energy production and is second only to oil. Gas production from the UK’s Continental Shelf (UKCS) would be sufficient to meet nearly 60 per cent of gas demand. Gas is particularly important for electricity generation where it meets over half of the fuel required in power stations, a figure substantially up on last year due to the decline of coal in power generation. It is also critical for space heating, domestically and in offices, hotels and restaurants. In 2016 gas met nearly two thirds of total domestic energy demand. 4.2 An energy flow chart for 2016, showing the flows of natural gas from production and imports through to consumption, is included overleaf as a way of simplifying the figures that can be found in the commodity balance tables. It illustrates the flow of gas from the point at which it becomes available from indigenous production or imports (on the left) to the eventual final use of gas (on the right), as well as volumes transformed into other forms of energy or exported.
Key points
UK natural gas production in 2016 was up 2.4 per cent on 2015 to 463 TWh, continuing the year-on-year increases seen since 2014. This pattern contrasts with the long-term decline in UK natural gas production, which had fallen by an average of 8 per cent from peak production in 2000 to the end of 2013. Gas production is just over a third of the peak level recorded in 2000 (Table 4.1, Chart 4.1).
Net imports were 22 per cent higher in 2016 compared to 2015 (Table 4.1), with imports up 6.8 per cent and exports down by 27 per cent. Exports to Belgium decreased by just over 20 per cent, but still making up more than half of all exports in 2016. (Table 4.5).
Imports of Liquefied Natural Gas (LNG) decreased by a fifth to 122 TWh in 2016, while in contrast pipeline imports increased by a fifth, with increased imports from Belgium, the Netherlands and Norway. (Table 4.5, Chart 4.2).
Total gas demand (natural gas plus colliery methane) increased by 12.5 per cent in 2016 to 897 TWh, mainly driven by increased gas usage for power generation (up just over 40 per cent on 2015) as the reduction in coal generation capacity continues.
Final consumption increased by 3.2 per cent in 2016 to 510 TWh, the colder winter in 2016 driving increases in the domestic (4.6 per cent), public administration (1.9 per cent) and commercial (5.4 per cent) sectors.

Natural gas flow chart 2016 (TWh)
Note: This flow chart is based on data that appear in Table 4.1, excluding colliery methane.
90
91
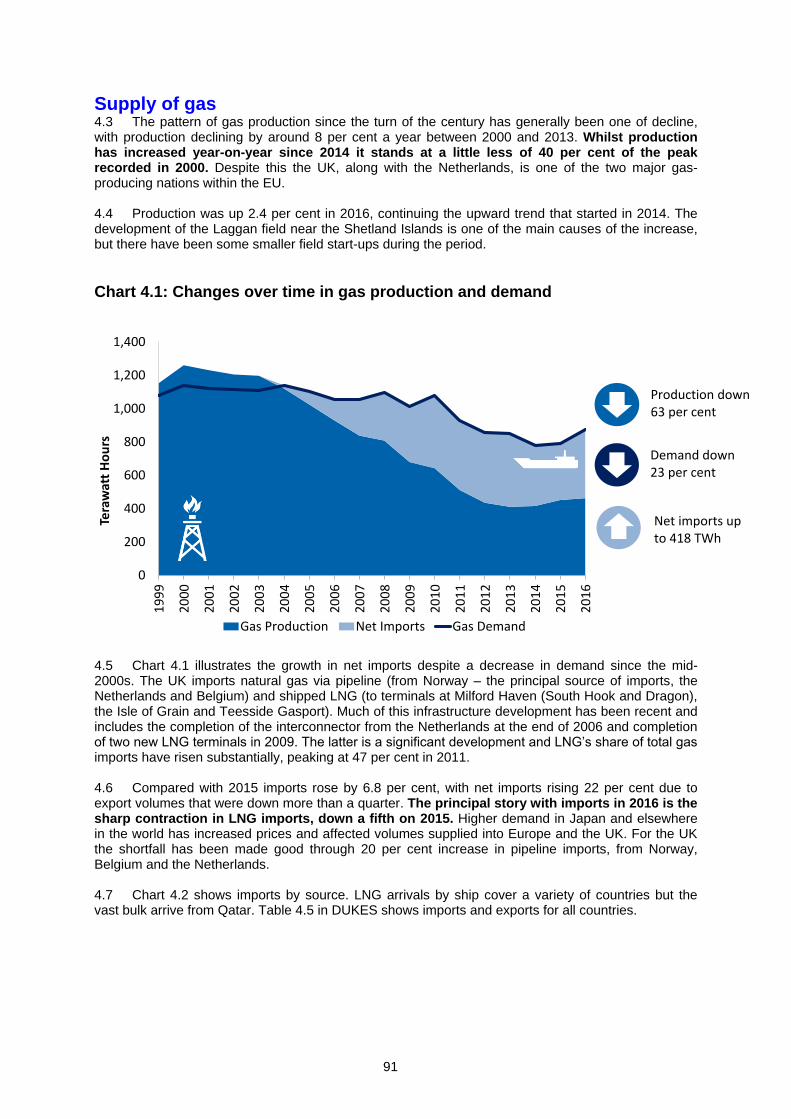
Supply of gas 4.3 The pattern of gas production since the turn of the century has generally been one of decline, with production declining by around 8 per cent a year between 2000 and 2013. Whilst production has increased year-on-year since 2014 it stands at a little less of 40 per cent of the peak recorded in 2000. Despite this the UK, along with the Netherlands, is one of the two major gas-producing nations within the EU. 4.4 Production was up 2.4 per cent in 2016, continuing the upward trend that started in 2014. The development of the Laggan field near the Shetland Islands is one of the main causes of the increase, but there have been some smaller field start-ups during the period.
Chart 4.1: Changes over time in gas production and demand
4.5 Chart 4.1 illustrates the growth in net imports despite a decrease in demand since the mid-2000s. The UK imports natural gas via pipeline (from Norway – the principal source of imports, the Netherlands and Belgium) and shipped LNG (to terminals at Milford Haven (South Hook and Dragon), the Isle of Grain and Teesside Gasport). Much of this infrastructure development has been recent and includes the completion of the interconnector from the Netherlands at the end of 2006 and completion of two new LNG terminals in 2009. The latter is a significant development and LNG’s share of total gas imports have risen substantially, peaking at 47 per cent in 2011. 4.6 Compared with 2015 imports rose by 6.8 per cent, with net imports rising 22 per cent due to export volumes that were down more than a quarter. The principal story with imports in 2016 is the sharp contraction in LNG imports, down a fifth on 2015. Higher demand in Japan and elsewhere in the world has increased prices and affected volumes supplied into Europe and the UK. For the UK the shortfall has been made good through 20 per cent increase in pipeline imports, from Norway, Belgium and the Netherlands.
4.7 Chart 4.2 shows imports by source. LNG arrivals by ship cover a variety of countries but the vast bulk arrive from Qatar. Table 4.5 in DUKES shows imports and exports for all countries.
0
200
400
600
800
1,000
1,200
1,400
19
99
20
00
20
01
20
02
20
03
20
04
20
05
20
06
20
07
20
08
20
09
20
10
20
11
20
12
20
13
20
14
20
15
20
16
Tera
wat
t H
ou
rs
Gas Production Net Imports Gas Demand
Production down 63 per cent
Demand down 23 per cent
Net imports up to 418 TWh

92
Chart 4.2: Gas imports by country 2016
4.8 The European transit system for gas is complex, with multiple connectors giving a high degree of interconnectivity. Map 4A is illustrative of this and shows how gas flows into the EU (from Russia, Norway and by ship principally) and onto the UK (principally from Norway and by ship, with little or no direct reliance on Russian gas). A larger version of the map is available at www.gov.uk/government/publications/energy-trends-december-2016-special-feature-article-physical-gas-flows-across-europe-and-diversity-of-gas-supply-in-2015. The UK National Gas Transmission System is similarly complex a map, which can be found in Map 4B.
Map 4A: The European gas transit system
93
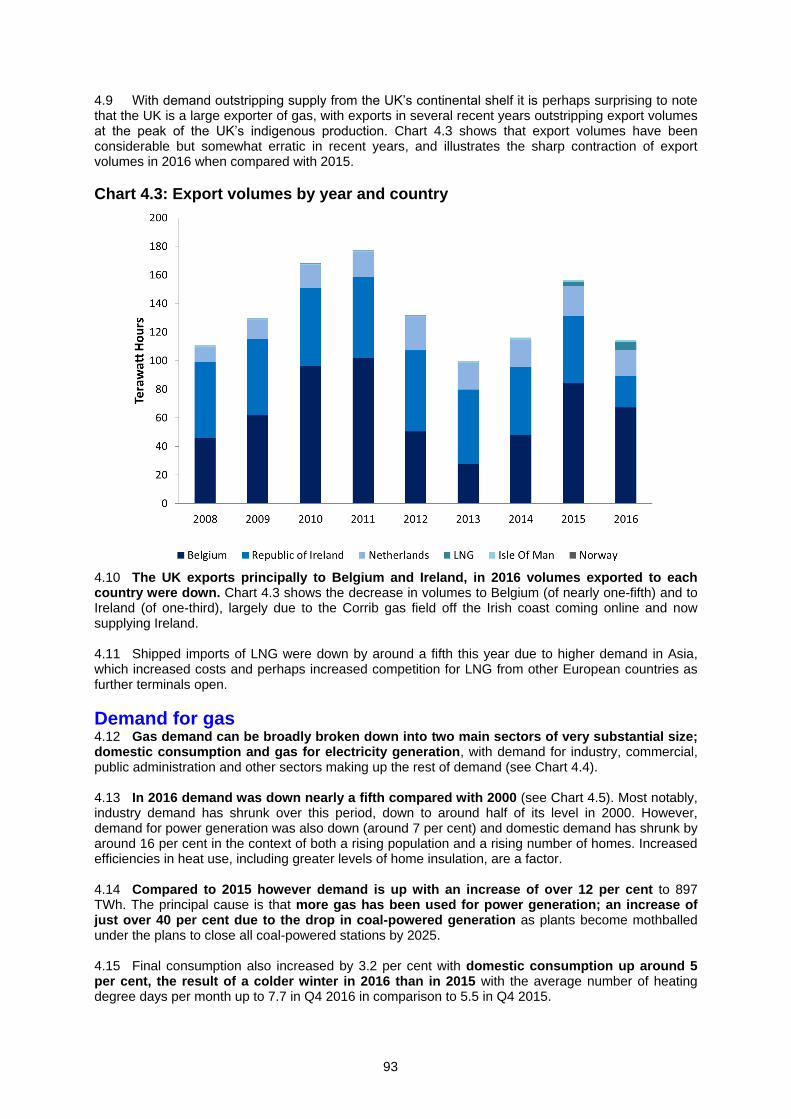
4.9 With demand outstripping supply from the UK’s continental shelf it is perhaps surprising to note that the UK is a large exporter of gas, with exports in several recent years outstripping export volumes at the peak of the UK’s indigenous production. Chart 4.3 shows that export volumes have been considerable but somewhat erratic in recent years, and illustrates the sharp contraction of export volumes in 2016 when compared with 2015.
Chart 4.3: Export volumes by year and country
4.10 The UK exports principally to Belgium and Ireland, in 2016 volumes exported to each country were down. Chart 4.3 shows the decrease in volumes to Belgium (of nearly one-fifth) and to Ireland (of one-third), largely due to the Corrib gas field off the Irish coast coming online and now supplying Ireland. 4.11 Shipped imports of LNG were down by around a fifth this year due to higher demand in Asia, which increased costs and perhaps increased competition for LNG from other European countries as further terminals open.
Demand for gas 4.12 Gas demand can be broadly broken down into two main sectors of very substantial size; domestic consumption and gas for electricity generation, with demand for industry, commercial, public administration and other sectors making up the rest of demand (see Chart 4.4). 4.13 In 2016 demand was down nearly a fifth compared with 2000 (see Chart 4.5). Most notably, industry demand has shrunk over this period, down to around half of its level in 2000. However, demand for power generation was also down (around 7 per cent) and domestic demand has shrunk by around 16 per cent in the context of both a rising population and a rising number of homes. Increased efficiencies in heat use, including greater levels of home insulation, are a factor. 4.14 Compared to 2015 however demand is up with an increase of over 12 per cent to 897 TWh. The principal cause is that more gas has been used for power generation; an increase of just over 40 per cent due to the drop in coal-powered generation as plants become mothballed under the plans to close all coal-powered stations by 2025.
4.15 Final consumption also increased by 3.2 per cent with domestic consumption up around 5 per cent, the result of a colder winter in 2016 than in 2015 with the average number of heating degree days per month up to 7.7 in Q4 2016 in comparison to 5.5 in Q4 2015.

94
Chart 4.4: Gas demand in 2016
4.16 Chart 4.5 shows gas demand over time. As noted above, demand has reduced since the mid-2000s but there are notable peaks that correspond with weather variations, which generate a greater demand for space heating in homes and offices.
Chart 4.5: Changes in gas demand over time
4.17 More detailed analysis of gas consumption in the domestic sector is available in the National Energy Efficiency Data-Framework (NEED): www.gov.uk/government/collections/national-energy-efficiency-data-need-framework. For definitions of the various sectors used for sales and consumption analyses see Chapter 1 paragraphs 1.55 to 1.60 and Annex A, paragraphs A.31 to A.42.

95
Sub-national gas data 4.18 In January 2017, BEIS published sub-national energy statistics data on its website: www.gov.uk/government/collections/sub-national-gas-consumption-data, including consumption data at both regional (NUTS1) and local (LAU1) level. Data for earlier years are presented on the website.
Table 4A: Consumption by gas customers by region in 2015 meters (1)
Domestic Meters1 Total Number of Meters
Region/Country2
Customers (1000’s)
Sales (GWh)
Customers
(1000’s)
Sales (GWh)
North East 1,103 14,738 1,113 22,368
North West 2,901 37,278 2,930 60,287
Yorkshire and the Humber 2,121 28,923 2,144 48,274
East Midlands 1,774 23,771 1,792 36,850
West Midlands 2,111 27,847 2,134 43,935
East 2,068 27,902 2,089 42,052
London 3,006 40,014 3,045 58,439
South East 3,199 43,891 3,236 59,856
South West 1,850 21,577 1,868 31,360
Scotland 1,116 13,682 1,125 22,045
Wales 1,994 27,226 2,016 45,469
Great Britain 23,241 306,849 23,493 470,935
1 Customers with an annual consumption of 73,200 kWh or lower will include some small industrial
and commercial consumers. 2 Data excludes approximately 169,000 customers (0.7 per cent) for whom regional allocation was not
possible.
4.19 The total number of customers in 2015 remains fairly similar to 2014, with all areas seeing a small rise in the total number of customers. Within this the South East and London have the largest numbers of consumers, whilst the North East and Wales have the lowest. In contrast total sales have fallen in 8 of the 11 regions between 2014 and 2015, with the largest decline (-2.6 per cent) in the South West. In Great Britain as a whole there was an overall decrease in consumption of 0.3 per cent. A more detailed summary of this data can be found at: www.gov.uk/government/statistics/sub-national-electricity-and-gas-consumption-summary-report-2015. These data are published on a regular basis and updated data will be available.
4.20 In March 2017, BEIS published Percentage of domestic gas customers by region and supplier type data on its website: www.gov.uk/government/statistical-data-sets/quarterly-domestic-energy-price-stastics.

96
Table 4B: Domestic gas market penetration (in terms of percentage of customers supplied1) by region, Quarter 4 2016
Region/Country2
All Payment Types
Home supplier Other large supplier
South Wales 28 72
North East 29 71
East Midlands 32 68 North Scotland 32 68
South East 33 67
Southern 33 67 Yorkshire 35 65
Eastern 36 64
South Scotland 36 64
South West 36 64
West Midlands 36 64
North West 38 62
Merseyside & N Wales 39 61
London 41 59
Great Britain 35 65
1 Table is not adjusted to account for survey coverage. The Domestic Fuels Inquiry survey coverage is
estimated at around 88%. All those not surveyed are with non-home suppliers.
2 The regions used in this table are the distribution areas of the former public electricity suppliers. This
marks a change from previous years, where regions were based on Transco local distribution zones (LDZs).
4.21 At the end of December 2016, BEIS estimates that 65 per cent of domestic gas customers in Great Britain were no longer with their home supplier, British Gas. The data in Table 4B are based on the BEIS domestic prices survey, which does not include the majority of small suppliers and therefore underestimates the proportion of customers not with their home supplier. By the end of December 2016 of the companies surveyed, around 35 per cent of customers were supplied by British Gas 4.22 Competition in the domestic, industrial and commercial markets have continued to increase in 2016 as the concentration of sales by the largest three and largest six suppliers for each relevant sector have continued to dilute compared to past years. Competition remained broadly unchanged between 2008 and 2013, but from 2014 onwards the competition has gradually increased. In 2016, the largest six domestic suppliers accounted for around 85 per cent of sales, down from 90 per cent of sales in 2015 and 97 per cent of sales in 2013.

97
Map 4B: The National Gas Transmission System
Source: International Energy Agency and BEIS

98
Gas resources 4.23 The Oil and Gas Authority estimates that there are 297 billion cubic metres of proven and probable gas reserves, of which 176 billion cubic metres are proven reserves. There has been a steady decline in proven plus probable reserves since 1994 (as shown in Chart 4.6), initially associated with a higher rate of production. With the addition of cumulative gas production to the end of 2016 the estimated ultimate recovery figure is 2,889 billion cubic metres.
Chart 4.6: Gas reserves
* From 2015, contingent resources have been re-categorised and removed from the probable and proven reserves category.
List of DUKES gas tables
Table Description Period
4.1 Natural gas commodity balances 1998-2016 4.2 Supply and consumption of natural gas and colliery methane 2012-2016 4.3 UK continental shelf and onshore natural gas production and supply 2012-2016 4.4 Gas storage sites and import/export facilities in the United Kingdom May 2016 4.5 Natural gas imports and exports 2012-2016 4.6 Liquefied natural gas imports by terminal 2012-2016 4.1.1 Natural gas and colliery methane production and consumption 1970-2016 F.2 Gas production Total to 1998-2016

99
Technical notes and definitions These notes and definitions are in addition to the technical notes and definitions covering all fuels and energy as a whole in Chapter 1, paragraphs 1.29 to 1.63. For notes on the commodity balances and definitions of the terms used in the row headings see Annex A, paragraphs A.7 to A.42. While the data in the pdf copy of this Digest cover only the most recent five years, these notes also cover data for earlier years that are available on the BEIS energy statistics web site.
Definitions used for production and consumption 4.24 Natural gas production in Tables 4.1 and 4.2 relates to the output of indigenous methane at land terminals and gas separation plants (includes producers’ and processors’ own use). For further explanation, see Annex F on BEIS’s energy statistics web site under ‘Production of gas’ - www.gov.uk/government/collections/digest-of-uk-energy-statistics-dukes. Output of the Norwegian share of the Frigg and Murchison fields is included under imports. A small quantity of onshore produced methane (other than colliery methane) is also included.
4.25 Colliery methane production is colliery methane piped to the surface and consumed at collieries or transmitted by pipeline to consumers. As the output of deep-mined coal declines so does the production of colliery methane, unless a use can be found for gas that was previously vented. The supply of methane from coal measures that are no longer being worked or from drilling into coal measures is licensed under the same legislation as used for offshore gas production.
4.26 Transfers of natural gas include natural gas use within the iron and steel industry for mixing with blast furnace gas to form a synthetic coke oven gas. For further details see paragraph 2.54 in Chapter 2.
4.27 Non-energy gas: Non-energy use is gas used as feedstock for petrochemical plants in the chemical industry as raw material for the production of ammonia (an essential intermediate chemical in the production of nitrogen fertilisers) and methanol. The contribution of liquefied petroleum gases (propane and butane) and other petroleum gases is shown in Tables 3.2 to 3.4 of Chapter 3. Firm data for natural gas are not available, but estimates for 2011 to 2015 are shown in Table 4.2 and estimates for 2013 to 2015 in Table 4.1. The estimates for the years up to 2011 have been obtained from AEA’s work for the National Atmospheric Emissions Inventory; 2012-13 data are BEIS extrapolations. For DUKES 2016, we will be exploring non-energy use in more detail to improve the accuracy of these data.
Sectors used for sales/consumption 4.28 For definitions of the various sectors used for sales and consumption analyses see Chapter 1 paragraphs 1.55 to 1.60 and Annex A, paragraphs A.31 to A.42.
Data collection 4.29 Production figures are generally obtained from returns made under OGA’s Petroleum Production Reporting System (PPRS). BEIS also obtain data on the transmission of natural gas from National Grid (who operate the National Transmission System) and from other pipeline operators. Data on consumption are based on returns from gas suppliers and UK Continental Shelf (UKCS) producers who supply gas directly to customers, (see paragraph 4.31). 4.30 The production data are for the UK (including natural gas from the UKCS - offshore and onshore). The restoration of a public gas supply to parts of Northern Ireland in 1997 means that all tables in this chapter, except Tables 4A and 4B, cover the UK.
4.31 BEIS carry out an annual survey of gas suppliers to obtain details of gas sales to the various categories of consumer. The larger gas suppliers (defined as those with more than about a 0.5 per cent share of the UK market up to 1997 and those known to supply more than 1,750 GWh per year for 1998 onwards) provide a detailed breakdown of sales for final consumption to BEIS on an annual basis. This provides the main data source for the UK’s gas demand. Prior to 2013 data, companies supplying less than 1,750 GWh provided gas sales as a single sum which was then apportioned across sectors using the same proportional split as seen in the data from the large suppliers. From 2013 onwards, data from smaller suppliers were provided broken down by broad sector (e.g. domestic, other industry etc.) to allow more accurate apportioning of these data.

100
4.32 Data on sectoral gas use are primarily derived from surveys of large and small gas suppliers. Beyond this, data for electricity generation by major power producers are adjusted, such that the data agree with a separate data set collected via the Major Power Producers’ (MPP) survey. Data for autogenerators are similarly adjusted to match CHP data (see Chapter 7) provided to BEIS, with the appropriate amount of gas used for autogeneration being subtracted from each sector and added to the autogeneration figure. The same methodology is applied for heat sold, which makes up the heat generation figure. For 2000 and subsequent years, gas consumption for the iron and steel sector is based on data provided by the Iron and Steel Statistics Bureau (ISSB) rather than gas suppliers since gas suppliers were over estimating their sales to this sector. The difference between the ISSB and gas suppliers’’ figures has been re-allocated to other sectors.
Methodology updates 4.33 Biomethane has been injected into the National Grid from certified Renewable Heat Incentive (RHI) installations since 2014. These volumes have been small, but increasing, with biomethane accounting for 0.2 per cent of supply in 2016. This gas is included in the transfers row in Tables 4.1, 4.2 and 4.3 in this chapter and separately identified in the monthly Energy Trends tables (see Energy Trends June 2017 special feature for details: www.gov.uk/government/uploads/system/uploads/attachment_data/file/622863/Enhancements_to_Energy_Trends_gas_tables.pdf). 4.34 In 2016 BEIS updated the methodology to calculate gas exports to the Republic of Ireland to remove virtual reverse flows, which ensures that only physical flows are reported in line with international reporting standards (see Energy Trends June 2017 special feature for details: www.gov.uk/government/uploads/system/uploads/attachment_data/file/622863/Enhancements_to_Energy_Trends_gas_tables.pdf). Along with this we have used two new data sources, one to identify gas sent to Northern Ireland to improve data capture and another to separately identify gas exports to the Isle of Man. The methodology to calculate exports to the Republic of Ireland is outlined below and illustrated in Figure 4.1:
1. National Grid provide BEIS with data for gas input into the transmission system, stock
changes, operator’s own use, exports through all interconnectors and gas output from the transmission system in the form of a GM10 report. The exports through all interconnectors are calculated by removing offtakes from Local Distribution Networks (LDZ) from gas transported through companies’ pipelines.
2. The export data provided by National Grid is the combined amount of gas sent through the Bacton and Moffat interconnectors along with the Scotland-Northern Ireland Pipeline (SNIP) and therefore is the gas sent out from Great Britain.
3. BEIS then remove gas exports to Belgium through the Bacton interconnector to leave a figure for the amount of gas sent through the Moffat Interconnector to the Republic of Ireland and the Isle of Man along with gas sent to Northern Ireland through the SNIP.
4. BEIS then remove the amount of gas sent to Northern Ireland from Moffat via the SNIP from shipping allocation data from Gas Networks Ireland (GNI).
5. This figure for the Moffat Interconnector from National Grid is currently the nominated flow to Ireland. Therefore, BEIS remove the Virtual Reverse Flow (VRF) from Ireland to the UK to gain a physical flow to ensure that reporting is consistent with methodology from the International Energy Agency (IEA) and Eurostat.
6. The gas taken off on the interconnector to the Isle of Man (data provided by Manx Utilities) is then removed to obtain a figure for the amount of gas exported to the Republic of Ireland.

101
Figure 4.1: Methodology to calculate exports of gas to Northern Ireland
4.35 BEIS updated our gas data collection methodology and analysis in 2014 (see Energy Trends June 2014 special feature for details: www.gov.uk/government/statistics/energy-trends-june-2014). This change in methodology resulted in shifts in sectoral gas use going back to 2008. In particular, gas use shifted out of the industrial sector, with a subsequent increase in the services sector.
Period covered 4.36 Figures generally relate to years ended 31 December. However, before 2004, data for natural gas for electricity generation relate to periods of 52 weeks as set out in Chapter 5, paragraphs 5.83 and 5.84.
Monthly and quarterly data 4.37 Monthly data on natural gas production and supply are available from BEIS’s energy statistics website: www.gov.uk/government/collections/gas-statistics in monthly Table 4.2. A quarterly commodity balance for natural gas (which includes consumption data) is published in BEIS’s quarterly statistical bulletin Energy Trends and is also available from quarterly Table 4.1 on BEIS’s energy statistics web site.
Statistical and metering differences 4.38 Table 4.3 shows production, transmission and consumption figures for UK continental shelf and onshore natural gas. This table departs from the standard balance methodology and definitions to maintain the link with historical data and with monthly data given on BEIS’s energy statistics website. This section of the technical notes illustrates how total gas consumption shown in Table 4.3 and Table 4.1.are mapped across. Production includes waste and own use for drilling, production and pumping operations, but excludes gas flared. Gas available in the UK excludes waste, own use for drilling etc., stock change, and includes imports net of exports. Gas transmitted (input into inland transmission systems) is after stock change, own use, and losses at inland terminals. The amount consumed in the UK differs from the total gas transmitted by the gas supply industry because of losses in transmission, differences in temperature and pressure between the points at which the gas is measured, delays in reading meters and consumption in the works, offices, shops, etc. of the undertakings. The figures include an adjustment to the quantities billed to consumers to allow for the estimated consumption remaining unread at the end of the year.
4.39 In Table 4.3 there are several headings that refer to statistical or metering differences. These arise because measurement of gas flows, in volume and energy terms, takes place at several points along the supply chain. The main sub-headings in the table represent the instances in the supply

102
chain where accurate reports are made of the gas flows at that particular key point in the supply process. It is possible to derive alternative estimates of the flow of gas at any particular point by taking the estimate for the previous point in the supply chain and then applying the known losses and gains in the subsequent part of the supply chain. The differences seen when the actual reported flow of gas at any point and the derived estimate are compared are separately identified in the table wherever possible, under the headings statistical or metering differences.
4.40 The relationship between total UK gas consumption shown in this Table 4.3 and total demand for natural gas given in the balance Table 4.1 is illustrated for 2016 as follows:
GWh
Total UK consumption (Table 4.3) 836,354 Plus producers’ own use +50,079 Plus operators’ own use +4,177
Consumption of natural gas 890,610 Plus upstream losses and metering differences +0 Plus downstream losses – leakage assessment +1,249 Plus downstream losses – own gas use +29 Plus downstream losses – theft +51 Plus downstream losses – iron and steel losses +3 Plus downstream metering differences +4,065
Total demand for natural gas (Table 4.1) 896,007
4.41 The statistical difference row in Table 4.1 is made up of the following components in 2016:
GWh
Statistical difference between gas available at terminals and gas input to downstream (Table 4.3) -860
Plus Downstream gas industry: Distribution losses and metering differences
+2857
Statistical difference for natural gas (Table 4.1) 1,997
4.42 Losses and metering differences attributable to the information provided on the upstream gas industry are zero from 2001 onwards because these data are no longer reported in the revised PPRS System. This simplified system for reporting the production of crude oil, NGLs and natural gas in the UK was implemented from 1 January 2001; it reduced the burden on the respondents and improved the quality of data reported on gas production.
4.43 The differences in the natural gas commodity balances arise from several factors:-
Limitations in the accuracy of meters used at various points of the supply chain. While standards are in place on the accuracy of meters, there is a degree of error allowed which, when large flows of gas are being recorded, can become significant.
Differences in the methods used to calculate the flow of gas in energy terms. For example, at the production end, rougher estimates of the calorific value of the gas produced are used which may be revised only periodically, rather than the more accurate and more frequent analyses carried out further down the supply chain. At the supply end, although the calorific value of gas shows day-to-day variations, for the purposes of recording the gas supplied to customers a single calorific value is used. Until 1997 this was the lowest of the range of calorific values for the actual gas being supplied within each LDZ, resulting in a “loss” of gas in energy terms. In 1997 there was a change to a “capped flow-weighted average” algorithm for calculating calorific values resulting in a reduction in the losses shown in the penultimate row of Table 4.3. This change in algorithm, along with improved meter validation and auditing procedures, also reduced the level of the “metering differences” row within the downstream part of Table 4.3.

103
Differences in temperature and pressure between the various points at which gas is measured. Until February 1997 British Gas used “uncorrected therms” on their billing system for tariff customers when converting from a volume measure of the gas used to an energy measure. This made their supply figure too small by a factor of 2.2 per cent, equivalent to about 1 per cent of the wholesale market.
Differences in the timing of reading meters. While National Transmission System meters are read daily, customers’ meters are read less frequently (perhaps only annually for some domestic customers) and profiling is used to estimate consumption. Profiling will tend to underestimate consumption in a strongly rising market.
Other losses from the system, for example theft through meter tampering by consumers. 4.44 The headings in Table 4.3 show where, in the various stages of the supply process, it has been possible to identify these metering differences as having an effect. Usually they are aggregated with other net losses as the two factors cannot be separated. Whilst the factors listed above can give rise to either losses or gains, losses are more common. However, the negative downstream gas metering difference within the transmission system in 2003 was an anomaly that was investigated by National Grid during 2004. They concluded that this unaccounted for element of National Transmission System shrinkage was due to an exceptional run of monthly negative figures between February and June 2003 within what is usually a variable but mainly positive series. However, after a comprehensive investigation of this exceptional period no causal factors were identified. It is probable that the meter error or errors that caused this issue were corrected during the validation of metering.
4.45 Care should be exercised in interpreting the figures for individual industries in these commodity balance tables. As companies switch contracts between gas suppliers, it has not been possible to ensure consistent classification between and within industry sectors and across years. The breakdown of final consumption includes a substantial amount of estimated data prior to 2013.
Contacts:
Warren Evans Energy Statistics Team [email protected] 0300 068 5059 Matthew Curds (upstream gas) Energy Statistics Team [email protected] 0300 068 8414 James Halliwell (downstream gas) Energy Statistics Team [email protected] 0300 068 8121

104

4.1 Commodity balances Natural gas GWh
Natural Colliery Total Natural Colliery Total Natural Colliery Totalgas methane Natural gas methane Natural gas methane Natural
gas gas gasSupplyProduction 415,515r 391r 415,906r 451,437r 354r 451,791r 462,307 443 462,750Other sources - - - - - - - - -Imports 488,937r - 488,937r 501,563r - 501,563r 534,740 - 534,740Exports -127,907r - -127,907r -159,517r - -159,517r -116,862 - -116,862Marine bunkers - - - - - - - - -Stock change (1) -2,383 - -2,383 +3,515 - 3,515 16,242 - 16,242Transfers (2) -4r - -4r 559r - 559r 1,575 - 1,575Total supply 774,158r 391r 774,549r 797,558r 354r 797,912r 898,002 443 898,445Statistical difference (3) -3,846r - -3,846r 779r - 779r 1,476 - 1,476Total demand 778,004r 391r 778,395r 796,779r 354r 797,132r 896,527 443 896,970Transformation 243,090r 378r 243,468r 237,682r 343r 238,025r 323,763 434 324,197Electricity generation 217,459r 378r 217,837r 212,289r 343r 212,632r 297,643 434 298,077
Major power producers 189,919 - 189,919 185,955 - 185,955 271,563 - 271,563Autogenerators 27,540r 378r 27,918r 26,335r 343r 26,678r 26,080 434 26,514
Heat generation (4) 25,631 - 25,631 25,393r - 25,393r 26,120 - 26,120Petroleum refineries - - - - - - - - -Coke manufacture - - - - - - - - -Blast furnaces - - - - - - - - -Patent fuel manufacture - - - - - - - - -Other - - - - - - - - -Energy industry use 52,470r -r 52,470r 58,645r -r 58,645r 57,773 - 57,773Electricity generation - - - - - - - - -Oil and gas extraction 45,391 - 45,391 51,024r - 51,024r 50,079 - 50,079Petroleum refineries 1,201r - 1,201r 1,201r - 1,201r 1,079 - 1,079Coal extraction 100r -r 100r 79 -r 79r 61 - 61Coke manufacture - - - - - - - - -Blast furnaces 338 - 338 323 - 323 291 - 291Patent fuel manufacture - - - - - - - - -Pumped storage - - - - - - - - -Other 5,440r - 5,440r 6,018r - 6,018r 6,263 - 6,263Losses (5) 6,856r - 6,856r 6,469r - 6,469r 5,396 - 5,396Final consumption 475,588r 13 475,601r 493,983r 11 493,994r 509,596 9 509,605Industry 100,623r 13 100,636r 99,200r 11 99,211r 97,997 9 98,006Unclassified - 13 13 - 11 11 - 9 9Iron and steel 5,454 - 5,454 5,374 - 5,374 4,155 - 4,155Non-ferrous metals 2,073r - 2,073r 1,832r - 1,832r 1,879 - 1,879Mineral products 11,105r - 11,105r 11,156r - 11,156r 11,711 - 11,711Chemicals 19,557r - 19,557r 19,524r - 19,524r 19,612 - 19,612Mechanical Engineering etc 5,938r - 5,938r 6,054r - 6,054r 6,079 - 6,079Electrical engineering etc 2,779r - 2,779r 3,093r - 3,093r 3,402 - 3,402Vehicles 8,321r - 8,321r 8,695r - 8,695r 9,109 - 9,109Food, beverages etc 20,395r - 20,395r 19,613r - 19,613r 19,817 - 19,817Textiles, leather etc 4,579r - 4,579r 4,467r - 4,467r 4,139 - 4,139Paper, printing etc 10,441r - 10,441r 9,517r - 9,517r 8,330 - 8,330Other industries 7,022r - 7,022r 6,745r - 6,745r 6,534 - 6,534Construction 2,957r - 2,957r 3,126r - 3,126r 3,231 - 3,231Transport - - - - - - - - -Air - - - - - - - - -Rail - - - - - - - - -Road - - - - - - - - -National navigation - - - - - - - - -Pipelines - - - - - - - - -Other 369,535r - 369,535r 389,516r - 389,516r 406,490 - 406,490Domestic 283,691r - 283,691r 297,582r - 297,582r 311,375 - 311,375Public administration 34,972r - 34,972r 36,545r - 36,545r 37,246 - 37,246Commercial 40,189r - 40,189r 44,097r - 44,097r 46,459 - 46,459Agriculture 1,073r - 1,073r 983r - 983r 946 - 946Miscellaneous 9,609r - 9,609r 10,310r - 10,310r 10,464 - 10,464Non energy use 5,430 - 5,430 5,267 - 5,267 5,109 - 5,109
(1) Stock fall (+), stock rise (-).(2) Natural gas used in the manufacture of synthetic coke oven gas.(3) Total supply minus total demand.(4) Heat sold to third parties. Heat generation data are not available before 1999. For earlier years gas used to generate heat for sale is allocated to final consumption by sector.(5) Refers to downstream losses. For an explanation of what is included under these losses, see paragraph 4.40.
2014 2015 2016
105
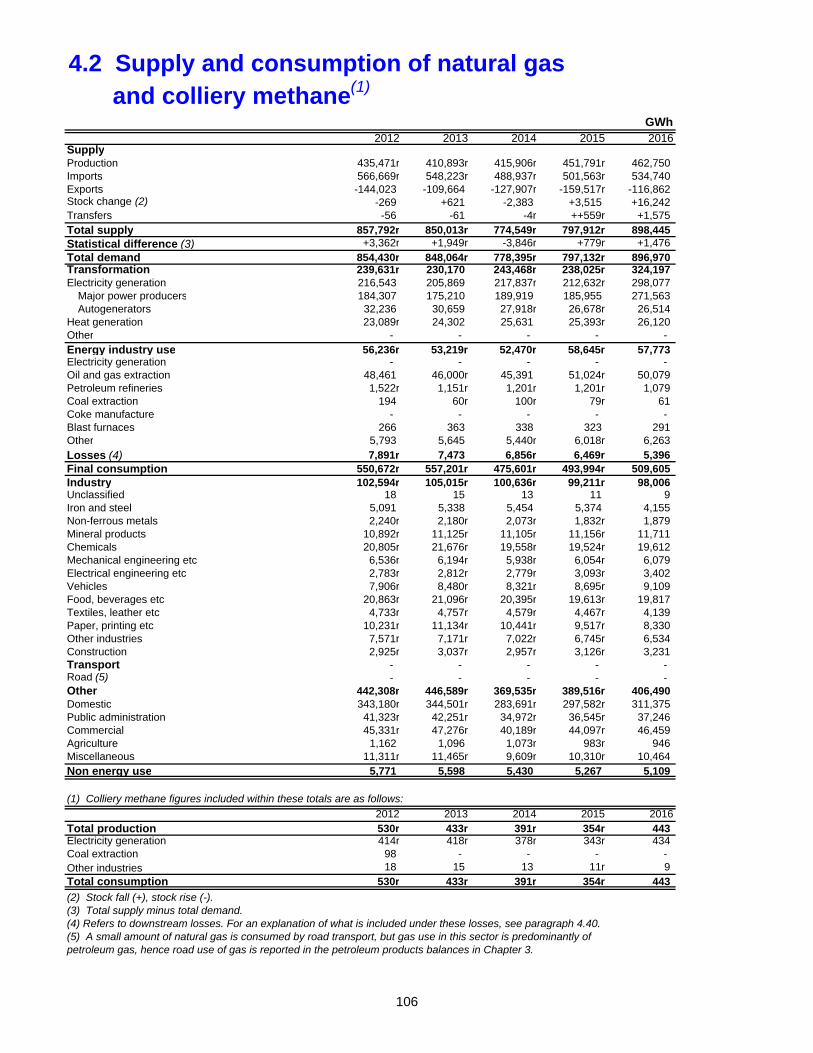
4.2 Supply and consumption of natural gas and colliery methane(1)
GWh 2012 2013 2014 2015 2016SupplyProduction 435,471r 410,893r 415,906r 451,791r 462,750 Imports 566,669r 548,223r 488,937r 501,563r 534,740 Exports -144,023 -109,664 -127,907r -159,517r -116,862 Stock change (2) -269 +621 -2,383 +3,515 +16,242 Transfers -56 -61 -4r ++559r +1,575 Total supply 857,792r 850,013r 774,549r 797,912r 898,445 Statistical difference (3) +3,362r +1,949r -3,846r +779r +1,476 Total demand 854,430r 848,064r 778,395r 797,132r 896,970 Transformation 239,631r 230,170 243,468r 238,025r 324,197 Electricity generation 216,543 205,869 217,837r 212,632r 298,077
Major power producers 184,307 175,210 189,919 185,955 271,563 Autogenerators 32,236 30,659 27,918r 26,678r 26,514
Heat generation 23,089r 24,302 25,631 25,393r 26,120 Other - - - - - Energy industry use 56,236r 53,219r 52,470r 58,645r 57,773 Electricity generation - - - - - Oil and gas extraction 48,461 46,000r 45,391 51,024r 50,079 Petroleum refineries 1,522r 1,151r 1,201r 1,201r 1,079 Coal extraction 194 60r 100r 79r 61 Coke manufacture - - - - - Blast furnaces 266 363 338 323 291 Other 5,793 5,645 5,440r 6,018r 6,263
Losses (4) 7,891r 7,473 6,856r 6,469r 5,396 Final consumption 550,672r 557,201r 475,601r 493,994r 509,605 Industry 102,594r 105,015r 100,636r 99,211r 98,006 Unclassified 18 15 13 11 9 Iron and steel 5,091 5,338 5,454 5,374 4,155 Non-ferrous metals 2,240r 2,180r 2,073r 1,832r 1,879 Mineral products 10,892r 11,125r 11,105r 11,156r 11,711 Chemicals 20,805r 21,676r 19,558r 19,524r 19,612 Mechanical engineering etc 6,536r 6,194r 5,938r 6,054r 6,079 Electrical engineering etc 2,783r 2,812r 2,779r 3,093r 3,402 Vehicles 7,906r 8,480r 8,321r 8,695r 9,109 Food, beverages etc 20,863r 21,096r 20,395r 19,613r 19,817 Textiles, leather etc 4,733r 4,757r 4,579r 4,467r 4,139 Paper, printing etc 10,231r 11,134r 10,441r 9,517r 8,330 Other industries 7,571r 7,171r 7,022r 6,745r 6,534 Construction 2,925r 3,037r 2,957r 3,126r 3,231 Transport - - - - - Road (5) - - - - - Other 442,308r 446,589r 369,535r 389,516r 406,490 Domestic 343,180r 344,501r 283,691r 297,582r 311,375 Public administration 41,323r 42,251r 34,972r 36,545r 37,246 Commercial 45,331r 47,276r 40,189r 44,097r 46,459 Agriculture 1,162 1,096 1,073r 983r 946 Miscellaneous 11,311r 11,465r 9,609r 10,310r 10,464 Non energy use 5,771 5,598 5,430 5,267 5,109
(1) Colliery methane figures included within these totals are as follows:
2012 2013 2014 2015 2016Total production 530r 433r 391r 354r 443 Electricity generation 414r 418r 378r 343r 434 Coal extraction 98 - - - - Other industries 18 15 13 11r 9 Total consumption 530r 433r 391r 354r 443
(2) Stock fall (+), stock rise (-).(3) Total supply minus total demand.(4) Refers to downstream losses. For an explanation of what is included under these losses, see paragraph 4.40.(5) A small amount of natural gas is consumed by road transport, but gas use in this sector is predominantly of petroleum gas, hence road use of gas is reported in the petroleum products balances in Chapter 3.
106
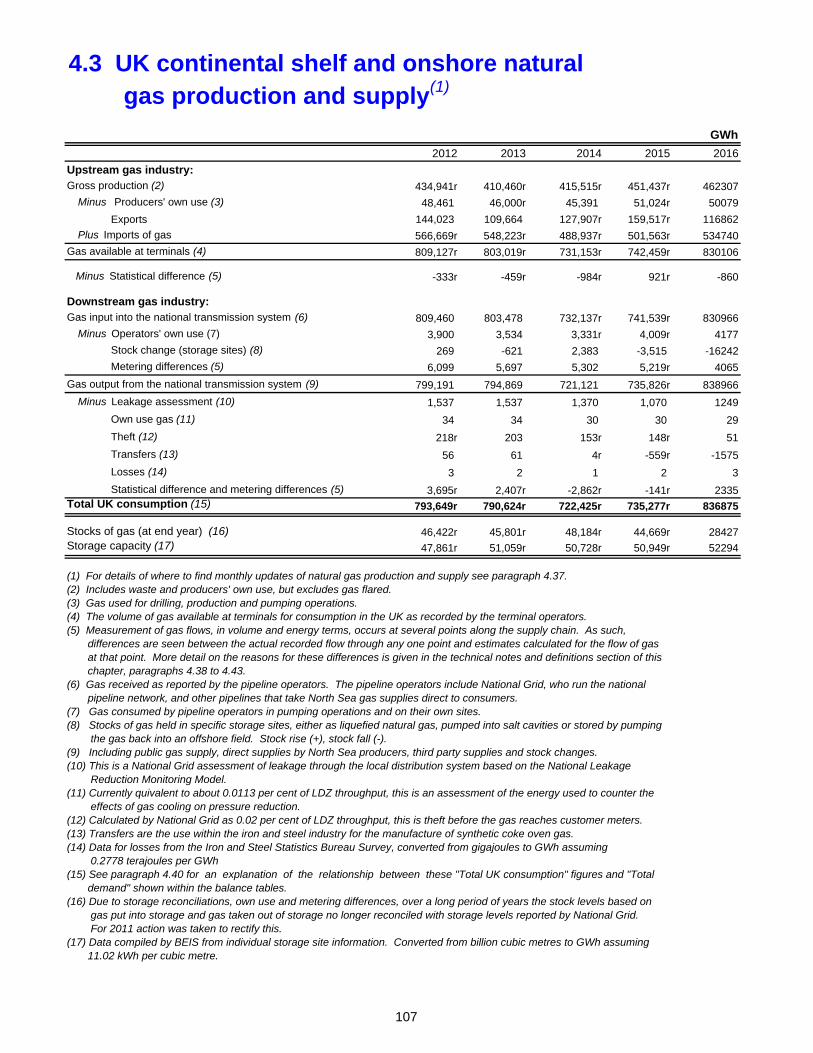
4.3 UK continental shelf and onshore natural gas production and supply(1)
GWh
2012 2013 2014 2015 2016
Upstream gas industry:Gross production (2) 434,941r 410,460r 415,515r 451,437r 462307
Minus Producers' own use (3) 48,461 46,000r 45,391 51,024r 50079
Exports 144,023 109,664 127,907r 159,517r 116862
Plus Imports of gas 566,669r 548,223r 488,937r 501,563r 534740
Gas available at terminals (4) 809,127r 803,019r 731,153r 742,459r 830106
Minus Statistical difference (5) -333r -459r -984r 921r -860
Downstream gas industry:Gas input into the national transmission system (6) 809,460 803,478 732,137r 741,539r 830966
Minus Operators' own use (7) 3,900 3,534 3,331r 4,009r 4177
Stock change (storage sites) (8) 269 -621 2,383 -3,515 -16242
Metering differences (5) 6,099 5,697 5,302 5,219r 4065
Gas output from the national transmission system (9) 799,191 794,869 721,121 735,826r 838966
Minus Leakage assessment (10) 1,537 1,537 1,370 1,070 1249
Own use gas (11) 34 34 30 30 29
Theft (12) 218r 203 153r 148r 51
Transfers (13) 56 61 4r -559r -1575
Losses (14) 3 2 1 2 3
Statistical difference and metering differences (5) 3,695r 2,407r -2,862r -141r 2335Total UK consumption (15) 793,649r 790,624r 722,425r 735,277r 836875
Stocks of gas (at end year) (16) 46,422r 45,801r 48,184r 44,669r 28427Storage capacity (17) 47,861r 51,059r 50,728r 50,949r 52294
(1) For details of where to find monthly updates of natural gas production and supply see paragraph 4.37.(2) Includes waste and producers' own use, but excludes gas flared.(3) Gas used for drilling, production and pumping operations.(4) The volume of gas available at terminals for consumption in the UK as recorded by the terminal operators.(5) Measurement of gas flows, in volume and energy terms, occurs at several points along the supply chain. As such, differences are seen between the actual recorded flow through any one point and estimates calculated for the flow of gas at that point. More detail on the reasons for these differences is given in the technical notes and definitions section of this chapter, paragraphs 4.38 to 4.43.(6) Gas received as reported by the pipeline operators. The pipeline operators include National Grid, who run the national pipeline network, and other pipelines that take North Sea gas supplies direct to consumers.(7) Gas consumed by pipeline operators in pumping operations and on their own sites. (8) Stocks of gas held in specific storage sites, either as liquefied natural gas, pumped into salt cavities or stored by pumping the gas back into an offshore field. Stock rise (+), stock fall (-).(9) Including public gas supply, direct supplies by North Sea producers, third party supplies and stock changes.(10) This is a National Grid assessment of leakage through the local distribution system based on the National Leakage Reduction Monitoring Model. (11) Currently quivalent to about 0.0113 per cent of LDZ throughput, this is an assessment of the energy used to counter the effects of gas cooling on pressure reduction.(12) Calculated by National Grid as 0.02 per cent of LDZ throughput, this is theft before the gas reaches customer meters.(13) Transfers are the use within the iron and steel industry for the manufacture of synthetic coke oven gas.(14) Data for losses from the Iron and Steel Statistics Bureau Survey, converted from gigajoules to GWh assuming 0.2778 terajoules per GWh(15) See paragraph 4.40 for an explanation of the relationship between these "Total UK consumption" figures and "Total demand" shown within the balance tables.(16) Due to storage reconciliations, own use and metering differences, over a long period of years the stock levels based on gas put into storage and gas taken out of storage no longer reconciled with storage levels reported by National Grid. For 2011 action was taken to rectify this.(17) Data compiled by BEIS from individual storage site information. Converted from billion cubic metres to GWh assuming 11.02 kWh per cubic metre.
107
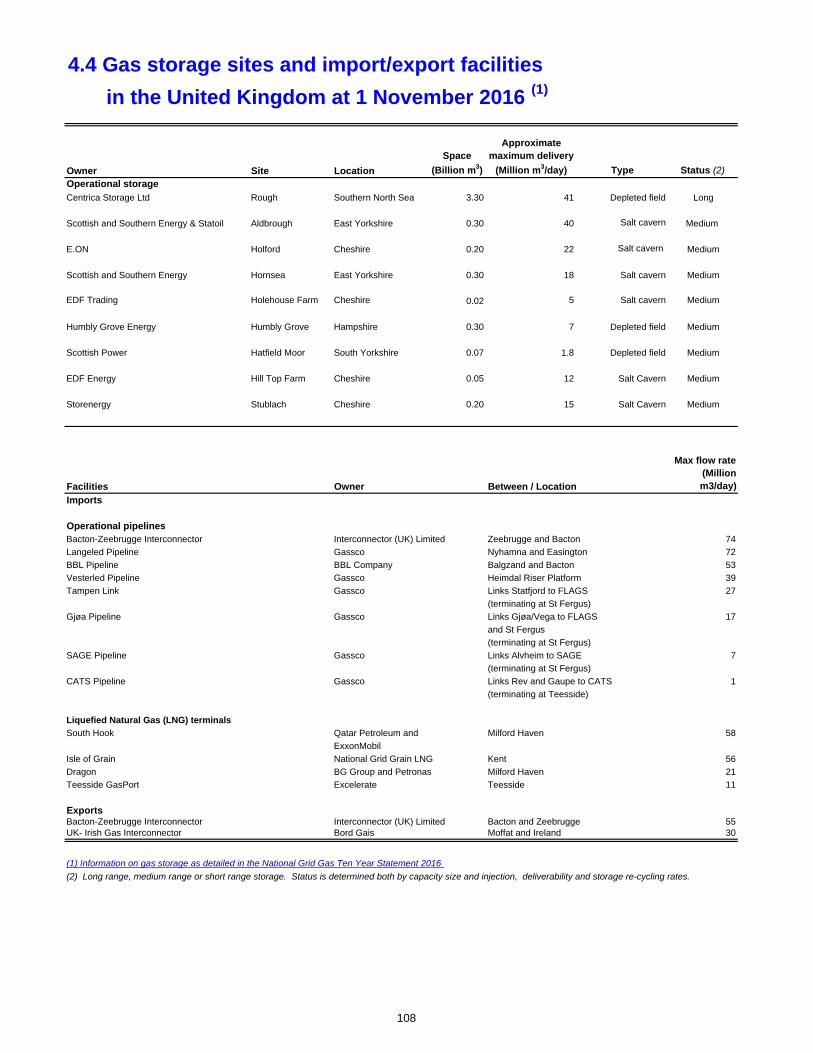
4.4 Gas storage sites and import/export facilities
Owner Site Location
Space
(Billion m3)
Approximate maximum delivery
(Million m3/day) Type Status (2)Operational storageCentrica Storage Ltd Rough Southern North Sea 3.30 41 Depleted field Long
Scottish and Southern Energy & Statoil Aldbrough East Yorkshire 0.30 40 Salt cavern Medium
E.ON Holford Cheshire 0.20 22 Salt cavern Medium
Scottish and Southern Energy Hornsea East Yorkshire 0.30 18 Salt cavern Medium
EDF Trading Holehouse Farm Cheshire 0.02 5 Salt cavern Medium
Humbly Grove Energy Humbly Grove Hampshire 0.30 7 Depleted field Medium
Scottish Power Hatfield Moor South Yorkshire 0.07 1.8 Depleted field Medium
EDF Energy Hill Top Farm Cheshire 0.05 12 Salt Cavern Medium
Storenergy Stublach Cheshire 0.20 15 Salt Cavern Medium
Facilities Owner Between / Location
Max flow rate (Million m3/day)
Imports
Operational pipelinesBacton-Zeebrugge Interconnector Interconnector (UK) Limited Zeebrugge and Bacton 74
Langeled Pipeline Gassco Nyhamna and Easington 72
BBL Pipeline BBL Company Balgzand and Bacton 53
Vesterled Pipeline Gassco Heimdal Riser Platform 39
Tampen Link Gassco Links Statfjord to FLAGS 27
(terminating at St Fergus)
Gjøa Pipeline Gassco Links Gjøa/Vega to FLAGS 17
and St Fergus
(terminating at St Fergus)
SAGE Pipeline Gassco Links Alvheim to SAGE 7
(terminating at St Fergus)
CATS Pipeline Gassco Links Rev and Gaupe to CATS 1
(terminating at Teesside)
Liquefied Natural Gas (LNG) terminals
South Hook Qatar Petroleum and Milford Haven 58
ExxonMobil
Isle of Grain National Grid Grain LNG Kent 56
Dragon BG Group and Petronas Milford Haven 21
Teesside GasPort Excelerate Teesside 11
ExportsBacton-Zeebrugge Interconnector Interconnector (UK) Limited Bacton and Zeebrugge 55UK- Irish Gas Interconnector Bord Gais Moffat and Ireland 30
(1) Information on gas storage as detailed in the National Grid Gas Ten Year Statement 2016
in the United Kingdom at 1 November 2016 (1)
(2) Long range, medium range or short range storage. Status is determined both by capacity size and injection, deliverability and storage re-cycling rates.
108

4.5 Natural gas imports and exports (1)
GWh
2012 2013 2014 2015 2016
Imports
by pipelines from:Belgium (2) 14,264 35,367 3,949 2,116 15,414 The Netherlands (3) 78,258 81,519 70,293 35,933 47,444
Norway (4) 311,736r 318,634r 278,818r 307,943r 347,005 Liquefied Natural Gas (5) 150,098 102,620 123,910 152,406 122,310
of which: - - - - - Algeria 1,312 4,492 5,774 4,807 4,776 Australia - - - - - Belgium 1,117 Egypt 145 755 - - 120 Nigeria 475 - 534 436 434 Norway 1,735 1,068 - 601 2,649 Qatar 146,431 95,204 113,597 141,549 112,012 Trinidad & Tobago - 1,101 4,004 5,013 1,202 USA - - - - - Yemen - - - - -
Total Imports 554,356r 538,140r 476,969r 498,398r 532,173
Exports to:
Belgium (2) 50,343 27,458 48,074 84,465 67,189
The Netherlands (6) 23,729 18,597 18,852 20,789 18,302
Norway (7) 49 20 9 3 1
Republic of Ireland (8) 56,764r 52,257r 47,737r 46,898r 21,943
Isle of Man (9) 825r 1,251r 1,267r 1,192r 1,349
Liquefied Natural Gas (10) - - - 3,005r 5,511
Total Exports 131,711 99,582 115,938 156,353r 114,294
Net Imports (11) 422,645r 438,558r 361,030r 342,045r 417,879
(1) This table is also shown as Table G.5 of the Internet Annex G to the Digest.
(2) Physical flows of gas through the Bacton-Zeebrugge Interconnector. In tables 4.1 to 4.3 the commercial flows of gas through the pipeline are used. Commercial flows are the amounts of gas that companies requested be supplied through the pipeline. Net imports are the same whichever measurement is used.
(3) Physical flows via the Bacton-Balgzand (BBL) pipeline. Commissioned in November 2006.
(4) Currently via the Langeled and Vesterled pipelines, the Tampen Link (from Statfjord to FLAGS), Gjoa/Vega (to FLAGS), SAGE pipline to St Fergus and CATS pipeline to Teesside.
(5) From various sources to the Isle of Grain, Milford Haven and Teesside.
(6) Direct exports from the Grove, Kew, Chiswick, Markham, Minke, Stamford, Windermere and Wingate offshore gas fields using the Dutch offshore gas pipeline infrastructure.
(7) With effect from September 2007, UK gas from the Blane field to the Norwegian Ula field for injection into the Ula reservoir.
(8) Includes gas to the Isle of Man up until 2004 and then seperately identified.
(9) Gas to Isle of Man seperately identified from exports to the Republic of Ireland from 2005 onwards.
(10) To various sources such as Brazil, United Arab Emirates and Pakistan.(11) A negative figure means the UK was a net exporter of gas.
109

4.6 Liquefied Natural Gas imports by terminal
GWh
2012 2013 2014 2015 2016
LNG Imports via:
Dragon (Milford Haven) (1) 1,819 968 3,326 8,014 4,079 Isle of Grain (Isle of Grain ) (2) 38,196 15,664 13,808r 14,224r 22,152 South Hook (Milford Haven ) (3) 110,082 85,989 106,776 130,169 96,079 Teesside GasPort (Teesside ) (4) - - - - -
150,097 102,620 123,910r 152,406r 122,310
(1) Dragon began importing LNG to the UK in August 2009.
(2) LNG imports at Canvey Island commenced in 1965 but ceased in the early 1980's when, with increasing supplies from the North Sea, imports were no longer required. UK natural gas production peaked in 2000 and as a result of falling production LNG imports recommenced at the Isle of Grain in 2005.
(3) South Hook began importing LNG to the UK in April 2009.
(4) Teesside GasPort was commissioned in February 2007.
110