chapter 4: national examinations€¦ · chapter 4: national examinations 45 chapter 4: national...
TRANSCRIPT
Chapter 4: NATIONAL EXAMINATIONS 45
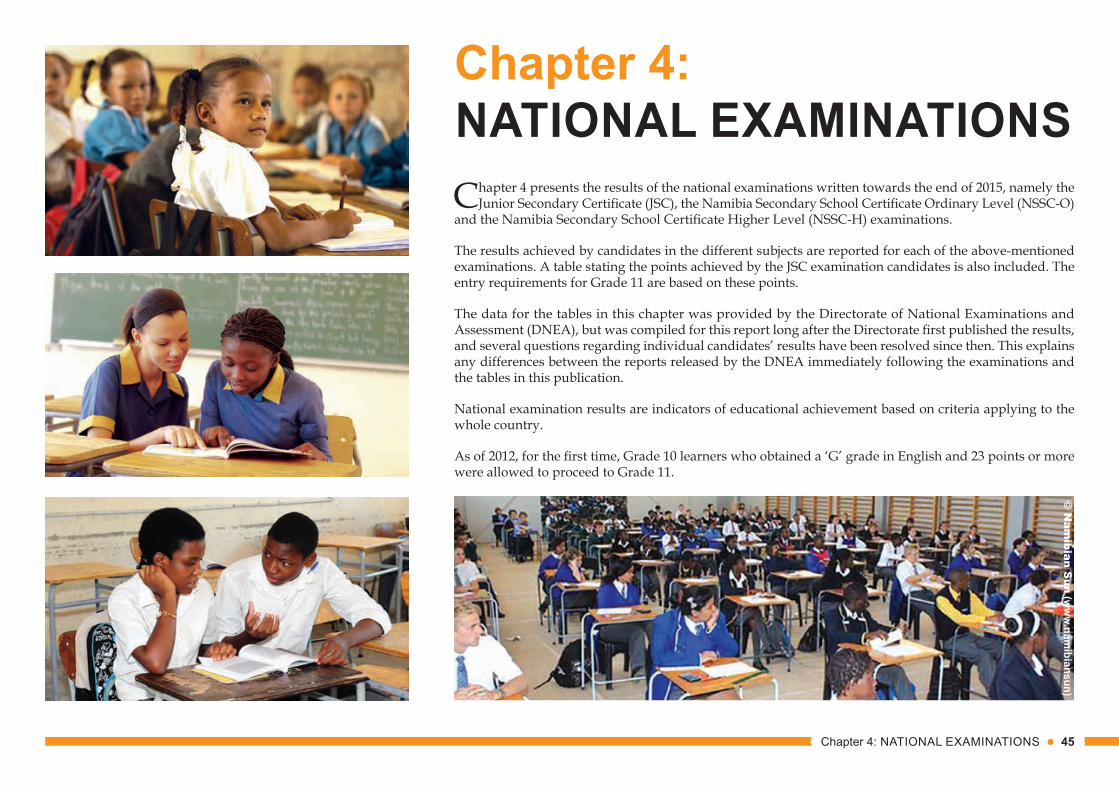
Chapter 4: NATIONAL EXAMINATIONSChapter 4 presents the results of the national examinations written towards the end of 2015, namely the
Junior Secondary Certificate (JSC), the Namibia Secondary School Certificate Ordinary Level (NSSC-O) and the Namibia Secondary School Certificate Higher Level (NSSC-H) examinations.
The results achieved by candidates in the different subjects are reported for each of the above-mentioned examinations. A table stating the points achieved by the JSC examination candidates is also included. The entry requirements for Grade 11 are based on these points.
The data for the tables in this chapter was provided by the Directorate of National Examinations and Assessment (DNEA), but was compiled for this report long after the Directorate first published the results, and several questions regarding individual candidates’ results have been resolved since then. This explains any differences between the reports released by the DNEA immediately following the examinations and the tables in this publication.
National examination results are indicators of educational achievement based on criteria applying to the whole country.
As of 2012, for the first time, Grade 10 learners who obtained a ‘G’ grade in English and 23 points or more were allowed to proceed to Grade 11.
© N
amibian S
un (ww
w.nam
ibiansun)
46 EMIS Education Statistics 2015
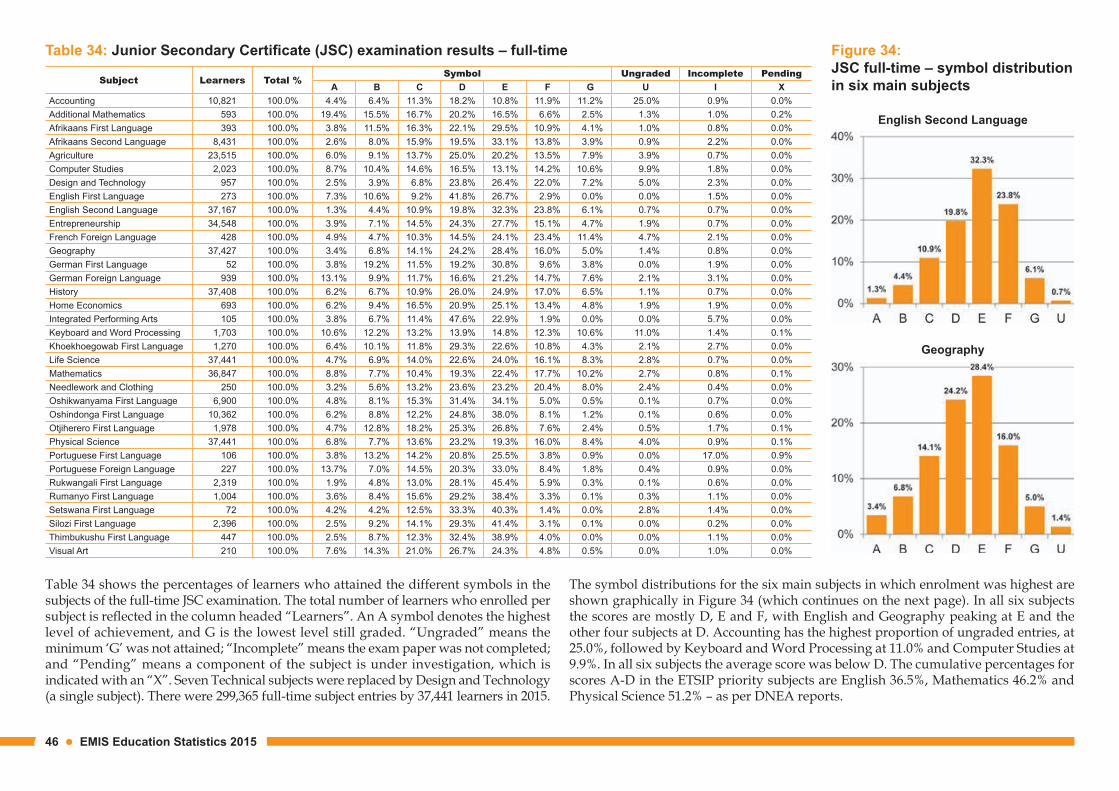
Table 34: Junior Secondary Certificate (JSC) examination results – full-time
Table 34 shows the percentages of learners who attained the different symbols in the subjects of the full-time JSC examination. The total number of learners who enrolled per subject is reflected in the column headed “Learners”. An A symbol denotes the highest level of achievement, and G is the lowest level still graded. “Ungraded” means the minimum ‘G’ was not attained; “Incomplete” means the exam paper was not completed; and “Pending” means a component of the subject is under investigation, which is indicated with an “X”. Seven Technical subjects were replaced by Design and Technology (a single subject). There were 299,365 full-time subject entries by 37,441 learners in 2015.
The symbol distributions for the six main subjects in which enrolment was highest are shown graphically in Figure 34 (which continues on the next page). In all six subjects the scores are mostly D, E and F, with English and Geography peaking at E and the other four subjects at D. Accounting has the highest proportion of ungraded entries, at 25.0%, followed by Keyboard and Word Processing at 11.0% and Computer Studies at 9.9%. In all six subjects the average score was below D. The cumulative percentages for scores A-D in the ETSIP priority subjects are English 36.5%, Mathematics 46.2% and Physical Science 51.2% – as per DNEA reports.
Figure 34: JSC full-time – symbol distribution in six main subjects
English Second Language
Geography
Subject Learners Total % Symbol Ungraded Incomplete Pending
A B C D E F G U I XAccounting 10,821 100.0% 4.4% 6.4% 11.3% 18.2% 10.8% 11.9% 11.2% 25.0% 0.9% 0.0%Additional Mathematics 593 100.0% 19.4% 15.5% 16.7% 20.2% 16.5% 6.6% 2.5% 1.3% 1.0% 0.2%Afrikaans First Language 393 100.0% 3.8% 11.5% 16.3% 22.1% 29.5% 10.9% 4.1% 1.0% 0.8% 0.0%Afrikaans Second Language 8,431 100.0% 2.6% 8.0% 15.9% 19.5% 33.1% 13.8% 3.9% 0.9% 2.2% 0.0%Agriculture 23,515 100.0% 6.0% 9.1% 13.7% 25.0% 20.2% 13.5% 7.9% 3.9% 0.7% 0.0%Computer Studies 2,023 100.0% 8.7% 10.4% 14.6% 16.5% 13.1% 14.2% 10.6% 9.9% 1.8% 0.0%Design and Technology 957 100.0% 2.5% 3.9% 6.8% 23.8% 26.4% 22.0% 7.2% 5.0% 2.3% 0.0%English First Language 273 100.0% 7.3% 10.6% 9.2% 41.8% 26.7% 2.9% 0.0% 0.0% 1.5% 0.0%English Second Language 37,167 100.0% 1.3% 4.4% 10.9% 19.8% 32.3% 23.8% 6.1% 0.7% 0.7% 0.0%Entrepreneurship 34,548 100.0% 3.9% 7.1% 14.5% 24.3% 27.7% 15.1% 4.7% 1.9% 0.7% 0.0%French Foreign Language 428 100.0% 4.9% 4.7% 10.3% 14.5% 24.1% 23.4% 11.4% 4.7% 2.1% 0.0%Geography 37,427 100.0% 3.4% 6.8% 14.1% 24.2% 28.4% 16.0% 5.0% 1.4% 0.8% 0.0%German First Language 52 100.0% 3.8% 19.2% 11.5% 19.2% 30.8% 9.6% 3.8% 0.0% 1.9% 0.0%German Foreign Language 939 100.0% 13.1% 9.9% 11.7% 16.6% 21.2% 14.7% 7.6% 2.1% 3.1% 0.0%History 37,408 100.0% 6.2% 6.7% 10.9% 26.0% 24.9% 17.0% 6.5% 1.1% 0.7% 0.0%Home Economics 693 100.0% 6.2% 9.4% 16.5% 20.9% 25.1% 13.4% 4.8% 1.9% 1.9% 0.0%Integrated Performing Arts 105 100.0% 3.8% 6.7% 11.4% 47.6% 22.9% 1.9% 0.0% 0.0% 5.7% 0.0%Keyboard and Word Processing 1,703 100.0% 10.6% 12.2% 13.2% 13.9% 14.8% 12.3% 10.6% 11.0% 1.4% 0.1%Khoekhoegowab First Language 1,270 100.0% 6.4% 10.1% 11.8% 29.3% 22.6% 10.8% 4.3% 2.1% 2.7% 0.0%Life Science 37,441 100.0% 4.7% 6.9% 14.0% 22.6% 24.0% 16.1% 8.3% 2.8% 0.7% 0.0%Mathematics 36,847 100.0% 8.8% 7.7% 10.4% 19.3% 22.4% 17.7% 10.2% 2.7% 0.8% 0.1%Needlework and Clothing 250 100.0% 3.2% 5.6% 13.2% 23.6% 23.2% 20.4% 8.0% 2.4% 0.4% 0.0%Oshikwanyama First Language 6,900 100.0% 4.8% 8.1% 15.3% 31.4% 34.1% 5.0% 0.5% 0.1% 0.7% 0.0%Oshindonga First Language 10,362 100.0% 6.2% 8.8% 12.2% 24.8% 38.0% 8.1% 1.2% 0.1% 0.6% 0.0%Otjiherero First Language 1,978 100.0% 4.7% 12.8% 18.2% 25.3% 26.8% 7.6% 2.4% 0.5% 1.7% 0.1%Physical Science 37,441 100.0% 6.8% 7.7% 13.6% 23.2% 19.3% 16.0% 8.4% 4.0% 0.9% 0.1%Portuguese First Language 106 100.0% 3.8% 13.2% 14.2% 20.8% 25.5% 3.8% 0.9% 0.0% 17.0% 0.9%Portuguese Foreign Language 227 100.0% 13.7% 7.0% 14.5% 20.3% 33.0% 8.4% 1.8% 0.4% 0.9% 0.0%Rukwangali First Language 2,319 100.0% 1.9% 4.8% 13.0% 28.1% 45.4% 5.9% 0.3% 0.1% 0.6% 0.0%Rumanyo First Language 1,004 100.0% 3.6% 8.4% 15.6% 29.2% 38.4% 3.3% 0.1% 0.3% 1.1% 0.0%Setswana First Language 72 100.0% 4.2% 4.2% 12.5% 33.3% 40.3% 1.4% 0.0% 2.8% 1.4% 0.0%Silozi First Language 2,396 100.0% 2.5% 9.2% 14.1% 29.3% 41.4% 3.1% 0.1% 0.0% 0.2% 0.0%Thimbukushu First Language 447 100.0% 2.5% 8.7% 12.3% 32.4% 38.9% 4.0% 0.0% 0.0% 1.1% 0.0%Visual Art 210 100.0% 7.6% 14.3% 21.0% 26.7% 24.3% 4.8% 0.5% 0.0% 1.0% 0.0%
Chapter 4: NATIONAL EXAMINATIONS 47
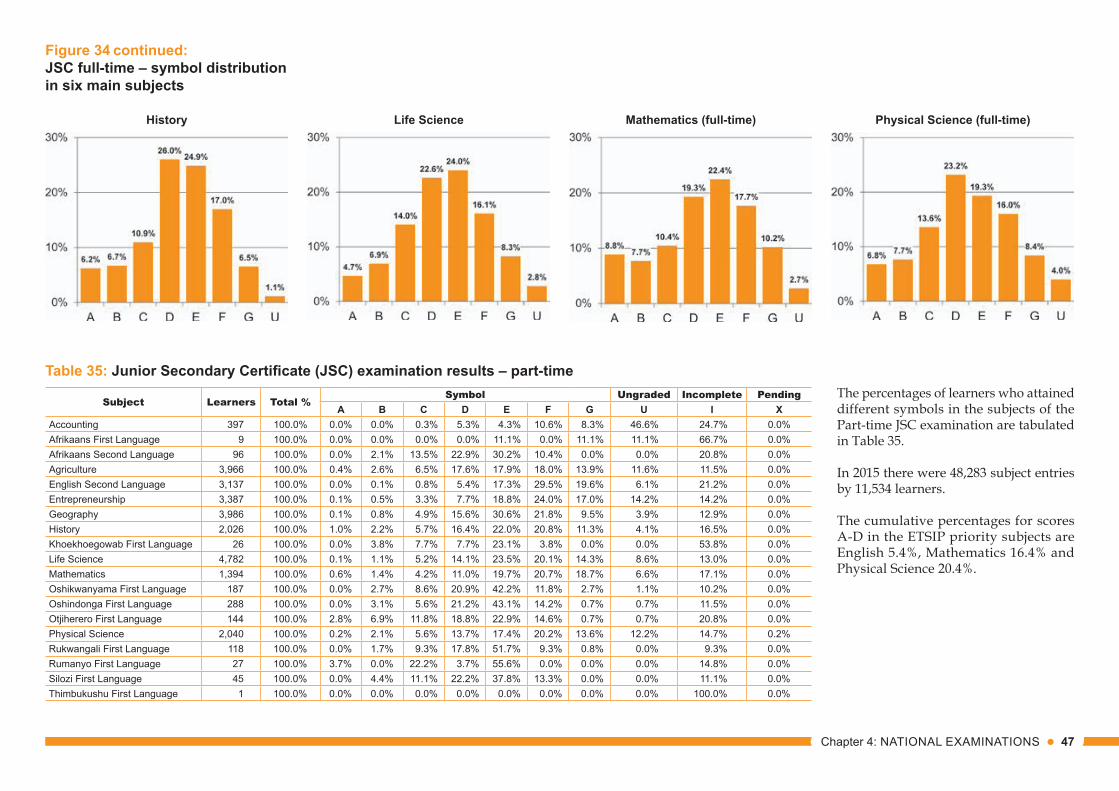
Table 35: Junior Secondary Certificate (JSC) examination results – part-time
Figure 34 continued: JSC full-time – symbol distribution in six main subjects
History Life Science Mathematics (full-time) Physical Science (full-time)
The percentages of learners who attained different symbols in the subjects of the Part-time JSC examination are tabulated in Table 35.
In 2015 there were 48,283 subject entries by 11,534 learners.
The cumulative percentages for scores A-D in the ETSIP priority subjects are English 5.4%, Mathematics 16.4% and Physical Science 20.4%.
Subject Learners Total % Symbol Ungraded Incomplete Pending
A B C D E F G U I XAccounting 397 100.0% 0.0% 0.0% 0.3% 5.3% 4.3% 10.6% 8.3% 46.6% 24.7% 0.0%Afrikaans First Language 9 100.0% 0.0% 0.0% 0.0% 0.0% 11.1% 0.0% 11.1% 11.1% 66.7% 0.0%Afrikaans Second Language 96 100.0% 0.0% 2.1% 13.5% 22.9% 30.2% 10.4% 0.0% 0.0% 20.8% 0.0%Agriculture 3,966 100.0% 0.4% 2.6% 6.5% 17.6% 17.9% 18.0% 13.9% 11.6% 11.5% 0.0%English Second Language 3,137 100.0% 0.0% 0.1% 0.8% 5.4% 17.3% 29.5% 19.6% 6.1% 21.2% 0.0%Entrepreneurship 3,387 100.0% 0.1% 0.5% 3.3% 7.7% 18.8% 24.0% 17.0% 14.2% 14.2% 0.0%Geography 3,986 100.0% 0.1% 0.8% 4.9% 15.6% 30.6% 21.8% 9.5% 3.9% 12.9% 0.0%History 2,026 100.0% 1.0% 2.2% 5.7% 16.4% 22.0% 20.8% 11.3% 4.1% 16.5% 0.0%Khoekhoegowab First Language 26 100.0% 0.0% 3.8% 7.7% 7.7% 23.1% 3.8% 0.0% 0.0% 53.8% 0.0%Life Science 4,782 100.0% 0.1% 1.1% 5.2% 14.1% 23.5% 20.1% 14.3% 8.6% 13.0% 0.0%Mathematics 1,394 100.0% 0.6% 1.4% 4.2% 11.0% 19.7% 20.7% 18.7% 6.6% 17.1% 0.0%Oshikwanyama First Language 187 100.0% 0.0% 2.7% 8.6% 20.9% 42.2% 11.8% 2.7% 1.1% 10.2% 0.0%Oshindonga First Language 288 100.0% 0.0% 3.1% 5.6% 21.2% 43.1% 14.2% 0.7% 0.7% 11.5% 0.0%Otjiherero First Language 144 100.0% 2.8% 6.9% 11.8% 18.8% 22.9% 14.6% 0.7% 0.7% 20.8% 0.0%Physical Science 2,040 100.0% 0.2% 2.1% 5.6% 13.7% 17.4% 20.2% 13.6% 12.2% 14.7% 0.2%Rukwangali First Language 118 100.0% 0.0% 1.7% 9.3% 17.8% 51.7% 9.3% 0.8% 0.0% 9.3% 0.0%Rumanyo First Language 27 100.0% 3.7% 0.0% 22.2% 3.7% 55.6% 0.0% 0.0% 0.0% 14.8% 0.0%Silozi First Language 45 100.0% 0.0% 4.4% 11.1% 22.2% 37.8% 13.3% 0.0% 0.0% 11.1% 0.0%Thimbukushu First Language 1 100.0% 0.0% 0.0% 0.0% 0.0% 0.0% 0.0% 0.0% 0.0% 100.0% 0.0%
48 EMIS Education Statistics 2015
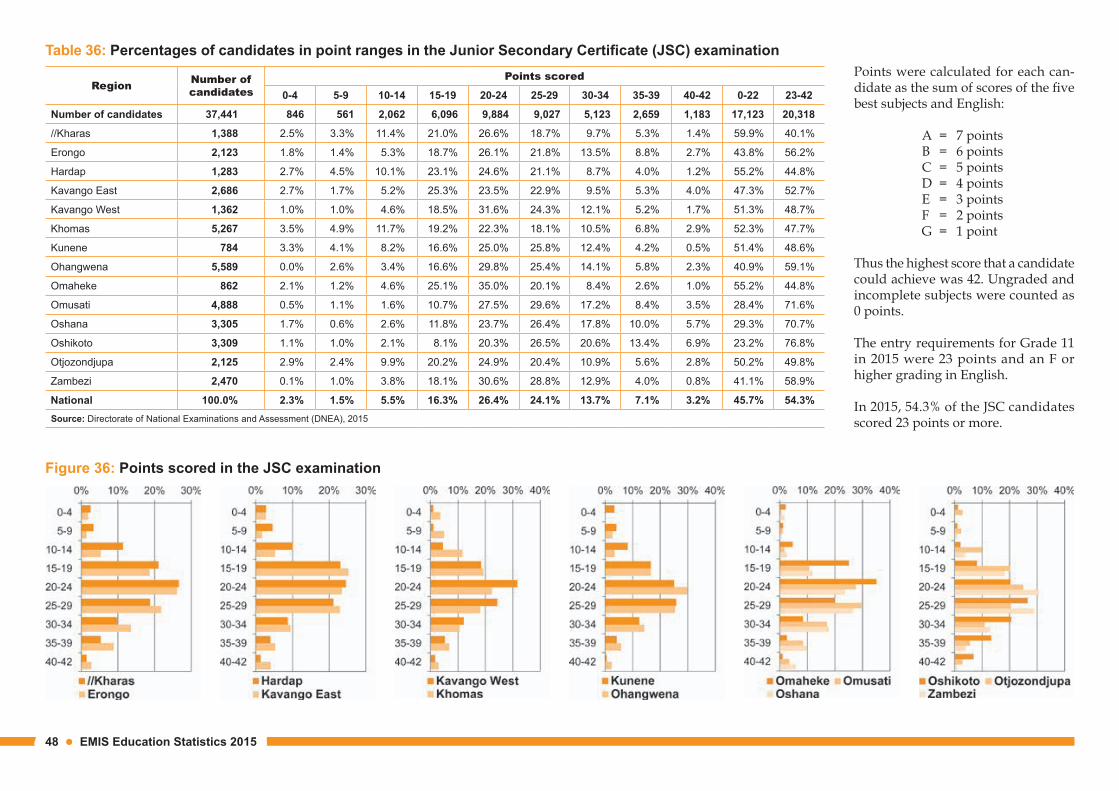
Table 36: Percentages of candidates in point ranges in the Junior Secondary Certificate (JSC) examination
Region Number of candidates
Points scored
0-4 5-9 10-14 15-19 20-24 25-29 30-34 35-39 40-42 0-22 23-42
Number of candidates 37,441 846 561 2,062 6,096 9,884 9,027 5,123 2,659 1,183 17,123 20,318
//Kharas 1,388 2.5% 3.3% 11.4% 21.0% 26.6% 18.7% 9.7% 5.3% 1.4% 59.9% 40.1%
Erongo 2,123 1.8% 1.4% 5.3% 18.7% 26.1% 21.8% 13.5% 8.8% 2.7% 43.8% 56.2%
Hardap 1,283 2.7% 4.5% 10.1% 23.1% 24.6% 21.1% 8.7% 4.0% 1.2% 55.2% 44.8%
Kavango East 2,686 2.7% 1.7% 5.2% 25.3% 23.5% 22.9% 9.5% 5.3% 4.0% 47.3% 52.7%
Kavango West 1,362 1.0% 1.0% 4.6% 18.5% 31.6% 24.3% 12.1% 5.2% 1.7% 51.3% 48.7%
Khomas 5,267 3.5% 4.9% 11.7% 19.2% 22.3% 18.1% 10.5% 6.8% 2.9% 52.3% 47.7%
Kunene 784 3.3% 4.1% 8.2% 16.6% 25.0% 25.8% 12.4% 4.2% 0.5% 51.4% 48.6%
Ohangwena 5,589 0.0% 2.6% 3.4% 16.6% 29.8% 25.4% 14.1% 5.8% 2.3% 40.9% 59.1%
Omaheke 862 2.1% 1.2% 4.6% 25.1% 35.0% 20.1% 8.4% 2.6% 1.0% 55.2% 44.8%
Omusati 4,888 0.5% 1.1% 1.6% 10.7% 27.5% 29.6% 17.2% 8.4% 3.5% 28.4% 71.6%
Oshana 3,305 1.7% 0.6% 2.6% 11.8% 23.7% 26.4% 17.8% 10.0% 5.7% 29.3% 70.7%
Oshikoto 3,309 1.1% 1.0% 2.1% 8.1% 20.3% 26.5% 20.6% 13.4% 6.9% 23.2% 76.8%
Otjozondjupa 2,125 2.9% 2.4% 9.9% 20.2% 24.9% 20.4% 10.9% 5.6% 2.8% 50.2% 49.8%
Zambezi 2,470 0.1% 1.0% 3.8% 18.1% 30.6% 28.8% 12.9% 4.0% 0.8% 41.1% 58.9%
National 100.0% 2.3% 1.5% 5.5% 16.3% 26.4% 24.1% 13.7% 7.1% 3.2% 45.7% 54.3%Source: Directorate of National Examinations and Assessment (DNEA), 2015
Points were calculated for each can-didate as the sum of scores of the five best subjects and English:
A = 7 pointsB = 6 pointsC = 5 pointsD = 4 pointsE = 3 pointsF = 2 pointsG = 1 point
Thus the highest score that a candidate could achieve was 42. Ungraded and incomplete subjects were counted as 0 points.
The entry requirements for Grade 11 in 2015 were 23 points and an F or higher grading in English.
In 2015, 54.3% of the JSC candidates scored 23 points or more.
Figure 36: Points scored in the JSC examination
Chapter 4: NATIONAL EXAMINATIONS 49
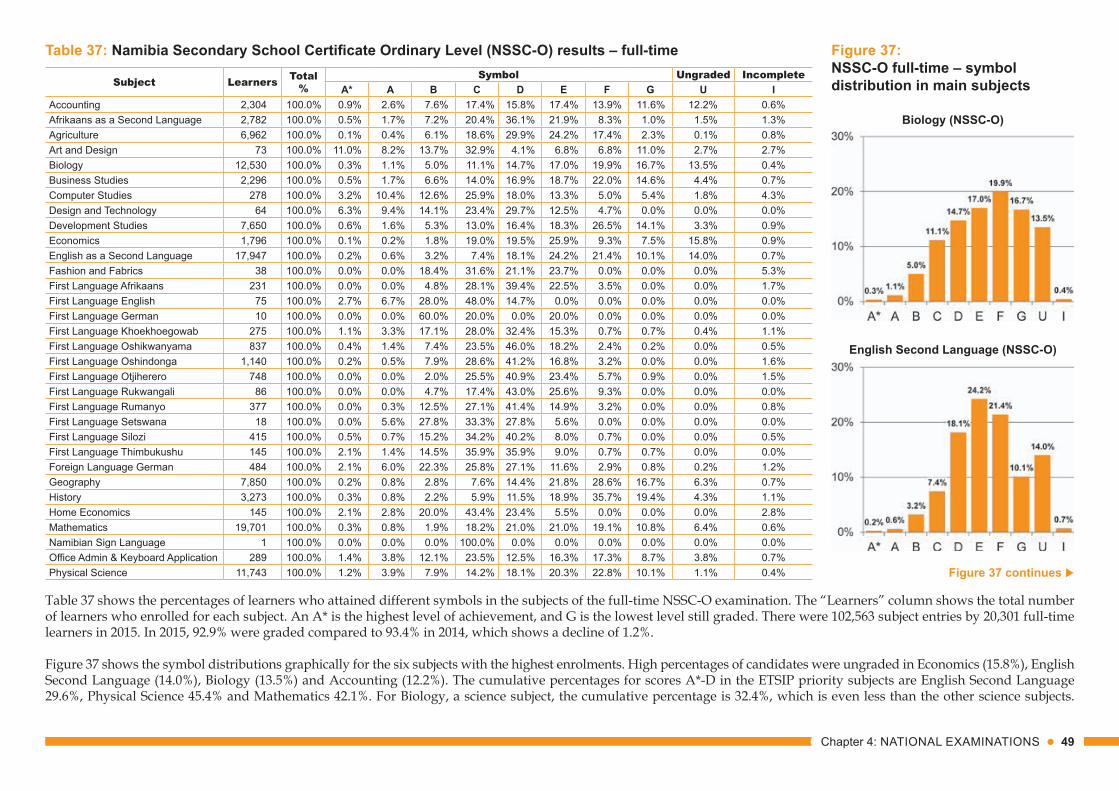
Table 37: Namibia Secondary School Certificate Ordinary Level (NSSC-O) results – full-time
Table 37 shows the percentages of learners who attained different symbols in the subjects of the full-time NSSC-O examination. The “Learners” column shows the total number of learners who enrolled for each subject. An A* is the highest level of achievement, and G is the lowest level still graded. There were 102,563 subject entries by 20,301 full-time learners in 2015. In 2015, 92.9% were graded compared to 93.4% in 2014, which shows a decline of 1.2%.
Figure 37 shows the symbol distributions graphically for the six subjects with the highest enrolments. High percentages of candidates were ungraded in Economics (15.8%), English Second Language (14.0%), Biology (13.5%) and Accounting (12.2%). The cumulative percentages for scores A*-D in the ETSIP priority subjects are English Second Language 29.6%, Physical Science 45.4% and Mathematics 42.1%. For Biology, a science subject, the cumulative percentage is 32.4%, which is even less than the other science subjects.
Figure 37 continues
Figure 37: NSSC-O full-time – symbol distribution in main subjects
Biology (NSSC-O)
English Second Language (NSSC-O)
Subject Learners Total%
Symbol Ungraded IncompleteA* A B C D E F G U I
Accounting 2,304 100.0% 0.9% 2.6% 7.6% 17.4% 15.8% 17.4% 13.9% 11.6% 12.2% 0.6%Afrikaans as a Second Language 2,782 100.0% 0.5% 1.7% 7.2% 20.4% 36.1% 21.9% 8.3% 1.0% 1.5% 1.3%Agriculture 6,962 100.0% 0.1% 0.4% 6.1% 18.6% 29.9% 24.2% 17.4% 2.3% 0.1% 0.8%Art and Design 73 100.0% 11.0% 8.2% 13.7% 32.9% 4.1% 6.8% 6.8% 11.0% 2.7% 2.7%Biology 12,530 100.0% 0.3% 1.1% 5.0% 11.1% 14.7% 17.0% 19.9% 16.7% 13.5% 0.4%Business Studies 2,296 100.0% 0.5% 1.7% 6.6% 14.0% 16.9% 18.7% 22.0% 14.6% 4.4% 0.7%Computer Studies 278 100.0% 3.2% 10.4% 12.6% 25.9% 18.0% 13.3% 5.0% 5.4% 1.8% 4.3%Design and Technology 64 100.0% 6.3% 9.4% 14.1% 23.4% 29.7% 12.5% 4.7% 0.0% 0.0% 0.0%Development Studies 7,650 100.0% 0.6% 1.6% 5.3% 13.0% 16.4% 18.3% 26.5% 14.1% 3.3% 0.9%Economics 1,796 100.0% 0.1% 0.2% 1.8% 19.0% 19.5% 25.9% 9.3% 7.5% 15.8% 0.9%English as a Second Language 17,947 100.0% 0.2% 0.6% 3.2% 7.4% 18.1% 24.2% 21.4% 10.1% 14.0% 0.7%Fashion and Fabrics 38 100.0% 0.0% 0.0% 18.4% 31.6% 21.1% 23.7% 0.0% 0.0% 0.0% 5.3%First Language Afrikaans 231 100.0% 0.0% 0.0% 4.8% 28.1% 39.4% 22.5% 3.5% 0.0% 0.0% 1.7%First Language English 75 100.0% 2.7% 6.7% 28.0% 48.0% 14.7% 0.0% 0.0% 0.0% 0.0% 0.0%First Language German 10 100.0% 0.0% 0.0% 60.0% 20.0% 0.0% 20.0% 0.0% 0.0% 0.0% 0.0%First Language Khoekhoegowab 275 100.0% 1.1% 3.3% 17.1% 28.0% 32.4% 15.3% 0.7% 0.7% 0.4% 1.1%First Language Oshikwanyama 837 100.0% 0.4% 1.4% 7.4% 23.5% 46.0% 18.2% 2.4% 0.2% 0.0% 0.5%First Language Oshindonga 1,140 100.0% 0.2% 0.5% 7.9% 28.6% 41.2% 16.8% 3.2% 0.0% 0.0% 1.6%First Language Otjiherero 748 100.0% 0.0% 0.0% 2.0% 25.5% 40.9% 23.4% 5.7% 0.9% 0.0% 1.5%First Language Rukwangali 86 100.0% 0.0% 0.0% 4.7% 17.4% 43.0% 25.6% 9.3% 0.0% 0.0% 0.0%First Language Rumanyo 377 100.0% 0.0% 0.3% 12.5% 27.1% 41.4% 14.9% 3.2% 0.0% 0.0% 0.8%First Language Setswana 18 100.0% 0.0% 5.6% 27.8% 33.3% 27.8% 5.6% 0.0% 0.0% 0.0% 0.0%First Language Silozi 415 100.0% 0.5% 0.7% 15.2% 34.2% 40.2% 8.0% 0.7% 0.0% 0.0% 0.5%First Language Thimbukushu 145 100.0% 2.1% 1.4% 14.5% 35.9% 35.9% 9.0% 0.7% 0.7% 0.0% 0.0%Foreign Language German 484 100.0% 2.1% 6.0% 22.3% 25.8% 27.1% 11.6% 2.9% 0.8% 0.2% 1.2%Geography 7,850 100.0% 0.2% 0.8% 2.8% 7.6% 14.4% 21.8% 28.6% 16.7% 6.3% 0.7%History 3,273 100.0% 0.3% 0.8% 2.2% 5.9% 11.5% 18.9% 35.7% 19.4% 4.3% 1.1%Home Economics 145 100.0% 2.1% 2.8% 20.0% 43.4% 23.4% 5.5% 0.0% 0.0% 0.0% 2.8%Mathematics 19,701 100.0% 0.3% 0.8% 1.9% 18.2% 21.0% 21.0% 19.1% 10.8% 6.4% 0.6%Namibian Sign Language 1 100.0% 0.0% 0.0% 0.0% 100.0% 0.0% 0.0% 0.0% 0.0% 0.0% 0.0%Office Admin & Keyboard Application 289 100.0% 1.4% 3.8% 12.1% 23.5% 12.5% 16.3% 17.3% 8.7% 3.8% 0.7%Physical Science 11,743 100.0% 1.2% 3.9% 7.9% 14.2% 18.1% 20.3% 22.8% 10.1% 1.1% 0.4%
50 EMIS Education Statistics 2015
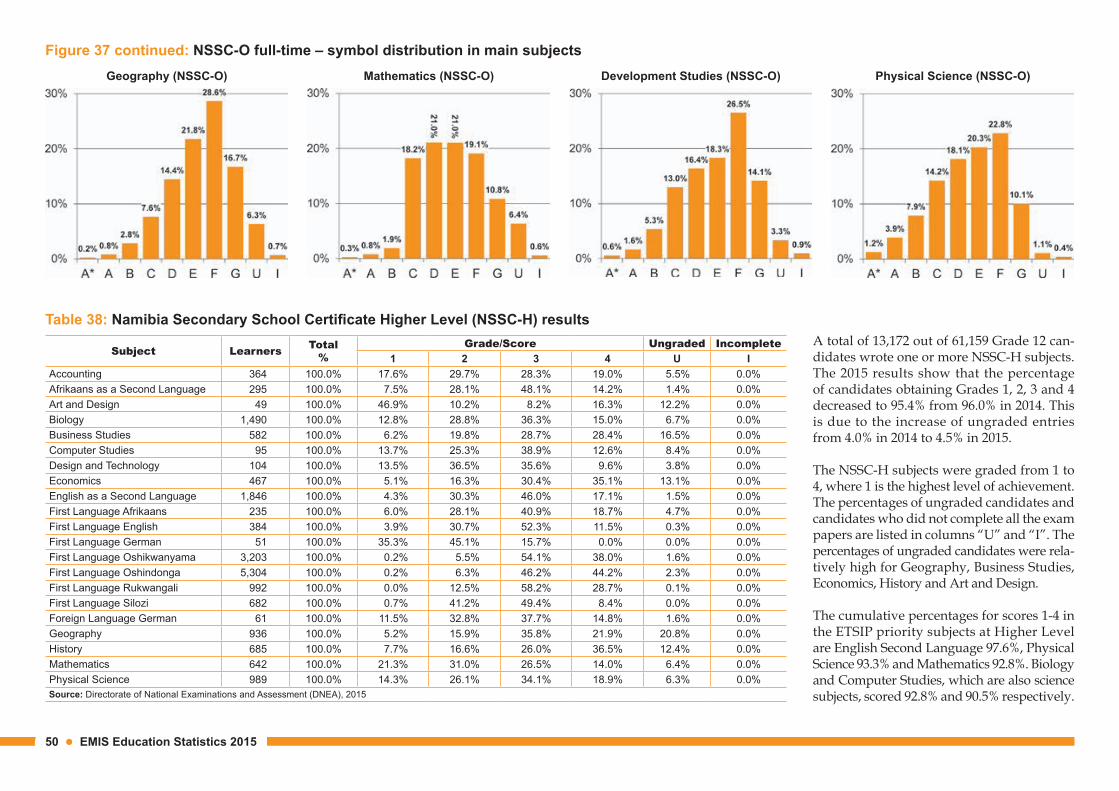
Table 38: Namibia Secondary School Certificate Higher Level (NSSC-H) results
Figure 37 continued: NSSC-O full-time – symbol distribution in main subjectsGeography (NSSC-O) Mathematics (NSSC-O) Development Studies (NSSC-O) Physical Science (NSSC-O)
Subject Learners Total%
Grade/Score Ungraded Incomplete1 2 3 4 U I
Accounting 364 100.0% 17.6% 29.7% 28.3% 19.0% 5.5% 0.0%Afrikaans as a Second Language 295 100.0% 7.5% 28.1% 48.1% 14.2% 1.4% 0.0%Art and Design 49 100.0% 46.9% 10.2% 8.2% 16.3% 12.2% 0.0%Biology 1,490 100.0% 12.8% 28.8% 36.3% 15.0% 6.7% 0.0%Business Studies 582 100.0% 6.2% 19.8% 28.7% 28.4% 16.5% 0.0%Computer Studies 95 100.0% 13.7% 25.3% 38.9% 12.6% 8.4% 0.0%Design and Technology 104 100.0% 13.5% 36.5% 35.6% 9.6% 3.8% 0.0%Economics 467 100.0% 5.1% 16.3% 30.4% 35.1% 13.1% 0.0%English as a Second Language 1,846 100.0% 4.3% 30.3% 46.0% 17.1% 1.5% 0.0%First Language Afrikaans 235 100.0% 6.0% 28.1% 40.9% 18.7% 4.7% 0.0%First Language English 384 100.0% 3.9% 30.7% 52.3% 11.5% 0.3% 0.0%First Language German 51 100.0% 35.3% 45.1% 15.7% 0.0% 0.0% 0.0%First Language Oshikwanyama 3,203 100.0% 0.2% 5.5% 54.1% 38.0% 1.6% 0.0%First Language Oshindonga 5,304 100.0% 0.2% 6.3% 46.2% 44.2% 2.3% 0.0%First Language Rukwangali 992 100.0% 0.0% 12.5% 58.2% 28.7% 0.1% 0.0%First Language Silozi 682 100.0% 0.7% 41.2% 49.4% 8.4% 0.0% 0.0%Foreign Language German 61 100.0% 11.5% 32.8% 37.7% 14.8% 1.6% 0.0%Geography 936 100.0% 5.2% 15.9% 35.8% 21.9% 20.8% 0.0%History 685 100.0% 7.7% 16.6% 26.0% 36.5% 12.4% 0.0%Mathematics 642 100.0% 21.3% 31.0% 26.5% 14.0% 6.4% 0.0%Physical Science 989 100.0% 14.3% 26.1% 34.1% 18.9% 6.3% 0.0%Source: Directorate of National Examinations and Assessment (DNEA), 2015
A total of 13,172 out of 61,159 Grade 12 can-didates wrote one or more NSSC-H subjects. The 2015 results show that the percentage of candidates obtaining Grades 1, 2, 3 and 4 decreased to 95.4% from 96.0% in 2014. This is due to the increase of ungraded entries from 4.0% in 2014 to 4.5% in 2015.
The NSSC-H subjects were graded from 1 to 4, where 1 is the highest level of achievement. The percentages of ungraded candidates and candidates who did not complete all the exam papers are listed in columns “U” and “I”. The percentages of un graded candidates were rela-tively high for Geography, Business Studies, Economics, History and Art and Design.
The cumulative percentages for scores 1-4 in the ETSIP priority subjects at Higher Level are English Second Language 97.6%, Physical Science 93.3% and Mathematics 92.8%. Biology and Computer Studies, which are also science subjects, scored 92.8% and 90.5% respectively.
Chapter 5: TEACHERS 51
Chapter 5: TEACHERSChapter 5 presents statistics on teachers, with the bulk of the information focused on teacher qualifications.
Qualifications are compared across regions, years, phases of schooling, subjects taught and age categories.
Teachers in Namibia obtain their training and qualifications from different education systems. Categorising teacher qualifications is therefore difficult. For the purposes of this publication, teachers are divided into two broad groups: teachers without professional teaching qualification(s); and teachers with formal and specific teacher-training qualifications.
Another dimension of teacher qualifications concerns the levels of academic training. In this report, three categories are used: teachers who have not completed Grade 12; teachers who have completed Grade 12 or up to an additional two years of academic training or tertiary education; and teachers who have more than two years of tertiary education after Grade 12. Teachers reported two components of their qualifications separately in the Annual Education Census (AEC) questionnaires: their academic qualifications excluding professional training; and their professional education. The years of professional education have been taken into account in the qualifications reported in this chapter. A teacher who completed three years of teacher education after Grade 12, for example, is reported as having a professional qualification and more than two years’ tertiary education.
The AEC questionnaire requires teachers to specify the subjects they teach as well as their qualifications for teaching those subjects.
The ratios of learners to teachers are compared in different regions over previous years. Learner : teacher ratios are calculated simply as the numbers of learners in a region or year divided by the total number of teachers in that region or year.
For several purposes, teachers have to be classified according to the school phase in which they are teaching, i.e. whether they are primary or secondary teachers. Where such a classification is required for the AEC, teachers who were teaching primary and secondary grades in combined schools are allocated pro rata to both phases according to the range of grades taught.
A number of teachers permanently leave the education system in a specific year for a variety of reasons, such as retirement, resignation, ill health or death. Transfers are not part of the attrition (teacher turnover) since the teachers remain in the system. The attrition rate among teachers is one focus of this chapter.
52 EMIS Education Statistics 2015
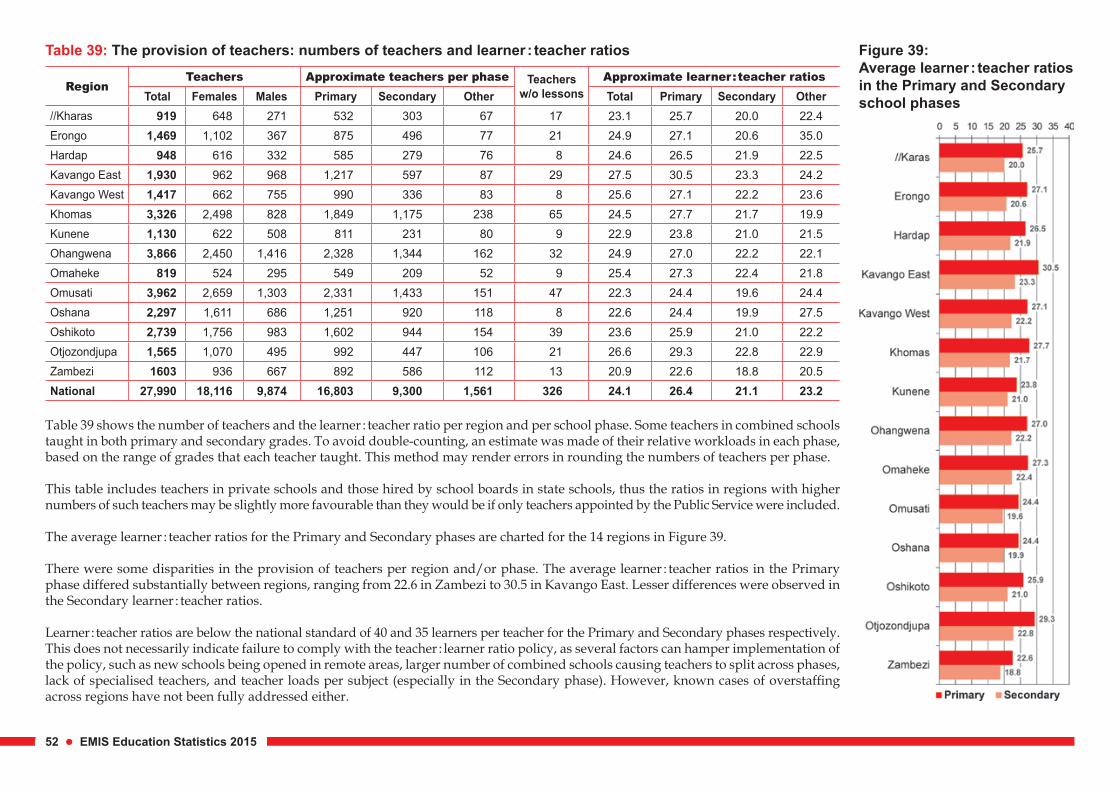
Table 39: The provision of teachers: numbers of teachers and learner : teacher ratios
Table 39 shows the number of teachers and the learner : teacher ratio per region and per school phase. Some teachers in combined schools taught in both primary and secondary grades. To avoid double-counting, an estimate was made of their relative workloads in each phase, based on the range of grades that each teacher taught. This method may render errors in rounding the numbers of teachers per phase.
This table includes teachers in private schools and those hired by school boards in state schools, thus the ratios in regions with higher numbers of such teachers may be slightly more favourable than they would be if only teachers appointed by the Public Service were included. The average learner : teacher ratios for the Primary and Secondary phases are charted for the 14 regions in Figure 39.
There were some disparities in the provision of teachers per region and/or phase. The average learner : teacher ratios in the Primary phase differed substantially between regions, ranging from 22.6 in Zambezi to 30.5 in Kavango East. Lesser differences were observed in the Secondary learner : teacher ratios.
Learner : teacher ratios are below the national standard of 40 and 35 learners per teacher for the Primary and Secondary phases respectively. This does not necessarily indicate failure to comply with the teacher : learner ratio policy, as several factors can hamper implementation of the policy, such as new schools being opened in remote areas, larger number of combined schools causing teachers to split across phases, lack of specialised teachers, and teacher loads per subject (especially in the Secondary phase). However, known cases of overstaffing across regions have not been fully addressed either.
RegionTeachers Approximate teachers per phase Teachers
w/o lessonsApproximate learner : teacher ratios
Total Females Males Primary Secondary Other Total Primary Secondary Other//Kharas 919 648 271 532 303 67 17 23.1 25.7 20.0 22.4Erongo 1,469 1,102 367 875 496 77 21 24.9 27.1 20.6 35.0Hardap 948 616 332 585 279 76 8 24.6 26.5 21.9 22.5Kavango East 1,930 962 968 1,217 597 87 29 27.5 30.5 23.3 24.2Kavango West 1,417 662 755 990 336 83 8 25.6 27.1 22.2 23.6Khomas 3,326 2,498 828 1,849 1,175 238 65 24.5 27.7 21.7 19.9Kunene 1,130 622 508 811 231 80 9 22.9 23.8 21.0 21.5Ohangwena 3,866 2,450 1,416 2,328 1,344 162 32 24.9 27.0 22.2 22.1Omaheke 819 524 295 549 209 52 9 25.4 27.3 22.4 21.8Omusati 3,962 2,659 1,303 2,331 1,433 151 47 22.3 24.4 19.6 24.4Oshana 2,297 1,611 686 1,251 920 118 8 22.6 24.4 19.9 27.5Oshikoto 2,739 1,756 983 1,602 944 154 39 23.6 25.9 21.0 22.2Otjozondjupa 1,565 1,070 495 992 447 106 21 26.6 29.3 22.8 22.9Zambezi 1603 936 667 892 586 112 13 20.9 22.6 18.8 20.5National 27,990 18,116 9,874 16,803 9,300 1,561 326 24.1 26.4 21.1 23.2
Figure 39: Average learner : teacher ratios in the Primary and Secondary school phases
Chapter 5: TEACHERS 53
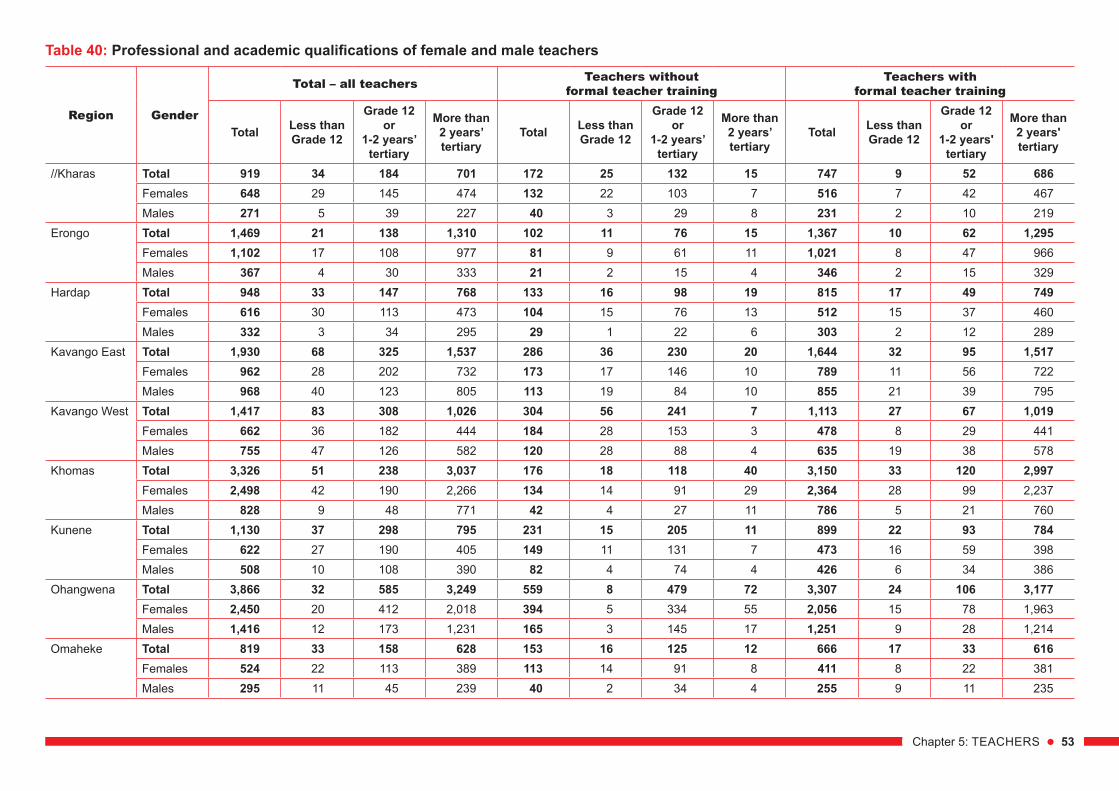
Table 40: Professional and academic qualifications of female and male teachers
Region Gender
Total – all teachers Teachers without formal teacher training
Teachers with formal teacher training
Total Less than Grade 12
Grade 12 or
1-2 years’ tertiary
More than 2 years’ tertiary
Total Less than Grade 12
Grade 12 or
1-2 years’ tertiary
More than 2 years’ tertiary
Total Less than Grade 12
Grade 12 or
1-2 years' tertiary
More than 2 years' tertiary
//Kharas Total 919 34 184 701 172 25 132 15 747 9 52 686Females 648 29 145 474 132 22 103 7 516 7 42 467Males 271 5 39 227 40 3 29 8 231 2 10 219
Erongo Total 1,469 21 138 1,310 102 11 76 15 1,367 10 62 1,295Females 1,102 17 108 977 81 9 61 11 1,021 8 47 966Males 367 4 30 333 21 2 15 4 346 2 15 329
Hardap Total 948 33 147 768 133 16 98 19 815 17 49 749Females 616 30 113 473 104 15 76 13 512 15 37 460Males 332 3 34 295 29 1 22 6 303 2 12 289
Kavango East Total 1,930 68 325 1,537 286 36 230 20 1,644 32 95 1,517Females 962 28 202 732 173 17 146 10 789 11 56 722Males 968 40 123 805 113 19 84 10 855 21 39 795
Kavango West Total 1,417 83 308 1,026 304 56 241 7 1,113 27 67 1,019Females 662 36 182 444 184 28 153 3 478 8 29 441Males 755 47 126 582 120 28 88 4 635 19 38 578
Khomas Total 3,326 51 238 3,037 176 18 118 40 3,150 33 120 2,997Females 2,498 42 190 2,266 134 14 91 29 2,364 28 99 2,237Males 828 9 48 771 42 4 27 11 786 5 21 760
Kunene Total 1,130 37 298 795 231 15 205 11 899 22 93 784Females 622 27 190 405 149 11 131 7 473 16 59 398Males 508 10 108 390 82 4 74 4 426 6 34 386
Ohangwena Total 3,866 32 585 3,249 559 8 479 72 3,307 24 106 3,177Females 2,450 20 412 2,018 394 5 334 55 2,056 15 78 1,963Males 1,416 12 173 1,231 165 3 145 17 1,251 9 28 1,214
Omaheke Total 819 33 158 628 153 16 125 12 666 17 33 616Females 524 22 113 389 113 14 91 8 411 8 22 381Males 295 11 45 239 40 2 34 4 255 9 11 235
54 EMIS Education Statistics 2015
Table 40 is intended to provide the numbers of all teachers according to their qualifications and sex. Qualification profiles of primary and secondary teachers are reported in Tables 41 and 42 respectively. Teachers’ qualifications in the subjects they taught are recorded in Tables 43 and 44.
Teachers were requested in the Annual Education Census to state their academic and professional qualifications. So, for example, a teacher with a three-year tertiary teaching diploma would have indicated Grade 12 as her/his academic qualification and three years of tertiary education as her/his professional qualification. The professional education was combined with the academic qualification in Table 40.
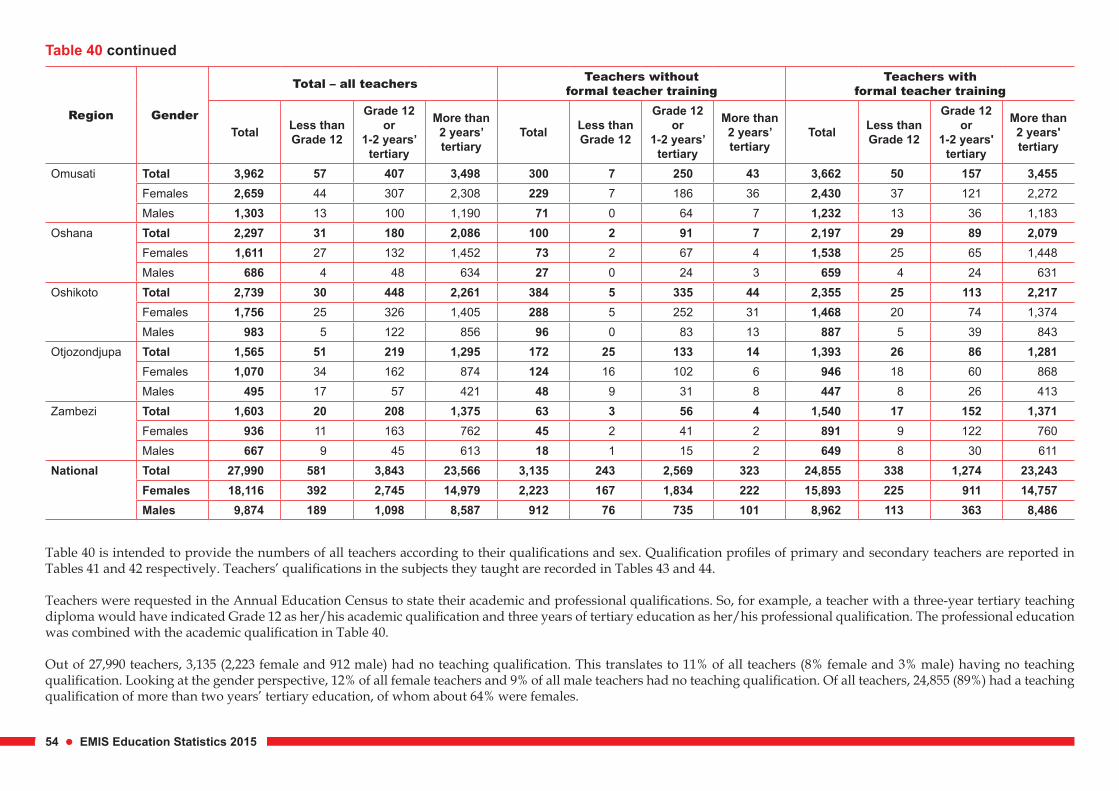
Out of 27,990 teachers, 3,135 (2,223 female and 912 male) had no teaching qualification. This translates to 11% of all teachers (8% female and 3% male) having no teaching qualification. Looking at the gender perspective, 12% of all female teachers and 9% of all male teachers had no teaching qualification. Of all teachers, 24,855 (89%) had a teaching qualification of more than two years’ tertiary education, of whom about 64% were females.
Table 40 continued
Region Gender
Total – all teachers Teachers without formal teacher training
Teachers with formal teacher training
Total Less than Grade 12
Grade 12 or
1-2 years’ tertiary
More than 2 years’ tertiary
Total Less than Grade 12
Grade 12 or
1-2 years’ tertiary
More than 2 years’ tertiary
Total Less than Grade 12
Grade 12 or
1-2 years' tertiary
More than 2 years' tertiary
Omusati Total 3,962 57 407 3,498 300 7 250 43 3,662 50 157 3,455Females 2,659 44 307 2,308 229 7 186 36 2,430 37 121 2,272Males 1,303 13 100 1,190 71 0 64 7 1,232 13 36 1,183
Oshana Total 2,297 31 180 2,086 100 2 91 7 2,197 29 89 2,079Females 1,611 27 132 1,452 73 2 67 4 1,538 25 65 1,448Males 686 4 48 634 27 0 24 3 659 4 24 631
Oshikoto Total 2,739 30 448 2,261 384 5 335 44 2,355 25 113 2,217Females 1,756 25 326 1,405 288 5 252 31 1,468 20 74 1,374Males 983 5 122 856 96 0 83 13 887 5 39 843
Otjozondjupa Total 1,565 51 219 1,295 172 25 133 14 1,393 26 86 1,281Females 1,070 34 162 874 124 16 102 6 946 18 60 868Males 495 17 57 421 48 9 31 8 447 8 26 413
Zambezi Total 1,603 20 208 1,375 63 3 56 4 1,540 17 152 1,371Females 936 11 163 762 45 2 41 2 891 9 122 760Males 667 9 45 613 18 1 15 2 649 8 30 611
National Total 27,990 581 3,843 23,566 3,135 243 2,569 323 24,855 338 1,274 23,243Females 18,116 392 2,745 14,979 2,223 167 1,834 222 15,893 225 911 14,757Males 9,874 189 1,098 8,587 912 76 735 101 8,962 113 363 8,486
Chapter 5: TEACHERS 55
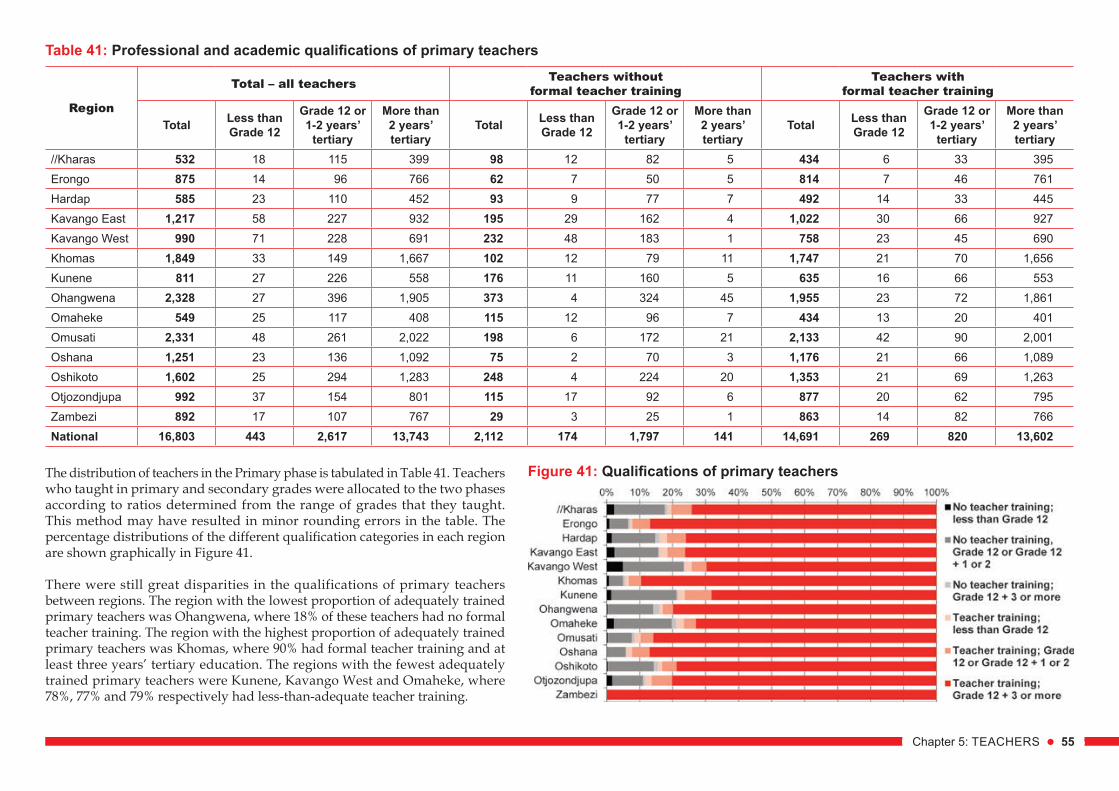
Table 41: Professional and academic qualifications of primary teachers
The distribution of teachers in the Primary phase is tabulated in Table 41. Teachers who taught in primary and secondary grades were allocated to the two phases according to ratios determined from the range of grades that they taught. This method may have resulted in minor rounding errors in the table. The percentage distributions of the different qualification categories in each region are shown graphically in Figure 41.
There were still great disparities in the qualifications of primary teachers between regions. The region with the lowest proportion of adequately trained primary teachers was Ohangwena, where 18% of these teachers had no formal teacher training. The region with the highest proportion of adequately trained primary teachers was Khomas, where 90% had formal teacher training and at least three years’ tertiary education. The regions with the fewest adequately trained primary teachers were Kunene, Kavango West and Omaheke, where 78%, 77% and 79% respectively had less-than-adequate teacher training.
Region
Total – all teachers Teachers without formal teacher training
Teachers with formal teacher training
Total Less than Grade 12
Grade 12 or 1-2 years’
tertiary
More than 2 years’ tertiary
Total Less than Grade 12
Grade 12 or 1-2 years’
tertiary
More than 2 years’ tertiary
Total Less than Grade 12
Grade 12 or 1-2 years’
tertiary
More than 2 years’ tertiary
//Kharas 532 18 115 399 98 12 82 5 434 6 33 395Erongo 875 14 96 766 62 7 50 5 814 7 46 761Hardap 585 23 110 452 93 9 77 7 492 14 33 445Kavango East 1,217 58 227 932 195 29 162 4 1,022 30 66 927Kavango West 990 71 228 691 232 48 183 1 758 23 45 690Khomas 1,849 33 149 1,667 102 12 79 11 1,747 21 70 1,656Kunene 811 27 226 558 176 11 160 5 635 16 66 553Ohangwena 2,328 27 396 1,905 373 4 324 45 1,955 23 72 1,861Omaheke 549 25 117 408 115 12 96 7 434 13 20 401Omusati 2,331 48 261 2,022 198 6 172 21 2,133 42 90 2,001Oshana 1,251 23 136 1,092 75 2 70 3 1,176 21 66 1,089Oshikoto 1,602 25 294 1,283 248 4 224 20 1,353 21 69 1,263Otjozondjupa 992 37 154 801 115 17 92 6 877 20 62 795Zambezi 892 17 107 767 29 3 25 1 863 14 82 766National 16,803 443 2,617 13,743 2,112 174 1,797 141 14,691 269 820 13,602
Figure 41: Qualifications of primary teachers
56 EMIS Education Statistics 2015
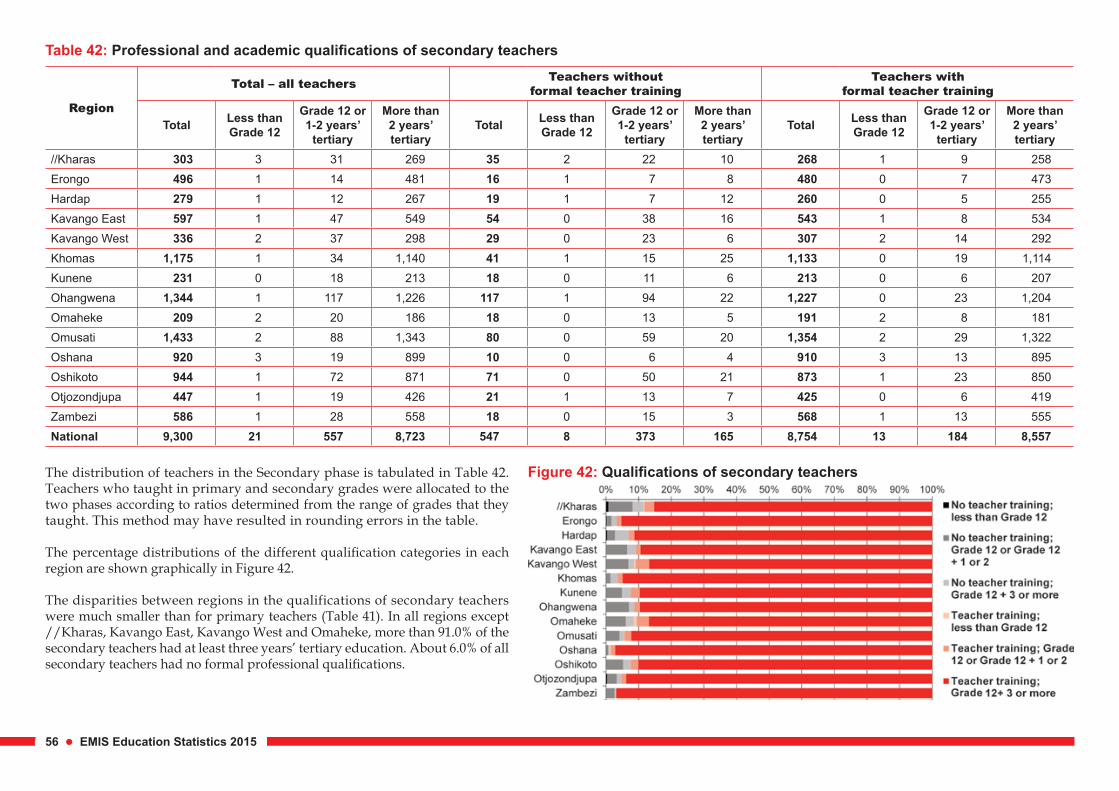
Table 42: Professional and academic qualifications of secondary teachers
The distribution of teachers in the Secondary phase is tabulated in Table 42. Teachers who taught in primary and secondary grades were allocated to the two phases according to ratios determined from the range of grades that they taught. This method may have resulted in rounding errors in the table.
The percentage distributions of the different qualification categories in each region are shown graphically in Figure 42.
The disparities between regions in the qualifications of secondary teachers were much smaller than for primary teachers (Table 41). In all regions except //Kharas, Kavango East, Kavango West and Omaheke, more than 91.0% of the secondary teachers had at least three years’ tertiary education. About 6.0% of all secondary teachers had no formal professional qualifications.
Figure 42: Qualifications of secondary teachers
Region
Total – all teachers Teachers without formal teacher training
Teachers with formal teacher training
Total Less than Grade 12
Grade 12 or 1-2 years’
tertiary
More than 2 years’ tertiary
Total Less than Grade 12
Grade 12 or 1-2 years’
tertiary
More than 2 years’ tertiary
Total Less than Grade 12
Grade 12 or 1-2 years’
tertiary
More than 2 years’ tertiary
//Kharas 303 3 31 269 35 2 22 10 268 1 9 258Erongo 496 1 14 481 16 1 7 8 480 0 7 473Hardap 279 1 12 267 19 1 7 12 260 0 5 255Kavango East 597 1 47 549 54 0 38 16 543 1 8 534Kavango West 336 2 37 298 29 0 23 6 307 2 14 292Khomas 1,175 1 34 1,140 41 1 15 25 1,133 0 19 1,114Kunene 231 0 18 213 18 0 11 6 213 0 6 207Ohangwena 1,344 1 117 1,226 117 1 94 22 1,227 0 23 1,204Omaheke 209 2 20 186 18 0 13 5 191 2 8 181Omusati 1,433 2 88 1,343 80 0 59 20 1,354 2 29 1,322Oshana 920 3 19 899 10 0 6 4 910 3 13 895Oshikoto 944 1 72 871 71 0 50 21 873 1 23 850Otjozondjupa 447 1 19 426 21 1 13 7 425 0 6 419Zambezi 586 1 28 558 18 0 15 3 568 1 13 555National 9,300 21 557 8,723 547 8 373 165 8,754 13 184 8,557
Chapter 5: TEACHERS 57
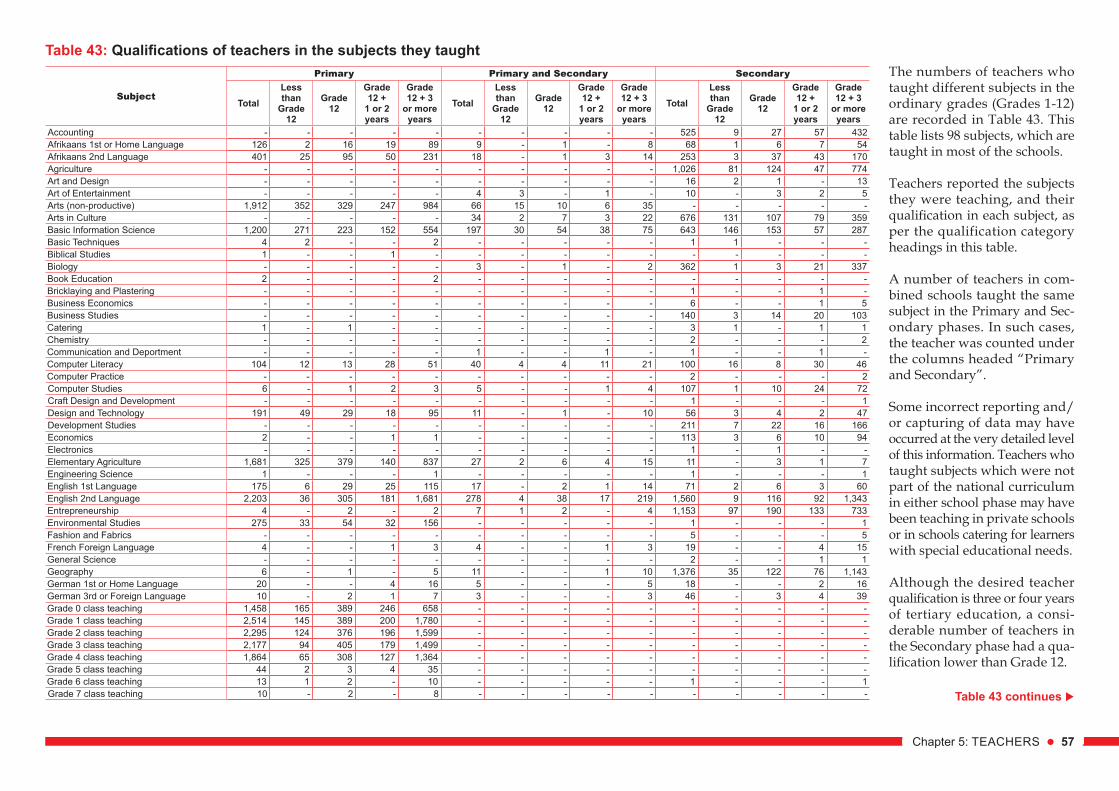
Table 43: Qualifications of teachers in the subjects they taughtThe numbers of teachers who taught different subjects in the ordinary grades (Grades 1-12) are recorded in Table 43. This table lists 98 subjects, which are taught in most of the schools.
Teachers reported the subjects they were teaching, and their qualification in each subject, as per the qualification category headings in this table.
A number of teachers in com-bined schools taught the same subject in the Primary and Sec-ondary phases. In such cases, the teacher was counted under the columns headed “Primary and Secondary”.
Some incorrect reporting and/or capturing of data may have occurred at the very detailed level of this information. Teachers who taught subjects which were not part of the national curriculum in either school phase may have been teaching in private schools or in schools catering for learners with special educational needs.
Although the desired teacher qua lifi cation is three or four years of tertiary education, a con si-derable number of teach ers in the Secondary phase had a qua-li fi cation lower than Grade 12.
Table 43 continues
Subject
Primary Primary and Secondary Secondary
TotalLess than
Grade 12
Grade 12
Grade 12 +
1 or 2 years
Grade 12 + 3
or more years
TotalLess than
Grade 12
Grade 12
Grade 12 +
1 or 2 years
Grade 12 + 3
or more years
TotalLess than
Grade 12
Grade 12
Grade 12 +
1 or 2 years
Grade 12 + 3
or more years
Accounting - - - - - - - - - - 525 9 27 57 432Afrikaans 1st or Home Language 126 2 16 19 89 9 - 1 - 8 68 1 6 7 54Afrikaans 2nd Language 401 25 95 50 231 18 - 1 3 14 253 3 37 43 170Agriculture - - - - - - - - - - 1,026 81 124 47 774Art and Design - - - - - - - - - - 16 2 1 - 13Art of Entertainment - - - - - 4 3 - 1 - 10 - 3 2 5Arts (non-productive) 1,912 352 329 247 984 66 15 10 6 35 - - - - -Arts in Culture - - - - - 34 2 7 3 22 676 131 107 79 359Basic Information Science 1,200 271 223 152 554 197 30 54 38 75 643 146 153 57 287Basic Techniques 4 2 - - 2 - - - - - 1 1 - - -Biblical Studies 1 - - 1 - - - - - - - - - - -Biology - - - - - 3 - 1 - 2 362 1 3 21 337Book Education 2 - - - 2 - - - - - - - - - -Bricklaying and Plastering - - - - - - - - - - 1 - - 1 -Business Economics - - - - - - - - - - 6 - - 1 5Business Studies - - - - - - - - - - 140 3 14 20 103Catering 1 - 1 - - - - - - - 3 1 - 1 1Chemistry - - - - - - - - - - 2 - - - 2Communication and Deportment - - - - - 1 - - 1 - 1 - - 1 -Computer Literacy 104 12 13 28 51 40 4 4 11 21 100 16 8 30 46Computer Practice - - - - - - - - - - 2 - - - 2Computer Studies 6 - 1 2 3 5 - - 1 4 107 1 10 24 72Craft Design and Development - - - - - - - - - - 1 - - - 1Design and Technology 191 49 29 18 95 11 - 1 - 10 56 3 4 2 47Development Studies - - - - - - - - - - 211 7 22 16 166Economics 2 - - 1 1 - - - - - 113 3 6 10 94Electronics - - - - - - - - - - 1 - 1 - -Elementary Agriculture 1,681 325 379 140 837 27 2 6 4 15 11 - 3 1 7Engineering Science 1 - - - 1 - - - - - 1 - - - 1English 1st Language 175 6 29 25 115 17 - 2 1 14 71 2 6 3 60English 2nd Language 2,203 36 305 181 1,681 278 4 38 17 219 1,560 9 116 92 1,343Entrepreneurship 4 - 2 - 2 7 1 2 - 4 1,153 97 190 133 733Environmental Studies 275 33 54 32 156 - - - - - 1 - - - 1Fashion and Fabrics - - - - - - - - - - 5 - - - 5French Foreign Language 4 - - 1 3 4 - - 1 3 19 - - 4 15General Science - - - - - - - - - - 2 - - 1 1Geography 6 - 1 - 5 11 - - 1 10 1,376 35 122 76 1,143German 1st or Home Language 20 - - 4 16 5 - - - 5 18 - - 2 16German 3rd or Foreign Language 10 - 2 1 7 3 - - - 3 46 - 3 4 39Grade 0 class teaching 1,458 165 389 246 658 - - - - - - - - - -Grade 1 class teaching 2,514 145 389 200 1,780 - - - - - - - - - -Grade 2 class teaching 2,295 124 376 196 1,599 - - - - - - - - - -Grade 3 class teaching 2,177 94 405 179 1,499 - - - - - - - - - -Grade 4 class teaching 1,864 65 308 127 1,364 - - - - - - - - - -Grade 5 class teaching 44 2 3 4 35 - - - - - - - - - -Grade 6 class teaching 13 1 2 - 10 - - - - - 1 - - - 1Grade 7 class teaching 10 - 2 - 8 - - - - - - - - - -
58 EMIS Education Statistics 2015
Table 43 continued
Subject
Primary Primary and Secondary Secondary
TotalLess than
Grade 12
Grade 12
Grade 12 +
1 or 2 years
Grade 12 + 3
or more years
TotalLess than
Grade 12
Grade 12
Grade 12 +
1 or 2 years
Grade 12 + 3
or more years
TotalLess than
Grade 12
Grade 12
Grade 12 +
1 or 2 years
Grade 12 + 3
or more years
Hairdressing 1 - - - 1 - - - - - 2 - - - 2Handwriting 7 2 2 - 3 - - - - - - - - - -History 1 - - - - - - - - - 1,289 48 129 113 999Home Ecology 283 64 35 35 149 3 1 - - 2 - - - - -Home Economics 2 1 - - 1 - - - - - 75 4 6 5 60Individual Learning 9 1 1 - 7 - - - - - 1 - - 1 -Integrated Performing Arts 8 - - - - - - - - - 14 4 - 2 8Ju/`hoansi 1 - - 1 - - - - - - - - - - -Keyboard and Word Processing 2 - - 1 1 - - - - - 76 5 10 7 54Khoekhoegowab 143 20 19 23 81 10 1 2 1 6 62 4 5 5 48Languages 2 - - - 2 - - - - - 3 - 1 - 2Life Science 8 2 2 2 2 13 2 5 1 5 1,386 37 122 73 1,154Life Skills 884 175 232 118 359 405 46 64 65 230 450 52 108 64 226Mathematics 2,311 84 235 214 1,778 223 - 15 13 195 1,528 10 56 88 1,374Natural Science and Health Education 2,286 120 257 178 1,731 11 - 1 2 8 3 - 2 - 1Needlework and Clothing 5 - - - 5 - - - - - 3 - 2 - 1Office Administration and Keyboard - - - - - - - - - - 5 2 3 - -Office Practice 1 - - - 1 1 - - - 1 9 - - 1 8Oshikwanyama 377 21 102 32 222 93 - 31 9 53 61 4 40 1 16Oshindonga 592 20 137 66 369 143 4 16 14 109 44 2 42 - -Otjiherero 139 17 19 15 88 6 1 1 1 3 23 5 5 2 11Performing Arts 5 - - - 5 4 - - - 4 249 1 1 19 228Physical Education and Health Awareness 6 1 2 - 3 - - - - - 386 - - 23 363Physical Education 1,667 193 325 209 940 167 21 39 19 88 375 127 182 4 62Physical Science 8 - 3 - 5 10 1 2 1 6 100 15 85 - -Physics 5 2 - 1 2 - - - - - 4 - - 1 3Plumbing and Sheetmetal Work - - - - - - - - - - - - - - -Portuguese 3 - 1 - 2 3 - - 1 2 576 - 1 96 479Religious and Moral Education 1,563 339 332 225 667 158 35 42 11 70 368 204 163 - 1Remedial Teaching 16 - 3 2 11 2 - 1 - 1 9 - - 2 7Rukwangali 130 15 21 8 86 14 - 1 2 11 7 - 6 - 1Rumanyo (Rugciriku) 65 6 14 2 43 10 - 4 - 6 409 1 7 85 316School Art 1 1 - - - 3 1 2 - - 3 3 - - -School Music 8 1 1 - 6 1 - - - 1 2 - - - 2Sciences 2 1 - - 1 - - - - - 66 - - 11 55Setswana 7 - 3 - 4 1 - 1 - - 31 - 2 1 28Sign Language 13 2 2 - 9 2 1 1 - - 8 - 3 1 4Silozi 112 2 19 20 71 17 - - 3 14 8 1 6 - 1Social Sciences 10 2 1 2 5 - - - - - 1 - - - 1Social Studies 2,045 178 254 174 1,439 8 - 3 - 5 6 - 2 - 4Special Education 19 - 2 - 17 1 1 - - - 75 - - 11 64Technical Drawing - - - - - - - - - - 4 - - - 4Thimbukushu 26 3 7 2 14 2 - - - 2 3 1 2 - -Tourism - - - - - 1 - - 1 - 3 1 1 1 -Typing or Typing and Office Administration - - - - - - - - - - 1 - - - 1Visual Arts 2 - - - 2 1 - - - 1 6 2 2 - 2
Chapter 5: TEACHERS 59
Table 44: Ages and professional and academic qualifications of teachers
Age group
Total – all teachers Teachers without formal teacher training Teachers with formal teacher training
Total Less than Grade 12
Grade 12 or 1-2 years'
tertiary
More than 2 years’ tertiary
Total Less than Grade 12
Grade 12 or 1-2 years'
tertiary
More than 2 years’ tertiary
Total Less than Grade 12
Grade 12 or 1-2 years'
tertiary
More than 2 years’ tertiary
Total 27,990 581 3,843 23,566 3,135 243 2,569 323 24,855 338 1,274 23,243Less than 20 73 3 65 5 63 3 60 0 10 0 5 520 - 24 1,978 29 1,021 928 973 23 871 79 1,005 6 150 84925 - 29 4,431 53 1,079 3,299 1,029 35 851 143 3,402 18 228 3,15630 - 34 4,643 32 539 4,072 425 20 361 44 4,218 12 178 4,02835 - 39 3,719 32 328 3,359 214 14 184 16 3,505 18 144 3,34340 - 44 3,286 47 224 3,015 159 31 114 14 3,127 16 110 3,00145 - 49 3,866 95 212 3,559 108 35 60 13 3,758 60 152 3,54650 - 54 3,582 130 190 3,262 79 38 34 7 3,503 92 156 3,25555 - 59 1,997 141 134 1,722 73 43 25 5 1,924 98 109 1,71760 or older 415 19 51 345 12 1 9 2 403 18 42 343Average age 39.7 46.6 32.3 40.7 30.0 42.1 28.9 30.2 40.9 49.8 39.3 40.9
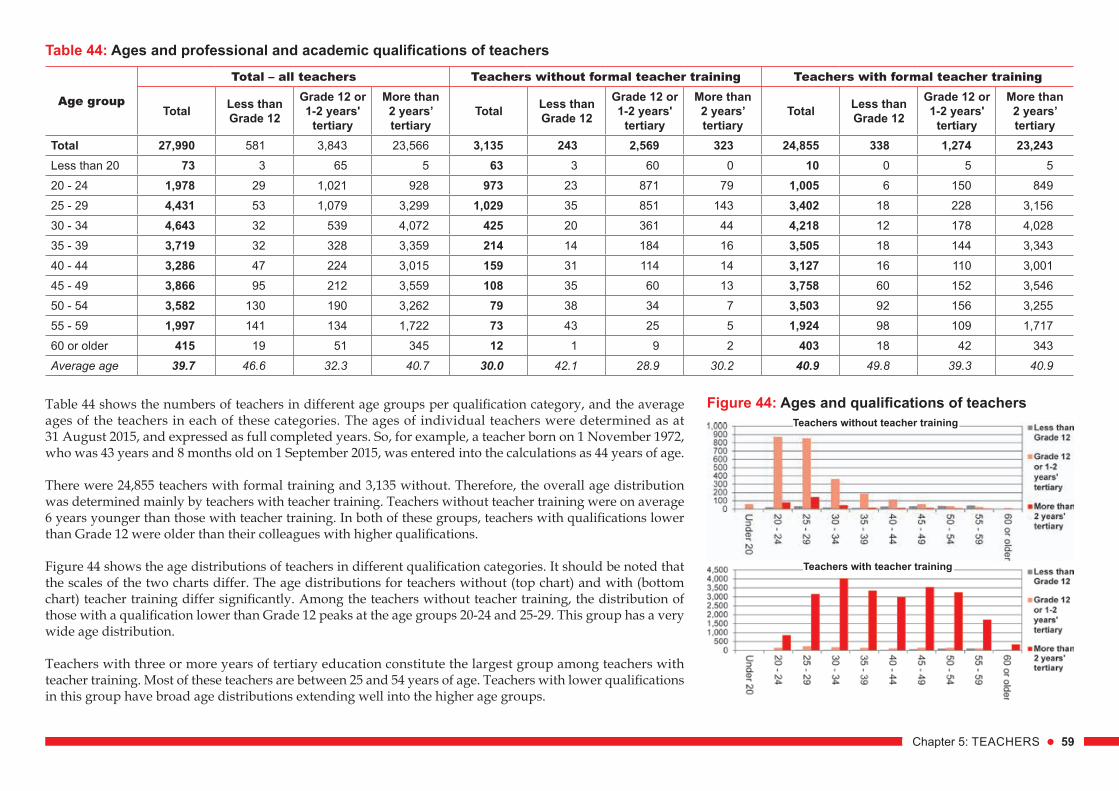
Table 44 shows the numbers of teachers in different age groups per qualification category, and the average ages of the teachers in each of these categories. The ages of individual teachers were determined as at 31 August 2015, and expressed as full completed years. So, for example, a teacher born on 1 November 1972, who was 43 years and 8 months old on 1 September 2015, was entered into the calculations as 44 years of age.
There were 24,855 teachers with formal training and 3,135 without. Therefore, the overall age distribution was determined mainly by teachers with teacher training. Teachers without teacher training were on average 6 years younger than those with teacher training. In both of these groups, teachers with qualifications lower than Grade 12 were older than their colleagues with higher qualifications.
Figure 44 shows the age distributions of teachers in different qualification categories. It should be noted that the scales of the two charts differ. The age distributions for teachers without (top chart) and with (bottom chart) teacher training differ significantly. Among the teachers without teacher training, the distribution of those with a qualification lower than Grade 12 peaks at the age groups 20-24 and 25-29. This group has a very wide age distribution.
Teachers with three or more years of tertiary education constitute the largest group among teachers with teacher training. Most of these teachers are between 25 and 54 years of age. Teachers with lower qualifications in this group have broad age distributions extending well into the higher age groups.
Figure 44: Ages and qualifications of teachersTeachers without teacher training
Teachers with teacher training
60 EMIS Education Statistics 2015
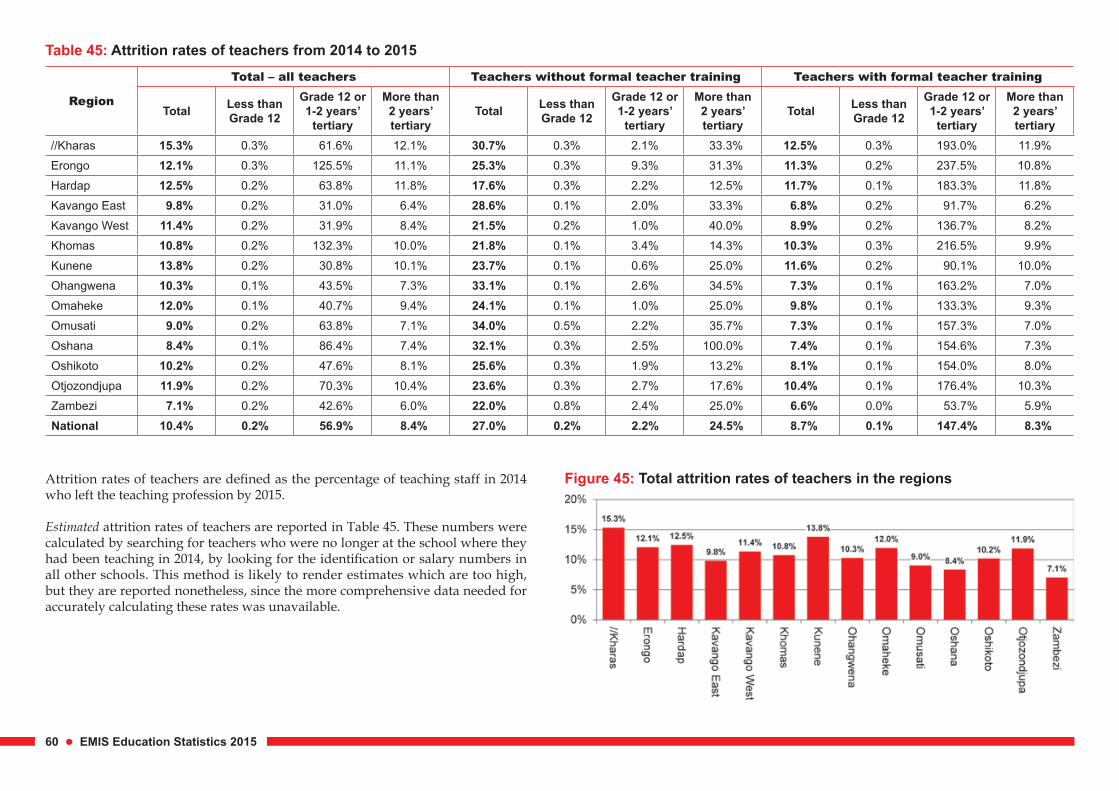
Table 45: Attrition rates of teachers from 2014 to 2015
Region
Total – all teachers Teachers without formal teacher training Teachers with formal teacher training
Total Less than Grade 12
Grade 12 or 1-2 years’
tertiary
More than 2 years’ tertiary
Total Less than Grade 12
Grade 12 or 1-2 years’
tertiary
More than 2 years’ tertiary
Total Less than Grade 12
Grade 12 or 1-2 years’
tertiary
More than 2 years’ tertiary
//Kharas 15.3% 0.3% 61.6% 12.1% 30.7% 0.3% 2.1% 33.3% 12.5% 0.3% 193.0% 11.9%Erongo 12.1% 0.3% 125.5% 11.1% 25.3% 0.3% 9.3% 31.3% 11.3% 0.2% 237.5% 10.8%Hardap 12.5% 0.2% 63.8% 11.8% 17.6% 0.3% 2.2% 12.5% 11.7% 0.1% 183.3% 11.8%Kavango East 9.8% 0.2% 31.0% 6.4% 28.6% 0.1% 2.0% 33.3% 6.8% 0.2% 91.7% 6.2%Kavango West 11.4% 0.2% 31.9% 8.4% 21.5% 0.2% 1.0% 40.0% 8.9% 0.2% 136.7% 8.2%Khomas 10.8% 0.2% 132.3% 10.0% 21.8% 0.1% 3.4% 14.3% 10.3% 0.3% 216.5% 9.9%Kunene 13.8% 0.2% 30.8% 10.1% 23.7% 0.1% 0.6% 25.0% 11.6% 0.2% 90.1% 10.0%Ohangwena 10.3% 0.1% 43.5% 7.3% 33.1% 0.1% 2.6% 34.5% 7.3% 0.1% 163.2% 7.0%Omaheke 12.0% 0.1% 40.7% 9.4% 24.1% 0.1% 1.0% 25.0% 9.8% 0.1% 133.3% 9.3%Omusati 9.0% 0.2% 63.8% 7.1% 34.0% 0.5% 2.2% 35.7% 7.3% 0.1% 157.3% 7.0%Oshana 8.4% 0.1% 86.4% 7.4% 32.1% 0.3% 2.5% 100.0% 7.4% 0.1% 154.6% 7.3%Oshikoto 10.2% 0.2% 47.6% 8.1% 25.6% 0.3% 1.9% 13.2% 8.1% 0.1% 154.0% 8.0%Otjozondjupa 11.9% 0.2% 70.3% 10.4% 23.6% 0.3% 2.7% 17.6% 10.4% 0.1% 176.4% 10.3%Zambezi 7.1% 0.2% 42.6% 6.0% 22.0% 0.8% 2.4% 25.0% 6.6% 0.0% 53.7% 5.9%National 10.4% 0.2% 56.9% 8.4% 27.0% 0.2% 2.2% 24.5% 8.7% 0.1% 147.4% 8.3%
Figure 45: Total attrition rates of teachers in the regionsAttrition rates of teachers are defined as the percentage of teaching staff in 2014 who left the teaching profession by 2015.
Estimated attrition rates of teachers are reported in Table 45. These numbers were calculated by searching for teachers who were no longer at the school where they had been teaching in 2014, by looking for the identification or salary numbers in all other schools. This method is likely to render estimates which are too high, but they are reported nonetheless, since the more comprehensive data needed for accurately calculating these rates was unavailable.
Chapter 5: TEACHERS 61
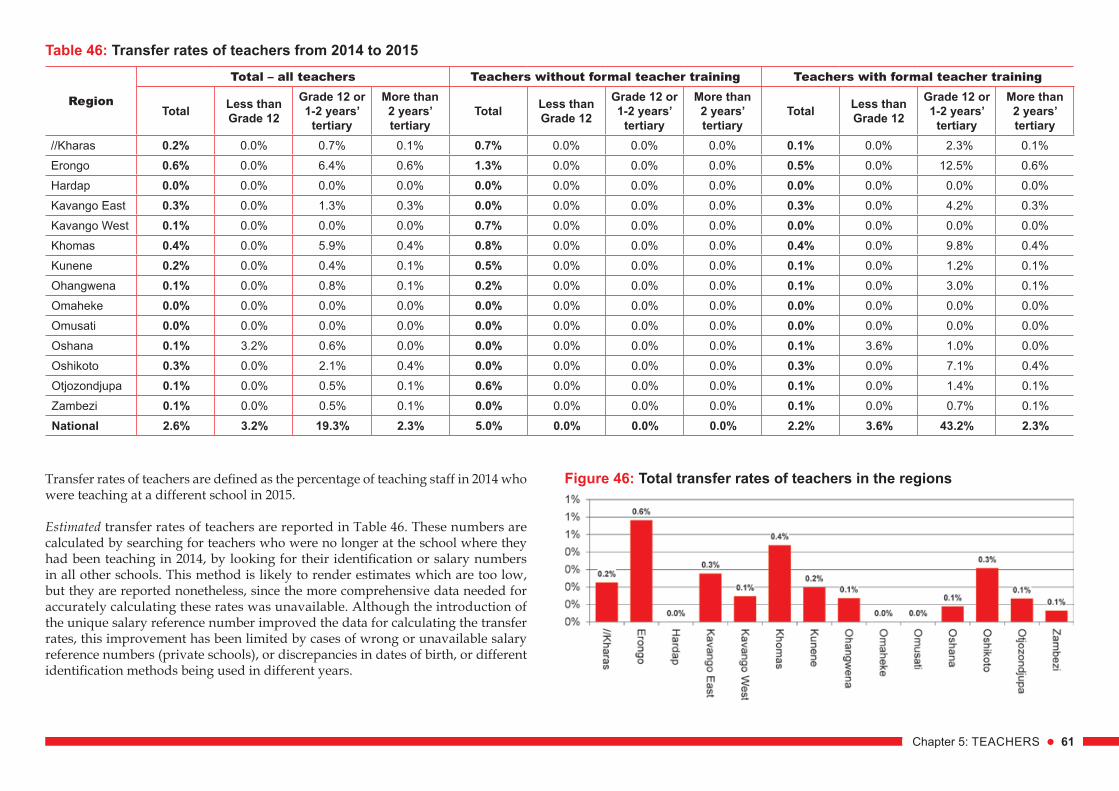
Table 46: Transfer rates of teachers from 2014 to 2015
Region
Total – all teachers Teachers without formal teacher training Teachers with formal teacher training
Total Less than Grade 12
Grade 12 or 1-2 years’
tertiary
More than 2 years’ tertiary
Total Less than Grade 12
Grade 12 or 1-2 years’
tertiary
More than 2 years’ tertiary
Total Less than Grade 12
Grade 12 or 1-2 years’
tertiary
More than 2 years’ tertiary
//Kharas 0.2% 0.0% 0.7% 0.1% 0.7% 0.0% 0.0% 0.0% 0.1% 0.0% 2.3% 0.1%Erongo 0.6% 0.0% 6.4% 0.6% 1.3% 0.0% 0.0% 0.0% 0.5% 0.0% 12.5% 0.6%Hardap 0.0% 0.0% 0.0% 0.0% 0.0% 0.0% 0.0% 0.0% 0.0% 0.0% 0.0% 0.0%Kavango East 0.3% 0.0% 1.3% 0.3% 0.0% 0.0% 0.0% 0.0% 0.3% 0.0% 4.2% 0.3%Kavango West 0.1% 0.0% 0.0% 0.0% 0.7% 0.0% 0.0% 0.0% 0.0% 0.0% 0.0% 0.0%Khomas 0.4% 0.0% 5.9% 0.4% 0.8% 0.0% 0.0% 0.0% 0.4% 0.0% 9.8% 0.4%Kunene 0.2% 0.0% 0.4% 0.1% 0.5% 0.0% 0.0% 0.0% 0.1% 0.0% 1.2% 0.1%Ohangwena 0.1% 0.0% 0.8% 0.1% 0.2% 0.0% 0.0% 0.0% 0.1% 0.0% 3.0% 0.1%Omaheke 0.0% 0.0% 0.0% 0.0% 0.0% 0.0% 0.0% 0.0% 0.0% 0.0% 0.0% 0.0%Omusati 0.0% 0.0% 0.0% 0.0% 0.0% 0.0% 0.0% 0.0% 0.0% 0.0% 0.0% 0.0%Oshana 0.1% 3.2% 0.6% 0.0% 0.0% 0.0% 0.0% 0.0% 0.1% 3.6% 1.0% 0.0%Oshikoto 0.3% 0.0% 2.1% 0.4% 0.0% 0.0% 0.0% 0.0% 0.3% 0.0% 7.1% 0.4%Otjozondjupa 0.1% 0.0% 0.5% 0.1% 0.6% 0.0% 0.0% 0.0% 0.1% 0.0% 1.4% 0.1%Zambezi 0.1% 0.0% 0.5% 0.1% 0.0% 0.0% 0.0% 0.0% 0.1% 0.0% 0.7% 0.1%National 2.6% 3.2% 19.3% 2.3% 5.0% 0.0% 0.0% 0.0% 2.2% 3.6% 43.2% 2.3%
Figure 46: Total transfer rates of teachers in the regionsTransfer rates of teachers are defined as the percentage of teaching staff in 2014 who were teaching at a different school in 2015.
Estimated transfer rates of teachers are reported in Table 46. These numbers are calculated by searching for teachers who were no longer at the school where they had been teaching in 2014, by looking for their identification or salary numbers in all other schools. This method is likely to render estimates which are too low, but they are reported nonetheless, since the more comprehensive data needed for accurately calculating these rates was unavailable. Although the introduction of the unique salary reference number improved the data for calculating the transfer rates, this improvement has been limited by cases of wrong or unavailable salary reference numbers (private schools), or discrepancies in dates of birth, or different identification methods being used in different years.
62 EMIS Education Statistics 2015
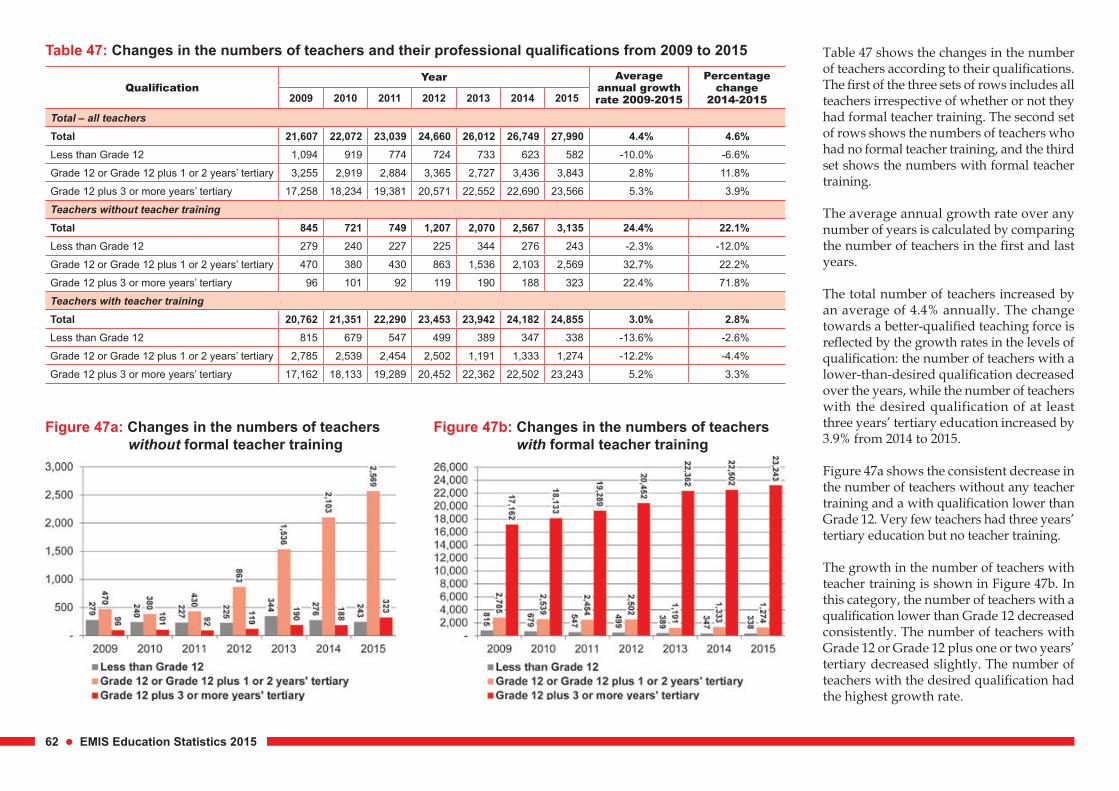
Table 47: Changes in the numbers of teachers and their professional qualifications from 2009 to 2015 Table 47 shows the changes in the number of teachers according to their qualifications. The first of the three sets of rows includes all teachers irrespective of whether or not they had formal teacher training. The second set of rows shows the numbers of teachers who had no formal teacher training, and the third set shows the numbers with formal teacher training.
The average annual growth rate over any number of years is calculated by comparing the number of teachers in the first and last years.
The total number of teachers increased by an average of 4.4% annually. The change towards a better-qualified teaching force is reflected by the growth rates in the levels of qualification: the number of teachers with a lower-than-desired qualification decreased over the years, while the number of teachers with the desired qualification of at least three years’ tertiary education increased by 3.9% from 2014 to 2015.
Figure 47a shows the consistent decrease in the number of teachers without any teacher training and a with qualification lower than Grade 12. Very few teachers had three years’ tertiary education but no teacher training.
The growth in the number of teachers with teacher training is shown in Figure 47b. In this category, the number of teachers with a qualification lower than Grade 12 decreased consistently. The number of teachers with Grade 12 or Grade 12 plus one or two years’ tertiary decreased slightly. The number of teachers with the desired qualification had the highest growth rate.
Figure 47a: Changes in the numbers of teachers without formal teacher training
Figure 47b: Changes in the numbers of teachers with formal teacher training
QualificationYear Average
annual growth rate 2009-2015
Percentage change
2014-20152009 2010 2011 2012 2013 2014 2015
Total – all teachersTotal 21,607 22,072 23,039 24,660 26,012 26,749 27,990 4.4% 4.6%Less than Grade 12 1,094 919 774 724 733 623 582 -10.0% -6.6%
Grade 12 or Grade 12 plus 1 or 2 years’ tertiary 3,255 2,919 2,884 3,365 2,727 3,436 3,843 2.8% 11.8%
Grade 12 plus 3 or more years’ tertiary 17,258 18,234 19,381 20,571 22,552 22,690 23,566 5.3% 3.9%
Teachers without teacher trainingTotal 845 721 749 1,207 2,070 2,567 3,135 24.4% 22.1%Less than Grade 12 279 240 227 225 344 276 243 -2.3% -12.0%
Grade 12 or Grade 12 plus 1 or 2 years’ tertiary 470 380 430 863 1,536 2,103 2,569 32.7% 22.2%
Grade 12 plus 3 or more years’ tertiary 96 101 92 119 190 188 323 22.4% 71.8%
Teachers with teacher trainingTotal 20,762 21,351 22,290 23,453 23,942 24,182 24,855 3.0% 2.8%Less than Grade 12 815 679 547 499 389 347 338 -13.6% -2.6%
Grade 12 or Grade 12 plus 1 or 2 years’ tertiary 2,785 2,539 2,454 2,502 1,191 1,333 1,274 -12.2% -4.4%
Grade 12 plus 3 or more years’ tertiary 17,162 18,133 19,289 20,452 22,362 22,502 23,243 5.2% 3.3%
Chapter 5: TEACHERS 63
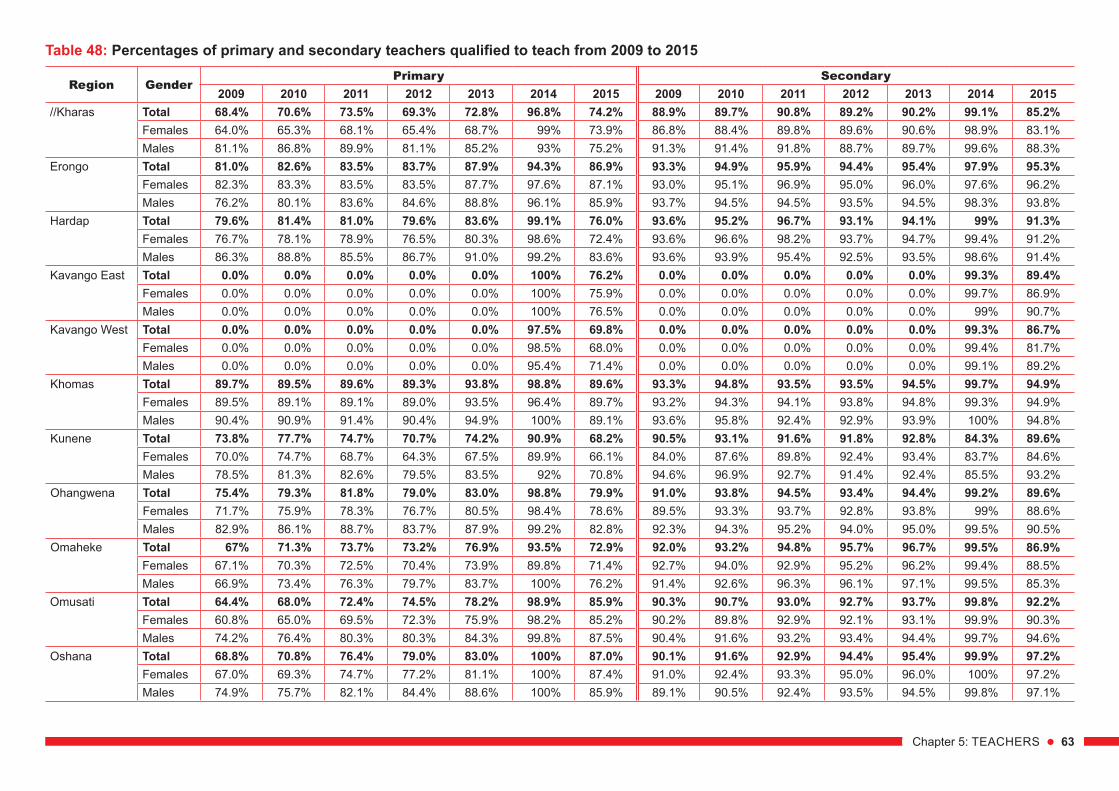
Table 48: Percentages of primary and secondary teachers qualified to teach from 2009 to 2015
Region GenderPrimary Secondary
2009 2010 2011 2012 2013 2014 2015 2009 2010 2011 2012 2013 2014 2015//Kharas Total 68.4% 70.6% 73.5% 69.3% 72.8% 96.8% 74.2% 88.9% 89.7% 90.8% 89.2% 90.2% 99.1% 85.2%
Females 64.0% 65.3% 68.1% 65.4% 68.7% 99% 73.9% 86.8% 88.4% 89.8% 89.6% 90.6% 98.9% 83.1%Males 81.1% 86.8% 89.9% 81.1% 85.2% 93% 75.2% 91.3% 91.4% 91.8% 88.7% 89.7% 99.6% 88.3%
Erongo Total 81.0% 82.6% 83.5% 83.7% 87.9% 94.3% 86.9% 93.3% 94.9% 95.9% 94.4% 95.4% 97.9% 95.3%Females 82.3% 83.3% 83.5% 83.5% 87.7% 97.6% 87.1% 93.0% 95.1% 96.9% 95.0% 96.0% 97.6% 96.2%Males 76.2% 80.1% 83.6% 84.6% 88.8% 96.1% 85.9% 93.7% 94.5% 94.5% 93.5% 94.5% 98.3% 93.8%
Hardap Total 79.6% 81.4% 81.0% 79.6% 83.6% 99.1% 76.0% 93.6% 95.2% 96.7% 93.1% 94.1% 99% 91.3%Females 76.7% 78.1% 78.9% 76.5% 80.3% 98.6% 72.4% 93.6% 96.6% 98.2% 93.7% 94.7% 99.4% 91.2%Males 86.3% 88.8% 85.5% 86.7% 91.0% 99.2% 83.6% 93.6% 93.9% 95.4% 92.5% 93.5% 98.6% 91.4%
Kavango East Total 0.0% 0.0% 0.0% 0.0% 0.0% 100% 76.2% 0.0% 0.0% 0.0% 0.0% 0.0% 99.3% 89.4%Females 0.0% 0.0% 0.0% 0.0% 0.0% 100% 75.9% 0.0% 0.0% 0.0% 0.0% 0.0% 99.7% 86.9%Males 0.0% 0.0% 0.0% 0.0% 0.0% 100% 76.5% 0.0% 0.0% 0.0% 0.0% 0.0% 99% 90.7%
Kavango West Total 0.0% 0.0% 0.0% 0.0% 0.0% 97.5% 69.8% 0.0% 0.0% 0.0% 0.0% 0.0% 99.3% 86.7%Females 0.0% 0.0% 0.0% 0.0% 0.0% 98.5% 68.0% 0.0% 0.0% 0.0% 0.0% 0.0% 99.4% 81.7%Males 0.0% 0.0% 0.0% 0.0% 0.0% 95.4% 71.4% 0.0% 0.0% 0.0% 0.0% 0.0% 99.1% 89.2%
Khomas Total 89.7% 89.5% 89.6% 89.3% 93.8% 98.8% 89.6% 93.3% 94.8% 93.5% 93.5% 94.5% 99.7% 94.9%Females 89.5% 89.1% 89.1% 89.0% 93.5% 96.4% 89.7% 93.2% 94.3% 94.1% 93.8% 94.8% 99.3% 94.9%Males 90.4% 90.9% 91.4% 90.4% 94.9% 100% 89.1% 93.6% 95.8% 92.4% 92.9% 93.9% 100% 94.8%
Kunene Total 73.8% 77.7% 74.7% 70.7% 74.2% 90.9% 68.2% 90.5% 93.1% 91.6% 91.8% 92.8% 84.3% 89.6%Females 70.0% 74.7% 68.7% 64.3% 67.5% 89.9% 66.1% 84.0% 87.6% 89.8% 92.4% 93.4% 83.7% 84.6%Males 78.5% 81.3% 82.6% 79.5% 83.5% 92% 70.8% 94.6% 96.9% 92.7% 91.4% 92.4% 85.5% 93.2%
Ohangwena Total 75.4% 79.3% 81.8% 79.0% 83.0% 98.8% 79.9% 91.0% 93.8% 94.5% 93.4% 94.4% 99.2% 89.6%Females 71.7% 75.9% 78.3% 76.7% 80.5% 98.4% 78.6% 89.5% 93.3% 93.7% 92.8% 93.8% 99% 88.6%Males 82.9% 86.1% 88.7% 83.7% 87.9% 99.2% 82.8% 92.3% 94.3% 95.2% 94.0% 95.0% 99.5% 90.5%
Omaheke Total 67% 71.3% 73.7% 73.2% 76.9% 93.5% 72.9% 92.0% 93.2% 94.8% 95.7% 96.7% 99.5% 86.9%Females 67.1% 70.3% 72.5% 70.4% 73.9% 89.8% 71.4% 92.7% 94.0% 92.9% 95.2% 96.2% 99.4% 88.5%Males 66.9% 73.4% 76.3% 79.7% 83.7% 100% 76.2% 91.4% 92.6% 96.3% 96.1% 97.1% 99.5% 85.3%
Omusati Total 64.4% 68.0% 72.4% 74.5% 78.2% 98.9% 85.9% 90.3% 90.7% 93.0% 92.7% 93.7% 99.8% 92.2%Females 60.8% 65.0% 69.5% 72.3% 75.9% 98.2% 85.2% 90.2% 89.8% 92.9% 92.1% 93.1% 99.9% 90.3%Males 74.2% 76.4% 80.3% 80.3% 84.3% 99.8% 87.5% 90.4% 91.6% 93.2% 93.4% 94.4% 99.7% 94.6%
Oshana Total 68.8% 70.8% 76.4% 79.0% 83.0% 100% 87.0% 90.1% 91.6% 92.9% 94.4% 95.4% 99.9% 97.2%Females 67.0% 69.3% 74.7% 77.2% 81.1% 100% 87.4% 91.0% 92.4% 93.3% 95.0% 96.0% 100% 97.2%Males 74.9% 75.7% 82.1% 84.4% 88.6% 100% 85.9% 89.1% 90.5% 92.4% 93.5% 94.5% 99.8% 97.1%
64 EMIS Education Statistics 2015
Table 48 continued
Figure 48: Percentages of primary and secondary teachers qualified to teach
Region GenderPrimary Secondary
2009 2010 2011 2012 2013 2014 2015 2009 2010 2011 2012 2013 2014 2015Oshikoto Total 72.5% 75.7% 78.9% 79.1% 83.1% 97.3% 78.9% 91.6% 91.7% 92.8% 93.1% 94.1% 98.5% 90.0%
Females 69.7% 72.7% 76.8% 77.0% 80.9% 95.9% 77.1% 91.8% 92.4% 95.2% 93.7% 94.7% 98.6% 89.4%Males 78.1% 81.7% 82.8% 83.1% 87.3% 98.5% 82.7% 91.3% 90.9% 90.4% 92.5% 93.5% 98.4% 90.7%
Otjozondjupa Total 71.2% 72.8% 75.0% 78.1% 82.0% 95.5% 80.2% 87.4% 87.2% 88.0% 89.2% 90.2% 99.3% 93.8%Females 75.2% 75.8% 77.2% 77.3% 81.2% 94% 80.6% 89.2% 89.4% 91.0% 89.6% 90.6% 99.5% 95.7%Males 62.3% 65.9% 69.8% 80.1% 84.1% 96.9% 79.0% 85.6% 85.0% 84.9% 88.7% 89.7% 98.7% 91.4%
Zambezi Total 74.8% 78.6% 81.9% 82.7% 86.8% 99.5% 85.9% 89.4% 92.0% 93.7% 92.7% 93.7% 99.7% 94.6%Females 78.8% 80.4% 82.3% 82.0% 86.1% 98.8% 84.6% 90.4% 92.0% 94.8% 92.1% 93.1% 99.8% 94.1%Males 68.0% 75.5% 81.3% 83.9% 88.1% 99.9% 88.4% 88.7% 92.0% 93.0% 93.4% 94.4% 99.5% 94.9%
National Total 73.7% 76.8% 78.7% 77.8% 81.7% 97.2% 81.0% 91.1% 92.9% 93.7% 93.2% 94.2% 98.2% 92.0%Females 73.1% 76.1% 77.8% 76.7% 80.5% 96.8% 80.8% 91.1% 93.4% 94.1% 93.2% 94.2% 98.2% 91.6%Males 75.0% 78.3% 80.7% 80.3% 84.3% 97.9% 81.2% 91.1% 92.4% 93.2% 93.2% 94.2% 98.2% 92.5%
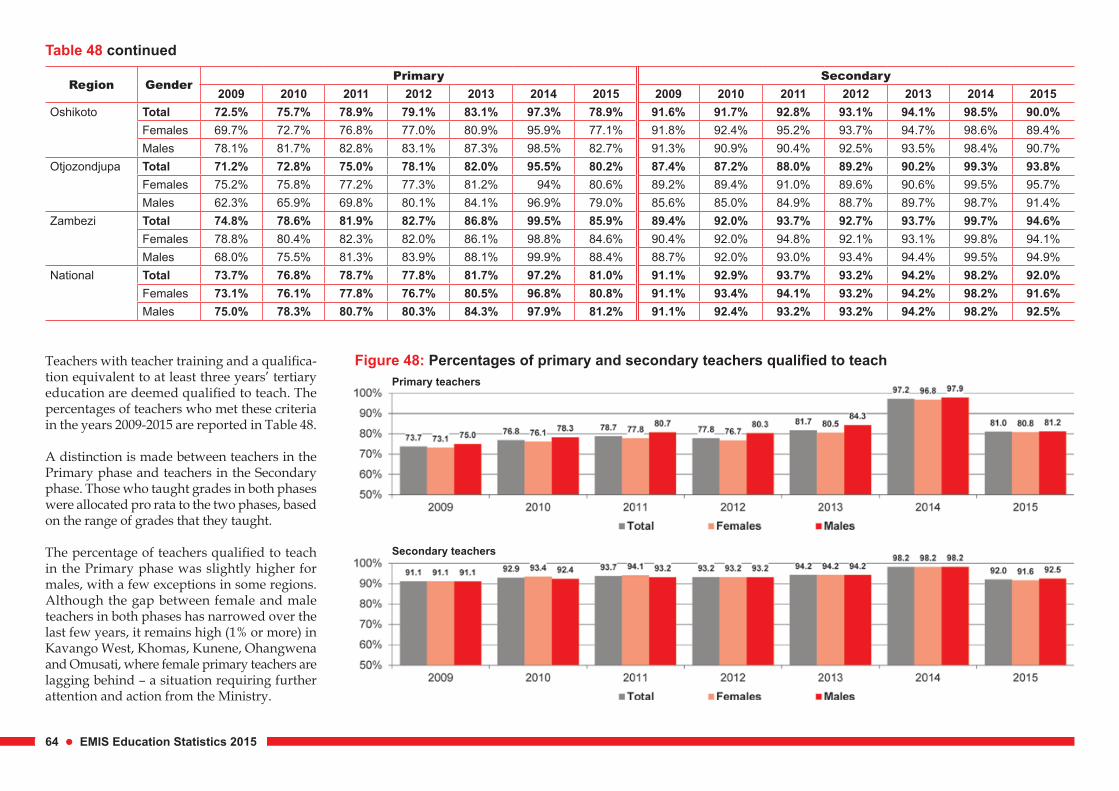
Teachers with teacher training and a qualifica-tion equivalent to at least three years’ tertiary education are deemed qualified to teach. The percentages of teachers who met these criteria in the years 2009-2015 are reported in Table 48.
A distinction is made between teachers in the Primary phase and teachers in the Secondary phase. Those who taught grades in both phases were allocated pro rata to the two phases, based on the range of grades that they taught.
The percentage of teachers qualified to teach in the Primary phase was slightly higher for males, with a few exceptions in some regions. Although the gap between female and male teachers in both phases has narrowed over the last few years, it remains high (1% or more) in Kavango West, Khomas, Kunene, Ohangwena and Omusati, where female primary teachers are lagging behind – a situation requiring further attention and action from the Ministry.
Secondary teachers
Primary teachers
Chapter 5: TEACHERS 65
Table 49: Numbers of teachers from 2009 to 2015
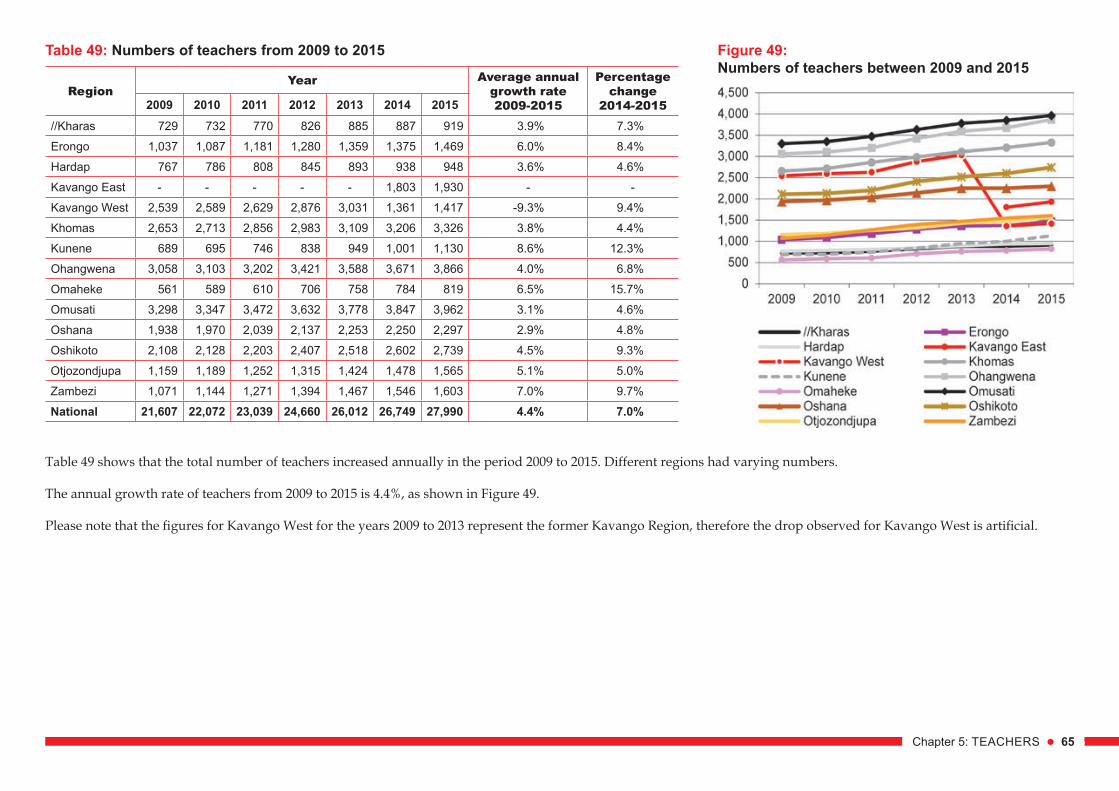
Table 49 shows that the total number of teachers increased annually in the period 2009 to 2015. Different regions had varying numbers.
The annual growth rate of teachers from 2009 to 2015 is 4.4%, as shown in Figure 49.
Please note that the figures for Kavango West for the years 2009 to 2013 represent the former Kavango Region, therefore the drop observed for Kavango West is artificial.
Figure 49:Numbers of teachers between 2009 and 2015
RegionYear Average annual
growth rate 2009-2015
Percentage change
2014-20152009 2010 2011 2012 2013 2014 2015//Kharas 729 732 770 826 885 887 919 3.9% 7.3%Erongo 1,037 1,087 1,181 1,280 1,359 1,375 1,469 6.0% 8.4%Hardap 767 786 808 845 893 938 948 3.6% 4.6%Kavango East - - - - - 1,803 1,930 - -Kavango West 2,539 2,589 2,629 2,876 3,031 1,361 1,417 -9.3% 9.4%Khomas 2,653 2,713 2,856 2,983 3,109 3,206 3,326 3.8% 4.4%Kunene 689 695 746 838 949 1,001 1,130 8.6% 12.3%Ohangwena 3,058 3,103 3,202 3,421 3,588 3,671 3,866 4.0% 6.8%Omaheke 561 589 610 706 758 784 819 6.5% 15.7%Omusati 3,298 3,347 3,472 3,632 3,778 3,847 3,962 3.1% 4.6%Oshana 1,938 1,970 2,039 2,137 2,253 2,250 2,297 2.9% 4.8%Oshikoto 2,108 2,128 2,203 2,407 2,518 2,602 2,739 4.5% 9.3%Otjozondjupa 1,159 1,189 1,252 1,315 1,424 1,478 1,565 5.1% 5.0%Zambezi 1,071 1,144 1,271 1,394 1,467 1,546 1,603 7.0% 9.7%National 21,607 22,072 23,039 24,660 26,012 26,749 27,990 4.4% 7.0%
66 EMIS Education Statistics 2015
Table 50: Learner : teacher ratios from 2009 to 2015
RegionAll schools and teachers Schools staffed by the State and State-appointed teachers
2009 2010 2011 2012 2013 2014 2015 2009 2010 2011 2012 2013 2014 2015//Kharas 26.1 22.0 22.7 24.3 23.3 23.2 23.1 25.3 27.9 27.2 25.9 25.6 24.8 24.7Erongo 27.9 23.9 22.4 25.1 24.9 24.8 24.9 27.3 29.2 28.3 27.2 28.3 27.0 27.2Hardap 27.8 24.8 23.0 25.9 24.9 24.3 24.6 26.9 27.1 27.0 26.2 25.5 24.7 25.1Kavango East - - - - - 27.4 27.6 - - - - - 28.1 28.2Kavango West 28.5 27.2 27.2 26.9 27.3 25.8 25.6 27.8 28.1 28.2 27.3 27.9 26.3 25.4Khomas 26.7 21.8 21.3 24.6 24.4 24.5 24.5 25.5 28.3 28.2 27.4 28.1 27.2 27.2Kunene 25.8 25.7 24.7 24.3 23.4 23.2 22.9 25.8 27.1 25.9 24.4 23.5 23.4 23.3Ohangwena 29.1 28.1 27.8 26.5 25.5 25.4 24.9 28.8 28.5 28.3 26.5 25.5 25.3 24.9Omaheke 27.2 23.2 23.8 26.0 25.7 25.6 25.3 27.8 27.9 28.6 26.4 26.0 25.9 25.7Omusati 28.2 25.5 24.5 23.8 23.1 22.8 22.4 26.3 25.9 25.0 23.8 23.3 22.8 22.5Oshana 28.7 25.4 24.4 23.7 22.9 22.7 22.6 27.0 26.5 25.4 24.0 23.3 22.9 22.8Oshikoto 27.6 26.5 25.8 25.1 24.6 24.1 23.6 27.7 27.8 27.2 25.4 25.2 24.4 23.9Otjozondjupa 29.5 26.1 25.9 27.6 27.0 26.9 26.6 28.7 29.6 29.1 28.6 28.4 27.8 27.5Zambezi 25.7 23.9 24.8 21.4 21.1 20.8 20.9 25.8 24.9 22.8 21.5 21.9 21.0 21.0National 27.8 25.4 24.8 25.1 24.5 24.3 24.1 27.2 27.5 27.0 25.7 25.5 24.9 24.7
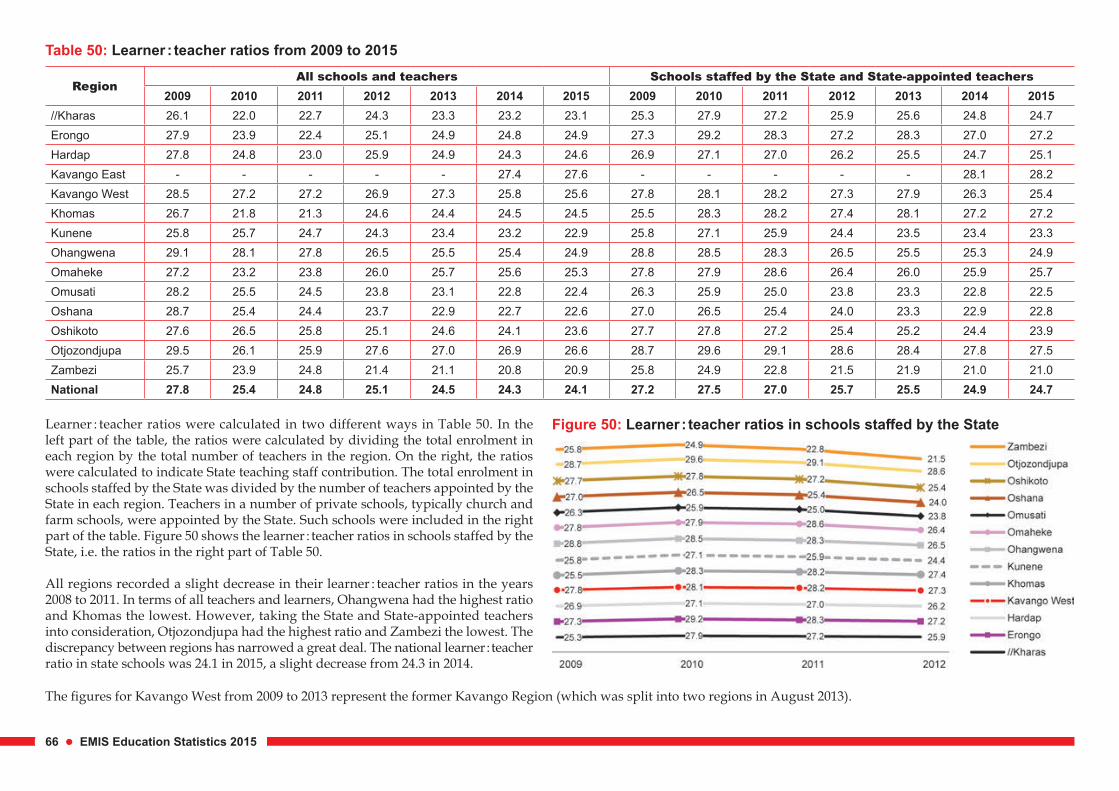
Learner : teacher ratios were calculated in two different ways in Table 50. In the left part of the table, the ratios were calculated by dividing the total enrolment in each region by the total number of teachers in the region. On the right, the ratios were calculated to indicate State teaching staff contribution. The total enrolment in schools staffed by the State was divided by the number of teachers appointed by the State in each region. Teachers in a number of private schools, typically church and farm schools, were appointed by the State. Such schools were included in the right part of the table. Figure 50 shows the learner : teacher ratios in schools staffed by the State, i.e. the ratios in the right part of Table 50.
All regions recorded a slight decrease in their learner : teacher ratios in the years 2008 to 2011. In terms of all teachers and learners, Ohangwena had the highest ratio and Khomas the lowest. However, taking the State and State-appointed teachers into consideration, Otjozondjupa had the highest ratio and Zambezi the lowest. The discrepancy between regions has narrowed a great deal. The national learner : teacher ratio in state schools was 24.1 in 2015, a slight decrease from 24.3 in 2014.
Figure 50: Learner : teacher ratios in schools staffed by the State
The figures for Kavango West from 2009 to 2013 represent the former Kavango Region (which was split into two regions in August 2013).
Chapter 6: PHYSICAL FACILITIES 67
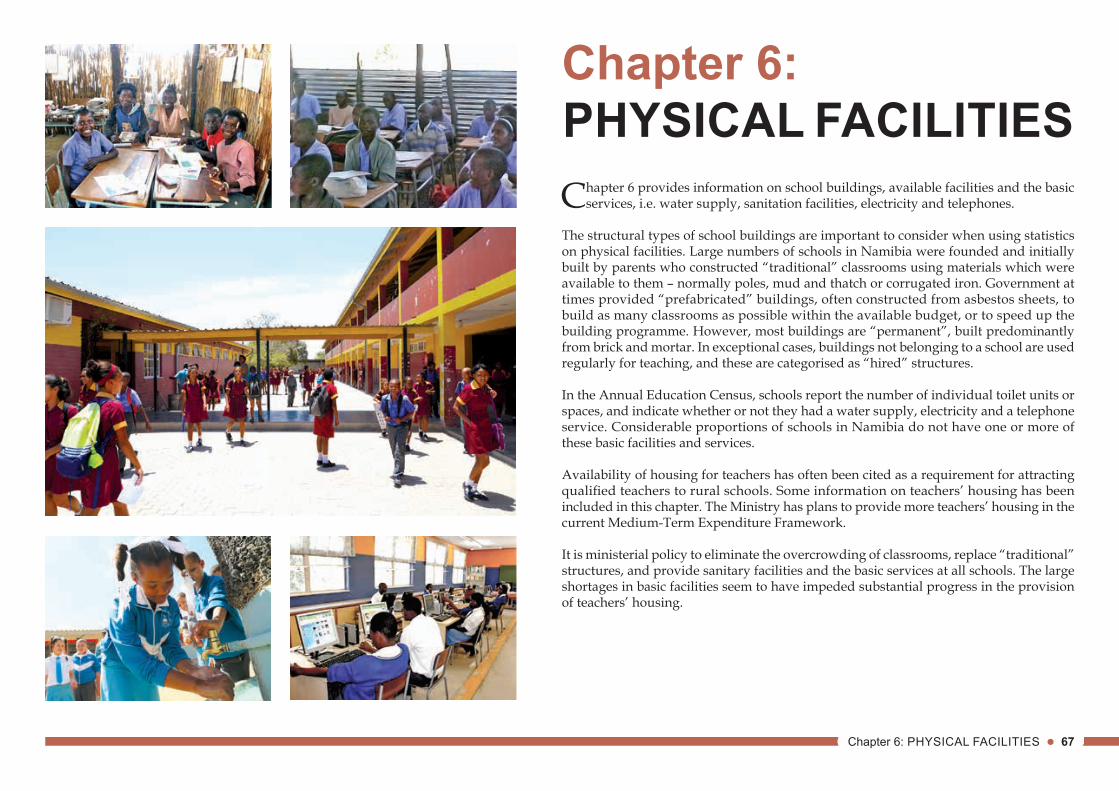
Chapter 6: PHYSICAL FACILITIESChapter 6 provides information on school buildings, available facilities and the basic
services, i.e. water supply, sanitation facilities, electricity and telephones.
The structural types of school buildings are important to consider when using statistics on physical facilities. Large numbers of schools in Namibia were founded and initially built by parents who constructed “traditional” classrooms using materials which were available to them – normally poles, mud and thatch or corrugated iron. Government at times provided “prefabricated” buildings, often constructed from asbestos sheets, to build as many classrooms as possible within the available budget, or to speed up the building programme. However, most buildings are “permanent”, built predominantly from brick and mortar. In exceptional cases, buildings not belonging to a school are used regularly for teaching, and these are categorised as “hired” structures.
In the Annual Education Census, schools report the number of individual toilet units or spaces, and indicate whether or not they had a water supply, electricity and a telephone service. Considerable proportions of schools in Namibia do not have one or more of these basic facilities and services.
Availability of housing for teachers has often been cited as a requirement for attracting qualified teachers to rural schools. Some information on teachers’ housing has been included in this chapter. The Ministry has plans to provide more teachers’ housing in the current Medium-Term Expenditure Framework.
It is ministerial policy to eliminate the overcrowding of classrooms, replace “traditional” structures, and provide sanitary facilities and the basic services at all schools. The large shortages in basic facilities seem to have impeded substantial progress in the provision of teachers’ housing.
68 EMIS Education Statistics 2015
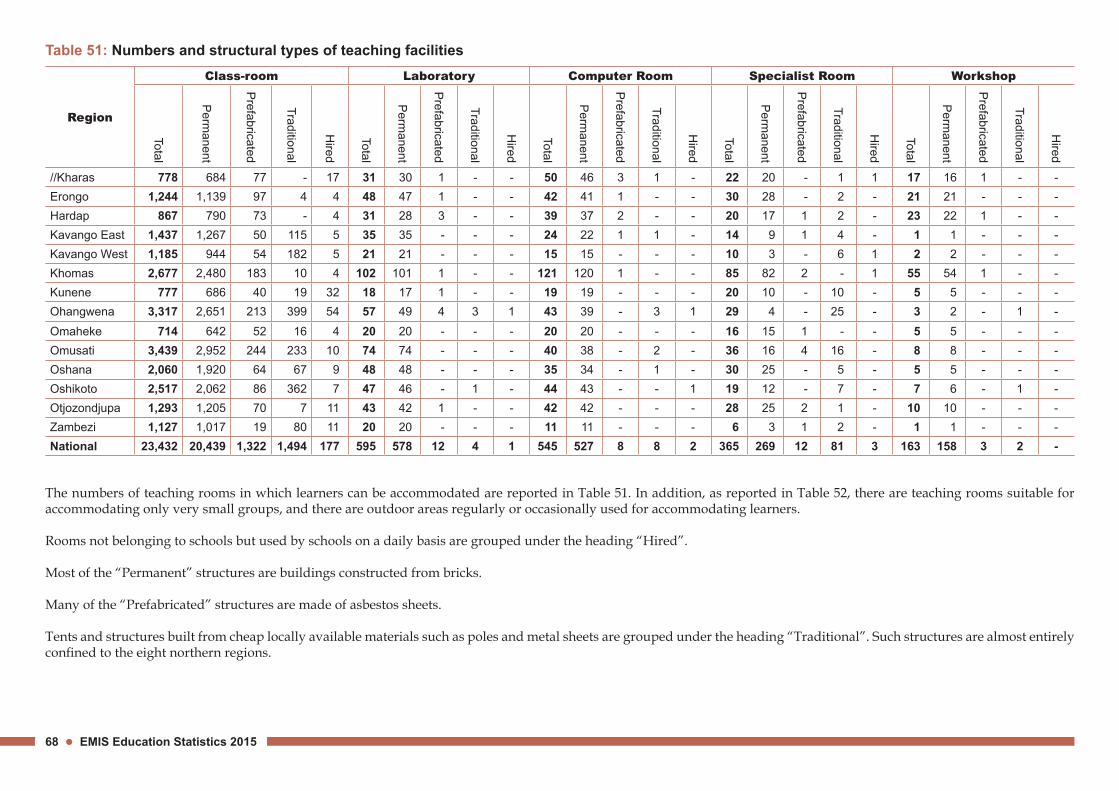
Table 51: Numbers and structural types of teaching facilities
The numbers of teaching rooms in which learners can be accommodated are reported in Table 51. In addition, as reported in Table 52, there are teaching rooms suitable for accommodating only very small groups, and there are outdoor areas regularly or occasionally used for accommodating learners.
Rooms not belonging to schools but used by schools on a daily basis are grouped under the heading “Hired”.
Most of the “Permanent” structures are buildings constructed from bricks.
Many of the “Prefabricated” structures are made of asbestos sheets.
Tents and structures built from cheap locally available materials such as poles and metal sheets are grouped under the heading “Traditional”. Such structures are almost entirely confined to the eight northern regions.
Region
Class-room Laboratory Computer Room Specialist Room Workshop
Total
Permanent
Prefabricated
Traditional
Hired
Total
Permanent
Prefabricated
Traditional
Hired
Total
Permanent
Prefabricated
Traditional
Hired
Total
Permanent
Prefabricated
Traditional
Hired
Total
Permanent
Prefabricated
Traditional
Hired
//Kharas 778 684 77 - 17 31 30 1 - - 50 46 3 1 - 22 20 - 1 1 17 16 1 - -Erongo 1,244 1,139 97 4 4 48 47 1 - - 42 41 1 - - 30 28 - 2 - 21 21 - - -Hardap 867 790 73 - 4 31 28 3 - - 39 37 2 - - 20 17 1 2 - 23 22 1 - -Kavango East 1,437 1,267 50 115 5 35 35 - - - 24 22 1 1 - 14 9 1 4 - 1 1 - - -Kavango West 1,185 944 54 182 5 21 21 - - - 15 15 - - - 10 3 - 6 1 2 2 - - -Khomas 2,677 2,480 183 10 4 102 101 1 - - 121 120 1 - - 85 82 2 - 1 55 54 1 - -Kunene 777 686 40 19 32 18 17 1 - - 19 19 - - - 20 10 - 10 - 5 5 - - -Ohangwena 3,317 2,651 213 399 54 57 49 4 3 1 43 39 - 3 1 29 4 - 25 - 3 2 - 1 -Omaheke 714 642 52 16 4 20 20 - - - 20 20 - - - 16 15 1 - - 5 5 - - -Omusati 3,439 2,952 244 233 10 74 74 - - - 40 38 - 2 - 36 16 4 16 - 8 8 - - -Oshana 2,060 1,920 64 67 9 48 48 - - - 35 34 - 1 - 30 25 - 5 - 5 5 - - -Oshikoto 2,517 2,062 86 362 7 47 46 - 1 - 44 43 - - 1 19 12 - 7 - 7 6 - 1 -Otjozondjupa 1,293 1,205 70 7 11 43 42 1 - - 42 42 - - - 28 25 2 1 - 10 10 - - -Zambezi 1,127 1,017 19 80 11 20 20 - - - 11 11 - - - 6 3 1 2 - 1 1 - - -National 23,432 20,439 1,322 1,494 177 595 578 12 4 1 545 527 8 8 2 365 269 12 81 3 163 158 3 2 -
Chapter 6: PHYSICAL FACILITIES 69
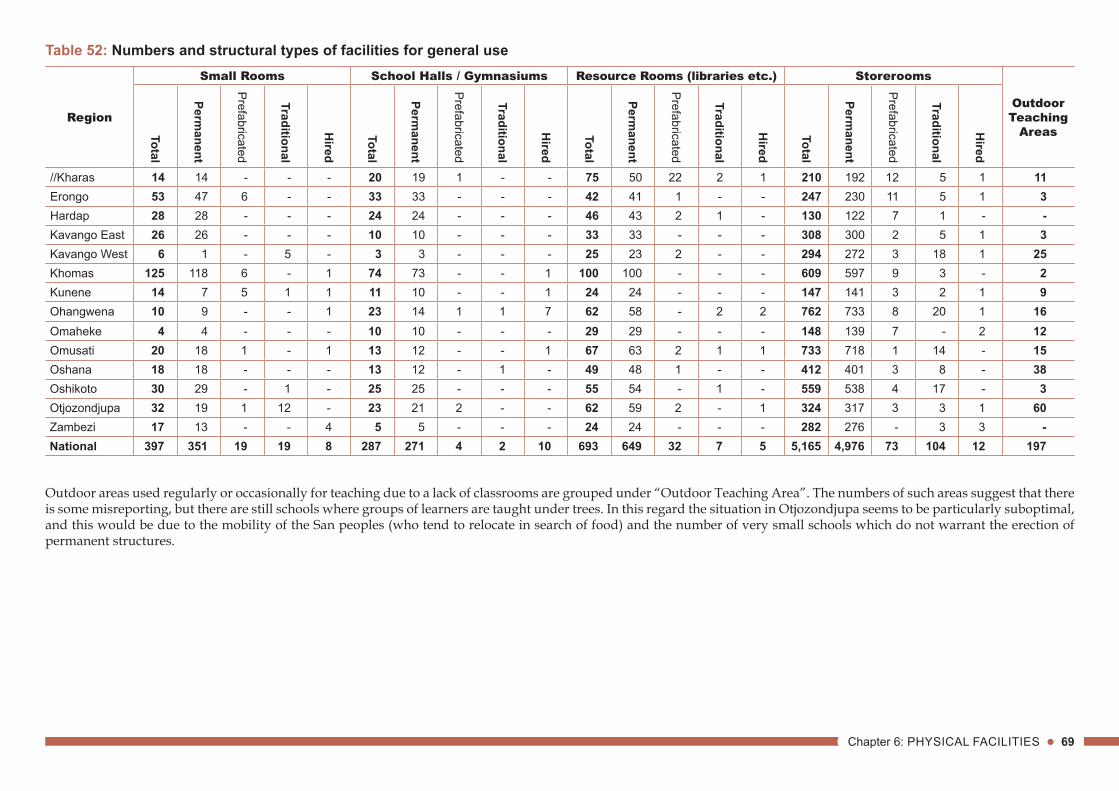
Table 52: Numbers and structural types of facilities for general use
Outdoor areas used regularly or occasionally for teaching due to a lack of classrooms are grouped under “Outdoor Teaching Area”. The numbers of such areas suggest that there is some misreporting, but there are still schools where groups of learners are taught under trees. In this regard the situation in Otjozondjupa seems to be particularly suboptimal, and this would be due to the mobility of the San peoples (who tend to relocate in search of food) and the number of very small schools which do not warrant the erection of permanent structures.
Region
Small Rooms School Halls / Gymnasiums Resource Rooms (libraries etc.) Storerooms
Outdoor Teaching
AreasTotal
Permanent
Prefabricated
Traditional
Hired
Total
Permanent
Prefabricated
Traditional
Hired
Total
Permanent
Prefabricated
Traditional
Hired
Total
Permanent
Prefabricated
Traditional
Hired
//Kharas 14 14 - - - 20 19 1 - - 75 50 22 2 1 210 192 12 5 1 11Erongo 53 47 6 - - 33 33 - - - 42 41 1 - - 247 230 11 5 1 3Hardap 28 28 - - - 24 24 - - - 46 43 2 1 - 130 122 7 1 - -Kavango East 26 26 - - - 10 10 - - - 33 33 - - - 308 300 2 5 1 3Kavango West 6 1 - 5 - 3 3 - - - 25 23 2 - - 294 272 3 18 1 25Khomas 125 118 6 - 1 74 73 - - 1 100 100 - - - 609 597 9 3 - 2Kunene 14 7 5 1 1 11 10 - - 1 24 24 - - - 147 141 3 2 1 9Ohangwena 10 9 - - 1 23 14 1 1 7 62 58 - 2 2 762 733 8 20 1 16Omaheke 4 4 - - - 10 10 - - - 29 29 - - - 148 139 7 - 2 12Omusati 20 18 1 - 1 13 12 - - 1 67 63 2 1 1 733 718 1 14 - 15Oshana 18 18 - - - 13 12 - 1 - 49 48 1 - - 412 401 3 8 - 38Oshikoto 30 29 - 1 - 25 25 - - - 55 54 - 1 - 559 538 4 17 - 3Otjozondjupa 32 19 1 12 - 23 21 2 - - 62 59 2 - 1 324 317 3 3 1 60Zambezi 17 13 - - 4 5 5 - - - 24 24 - - - 282 276 - 3 3 -National 397 351 19 19 8 287 271 4 2 10 693 649 32 7 5 5,165 4,976 73 104 12 197
70 EMIS Education Statistics 2015
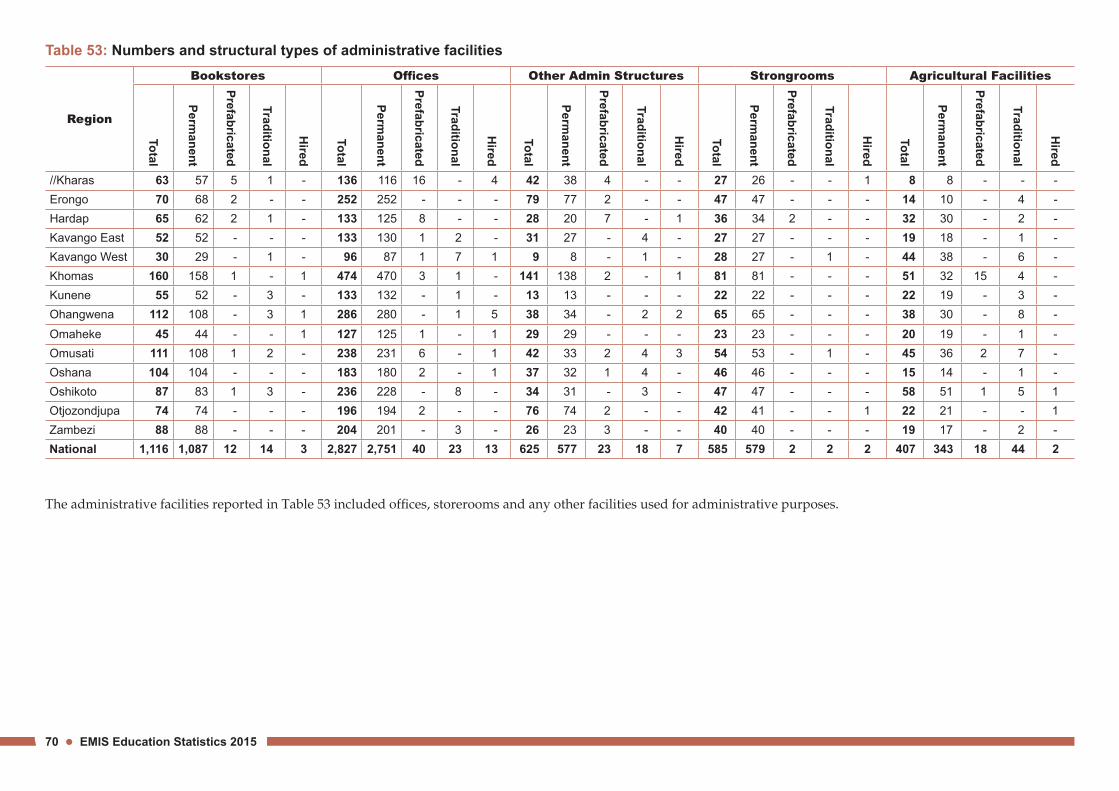
Table 53: Numbers and structural types of administrative facilities
The administrative facilities reported in Table 53 included offices, storerooms and any other facilities used for administrative purposes.
Region
Bookstores Offices Other Admin Structures Strongrooms Agricultural Facilities
Total
Permanent
Prefabricated
Traditional
Hired
Total
Permanent
Prefabricated
Traditional
Hired
Total
Permanent
Prefabricated
Traditional
Hired
Total
Permanent
Prefabricated
Traditional
Hired
Total
Permanent
Prefabricated
Traditional
Hired
//Kharas 63 57 5 1 - 136 116 16 - 4 42 38 4 - - 27 26 - - 1 8 8 - - -Erongo 70 68 2 - - 252 252 - - - 79 77 2 - - 47 47 - - - 14 10 - 4 -Hardap 65 62 2 1 - 133 125 8 - - 28 20 7 - 1 36 34 2 - - 32 30 - 2 -Kavango East 52 52 - - - 133 130 1 2 - 31 27 - 4 - 27 27 - - - 19 18 - 1 -Kavango West 30 29 - 1 - 96 87 1 7 1 9 8 - 1 - 28 27 - 1 - 44 38 - 6 -Khomas 160 158 1 - 1 474 470 3 1 - 141 138 2 - 1 81 81 - - - 51 32 15 4 -Kunene 55 52 - 3 - 133 132 - 1 - 13 13 - - - 22 22 - - - 22 19 - 3 -Ohangwena 112 108 - 3 1 286 280 - 1 5 38 34 - 2 2 65 65 - - - 38 30 - 8 -Omaheke 45 44 - - 1 127 125 1 - 1 29 29 - - - 23 23 - - - 20 19 - 1 -Omusati 111 108 1 2 - 238 231 6 - 1 42 33 2 4 3 54 53 - 1 - 45 36 2 7 -Oshana 104 104 - - - 183 180 2 - 1 37 32 1 4 - 46 46 - - - 15 14 - 1 -Oshikoto 87 83 1 3 - 236 228 - 8 - 34 31 - 3 - 47 47 - - - 58 51 1 5 1Otjozondjupa 74 74 - - - 196 194 2 - - 76 74 2 - - 42 41 - - 1 22 21 - - 1Zambezi 88 88 - - - 204 201 - 3 - 26 23 3 - - 40 40 - - - 19 17 - 2 -National 1,116 1,087 12 14 3 2,827 2,751 40 23 13 625 577 23 18 7 585 579 2 2 2 407 343 18 44 2
Chapter 6: PHYSICAL FACILITIES 71
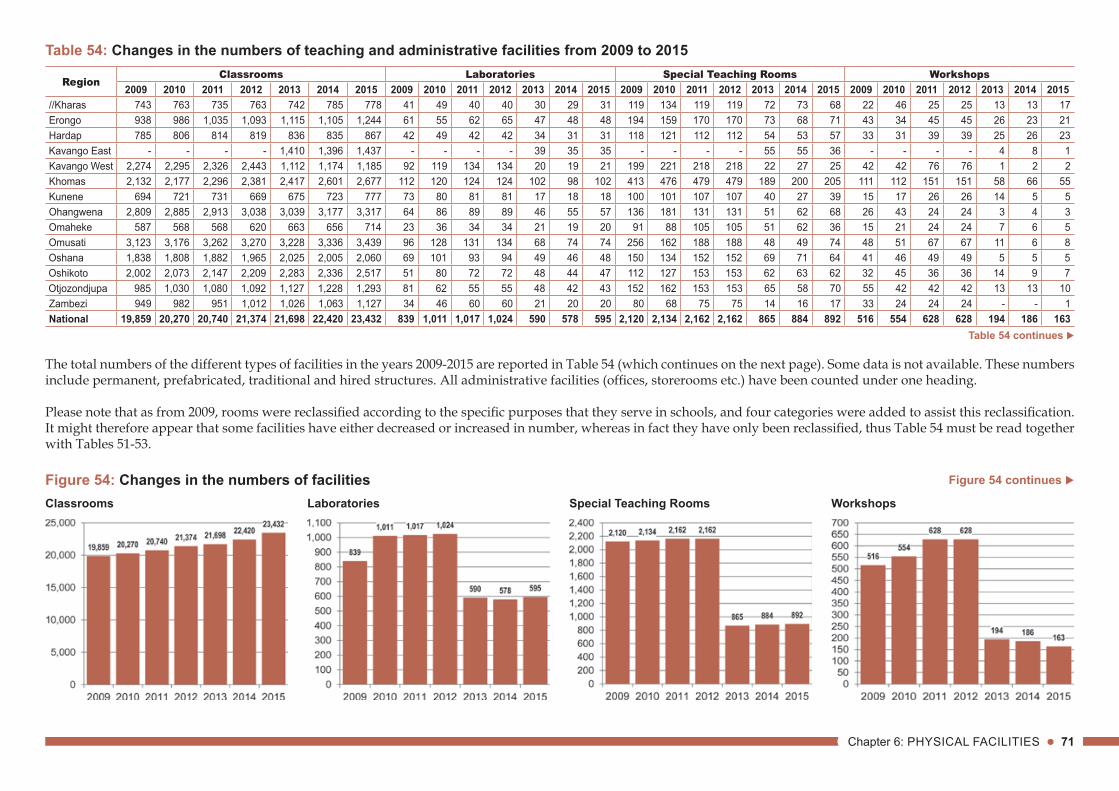
Table 54: Changes in the numbers of teaching and administrative facilities from 2009 to 2015
The total numbers of the different types of facilities in the years 2009-2015 are reported in Table 54 (which continues on the next page). Some data is not available. These numbers include permanent, prefabricated, traditional and hired structures. All administrative facilities (offices, storerooms etc.) have been counted under one heading.
Please note that as from 2009, rooms were reclassified according to the specific purposes that they serve in schools, and four categories were added to assist this reclassification. It might therefore appear that some facilities have either decreased or increased in number, whereas in fact they have only been reclassified, thus Table 54 must be read together with Tables 51-53.
Table 54 continues
Figure 54: Changes in the numbers of facilitiesClassrooms Laboratories Special Teaching Rooms Workshops
Figure 54 continues
Region Classrooms Laboratories Special Teaching Rooms Workshops
2009 2010 2011 2012 2013 2014 2015 2009 2010 2011 2012 2013 2014 2015 2009 2010 2011 2012 2013 2014 2015 2009 2010 2011 2012 2013 2014 2015//Kharas 743 763 735 763 742 785 778 41 49 40 40 30 29 31 119 134 119 119 72 73 68 22 46 25 25 13 13 17Erongo 938 986 1,035 1,093 1,115 1,105 1,244 61 55 62 65 47 48 48 194 159 170 170 73 68 71 43 34 45 45 26 23 21Hardap 785 806 814 819 836 835 867 42 49 42 42 34 31 31 118 121 112 112 54 53 57 33 31 39 39 25 26 23Kavango East - - - - 1,410 1,396 1,437 - - - - 39 35 35 - - - - 55 55 36 - - - - 4 8 1Kavango West 2,274 2,295 2,326 2,443 1,112 1,174 1,185 92 119 134 134 20 19 21 199 221 218 218 22 27 25 42 42 76 76 1 2 2Khomas 2,132 2,177 2,296 2,381 2,417 2,601 2,677 112 120 124 124 102 98 102 413 476 479 479 189 200 205 111 112 151 151 58 66 55Kunene 694 721 731 669 675 723 777 73 80 81 81 17 18 18 100 101 107 107 40 27 39 15 17 26 26 14 5 5Ohangwena 2,809 2,885 2,913 3,038 3,039 3,177 3,317 64 86 89 89 46 55 57 136 181 131 131 51 62 68 26 43 24 24 3 4 3Omaheke 587 568 568 620 663 656 714 23 36 34 34 21 19 20 91 88 105 105 51 62 36 15 21 24 24 7 6 5Omusati 3,123 3,176 3,262 3,270 3,228 3,336 3,439 96 128 131 134 68 74 74 256 162 188 188 48 49 74 48 51 67 67 11 6 8Oshana 1,838 1,808 1,882 1,965 2,025 2,005 2,060 69 101 93 94 49 46 48 150 134 152 152 69 71 64 41 46 49 49 5 5 5Oshikoto 2,002 2,073 2,147 2,209 2,283 2,336 2,517 51 80 72 72 48 44 47 112 127 153 153 62 63 62 32 45 36 36 14 9 7Otjozondjupa 985 1,030 1,080 1,092 1,127 1,228 1,293 81 62 55 55 48 42 43 152 162 153 153 65 58 70 55 42 42 42 13 13 10Zambezi 949 982 951 1,012 1,026 1,063 1,127 34 46 60 60 21 20 20 80 68 75 75 14 16 17 33 24 24 24 - - 1National 19,859 20,270 20,740 21,374 21,698 22,420 23,432 839 1,011 1,017 1,024 590 578 595 2,120 2,134 2,162 2,162 865 884 892 516 554 628 628 194 186 163
72 EMIS Education Statistics 2015
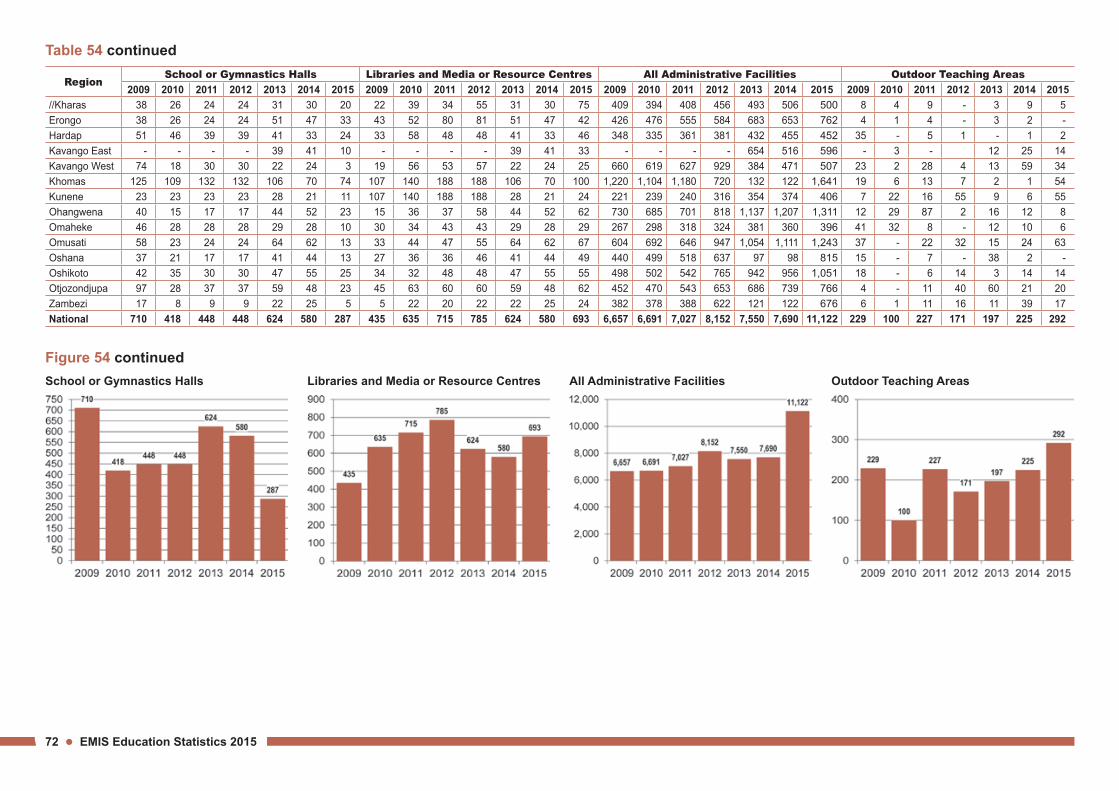
Table 54 continued
Figure 54 continuedSchool or Gymnastics Halls Libraries and Media or Resource Centres All Administrative Facilities Outdoor Teaching Areas
RegionSchool or Gymnastics Halls Libraries and Media or Resource Centres All Administrative Facilities Outdoor Teaching Areas
2009 2010 2011 2012 2013 2014 2015 2009 2010 2011 2012 2013 2014 2015 2009 2010 2011 2012 2013 2014 2015 2009 2010 2011 2012 2013 2014 2015//Kharas 38 26 24 24 31 30 20 22 39 34 55 31 30 75 409 394 408 456 493 506 500 8 4 9 - 3 9 5Erongo 38 26 24 24 51 47 33 43 52 80 81 51 47 42 426 476 555 584 683 653 762 4 1 4 - 3 2 -Hardap 51 46 39 39 41 33 24 33 58 48 48 41 33 46 348 335 361 381 432 455 452 35 - 5 1 - 1 2Kavango East - - - - 39 41 10 - - - - 39 41 33 - - - - 654 516 596 - 3 - 12 25 14Kavango West 74 18 30 30 22 24 3 19 56 53 57 22 24 25 660 619 627 929 384 471 507 23 2 28 4 13 59 34Khomas 125 109 132 132 106 70 74 107 140 188 188 106 70 100 1,220 1,104 1,180 720 132 122 1,641 19 6 13 7 2 1 54Kunene 23 23 23 23 28 21 11 107 140 188 188 28 21 24 221 239 240 316 354 374 406 7 22 16 55 9 6 55Ohangwena 40 15 17 17 44 52 23 15 36 37 58 44 52 62 730 685 701 818 1,137 1,207 1,311 12 29 87 2 16 12 8Omaheke 46 28 28 28 29 28 10 30 34 43 43 29 28 29 267 298 318 324 381 360 396 41 32 8 - 12 10 6Omusati 58 23 24 24 64 62 13 33 44 47 55 64 62 67 604 692 646 947 1,054 1,111 1,243 37 - 22 32 15 24 63Oshana 37 21 17 17 41 44 13 27 36 36 46 41 44 49 440 499 518 637 97 98 815 15 - 7 - 38 2 -Oshikoto 42 35 30 30 47 55 25 34 32 48 48 47 55 55 498 502 542 765 942 956 1,051 18 - 6 14 3 14 14Otjozondjupa 97 28 37 37 59 48 23 45 63 60 60 59 48 62 452 470 543 653 686 739 766 4 - 11 40 60 21 20Zambezi 17 8 9 9 22 25 5 5 22 20 22 22 25 24 382 378 388 622 121 122 676 6 1 11 16 11 39 17National 710 418 448 448 624 580 287 435 635 715 785 624 580 693 6,657 6,691 7,027 8,152 7,550 7,690 11,122 229 100 227 171 197 225 292
Chapter 6: PHYSICAL FACILITIES 73
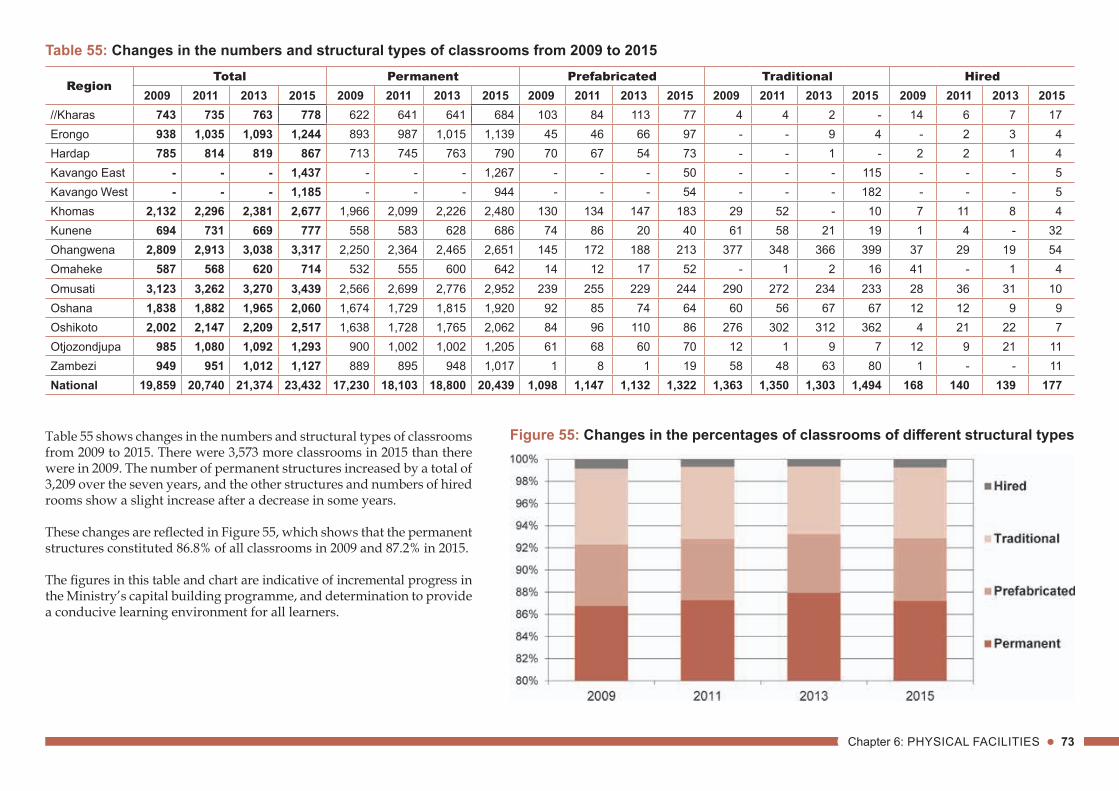
Table 55: Changes in the numbers and structural types of classrooms from 2009 to 2015
Table 55 shows changes in the numbers and structural types of classrooms from 2009 to 2015. There were 3,573 more classrooms in 2015 than there were in 2009. The number of permanent structures increased by a total of 3,209 over the seven years, and the other structures and numbers of hired rooms show a slight increase after a decrease in some years.
These changes are reflected in Figure 55, which shows that the permanent structures constituted 86.8% of all classrooms in 2009 and 87.2% in 2015.
The figures in this table and chart are indicative of incremental progress in the Ministry’s capital building programme, and determination to provide a conducive learning environment for all learners.
Figure 55: Changes in the percentages of classrooms of different structural types
RegionTotal Permanent Prefabricated Traditional Hired
2009 2011 2013 2015 2009 2011 2013 2015 2009 2011 2013 2015 2009 2011 2013 2015 2009 2011 2013 2015//Kharas 743 735 763 778 622 641 641 684 103 84 113 77 4 4 2 - 14 6 7 17Erongo 938 1,035 1,093 1,244 893 987 1,015 1,139 45 46 66 97 - - 9 4 - 2 3 4Hardap 785 814 819 867 713 745 763 790 70 67 54 73 - - 1 - 2 2 1 4Kavango East - - - 1,437 - - - 1,267 - - - 50 - - - 115 - - - 5Kavango West - - - 1,185 - - - 944 - - - 54 - - - 182 - - - 5Khomas 2,132 2,296 2,381 2,677 1,966 2,099 2,226 2,480 130 134 147 183 29 52 - 10 7 11 8 4Kunene 694 731 669 777 558 583 628 686 74 86 20 40 61 58 21 19 1 4 - 32Ohangwena 2,809 2,913 3,038 3,317 2,250 2,364 2,465 2,651 145 172 188 213 377 348 366 399 37 29 19 54Omaheke 587 568 620 714 532 555 600 642 14 12 17 52 - 1 2 16 41 - 1 4Omusati 3,123 3,262 3,270 3,439 2,566 2,699 2,776 2,952 239 255 229 244 290 272 234 233 28 36 31 10Oshana 1,838 1,882 1,965 2,060 1,674 1,729 1,815 1,920 92 85 74 64 60 56 67 67 12 12 9 9Oshikoto 2,002 2,147 2,209 2,517 1,638 1,728 1,765 2,062 84 96 110 86 276 302 312 362 4 21 22 7Otjozondjupa 985 1,080 1,092 1,293 900 1,002 1,002 1,205 61 68 60 70 12 1 9 7 12 9 21 11Zambezi 949 951 1,012 1,127 889 895 948 1,017 1 8 1 19 58 48 63 80 1 - - 11National 19,859 20,740 21,374 23,432 17,230 18,103 18,800 20,439 1,098 1,147 1,132 1,322 1,363 1,350 1,303 1,494 168 140 139 177
74 EMIS Education Statistics 2015
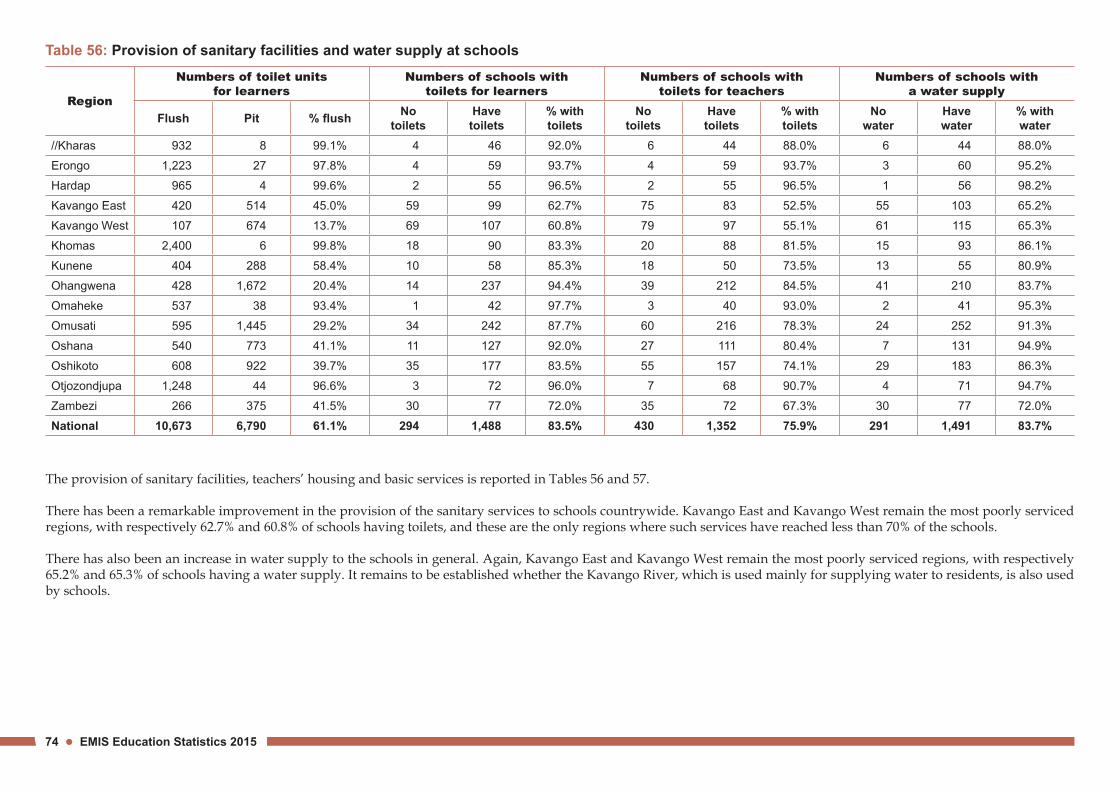
Table 56: Provision of sanitary facilities and water supply at schools
Region
Numbers of toilet unitsfor learners
Numbers of schools withtoilets for learners
Numbers of schools withtoilets for teachers
Numbers of schools witha water supply
Flush Pit % flush Notoilets
Havetoilets
% withtoilets
Notoilets
Havetoilets
% withtoilets
Nowater
Havewater
% withwater
//Kharas 932 8 99.1% 4 46 92.0% 6 44 88.0% 6 44 88.0%Erongo 1,223 27 97.8% 4 59 93.7% 4 59 93.7% 3 60 95.2%Hardap 965 4 99.6% 2 55 96.5% 2 55 96.5% 1 56 98.2%Kavango East 420 514 45.0% 59 99 62.7% 75 83 52.5% 55 103 65.2%Kavango West 107 674 13.7% 69 107 60.8% 79 97 55.1% 61 115 65.3%Khomas 2,400 6 99.8% 18 90 83.3% 20 88 81.5% 15 93 86.1%Kunene 404 288 58.4% 10 58 85.3% 18 50 73.5% 13 55 80.9%Ohangwena 428 1,672 20.4% 14 237 94.4% 39 212 84.5% 41 210 83.7%Omaheke 537 38 93.4% 1 42 97.7% 3 40 93.0% 2 41 95.3%Omusati 595 1,445 29.2% 34 242 87.7% 60 216 78.3% 24 252 91.3%Oshana 540 773 41.1% 11 127 92.0% 27 111 80.4% 7 131 94.9%Oshikoto 608 922 39.7% 35 177 83.5% 55 157 74.1% 29 183 86.3%Otjozondjupa 1,248 44 96.6% 3 72 96.0% 7 68 90.7% 4 71 94.7%Zambezi 266 375 41.5% 30 77 72.0% 35 72 67.3% 30 77 72.0%National 10,673 6,790 61.1% 294 1,488 83.5% 430 1,352 75.9% 291 1,491 83.7%
The provision of sanitary facilities, teachers’ housing and basic services is reported in Tables 56 and 57.
There has been a remarkable improvement in the provision of the sanitary services to schools countrywide. Kavango East and Kavango West remain the most poorly serviced regions, with respectively 62.7% and 60.8% of schools having toilets, and these are the only regions where such services have reached less than 70% of the schools.
There has also been an increase in water supply to the schools in general. Again, Kavango East and Kavango West remain the most poorly serviced regions, with respectively 65.2% and 65.3% of schools having a water supply. It remains to be established whether the Kavango River, which is used mainly for supplying water to residents, is also used by schools.

Chapter 6: PHYSICAL FACILITIES 75
Table 57: Provision of teachers’ housing and electricity and telephone supply at schools
Provision of housing for teachers remains very poor in the northern regions, with less than 50% of the schools in Kavango East, Kavango West, Ohangwena, Oshikoto, Omusati, Oshana and Zambezi offering teachers’ housing. In contrast, more than 50% of the schools in Kunene, Otjozondjupa, Omaheke, Hardap and //Kharas offered teachers’ housing. The disparities in the supply of teachers’ housing are also evident in the numbers of housing units. The lack of teachers’ housing was often cited as a constraint to attracting qualified teachers to schools in northern Namibia. Lower numbers in Khomas and Erongo make evident that more teachers in these regions benefit from the Government Housing Scheme. This is because the majority of these regions’ schools are in proclaimed areas – a benefit that rural teachers cannot enjoy.
Although there has been gradual improvement in the provision of electricity to the schools, many schools in the northern regions still have no electricity supply. The situation is especially alarming in Kavango West where half of the schools have no electricity. The absence of electricity places constraints on the equipment that schools can use, and makes it difficult to use school facilities after dark.
The lack of a telephone service severely limits communication with support staff in regional offices (e.g. inspectors, advisory teachers and personnel officers) and, importantly, with parents and service providers. Kavango East, Kavango West and Zambezi are the most poorly serviced regions in this regard, with telephone services provided in less than 50% of the schools.
Region
Numbers of housing unitsfor teachers
Numbers of schools withhousing for teachers
Numbers of schools withelectricity supply
Numbers of schools withtelephones
Total Singlequarters
Familyquarters
Nohousing
Havehousing
% withhousing
Noelectricity
Haveelectricity
% withelectricity
Notelephone
Havetelephone
% withtelephone
//Kharas 186 89 97 21 29 58.0% 5 45 90.0% 5 45 90.0%Erongo 184 136 48 32 31 49.2% 5 58 92.1% 4 59 93.7%Hardap 216 121 95 14 43 75.4% 2 55 96.5% 4 53 93.0%Kavango East 176 87 89 125 33 20.9% 54 104 65.8% 86 72 45.6%Kavango West 93 68 25 152 24 13.6% 87 89 50.6% 115 61 34.7%Khomas 302 184 118 65 43 39.8% 16 92 85.2% 18 90 83.3%Kunene 265 180 85 20 48 70.6% 19 49 72.1% 17 51 75.0%Ohangwena 273 146 127 162 89 35.5% 68 183 72.9% 105 146 58.2%Omaheke 300 139 161 5 38 88.4% 3 40 93.0% 5 38 88.4%Omusati 319 196 123 217 59 21.4% 59 217 78.6% 132 144 52.2%Oshana 119 79 40 111 27 19.6% 14 124 89.9% 36 102 73.9%Oshikoto 219 144 75 146 66 31.1% 79 133 62.7% 91 121 57.1%Otjozondjupa 373 180 193 24 51 68.0% 8 67 89.3% 12 63 84.0%Zambezi 119 73 46 71 36 33.6% 27 80 74.8% 62 45 42.1%National 3,144 1,822 1,322 1,165 617 34.6% 446 1,336 75.0% 692 1,090 61.2%
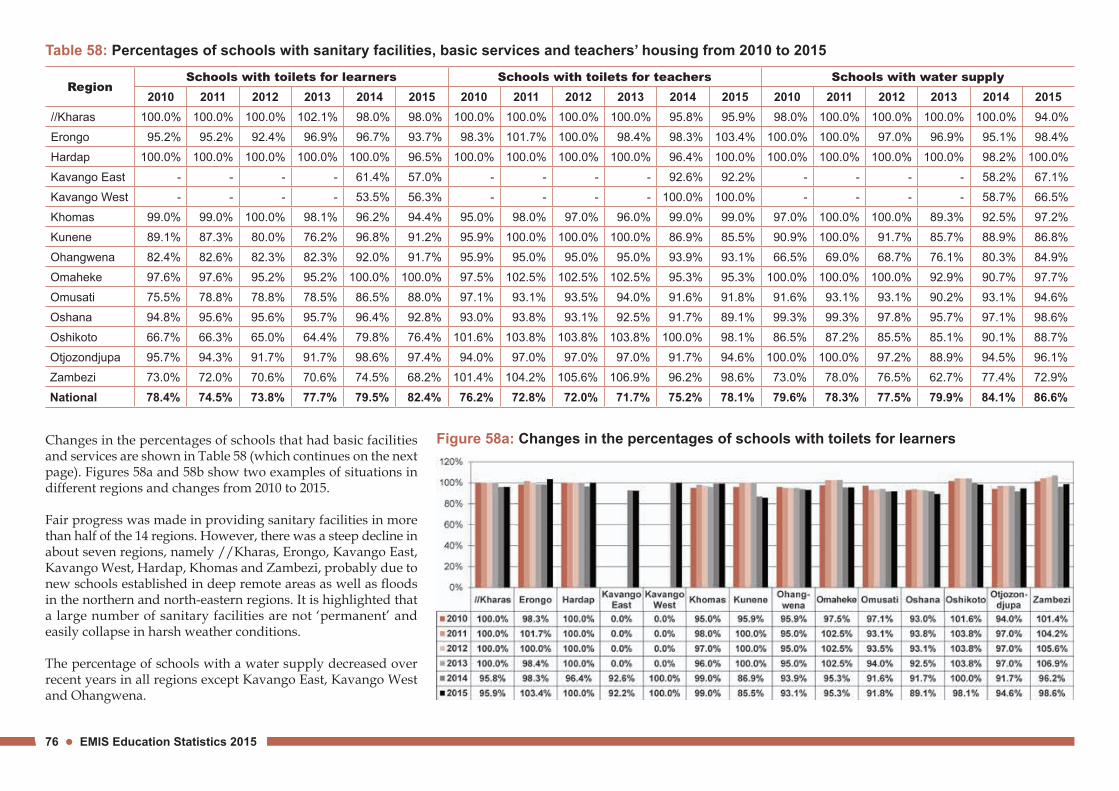
76 EMIS Education Statistics 2015
Table 58: Percentages of schools with sanitary facilities, basic services and teachers’ housing from 2010 to 2015
Changes in the percentages of schools that had basic facilities and services are shown in Table 58 (which continues on the next page). Figures 58a and 58b show two examples of situations in different regions and changes from 2010 to 2015.
Fair progress was made in providing sanitary facilities in more than half of the 14 regions. However, there was a steep decline in about seven regions, namely //Kharas, Erongo, Kavango East, Kavango West, Hardap, Khomas and Zambezi, probably due to new schools established in deep remote areas as well as floods in the northern and north-eastern regions. It is highlighted that a large number of sanitary facilities are not ‘permanent’ and easily collapse in harsh weather conditions.
The percentage of schools with a water supply decreased over recent years in all regions except Kavango East, Kavango West and Ohangwena.
Figure 58a: Changes in the percentages of schools with toilets for learners
RegionSchools with toilets for learners Schools with toilets for teachers Schools with water supply
2010 2011 2012 2013 2014 2015 2010 2011 2012 2013 2014 2015 2010 2011 2012 2013 2014 2015//Kharas 100.0% 100.0% 100.0% 102.1% 98.0% 98.0% 100.0% 100.0% 100.0% 100.0% 95.8% 95.9% 98.0% 100.0% 100.0% 100.0% 100.0% 94.0%Erongo 95.2% 95.2% 92.4% 96.9% 96.7% 93.7% 98.3% 101.7% 100.0% 98.4% 98.3% 103.4% 100.0% 100.0% 97.0% 96.9% 95.1% 98.4%Hardap 100.0% 100.0% 100.0% 100.0% 100.0% 96.5% 100.0% 100.0% 100.0% 100.0% 96.4% 100.0% 100.0% 100.0% 100.0% 100.0% 98.2% 100.0%Kavango East - - - - 61.4% 57.0% - - - - 92.6% 92.2% - - - - 58.2% 67.1%Kavango West - - - - 53.5% 56.3% - - - - 100.0% 100.0% - - - - 58.7% 66.5%Khomas 99.0% 99.0% 100.0% 98.1% 96.2% 94.4% 95.0% 98.0% 97.0% 96.0% 99.0% 99.0% 97.0% 100.0% 100.0% 89.3% 92.5% 97.2%Kunene 89.1% 87.3% 80.0% 76.2% 96.8% 91.2% 95.9% 100.0% 100.0% 100.0% 86.9% 85.5% 90.9% 100.0% 91.7% 85.7% 88.9% 86.8%Ohangwena 82.4% 82.6% 82.3% 82.3% 92.0% 91.7% 95.9% 95.0% 95.0% 95.0% 93.9% 93.1% 66.5% 69.0% 68.7% 76.1% 80.3% 84.9%Omaheke 97.6% 97.6% 95.2% 95.2% 100.0% 100.0% 97.5% 102.5% 102.5% 102.5% 95.3% 95.3% 100.0% 100.0% 100.0% 92.9% 90.7% 97.7%Omusati 75.5% 78.8% 78.8% 78.5% 86.5% 88.0% 97.1% 93.1% 93.5% 94.0% 91.6% 91.8% 91.6% 93.1% 93.1% 90.2% 93.1% 94.6%Oshana 94.8% 95.6% 95.6% 95.7% 96.4% 92.8% 93.0% 93.8% 93.1% 92.5% 91.7% 89.1% 99.3% 99.3% 97.8% 95.7% 97.1% 98.6%Oshikoto 66.7% 66.3% 65.0% 64.4% 79.8% 76.4% 101.6% 103.8% 103.8% 103.8% 100.0% 98.1% 86.5% 87.2% 85.5% 85.1% 90.1% 88.7%Otjozondjupa 95.7% 94.3% 91.7% 91.7% 98.6% 97.4% 94.0% 97.0% 97.0% 97.0% 91.7% 94.6% 100.0% 100.0% 97.2% 88.9% 94.5% 96.1%Zambezi 73.0% 72.0% 70.6% 70.6% 74.5% 68.2% 101.4% 104.2% 105.6% 106.9% 96.2% 98.6% 73.0% 78.0% 76.5% 62.7% 77.4% 72.9%National 78.4% 74.5% 73.8% 77.7% 79.5% 82.4% 76.2% 72.8% 72.0% 71.7% 75.2% 78.1% 79.6% 78.3% 77.5% 79.9% 84.1% 86.6%

Chapter 6: PHYSICAL FACILITIES 77
Table 58 continued
Some progress was made with the provision of electricity to schools in the northern regions from 2010 to 2015. The three regions with the lowest percentages of schools with electricity from 2010 to 2015 – and which are serviced far below the national average in this regard – are Oshikoto, Kavango East and Kavango West.
The schools in Kavango East, Kavango West, Omusati and Zambezi were relatively poorly serviced with telecommunications.
All regions apart from //Kharas, Omaheke and Otjozondjupa had relatively low percentages of schools with teachers’ housing.
Figure 58b: Changes in the percentages of schools with electricity
RegionSchools with electricity Schools with telephone Schools with teachers' housing
2010 2011 2012 2013 2014 2015 2010 2011 2012 2013 2014 2015 2010 2011 2012 2013 2014 2015//Kharas 98.0% 98.0% 98.0% 108.3% 100.0% 96.0% 100.0% 100.0% 100.0% 66.7% 100.0% 96.0% 65.3% 71.4% 71.4% 72.9% 63.3% 60.0%Erongo 98.4% 95.2% 90.9% 96.9% 95.1% 95.2% 100.0% 100.0% 95.5% 98.4% 93.4% 96.8% 38.7% 39.7% 39.4% 42.2% 44.3% 44.4%Hardap 100.0% 96.4% 98.2% 100.0% 98.2% 96.5% 100.0% 100.0% 100.0% 100.0% 96.4% 93.0% 73.2% 75.0% 76.4% 76.4% 73.2% 70.2%Kavango East - - - - 64.7% 68.4% - - - - 45.8% 48.7% - - - - 17.6% 20.3%Kavango West - - - - 44.8% 51.7% - - - - 36.0% 35.8% - - - - 12.8% 11.9%Khomas 100.0% 98.0% 98.0% 89.3% 91.5% 96.3% 95.0% 96.0% 96.0% 88.3% 94.3% 94.4% 39.6% 40.0% 41.0% 40.8% 37.7% 39.3%Kunene 76.4% 78.2% 71.7% 73.0% 73.0% 77.9% 87.3% 87.3% 80.0% 74.6% 71.4% 80.9% 80.0% 80.0% 73.3% 69.8% 63.5% 67.6%Ohangwena 41.4% 44.2% 44.0% 60.9% 65.5% 74.6% 53.6% 54.1% 53.9% 51.4% 57.4% 59.1% 22.6% 22.7% 22.6% 22.6% 32.5% 31.3%Omaheke 100.0% 95.1% 92.9% 90.5% 88.4% 97.7% 97.6% 97.6% 95.2% 90.5% 88.4% 93.0% 85.4% 87.8% 85.7% 85.7% 86.0% 83.7%Omusati 46.4% 49.6% 49.6% 68.0% 75.2% 82.2% 56.6% 59.5% 59.5% 47.3% 54.0% 54.7% 13.1% 13.5% 13.5% 13.5% 17.9% 21.0%Oshana 70.4% 65.2% 64.2% 87.8% 89.1% 93.5% 72.6% 74.1% 73.0% 70.5% 75.2% 76.1% 15.6% 15.6% 15.3% 15.1% 16.1% 18.8%Oshikoto 50.5% 52.6% 52.0% 59.9% 67.5% 64.2% 45.3% 46.4% 45.5% 56.4% 61.1% 59.0% 23.4% 24.0% 23.5% 23.3% 29.6% 27.8%Otjozondjupa 90.0% 87.1% 84.7% 84.7% 93.2% 90.8% 90.0% 94.3% 91.7% 80.6% 86.3% 85.5% 57.1% 60.0% 58.3% 58.3% 58.9% 60.5%Zambezi 49.0% 59.0% 57.8% 59.8% 70.8% 75.7% 63.0% 62.0% 60.8% 56.9% 42.5% 43.0% 27.0% 29.0% 29.4% 30.4% 30.2% 25.2%National 61.0% 58.3% 57.6% 69.2% 73.9% 78.0% 63.5% 60.7% 60.0% 59.6% 63.1% 63.9% 28.5% 27.6% 27.4% 29.1% 31.6% 32.0%
78 EMIS Education Statistics 2015
Chapter 7: ADULT LEARNINGChapter 7 provides a compilation of the limited information available on adult education. Enrolments and pass rates in the National Literacy Programme are reported for the
years 2009-2015. The 2015 test results of learners in the Programme are given for the different education regions.
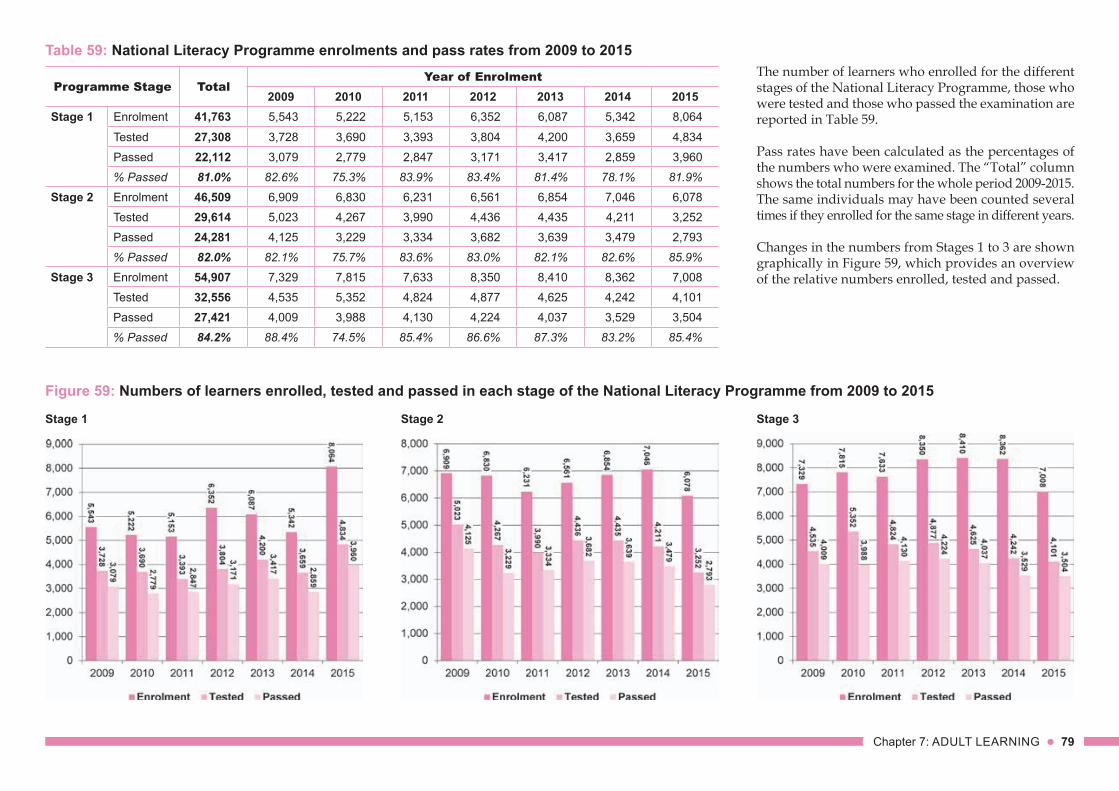
Chapter 7: ADULT LEARNING 79
Table 59: National Literacy Programme enrolments and pass rates from 2009 to 2015
Programme Stage TotalYear of Enrolment
2009 2010 2011 2012 2013 2014 2015Stage 1 Enrolment 41,763 5,543 5,222 5,153 6,352 6,087 5,342 8,064
Tested 27,308 3,728 3,690 3,393 3,804 4,200 3,659 4,834Passed 22,112 3,079 2,779 2,847 3,171 3,417 2,859 3,960% Passed 81.0% 82.6% 75.3% 83.9% 83.4% 81.4% 78.1% 81.9%
Stage 2 Enrolment 46,509 6,909 6,830 6,231 6,561 6,854 7,046 6,078Tested 29,614 5,023 4,267 3,990 4,436 4,435 4,211 3,252Passed 24,281 4,125 3,229 3,334 3,682 3,639 3,479 2,793% Passed 82.0% 82.1% 75.7% 83.6% 83.0% 82.1% 82.6% 85.9%
Stage 3 Enrolment 54,907 7,329 7,815 7,633 8,350 8,410 8,362 7,008Tested 32,556 4,535 5,352 4,824 4,877 4,625 4,242 4,101Passed 27,421 4,009 3,988 4,130 4,224 4,037 3,529 3,504% Passed 84.2% 88.4% 74.5% 85.4% 86.6% 87.3% 83.2% 85.4%
The number of learners who enrolled for the different stages of the National Literacy Programme, those who were tested and those who passed the examination are reported in Table 59.
Pass rates have been calculated as the percentages of the numbers who were examined. The “Total” column shows the total numbers for the whole period 2009-2015. The same individuals may have been counted several times if they enrolled for the same stage in different years.
Changes in the numbers from Stages 1 to 3 are shown graphically in Figure 59, which provides an overview of the relative numbers enrolled, tested and passed.
Figure 59: Numbers of learners enrolled, tested and passed in each stage of the National Literacy Programme from 2009 to 2015
Stage 1 Stage 2 Stage 3
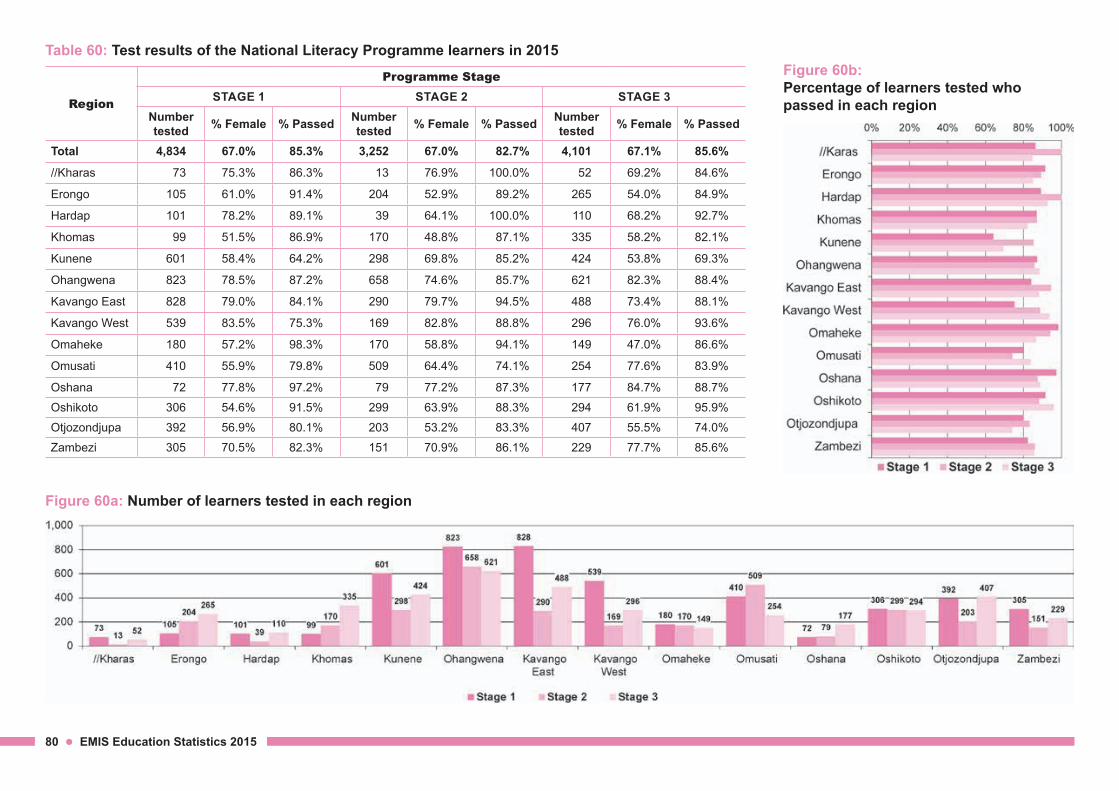
80 EMIS Education Statistics 2015
Table 60: Test results of the National Literacy Programme learners in 2015
Region
Programme StageSTAGE 1 STAGE 2 STAGE 3
Numbertested % Female % Passed Number
tested % Female % Passed Numbertested % Female % Passed
Total 4,834 67.0% 85.3% 3,252 67.0% 82.7% 4,101 67.1% 85.6%
//Kharas 73 75.3% 86.3% 13 76.9% 100.0% 52 69.2% 84.6%
Erongo 105 61.0% 91.4% 204 52.9% 89.2% 265 54.0% 84.9%
Hardap 101 78.2% 89.1% 39 64.1% 100.0% 110 68.2% 92.7%
Khomas 99 51.5% 86.9% 170 48.8% 87.1% 335 58.2% 82.1%
Kunene 601 58.4% 64.2% 298 69.8% 85.2% 424 53.8% 69.3%
Ohangwena 823 78.5% 87.2% 658 74.6% 85.7% 621 82.3% 88.4%
Kavango East 828 79.0% 84.1% 290 79.7% 94.5% 488 73.4% 88.1%
Kavango West 539 83.5% 75.3% 169 82.8% 88.8% 296 76.0% 93.6%
Omaheke 180 57.2% 98.3% 170 58.8% 94.1% 149 47.0% 86.6%
Omusati 410 55.9% 79.8% 509 64.4% 74.1% 254 77.6% 83.9%
Oshana 72 77.8% 97.2% 79 77.2% 87.3% 177 84.7% 88.7%Oshikoto 306 54.6% 91.5% 299 63.9% 88.3% 294 61.9% 95.9%Otjozondjupa 392 56.9% 80.1% 203 53.2% 83.3% 407 55.5% 74.0%Zambezi 305 70.5% 82.3% 151 70.9% 86.1% 229 77.7% 85.6%
Figure 60a: Number of learners tested in each region
Figure 60b: Percentage of learners tested who passed in each region
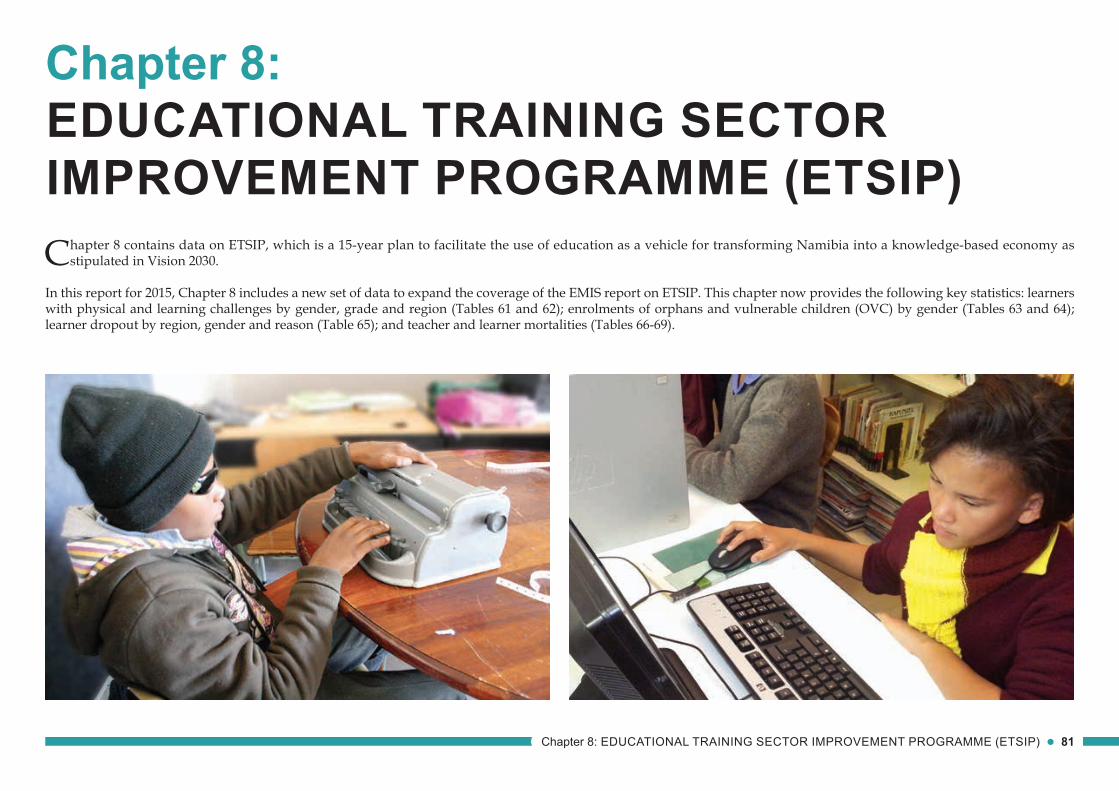
Chapter 8: EDUCATIONAL TRAINING SECTOR IMPROVEMENT PROGRAMME (ETSIP) 81
Chapter 8: EDUCATIONAL TRAINING SECTOR IMPROVEMENT PROGRAMME (ETSIP)Chapter 8 contains data on ETSIP, which is a 15-year plan to facilitate the use of education as a vehicle for transforming Namibia into a knowledge-based economy as
stipulated in Vision 2030.
In this report for 2015, Chapter 8 includes a new set of data to expand the coverage of the EMIS report on ETSIP. This chapter now provides the following key statistics: learners with physical and learning challenges by gender, grade and region (Tables 61 and 62); enrolments of orphans and vulnerable children (OVC) by gender (Tables 63 and 64); learner dropout by region, gender and reason (Table 65); and teacher and learner mortalities (Tables 66-69).
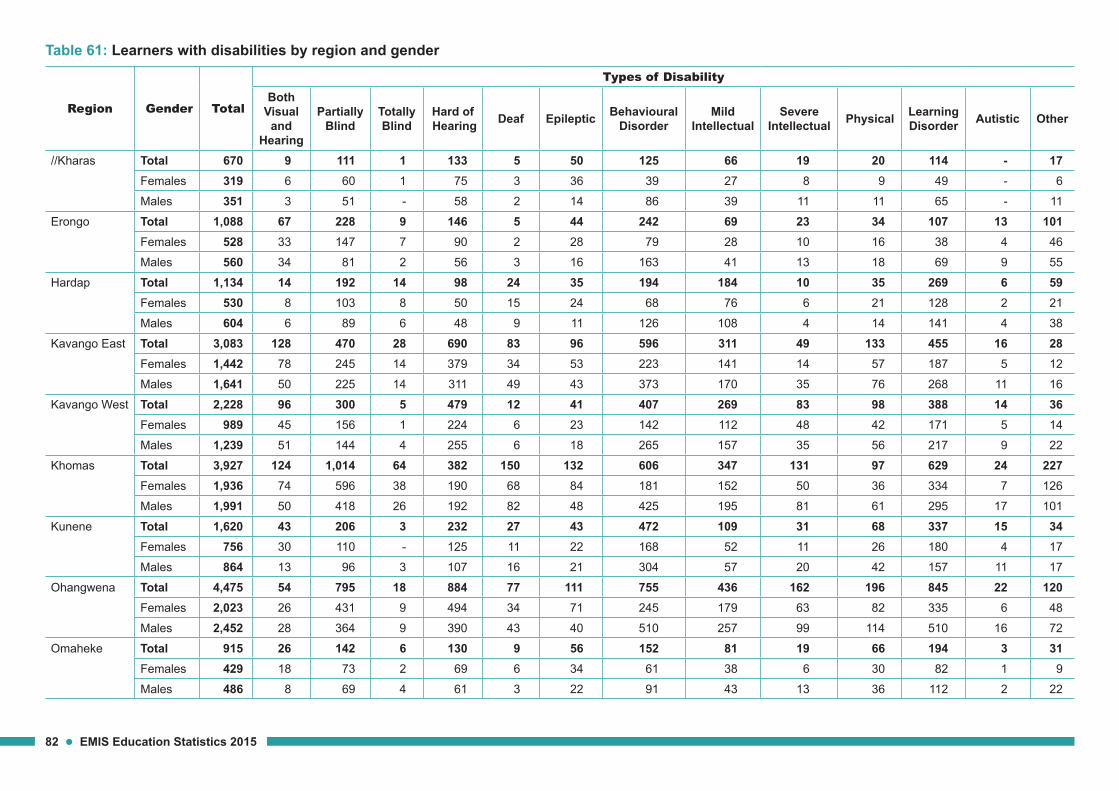
82 EMIS Education Statistics 2015
Table 61: Learners with disabilities by region and gender
Region Gender Total
Types of DisabilityBoth
Visualand
Hearing
Partially Blind
Totally Blind
Hard of Hearing Deaf Epileptic Behavioural
DisorderMild
IntellectualSevere
Intellectual Physical LearningDisorder Autistic Other
//Kharas Total 670 9 111 1 133 5 50 125 66 19 20 114 - 17Females 319 6 60 1 75 3 36 39 27 8 9 49 - 6Males 351 3 51 - 58 2 14 86 39 11 11 65 - 11
Erongo Total 1,088 67 228 9 146 5 44 242 69 23 34 107 13 101Females 528 33 147 7 90 2 28 79 28 10 16 38 4 46Males 560 34 81 2 56 3 16 163 41 13 18 69 9 55
Hardap Total 1,134 14 192 14 98 24 35 194 184 10 35 269 6 59Females 530 8 103 8 50 15 24 68 76 6 21 128 2 21Males 604 6 89 6 48 9 11 126 108 4 14 141 4 38
Kavango East Total 3,083 128 470 28 690 83 96 596 311 49 133 455 16 28Females 1,442 78 245 14 379 34 53 223 141 14 57 187 5 12Males 1,641 50 225 14 311 49 43 373 170 35 76 268 11 16
Kavango West Total 2,228 96 300 5 479 12 41 407 269 83 98 388 14 36Females 989 45 156 1 224 6 23 142 112 48 42 171 5 14Males 1,239 51 144 4 255 6 18 265 157 35 56 217 9 22
Khomas Total 3,927 124 1,014 64 382 150 132 606 347 131 97 629 24 227Females 1,936 74 596 38 190 68 84 181 152 50 36 334 7 126Males 1,991 50 418 26 192 82 48 425 195 81 61 295 17 101
Kunene Total 1,620 43 206 3 232 27 43 472 109 31 68 337 15 34Females 756 30 110 - 125 11 22 168 52 11 26 180 4 17Males 864 13 96 3 107 16 21 304 57 20 42 157 11 17
Ohangwena Total 4,475 54 795 18 884 77 111 755 436 162 196 845 22 120Females 2,023 26 431 9 494 34 71 245 179 63 82 335 6 48Males 2,452 28 364 9 390 43 40 510 257 99 114 510 16 72
Omaheke Total 915 26 142 6 130 9 56 152 81 19 66 194 3 31Females 429 18 73 2 69 6 34 61 38 6 30 82 1 9Males 486 8 69 4 61 3 22 91 43 13 36 112 2 22
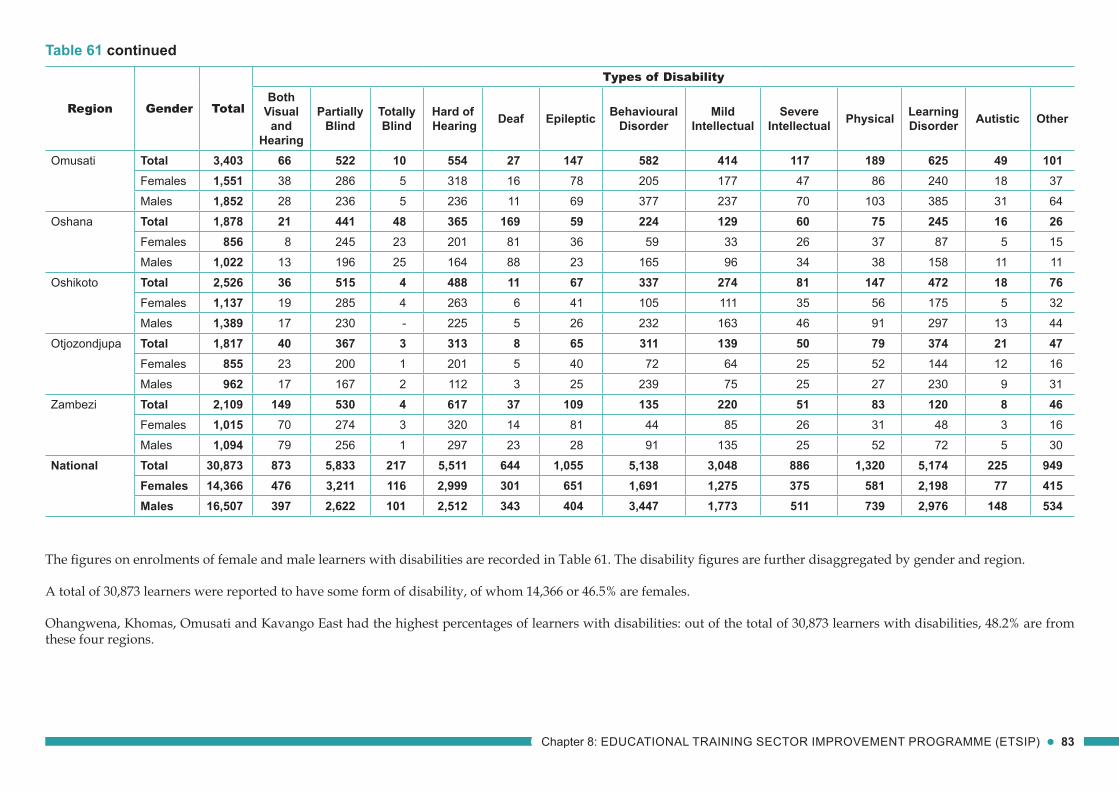
Chapter 8: EDUCATIONAL TRAINING SECTOR IMPROVEMENT PROGRAMME (ETSIP) 83
Table 61 continued
The figures on enrolments of female and male learners with disabilities are recorded in Table 61. The disability figures are further disaggregated by gender and region.
A total of 30,873 learners were reported to have some form of disability, of whom 14,366 or 46.5% are females.
Ohangwena, Khomas, Omusati and Kavango East had the highest percentages of learners with disabilities: out of the total of 30,873 learners with disabilities, 48.2% are from these four regions.
Region Gender Total
Types of DisabilityBoth
Visualand
Hearing
Partially Blind
Totally Blind
Hard of Hearing Deaf Epileptic Behavioural
DisorderMild
IntellectualSevere
Intellectual Physical LearningDisorder Autistic Other
Omusati Total 3,403 66 522 10 554 27 147 582 414 117 189 625 49 101Females 1,551 38 286 5 318 16 78 205 177 47 86 240 18 37Males 1,852 28 236 5 236 11 69 377 237 70 103 385 31 64
Oshana Total 1,878 21 441 48 365 169 59 224 129 60 75 245 16 26Females 856 8 245 23 201 81 36 59 33 26 37 87 5 15Males 1,022 13 196 25 164 88 23 165 96 34 38 158 11 11
Oshikoto Total 2,526 36 515 4 488 11 67 337 274 81 147 472 18 76Females 1,137 19 285 4 263 6 41 105 111 35 56 175 5 32Males 1,389 17 230 - 225 5 26 232 163 46 91 297 13 44
Otjozondjupa Total 1,817 40 367 3 313 8 65 311 139 50 79 374 21 47Females 855 23 200 1 201 5 40 72 64 25 52 144 12 16Males 962 17 167 2 112 3 25 239 75 25 27 230 9 31
Zambezi Total 2,109 149 530 4 617 37 109 135 220 51 83 120 8 46Females 1,015 70 274 3 320 14 81 44 85 26 31 48 3 16Males 1,094 79 256 1 297 23 28 91 135 25 52 72 5 30
National Total 30,873 873 5,833 217 5,511 644 1,055 5,138 3,048 886 1,320 5,174 225 949Females 14,366 476 3,211 116 2,999 301 651 1,691 1,275 375 581 2,198 77 415Males 16,507 397 2,622 101 2,512 343 404 3,447 1,773 511 739 2,976 148 534
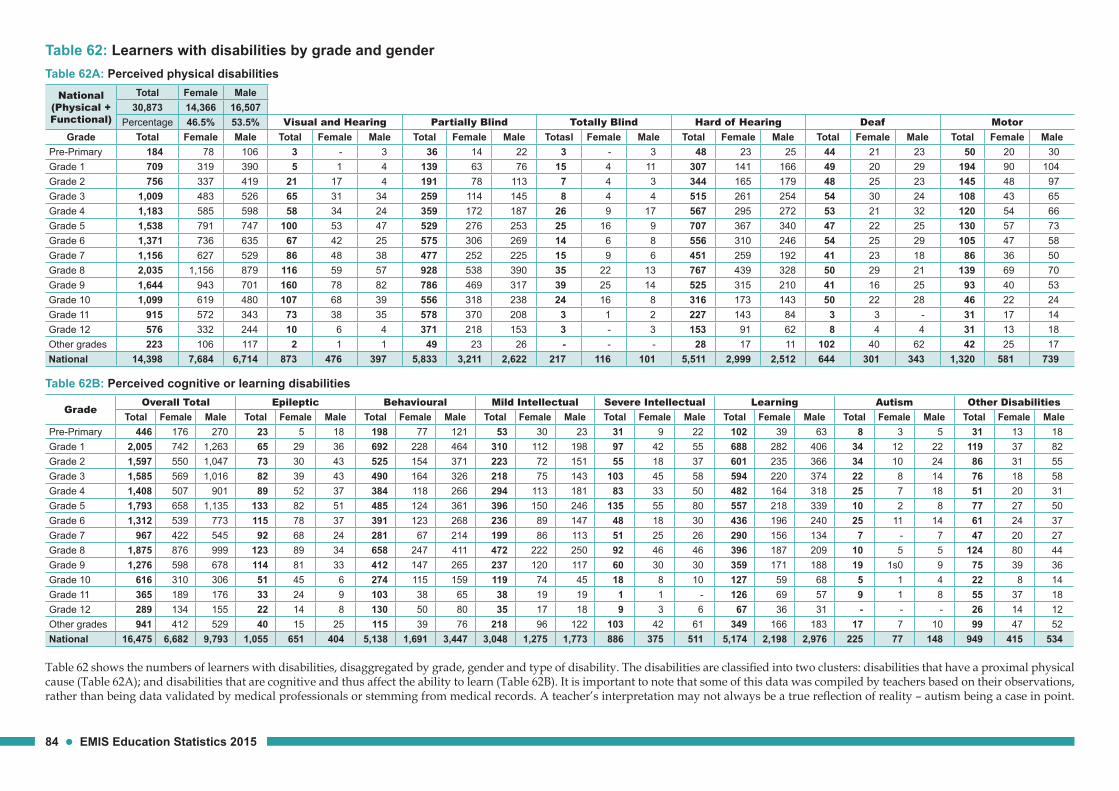
84 EMIS Education Statistics 2015
Table 62: Learners with disabilities by grade and genderTable 62A: Perceived physical disabilities
Table 62B: Perceived cognitive or learning disabilities
GradeOverall Total Epileptic Behavioural Mild Intellectual Severe Intellectual Learning Autism Other Disabilities
Total Female Male Total Female Male Total Female Male Total Female Male Total Female Male Total Female Male Total Female Male Total Female MalePre-Primary 446 176 270 23 5 18 198 77 121 53 30 23 31 9 22 102 39 63 8 3 5 31 13 18Grade 1 2,005 742 1,263 65 29 36 692 228 464 310 112 198 97 42 55 688 282 406 34 12 22 119 37 82Grade 2 1,597 550 1,047 73 30 43 525 154 371 223 72 151 55 18 37 601 235 366 34 10 24 86 31 55Grade 3 1,585 569 1,016 82 39 43 490 164 326 218 75 143 103 45 58 594 220 374 22 8 14 76 18 58Grade 4 1,408 507 901 89 52 37 384 118 266 294 113 181 83 33 50 482 164 318 25 7 18 51 20 31Grade 5 1,793 658 1,135 133 82 51 485 124 361 396 150 246 135 55 80 557 218 339 10 2 8 77 27 50Grade 6 1,312 539 773 115 78 37 391 123 268 236 89 147 48 18 30 436 196 240 25 11 14 61 24 37Grade 7 967 422 545 92 68 24 281 67 214 199 86 113 51 25 26 290 156 134 7 - 7 47 20 27Grade 8 1,875 876 999 123 89 34 658 247 411 472 222 250 92 46 46 396 187 209 10 5 5 124 80 44Grade 9 1,276 598 678 114 81 33 412 147 265 237 120 117 60 30 30 359 171 188 19 1s0 9 75 39 36Grade 10 616 310 306 51 45 6 274 115 159 119 74 45 18 8 10 127 59 68 5 1 4 22 8 14Grade 11 365 189 176 33 24 9 103 38 65 38 19 19 1 1 - 126 69 57 9 1 8 55 37 18Grade 12 289 134 155 22 14 8 130 50 80 35 17 18 9 3 6 67 36 31 - - - 26 14 12Other grades 941 412 529 40 15 25 115 39 76 218 96 122 103 42 61 349 166 183 17 7 10 99 47 52National 16,475 6,682 9,793 1,055 651 404 5,138 1,691 3,447 3,048 1,275 1,773 886 375 511 5,174 2,198 2,976 225 77 148 949 415 534
Table 62 shows the numbers of learners with disabilities, disaggregated by grade, gender and type of disability. The disabilities are classified into two clusters: disabilities that have a proximal physical cause (Table 62A); and disabilities that are cognitive and thus affect the ability to learn (Table 62B). It is important to note that some of this data was compiled by teachers based on their observations, rather than being data validated by medical professionals or stemming from medical records. A teacher’s interpretation may not always be a true reflection of reality – autism being a case in point.
National (Physical + Functional)
Total Female Male30,873 14,366 16,507
Percentage 46.5% 53.5% Visual and Hearing Partially Blind Totally Blind Hard of Hearing Deaf MotorGrade Total Female Male Total Female Male Total Female Male Totasl Female Male Total Female Male Total Female Male Total Female Male
Pre-Primary 184 78 106 3 - 3 36 14 22 3 - 3 48 23 25 44 21 23 50 20 30Grade 1 709 319 390 5 1 4 139 63 76 15 4 11 307 141 166 49 20 29 194 90 104Grade 2 756 337 419 21 17 4 191 78 113 7 4 3 344 165 179 48 25 23 145 48 97Grade 3 1,009 483 526 65 31 34 259 114 145 8 4 4 515 261 254 54 30 24 108 43 65Grade 4 1,183 585 598 58 34 24 359 172 187 26 9 17 567 295 272 53 21 32 120 54 66Grade 5 1,538 791 747 100 53 47 529 276 253 25 16 9 707 367 340 47 22 25 130 57 73Grade 6 1,371 736 635 67 42 25 575 306 269 14 6 8 556 310 246 54 25 29 105 47 58Grade 7 1,156 627 529 86 48 38 477 252 225 15 9 6 451 259 192 41 23 18 86 36 50Grade 8 2,035 1,156 879 116 59 57 928 538 390 35 22 13 767 439 328 50 29 21 139 69 70Grade 9 1,644 943 701 160 78 82 786 469 317 39 25 14 525 315 210 41 16 25 93 40 53Grade 10 1,099 619 480 107 68 39 556 318 238 24 16 8 316 173 143 50 22 28 46 22 24Grade 11 915 572 343 73 38 35 578 370 208 3 1 2 227 143 84 3 3 - 31 17 14Grade 12 576 332 244 10 6 4 371 218 153 3 - 3 153 91 62 8 4 4 31 13 18Other grades 223 106 117 2 1 1 49 23 26 - - - 28 17 11 102 40 62 42 25 17National 14,398 7,684 6,714 873 476 397 5,833 3,211 2,622 217 116 101 5,511 2,999 2,512 644 301 343 1,320 581 739
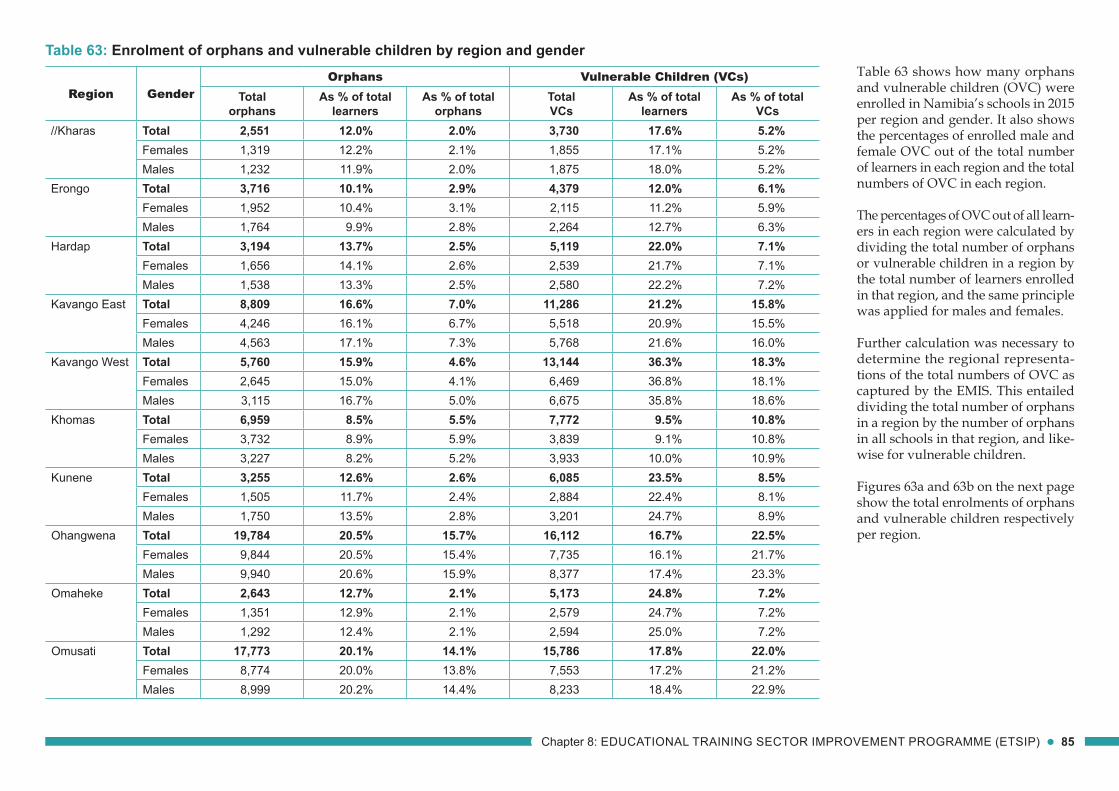
Chapter 8: EDUCATIONAL TRAINING SECTOR IMPROVEMENT PROGRAMME (ETSIP) 85
Table 63: Enrolment of orphans and vulnerable children by region and genderTable 63 shows how many orphans and vulnerable children (OVC) were enrolled in Namibia’s schools in 2015 per region and gender. It also shows the percentages of enrolled male and female OVC out of the total number of learners in each region and the total numbers of OVC in each region.
The percentages of OVC out of all learn-ers in each region were calculated by dividing the total number of orphans or vulnerable children in a region by the total number of learners enrolled in that region, and the same principle was applied for males and females.
Further calculation was necessary to determine the regional representa-tions of the total numbers of OVC as captured by the EMIS. This entailed dividing the total number of orphans in a region by the number of orphans in all schools in that region, and like-wise for vulnerable children.
Figures 63a and 63b on the next page show the total enrolments of orphans and vulnerable children respectively per region.
Region GenderOrphans Vulnerable Children (VCs)
Total orphans
As % of total learners
As % of total orphans
Total VCs
As % of total learners
As % of total VCs
//Kharas Total 2,551 12.0% 2.0% 3,730 17.6% 5.2%Females 1,319 12.2% 2.1% 1,855 17.1% 5.2%Males 1,232 11.9% 2.0% 1,875 18.0% 5.2%
Erongo Total 3,716 10.1% 2.9% 4,379 12.0% 6.1%Females 1,952 10.4% 3.1% 2,115 11.2% 5.9%Males 1,764 9.9% 2.8% 2,264 12.7% 6.3%
Hardap Total 3,194 13.7% 2.5% 5,119 22.0% 7.1%Females 1,656 14.1% 2.6% 2,539 21.7% 7.1%Males 1,538 13.3% 2.5% 2,580 22.2% 7.2%
Kavango East Total 8,809 16.6% 7.0% 11,286 21.2% 15.8%Females 4,246 16.1% 6.7% 5,518 20.9% 15.5%Males 4,563 17.1% 7.3% 5,768 21.6% 16.0%
Kavango West Total 5,760 15.9% 4.6% 13,144 36.3% 18.3%Females 2,645 15.0% 4.1% 6,469 36.8% 18.1%Males 3,115 16.7% 5.0% 6,675 35.8% 18.6%
Khomas Total 6,959 8.5% 5.5% 7,772 9.5% 10.8%Females 3,732 8.9% 5.9% 3,839 9.1% 10.8%Males 3,227 8.2% 5.2% 3,933 10.0% 10.9%
Kunene Total 3,255 12.6% 2.6% 6,085 23.5% 8.5%Females 1,505 11.7% 2.4% 2,884 22.4% 8.1%Males 1,750 13.5% 2.8% 3,201 24.7% 8.9%
Ohangwena Total 19,784 20.5% 15.7% 16,112 16.7% 22.5%Females 9,844 20.5% 15.4% 7,735 16.1% 21.7%Males 9,940 20.6% 15.9% 8,377 17.4% 23.3%
Omaheke Total 2,643 12.7% 2.1% 5,173 24.8% 7.2%Females 1,351 12.9% 2.1% 2,579 24.7% 7.2%Males 1,292 12.4% 2.1% 2,594 25.0% 7.2%
Omusati Total 17,773 20.1% 14.1% 15,786 17.8% 22.0%Females 8,774 20.0% 13.8% 7,553 17.2% 21.2%Males 8,999 20.2% 14.4% 8,233 18.4% 22.9%
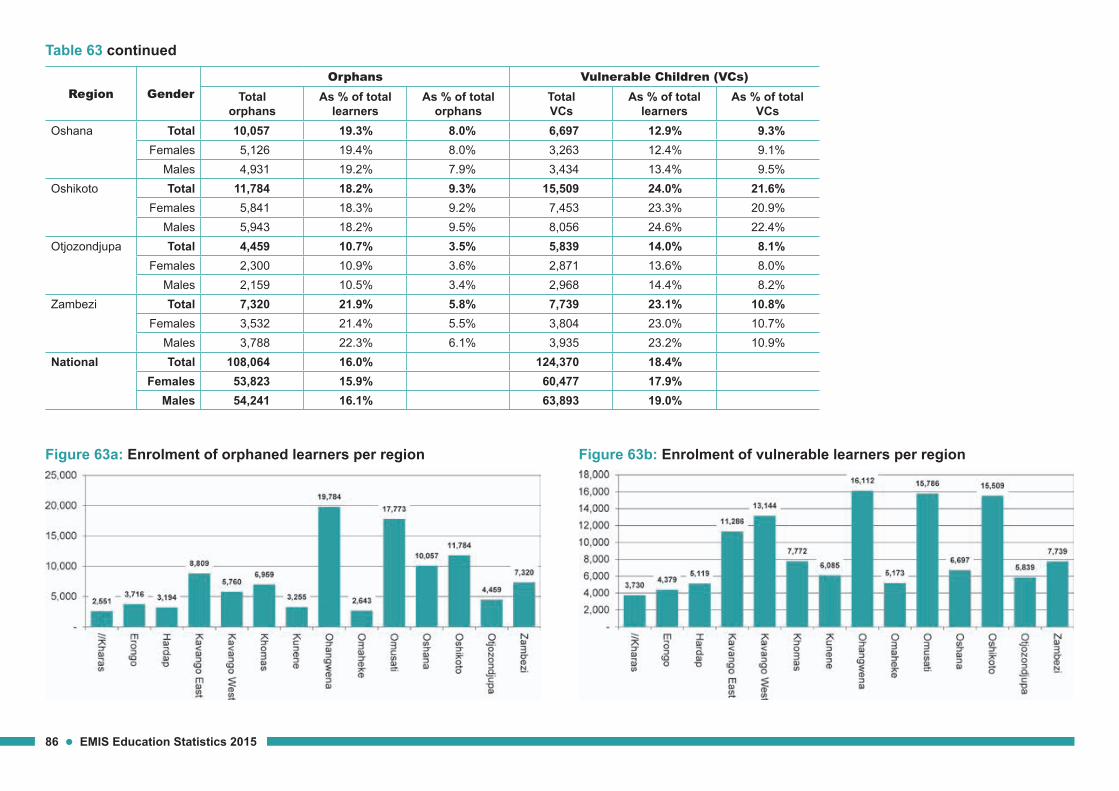
86 EMIS Education Statistics 2015
Table 63 continued
Figure 63a: Enrolment of orphaned learners per region Figure 63b: Enrolment of vulnerable learners per region
Region GenderOrphans Vulnerable Children (VCs)
Total orphans
As % of total learners
As % of total orphans
Total VCs
As % of total learners
As % of total VCs
Oshana Total 10,057 19.3% 8.0% 6,697 12.9% 9.3%Females 5,126 19.4% 8.0% 3,263 12.4% 9.1%
Males 4,931 19.2% 7.9% 3,434 13.4% 9.5%Oshikoto Total 11,784 18.2% 9.3% 15,509 24.0% 21.6%
Females 5,841 18.3% 9.2% 7,453 23.3% 20.9%Males 5,943 18.2% 9.5% 8,056 24.6% 22.4%
Otjozondjupa Total 4,459 10.7% 3.5% 5,839 14.0% 8.1%Females 2,300 10.9% 3.6% 2,871 13.6% 8.0%
Males 2,159 10.5% 3.4% 2,968 14.4% 8.2%Zambezi Total 7,320 21.9% 5.8% 7,739 23.1% 10.8%
Females 3,532 21.4% 5.5% 3,804 23.0% 10.7%Males 3,788 22.3% 6.1% 3,935 23.2% 10.9%
National Total 108,064 16.0% 124,370 18.4%Females 53,823 15.9% 60,477 17.9%
Males 54,241 16.1% 63,893 19.0%
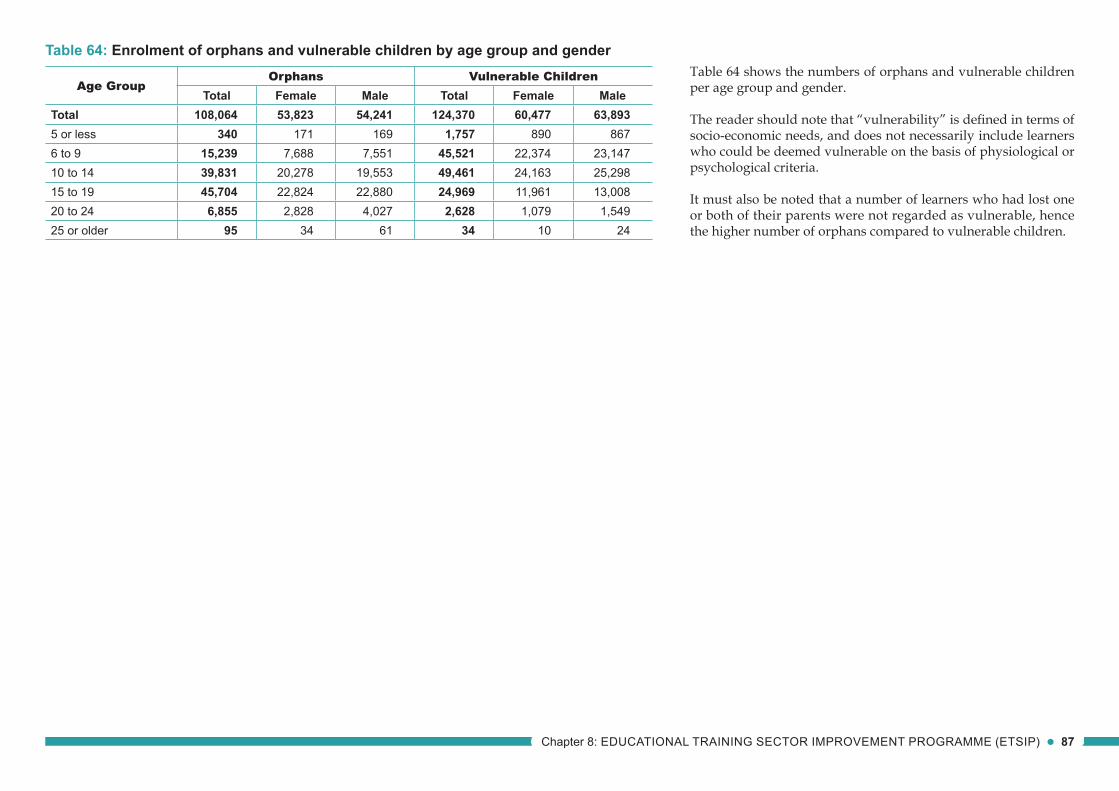
Chapter 8: EDUCATIONAL TRAINING SECTOR IMPROVEMENT PROGRAMME (ETSIP) 87
Table 64: Enrolment of orphans and vulnerable children by age group and genderTable 64 shows the numbers of orphans and vulnerable children per age group and gender.
The reader should note that “vulnerability” is defined in terms of socio-economic needs, and does not necessarily include learners who could be deemed vulnerable on the basis of physiological or psychological criteria.
It must also be noted that a number of learners who had lost one or both of their parents were not regarded as vulnerable, hence the higher number of orphans compared to vulnerable children.
Age GroupOrphans Vulnerable Children
Total Female Male Total Female MaleTotal 108,064 53,823 54,241 124,370 60,477 63,8935 or less 340 171 169 1,757 890 8676 to 9 15,239 7,688 7,551 45,521 22,374 23,14710 to 14 39,831 20,278 19,553 49,461 24,163 25,29815 to 19 45,704 22,824 22,880 24,969 11,961 13,00820 to 24 6,855 2,828 4,027 2,628 1,079 1,54925 or older 95 34 61 34 10 24
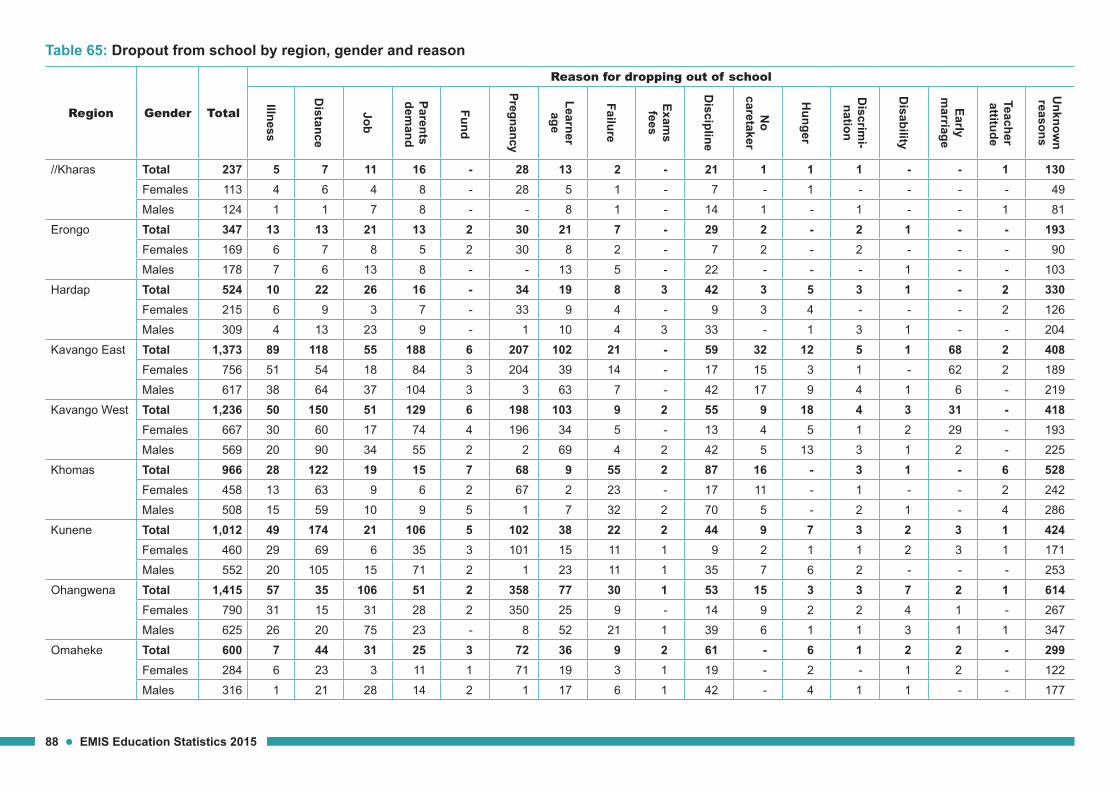
88 EMIS Education Statistics 2015
Table 65: Dropout from school by region, gender and reason
Region Gender Total
Reason for dropping out of school
Illness
Distance
Job
Parents dem
and
Fund
Pregnancy
Learnerage
Failure
Exams
fees
Discipline
No
caretaker
Hunger
Discrim
i-nation
Disability
Earlym
arriage
Teacher attitude
Unknow
nreasons
//Kharas Total 237 5 7 11 16 - 28 13 2 - 21 1 1 1 - - 1 130Females 113 4 6 4 8 - 28 5 1 - 7 - 1 - - - - 49Males 124 1 1 7 8 - - 8 1 - 14 1 - 1 - - 1 81
Erongo Total 347 13 13 21 13 2 30 21 7 - 29 2 - 2 1 - - 193Females 169 6 7 8 5 2 30 8 2 - 7 2 - 2 - - - 90Males 178 7 6 13 8 - - 13 5 - 22 - - - 1 - - 103
Hardap Total 524 10 22 26 16 - 34 19 8 3 42 3 5 3 1 - 2 330Females 215 6 9 3 7 - 33 9 4 - 9 3 4 - - - 2 126Males 309 4 13 23 9 - 1 10 4 3 33 - 1 3 1 - - 204
Kavango East Total 1,373 89 118 55 188 6 207 102 21 - 59 32 12 5 1 68 2 408Females 756 51 54 18 84 3 204 39 14 - 17 15 3 1 - 62 2 189Males 617 38 64 37 104 3 3 63 7 - 42 17 9 4 1 6 - 219
Kavango West Total 1,236 50 150 51 129 6 198 103 9 2 55 9 18 4 3 31 - 418Females 667 30 60 17 74 4 196 34 5 - 13 4 5 1 2 29 - 193Males 569 20 90 34 55 2 2 69 4 2 42 5 13 3 1 2 - 225
Khomas Total 966 28 122 19 15 7 68 9 55 2 87 16 - 3 1 - 6 528Females 458 13 63 9 6 2 67 2 23 - 17 11 - 1 - - 2 242Males 508 15 59 10 9 5 1 7 32 2 70 5 - 2 1 - 4 286
Kunene Total 1,012 49 174 21 106 5 102 38 22 2 44 9 7 3 2 3 1 424Females 460 29 69 6 35 3 101 15 11 1 9 2 1 1 2 3 1 171Males 552 20 105 15 71 2 1 23 11 1 35 7 6 2 - - - 253
Ohangwena Total 1,415 57 35 106 51 2 358 77 30 1 53 15 3 3 7 2 1 614Females 790 31 15 31 28 2 350 25 9 - 14 9 2 2 4 1 - 267Males 625 26 20 75 23 - 8 52 21 1 39 6 1 1 3 1 1 347
Omaheke Total 600 7 44 31 25 3 72 36 9 2 61 - 6 1 2 2 - 299Females 284 6 23 3 11 1 71 19 3 1 19 - 2 - 1 2 - 122Males 316 1 21 28 14 2 1 17 6 1 42 - 4 1 1 - - 177
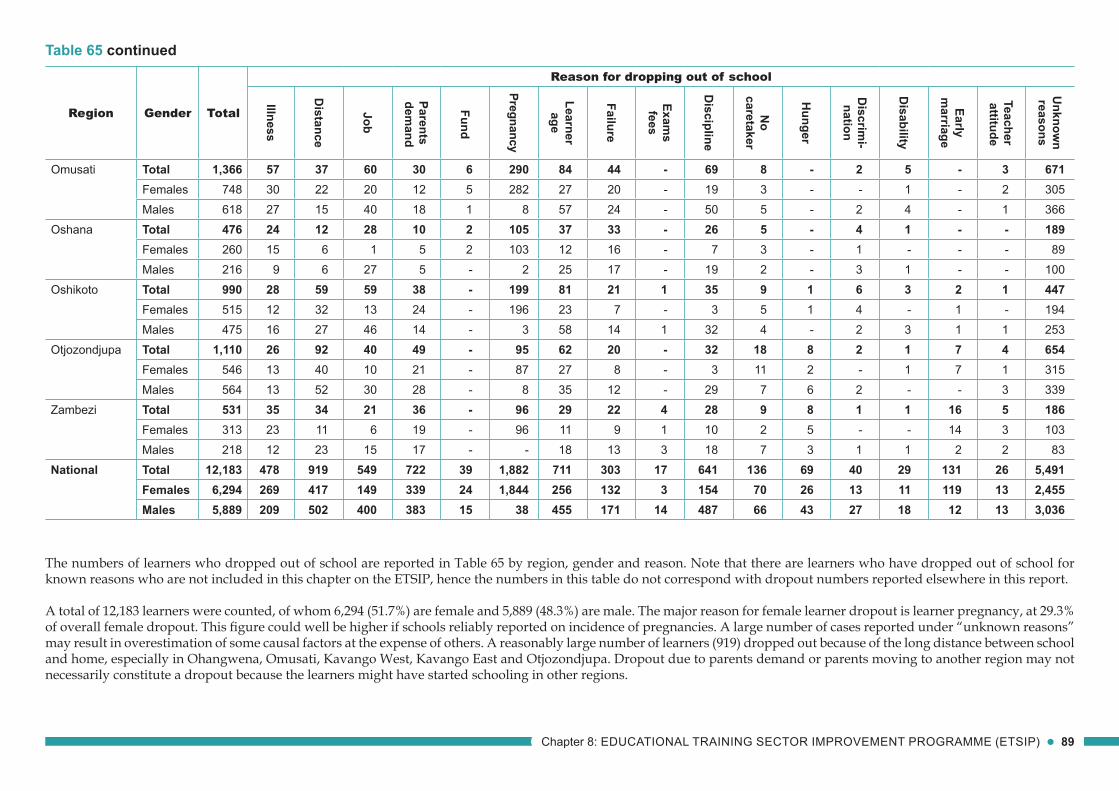
Chapter 8: EDUCATIONAL TRAINING SECTOR IMPROVEMENT PROGRAMME (ETSIP) 89
Table 65 continued
The numbers of learners who dropped out of school are reported in Table 65 by region, gender and reason. Note that there are learners who have dropped out of school for known reasons who are not included in this chapter on the ETSIP, hence the numbers in this table do not correspond with dropout numbers reported elsewhere in this report.
A total of 12,183 learners were counted, of whom 6,294 (51.7%) are female and 5,889 (48.3%) are male. The major reason for female learner dropout is learner pregnancy, at 29.3% of overall female dropout. This figure could well be higher if schools reliably reported on incidence of pregnancies. A large number of cases reported under “unknown reasons” may result in overestimation of some causal factors at the expense of others. A reasonably large number of learners (919) dropped out because of the long distance between school and home, especially in Ohangwena, Omusati, Kavango West, Kavango East and Otjozondjupa. Dropout due to parents demand or parents moving to another region may not necessarily constitute a dropout because the learners might have started schooling in other regions.
Region Gender Total
Reason for dropping out of school
Illness
Distance
Job
Parents dem
and
Fund
Pregnancy
Learnerage
Failure
Exams
fees
Discipline
No
caretaker
Hunger
Discrim
i-nation
Disability
Earlym
arriage
Teacher attitude
Unknow
nreasons
Omusati Total 1,366 57 37 60 30 6 290 84 44 - 69 8 - 2 5 - 3 671Females 748 30 22 20 12 5 282 27 20 - 19 3 - - 1 - 2 305Males 618 27 15 40 18 1 8 57 24 - 50 5 - 2 4 - 1 366
Oshana Total 476 24 12 28 10 2 105 37 33 - 26 5 - 4 1 - - 189Females 260 15 6 1 5 2 103 12 16 - 7 3 - 1 - - - 89Males 216 9 6 27 5 - 2 25 17 - 19 2 - 3 1 - - 100
Oshikoto Total 990 28 59 59 38 - 199 81 21 1 35 9 1 6 3 2 1 447Females 515 12 32 13 24 - 196 23 7 - 3 5 1 4 - 1 - 194Males 475 16 27 46 14 - 3 58 14 1 32 4 - 2 3 1 1 253
Otjozondjupa Total 1,110 26 92 40 49 - 95 62 20 - 32 18 8 2 1 7 4 654Females 546 13 40 10 21 - 87 27 8 - 3 11 2 - 1 7 1 315Males 564 13 52 30 28 - 8 35 12 - 29 7 6 2 - - 3 339
Zambezi Total 531 35 34 21 36 - 96 29 22 4 28 9 8 1 1 16 5 186Females 313 23 11 6 19 - 96 11 9 1 10 2 5 - - 14 3 103Males 218 12 23 15 17 - - 18 13 3 18 7 3 1 1 2 2 83
National Total 12,183 478 919 549 722 39 1,882 711 303 17 641 136 69 40 29 131 26 5,491Females 6,294 269 417 149 339 24 1,844 256 132 3 154 70 26 13 11 119 13 2,455Males 5,889 209 502 400 383 15 38 455 171 14 487 66 43 27 18 12 13 3,036
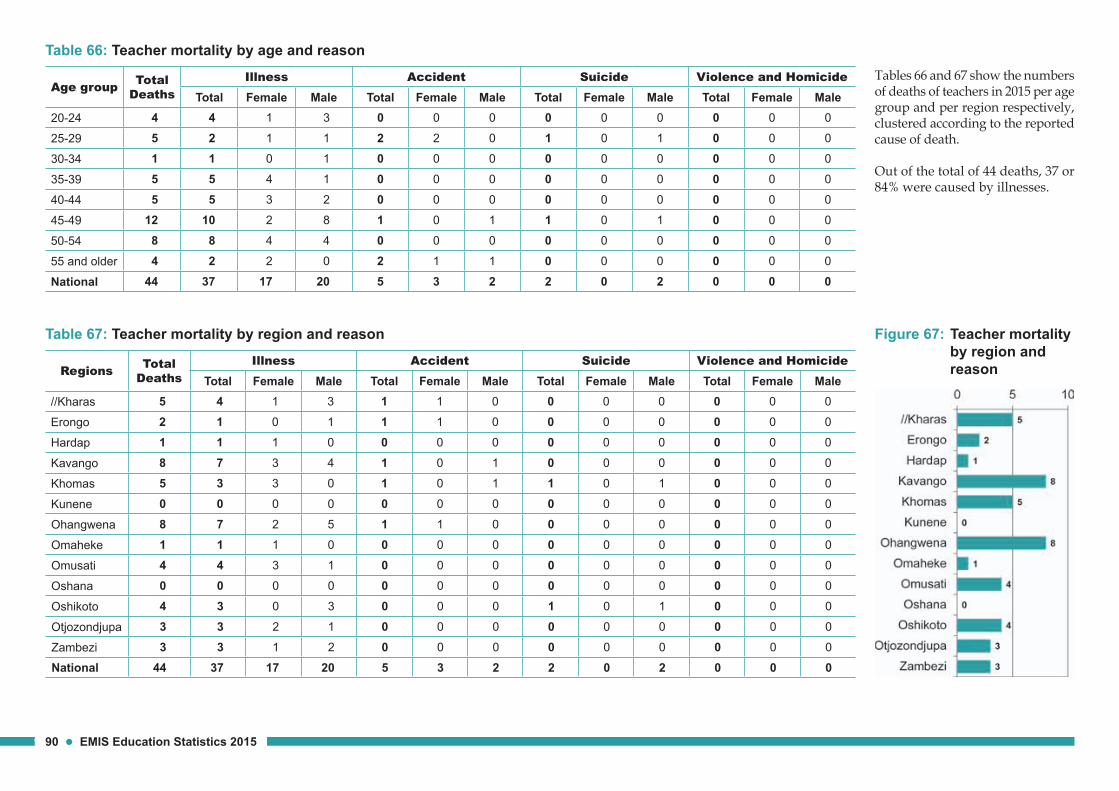
90 EMIS Education Statistics 2015
Table 66: Teacher mortality by age and reason
Table 67: Teacher mortality by region and reason
Age group Total Deaths
Illness Accident Suicide Violence and HomicideTotal Female Male Total Female Male Total Female Male Total Female Male
20-24 4 4 1 3 0 0 0 0 0 0 0 0 0
25-29 5 2 1 1 2 2 0 1 0 1 0 0 0
30-34 1 1 0 1 0 0 0 0 0 0 0 0 0
35-39 5 5 4 1 0 0 0 0 0 0 0 0 0
40-44 5 5 3 2 0 0 0 0 0 0 0 0 0
45-49 12 10 2 8 1 0 1 1 0 1 0 0 0
50-54 8 8 4 4 0 0 0 0 0 0 0 0 0
55 and older 4 2 2 0 2 1 1 0 0 0 0 0 0
National 44 37 17 20 5 3 2 2 0 2 0 0 0
Figure 67: Teacher mortality by region and reason
Tables 66 and 67 show the numbers of deaths of teachers in 2015 per age group and per region respectively, clustered according to the reported cause of death.
Out of the total of 44 deaths, 37 or 84% were caused by illnesses.
Regions Total Deaths
Illness Accident Suicide Violence and HomicideTotal Female Male Total Female Male Total Female Male Total Female Male
//Kharas 5 4 1 3 1 1 0 0 0 0 0 0 0
Erongo 2 1 0 1 1 1 0 0 0 0 0 0 0
Hardap 1 1 1 0 0 0 0 0 0 0 0 0 0
Kavango 8 7 3 4 1 0 1 0 0 0 0 0 0
Khomas 5 3 3 0 1 0 1 1 0 1 0 0 0
Kunene 0 0 0 0 0 0 0 0 0 0 0 0 0
Ohangwena 8 7 2 5 1 1 0 0 0 0 0 0 0
Omaheke 1 1 1 0 0 0 0 0 0 0 0 0 0
Omusati 4 4 3 1 0 0 0 0 0 0 0 0 0
Oshana 0 0 0 0 0 0 0 0 0 0 0 0 0
Oshikoto 4 3 0 3 0 0 0 1 0 1 0 0 0
Otjozondjupa 3 3 2 1 0 0 0 0 0 0 0 0 0
Zambezi 3 3 1 2 0 0 0 0 0 0 0 0 0
National 44 37 17 20 5 3 2 2 0 2 0 0 0
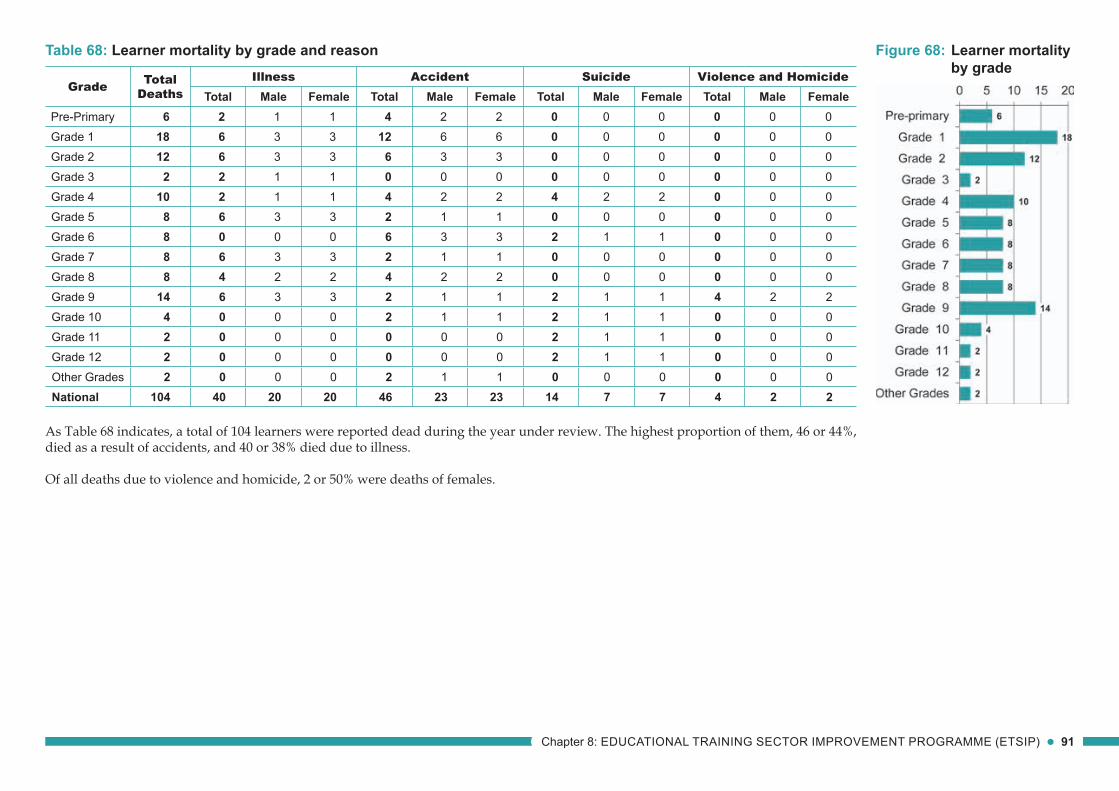
Chapter 8: EDUCATIONAL TRAINING SECTOR IMPROVEMENT PROGRAMME (ETSIP) 91
Table 68: Learner mortality by grade and reason
Grade Total Deaths
Illness Accident Suicide Violence and HomicideTotal Male Female Total Male Female Total Male Female Total Male Female
Pre-Primary 6 2 1 1 4 2 2 0 0 0 0 0 0Grade 1 18 6 3 3 12 6 6 0 0 0 0 0 0Grade 2 12 6 3 3 6 3 3 0 0 0 0 0 0Grade 3 2 2 1 1 0 0 0 0 0 0 0 0 0Grade 4 10 2 1 1 4 2 2 4 2 2 0 0 0Grade 5 8 6 3 3 2 1 1 0 0 0 0 0 0Grade 6 8 0 0 0 6 3 3 2 1 1 0 0 0Grade 7 8 6 3 3 2 1 1 0 0 0 0 0 0Grade 8 8 4 2 2 4 2 2 0 0 0 0 0 0Grade 9 14 6 3 3 2 1 1 2 1 1 4 2 2Grade 10 4 0 0 0 2 1 1 2 1 1 0 0 0Grade 11 2 0 0 0 0 0 0 2 1 1 0 0 0Grade 12 2 0 0 0 0 0 0 2 1 1 0 0 0Other Grades 2 0 0 0 2 1 1 0 0 0 0 0 0National 104 40 20 20 46 23 23 14 7 7 4 2 2
As Table 68 indicates, a total of 104 learners were reported dead during the year under review. The highest proportion of them, 46 or 44%, died as a result of accidents, and 40 or 38% died due to illness.
Of all deaths due to violence and homicide, 2 or 50% were deaths of females.
Figure 68: Learner mortality by grade
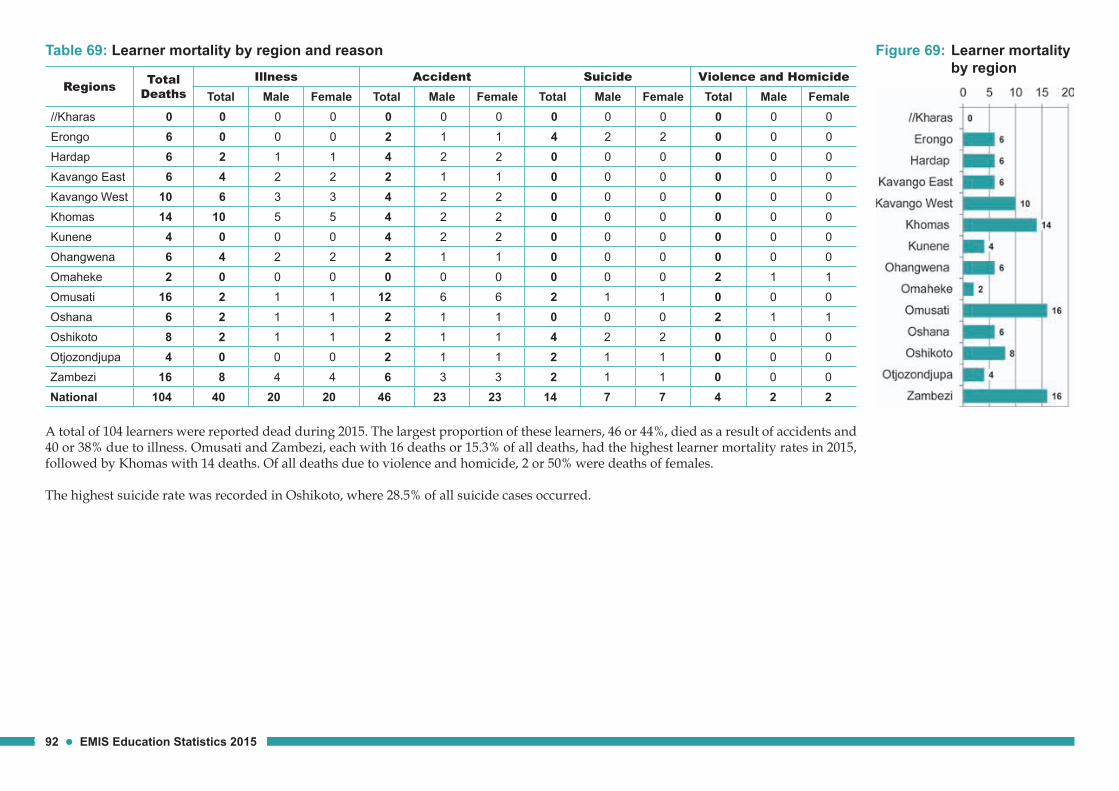
92 EMIS Education Statistics 2015
Table 69: Learner mortality by region and reason
A total of 104 learners were reported dead during 2015. The largest proportion of these learners, 46 or 44%, died as a result of accidents and 40 or 38% due to illness. Omusati and Zambezi, each with 16 deaths or 15.3% of all deaths, had the highest learner mor tality rates in 2015, followed by Khomas with 14 deaths. Of all deaths due to violence and homicide, 2 or 50% were deaths of females.
The highest suicide rate was recorded in Oshikoto, where 28.5% of all suicide cases occurred.
Figure 69: Learner mortality by region
Regions Total Deaths
Illness Accident Suicide Violence and HomicideTotal Male Female Total Male Female Total Male Female Total Male Female
//Kharas 0 0 0 0 0 0 0 0 0 0 0 0 0Erongo 6 0 0 0 2 1 1 4 2 2 0 0 0Hardap 6 2 1 1 4 2 2 0 0 0 0 0 0Kavango East 6 4 2 2 2 1 1 0 0 0 0 0 0Kavango West 10 6 3 3 4 2 2 0 0 0 0 0 0Khomas 14 10 5 5 4 2 2 0 0 0 0 0 0Kunene 4 0 0 0 4 2 2 0 0 0 0 0 0Ohangwena 6 4 2 2 2 1 1 0 0 0 0 0 0Omaheke 2 0 0 0 0 0 0 0 0 0 2 1 1Omusati 16 2 1 1 12 6 6 2 1 1 0 0 0Oshana 6 2 1 1 2 1 1 0 0 0 2 1 1Oshikoto 8 2 1 1 2 1 1 4 2 2 0 0 0Otjozondjupa 4 0 0 0 2 1 1 2 1 1 0 0 0Zambezi 16 8 4 4 6 3 3 2 1 1 0 0 0National 104 40 20 20 46 23 23 14 7 7 4 2 2