chapter 4: empirical research 4.1 research approach
TRANSCRIPT

CHAPTER 4: Empirical Research
4.1 RESEARCH APPROACH In order to understand some of the issues regarding the perception of
employees on the effective use of the current appraisal system, an exploratory
research was conducted. Zikmund (2003:110) defines an exploratory research as an initial research conducted to clarify and define the nature of
the problem. Zikmund (2003:111) further states that an exploratory research
is used as a diagnostic tool to point out issues of concern or generate a
possible explanation for some patterns.
4.2 SAMPLING METHOD AND DESIGN Sampling is defined by Zikmund (2003:369) as a process of using a small
number of items or parts of a larger population to make conclusions about the
whole population. The target population for this study is those employees
who have been with the bank for at least two years from the two divisions,
being Retail Credit, Group IT.
Zikmund (2003:373) defined the sampling frame as a list of elements from
which a sample may be drawn. A personnel list was used as a sampling
frame for this study. The personnel list containing Surname, Name, Level,
Region and Start Date (See Annexure A) was supplied to the researcher by
human resources. This study had to ensure that there was adequate
representation of managerial and non managerial levels of employees from
both divisions. Each member of the groups, provided they satisfied the
definition of the target population as explained in the paragraph above, had an
equal chance of being selected. According to Zikmund (2003:379), a
probability sampling is a sampling technique in which every member of the
target population has a known non-zero probability of selection.
77
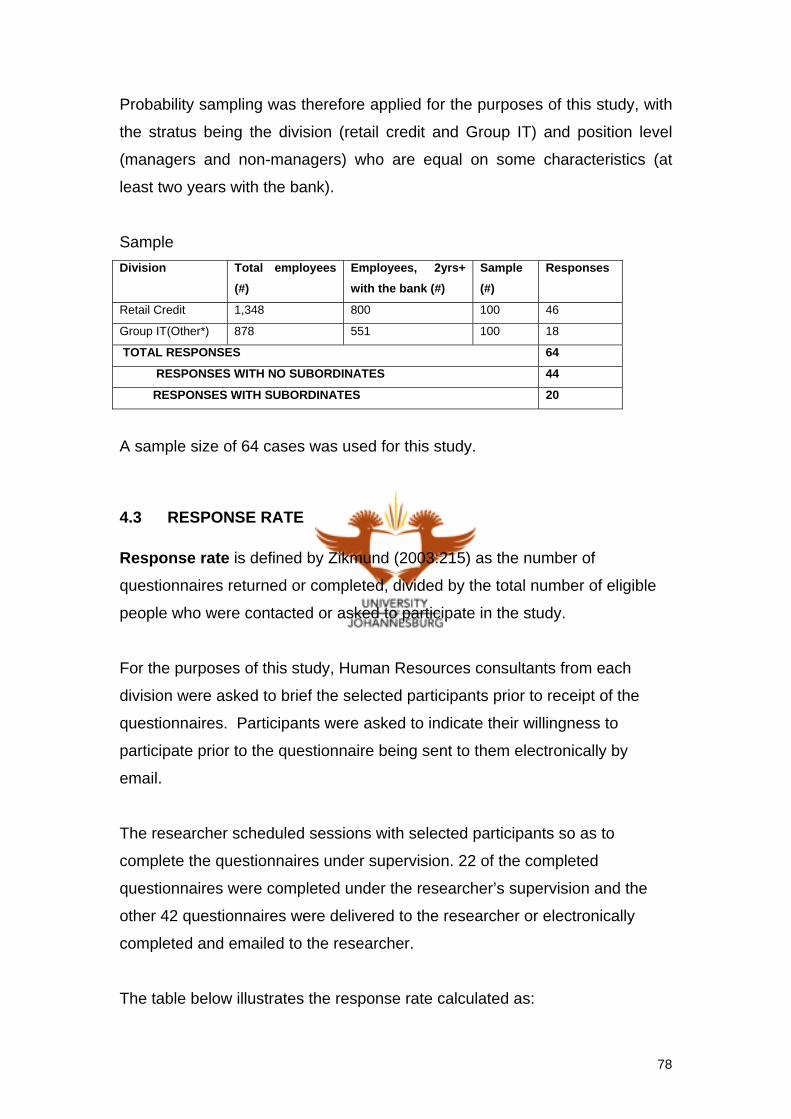
Probability sampling was therefore applied for the purposes of this study, with
the stratus being the division (retail credit and Group IT) and position level
(managers and non-managers) who are equal on some characteristics (at
least two years with the bank).
Sample Division Total employees
(#) Employees, 2yrs+ with the bank (#)
Sample (#)
Responses
Retail Credit 1,348 800 100 46
Group IT(Other*) 878 551 100 18
TOTAL RESPONSES 64
RESPONSES WITH NO SUBORDINATES 44
RESPONSES WITH SUBORDINATES 20
A sample size of 64 cases was used for this study.
4.3 RESPONSE RATE Response rate is defined by Zikmund (2003:215) as the number of
questionnaires returned or completed, divided by the total number of eligible
people who were contacted or asked to participate in the study.
For the purposes of this study, Human Resources consultants from each
division were asked to brief the selected participants prior to receipt of the
questionnaires. Participants were asked to indicate their willingness to
participate prior to the questionnaire being sent to them electronically by
email.
The researcher scheduled sessions with selected participants so as to
complete the questionnaires under supervision. 22 of the completed
questionnaires were completed under the researcher’s supervision and the
other 42 questionnaires were delivered to the researcher or electronically
completed and emailed to the researcher.
The table below illustrates the response rate calculated as:
78

Response Rate = Completed questionnaires / Selected participants. Division Selected
participants Withdrawn questionnaires**
Returned/Completed questionnaires
Response Rate
Retail Credit 100 12 46 46%
Group IT(Other*) 100 37 18 18%
TOTAL 200 49 64 32%
Note:
*: Participants were selected from the Group IT personnel list, but they marked Other* on the questionnaire.
**: Participants were not willing to participate.
4.4 RESEARCH INSTRUMENT
A questionnaire in Appendix B was designed to establish the perception of
employees on the effective use of the performance appraisal system in the
bank. This questionnaire was the source of the primary data for this study.
Most questions in the questionnaire had fixed alternative questions. Zikmund
(2003:332) describes fixed alternative questions as questions where the
respondent is given limited alternative responses and asked to choose the
one closest to his or her viewpoint. Over and above the fixed alternatives,
some questions had an option for open ended questions. Open ended
questions are questions that ask the respondent to answer in his or her own
words, Zikmund (2003:331). This option was given to respondents so as to
elaborate on the already selected alternative.
4.5 DATA ANALYSIS
Completed questionnaires were delivered to the University of Johannesburg –
Statistical Consultancy Services (“Statcon”) for data capturing and analysis.
Data analysis was done using SPSS statistical package. Because of the low
sample size and response rate, Statcon advised the researcher to use
descriptive statistics using frequency tables for each question and cross
tabulations of each question by respondent’s current position (i.e. manager
versus non manager). Zikmund (2003:402-403) defines descriptive
79

statistics as statistics used to describe information about a sample or
population and frequency distribution as set of organised data summarising
the number of times a particular value of a variable occurs. Cross tabulations are defined by Zikmund (2003:476) as organising data by groups,
categories, or classes to facilitate comparisons on two or more sets of
variables.
Qualitative responses gathered from open ended questions were manually
analysed and similar responses were grouped together to highlight most
common comments.
80

4.6 RESULTS: ANALYSIS OF RESPONSES ON QUESTIONNAIRE Each question of the questionnaire will be analysed in this section.
4.6.1 Characteristics of the sample This section of the questionnaire seeks to identify respondents in terms of the
following:
Division;
Current position;
Years employed in the bank; and
Years in the current position.
SECTION A: PESONAL DETAILS
1) In which division are you currently employed? Category reclassification None
Variable Analysis
Category f % Cumulative %Retail Credit 46 71.9% 71.9%IT 11 17.2% 89.1%Other 7 10.9% 100.0%TOTAL 64 100.0%
Retail Credit had the highest representation of 71.9%. Group IT had a 17.2%
representation in the sample.
Respondents’ elaborative commentary n/a
Manager vs. non manager comparison n/a
81

Deductions The sample is most highly represented by Retail Credit respondents.
82

2) What level is your current position? Category reclassification
Questionnaire Category Analysis category
Non Managerial, Other Non Managers
JNR Manager, MID Manager, SNR Manager, Exec Level Managers
Variable Analysis
Category f % Cumulative %Non Managerial 28 43.8% 43.8%JNR Manager 19 29.7% 73.4%MID Manager 8 12.5% 85.9%SNR Manager 4 6.3% 92.2%Exec Level 0 0.0% 92.2%Other 4 6.3% 98.4%No Response 1 1.6% 100.0%TOTAL 64 100.0%
Category f % Cumulative %Non Managers 32 50.0% 50.0%Managers 31 48.4% 98.4%No Response 1 1.6% 100.0%TOTAL 64 100.0%
The sample represented 50.0% of non managers and 48.4% of managers.
Respondents’ elaborative commentary n/a
Manager vs. non manager comparison See variable analysis
Deductions There is a balanced representation of manager and non manager levels.
83

3) How many years have you been with the organisation? Category reclassification None
Variable Analysis
Category f % Cumulative %2 - 4 yrs 24 37.5% 37.5%5- 7 yrs 11 17.2% 54.7%8 - 10yrs 10 15.6% 70.3%11-13yrs 4 6.3% 76.6%14+yrs 10 15.6% 92.2%Other 5 7.8% 100.0%TOTAL 64 100.0%
Sample represented a wide range of tenure with the bank. Highest
representation is in the “2-4 yrs” category, representing 37.5%. “Other”
category is represented by 7.8%.
Respondents’ elaborative commentary n/a
Manager vs. non manager comparison n/a
Deductions The representation of participants is across a wide spectrum of service in the
bank. This is a good indication that participants will respond with adequate
experience of the current performance appraisal process and system.
84

4) How many years have you been in the current position? Category reclassification None
Variable Analysis
Category # % Cumulative %<12mnths 11 17.2% 17.2%1 - 2 yrs 17 26.6% 43.8%3 - 4 yrs 18 28.1% 71.9%5 - 6 yrs 5 7.8% 79.7%7+ yrs 7 10.9% 90.6%Other 6 9.4% 100.0%TOTAL 64 100.0%
Most respondents have been in their current position for more than 12
months. Only 17.2% of the sample is fairly new (i.e. less than 12 months) in
their current positions.
Respondents’ elaborative commentary n/a
Manager vs. non manager comparison n/a
Deductions Given an average long service of respondents in question 3 above,
respondents in “<12 months” in current position still commented from
experience in their previous positions. It is not apparent who the “Other”
category represents in the variable analysis table.
85

4.6.2 Responses of respondents with subordinates. Although most of the managers have subordinates, it is possible to find
employees at managerial levels with no subordinates. Non managers can
have subordinates and these non-managers are referred to as supervisors.
SECTION B: EMPLOYEES WITH SUBORDINATES
5) Do you always have enough time to prepare before discussions with your subordinates? Category reclassification None
Variable Analysis
Category f Total Respondents %
Respondents with subordinates %
Respondents with subordinates cumulative %
Yes 15 23.4% 75.0% 75.0%No 5 7.8% 25.0% 100.0%Total with subordinates 20 31.3% 100.0% Total with no subordinates 44 68.8% TOTAL 64 100.0% 100.0%
Only 20 of 64 respondents have subordinates. 75.0% with subordinates have
enough time to prepare before discussions with their subordinates.
Respondents’ elaboration commentary Most respondents commented that they have to wait for senior managers to
provide them with ratings for their immediate subordinates.
Manager vs. non manager comparison n/a
86

Deductions A quarter of employees in the bank do not have time to prepare before they
have performance appraisal discussions with their subordinates. It is possible
that appraisals are not seen as important, or, because the ratings will be
predefined, they do not see the need to prepare. This may result in focus not
on relevant issues and an improper application of the system.
87
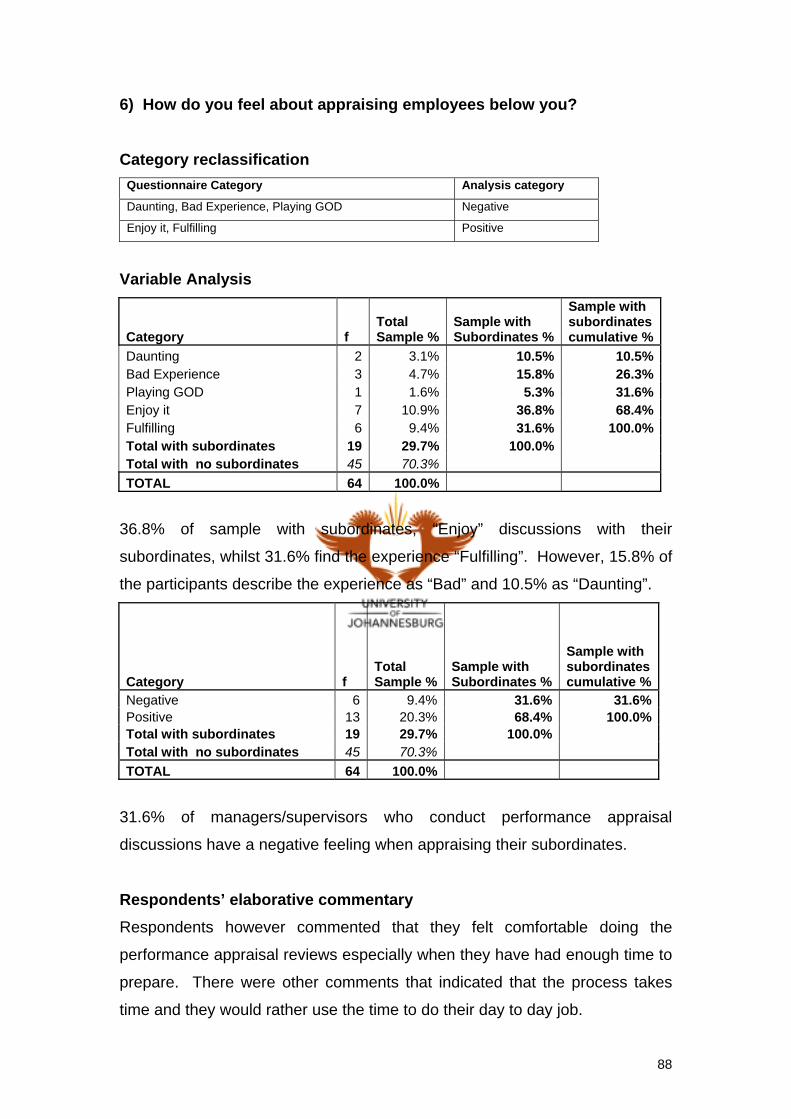
6) How do you feel about appraising employees below you? Category reclassification
Questionnaire Category Analysis category
Daunting, Bad Experience, Playing GOD Negative
Enjoy it, Fulfilling Positive
Variable Analysis
Category f Total Sample %
Sample with Subordinates %
Sample with subordinates cumulative %
Daunting 2 3.1% 10.5% 10.5% Bad Experience 3 4.7% 15.8% 26.3% Playing GOD 1 1.6% 5.3% 31.6% Enjoy it 7 10.9% 36.8% 68.4% Fulfilling 6 9.4% 31.6% 100.0% Total with subordinates 19 29.7% 100.0% Total with no subordinates 45 70.3% TOTAL 64 100.0%
36.8% of sample with subordinates, “Enjoy” discussions with their
subordinates, whilst 31.6% find the experience “Fulfilling”. However, 15.8% of
the participants describe the experience as “Bad” and 10.5% as “Daunting”.
Category f Total Sample %
Sample with Subordinates %
Sample with subordinates cumulative %
Negative 6 9.4% 31.6% 31.6% Positive 13 20.3% 68.4% 100.0% Total with subordinates 19 29.7% 100.0% Total with no subordinates 45 70.3% TOTAL 64 100.0%
31.6% of managers/supervisors who conduct performance appraisal
discussions have a negative feeling when appraising their subordinates.
Respondents’ elaborative commentary Respondents however commented that they felt comfortable doing the
performance appraisal reviews especially when they have had enough time to
prepare. There were other comments that indicated that the process takes
time and they would rather use the time to do their day to day job.
88
Manager vs. non manager comparison n/a
Deduction A negative feeling when conducting a performance appraisal discussion can
result in the environment or climate not being conducive to a constructive
discussion. This could result in subordinates feeling intimidated and not being
able to be open and free to voice their opinions. It is also possible that the
staff acting as manger/supervisor may avoid confrontation with the staff
member thereby opting for average ratings.
89

7) Do you feel adequately trained to perform a PA discussion? Category reclassification
Questionnaire Category Analysis category
Inadequate Inadequate
Partly Adequate, Fully Adequate Adequate
Variable Analysis
Category f Total Sample %
Sample with Subordinates %
Sample with subordinates cumulative %
Inadequate 2 3.1% 10.5% 10.5% Partly Adequate 7 10.9% 36.8% 47.4% Fully Adequate 10 15.6% 52.6% 100.0% Total with subordinates 19 29.7% 100.0% Total with no subordinates 45 70.3% TOTAL 64 100.0%
Of the 19 eligible respondents for this question, 36.8% of the participants felt
“Partly adequate” to perform performance appraisal discussion. 52.6% of the
participants, felt “Fully adequate” to perform performance appraisal discussion.
Category f Total Sample %
Sample with Subordinates %
Sample with subordinates cumulative %
Inadequate 2 3.1% 10.5% 10.5%Adequate 17 26.6% 89.5% 100.0%Total with subordinates 19 29.7% 100.0% Total with no subordinates 45 70.3% TOTAL 64 100.0%
10.5% of managers/supervisors felt inadequate to conduct performance
appraisal discussions.
Respondents’ elaborative commentary Although only 10 of the sample of 19 felt “Fully adequate”, most of the sample
commented that they have not been formally trained and therefore use their
own experience when conducting discussions with their subordinates.
90

Manager vs. non manager comparison n/a
Deduction Formal performance appraisal training is important so as to give those who
have to perform it correct guidance and support. This will go a long way to
ensure not only that they are confident, but also to ensure that they focus on
performance aspect and are honest and constructive in their feedback. Not
only is it important for the managers/supervisors to know how to give
feedback and probe for relevant information from their subordinates, but
subordinates should also be trained to know how to receive feedback. Lack
of formal training for managers/subordinates makes all employees victims of
an inadequately implemented system irrespective, of how good the system is.
91

4.6.3 Section for all respondents
Each and every employee in the bank has a manager/supervisor who
conducts their performance appraisal. This section of the questionnaire
focuses on the following issues:
Preparation by employees;
Understanding of the performance appraisal system;
Moderation process;
Discussion of the performance appraisal review;
Outcome of the performance appraisal process;
Development Plans; and
Other, including general comments from respondents.
SECTION C: PERFORMANCE APPRAISAL (“PA”) For each of the questions in this section the analysis approach is as follows:
Frequency distributions for each variable; and
Cross tabulation of each variable analysis by respondents’ current
position (i.e. managers versus non managers). Most of the cross
tabulation cells contained less than 5 cases and the researcher could
therefore not draw valid and reliable statistical inferences. Most
categories are reclassified to provide meaningful numbers and
percentages.
92

C1: Preparation by employees 8) For your last PA session how much time were you given for preparation? Category reclassification
Questionnaire Category Analysis category
None, <=2 days, 3 – 6 days Less than 1 week
1 week, 2-3weeks, 4+weeks More than 1 week
Variable Analysis
Category f % Cumulative %Less than 1 week 30 46.9% 46.9%More than 1 week 32 50.0% 96.9%No Response 2 3.1% 100.0%TOTAL 64 100.0%
46.9% of the sample is given less than a week as preparation time prior to the
appraisal discussion. 50.0% of the sample is given a week or more to prepare,
prior to their performance discussion with their managers.
Respondents’ elaborative commentary n/a
Manager vs. non manager comparison
Level Non Managers Managers f % f % Less than 1 week 19 61% 11 35% More than 1 week 12 39% 20 65%
31 100% 31 100%
61% of non managers are given less than a week to prepare prior to their
performance appraisal discussion with their managers, versus only 35% of
managers.
93

Deductions Only half of the sample is given a week or more to prepare for their
performance appraisal discussions with their managers. There seems to be a
big difference when one compares the time that the managers are given for
preparation to that of their non-managerial counterparts. Not only are most
employees not given adequate time to prepare, non-managerial levels are in
many cases caught by surprise, to do the appraisal.
94

9) Was the preparation time given adequate? Category reclassification
Questionnaire Category Analysis category
Too short Too Short
Adequate, More than enough Enough
Not important to me Not important to me
Variable Analysis
Category f % Cumulative %Too short 16 25.0% 25.0%Enough 42 65.6% 90.6%Not important to me 3 4.7% 95.3%No Response 3 4.7% 100.0%TOTAL 64 100.0%
25.0 % of the sample finds the time given prior to the discussion “Too short”.
65.6% of the sample said the time given for preparation is “Enough” whilst
4.7% said the time given for preparation is not important to them.
Respondents’ elaborative commentary n/a
Manager vs. non manager comparison
Level Non Managers Managers f % f % Too short 8 27% 8 26% Enough 21 70% 21 68% Not important to me 1 3% 2 6%
30 100% 31 100%
The table above shows an almost identical response between managers and
non managers.
Deductions It is quite obvious from question(8) than non managers are given less time to
prepare than managers, but surprisingly 70% of them still find the time to be
enough. This may imply that they do not see or understand the importance of
95
knowing in advance that the performance appraisal discussion will take place.
This then implies that in most cases the non managers do not have anything
to prepare anyway. This could also reflect lack of understanding of a proper
performance appraisal process, especially from managers/supervisors. It is
quite disturbing to note that some respondents, although only 4.7%, do not
see preparation time as important to them.
96
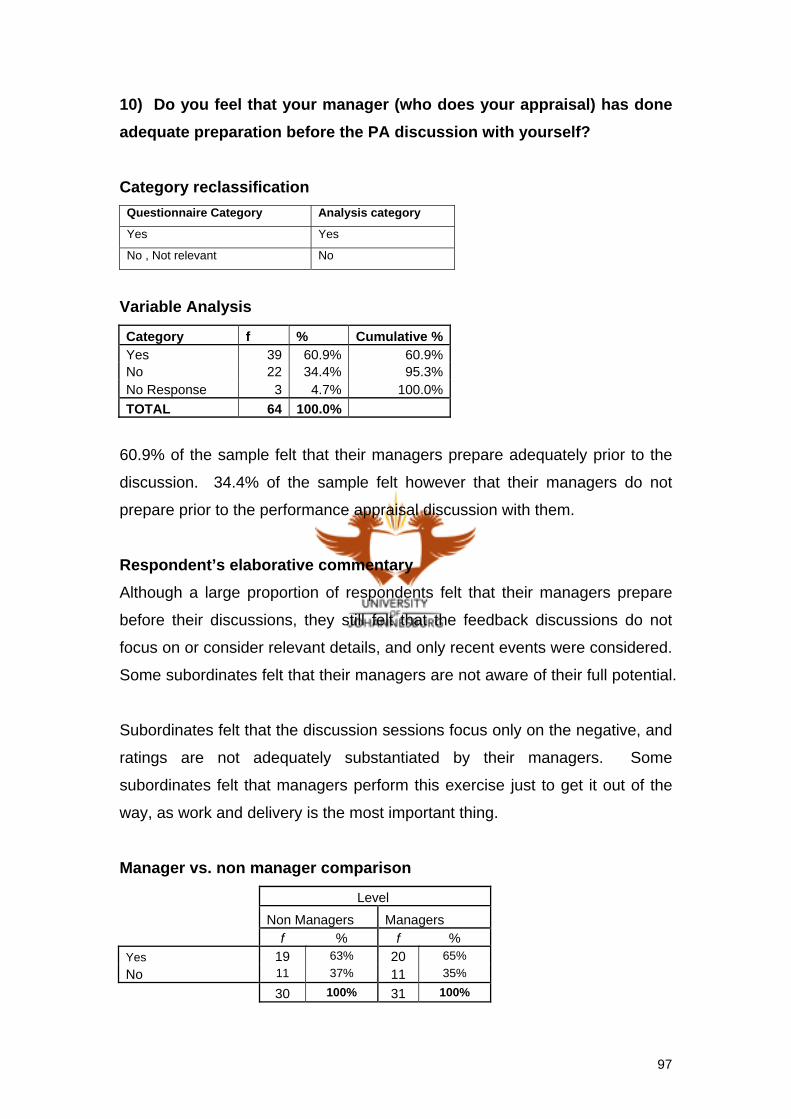
10) Do you feel that your manager (who does your appraisal) has done adequate preparation before the PA discussion with yourself? Category reclassification
Questionnaire Category Analysis category
Yes Yes
No , Not relevant No
Variable Analysis
Category f % Cumulative %Yes 39 60.9% 60.9%No 22 34.4% 95.3%No Response 3 4.7% 100.0%TOTAL 64 100.0%
60.9% of the sample felt that their managers prepare adequately prior to the
discussion. 34.4% of the sample felt however that their managers do not
prepare prior to the performance appraisal discussion with them.
Respondent’s elaborative commentary Although a large proportion of respondents felt that their managers prepare
before their discussions, they still felt that the feedback discussions do not
focus on or consider relevant details, and only recent events were considered.
Some subordinates felt that their managers are not aware of their full potential.
Subordinates felt that the discussion sessions focus only on the negative, and
ratings are not adequately substantiated by their managers. Some
subordinates felt that managers perform this exercise just to get it out of the
way, as work and delivery is the most important thing.
Manager vs. non manager comparison
Level
Non Managers Managers f % f % Yes 19 63% 20 65% No 11 37% 11 35%
30 100% 31 100%
97

There were no differences between the response of managers and non
managers on this variable.
Deductions Although 60.9% of the sample felt that their managers/supervisors prepare for
the performance appraisal discussion, the 34.4% that felt that their
manager/supervisor does not prepare has implications on the credibility of the
discussions and the outcome of the process. This could also relate back to
the fact that although some employees, especially non managers, are given
less than a week to prepare, they do not know that they need to prepare.
Some could also feel there is no need to prepare if managers/supervisors do
not prepare, and ratings are predetermined.
98
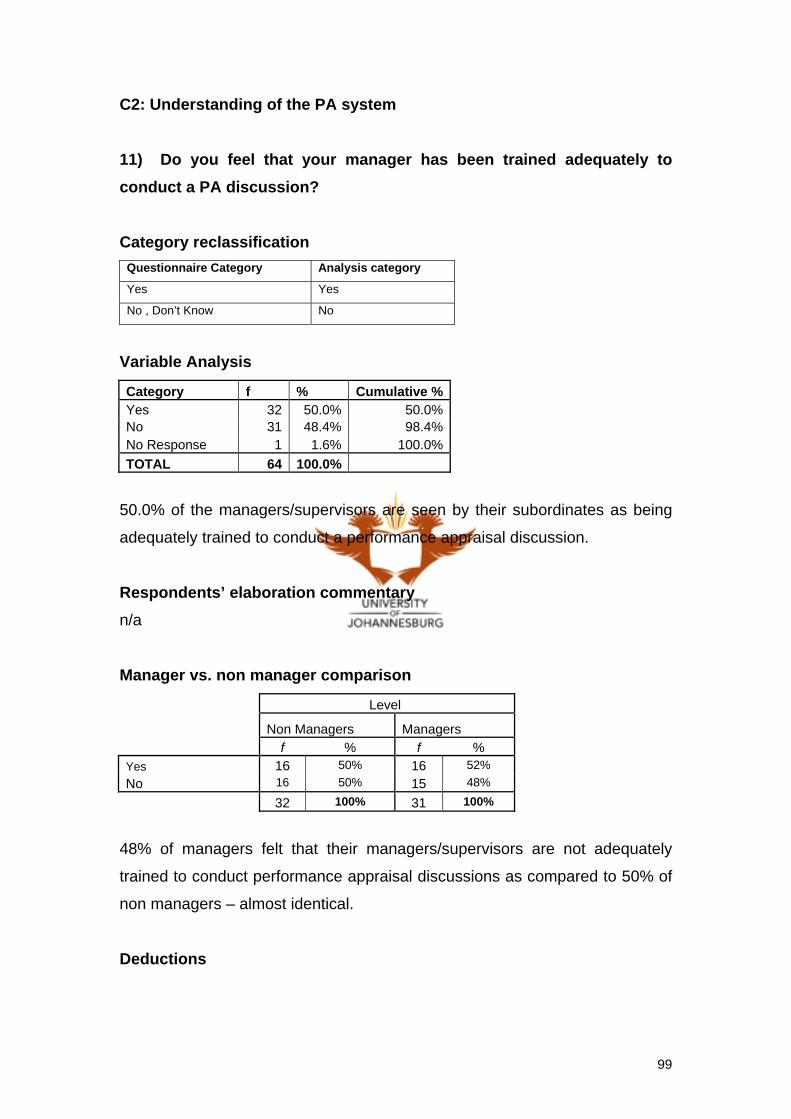
C2: Understanding of the PA system 11) Do you feel that your manager has been trained adequately to conduct a PA discussion? Category reclassification
Questionnaire Category Analysis category
Yes Yes
No , Don’t Know No
Variable Analysis
Category f % Cumulative %Yes 32 50.0% 50.0%No 31 48.4% 98.4%No Response 1 1.6% 100.0%TOTAL 64 100.0%
50.0% of the managers/supervisors are seen by their subordinates as being
adequately trained to conduct a performance appraisal discussion.
Respondents’ elaboration commentary n/a
Manager vs. non manager comparison
Level
Non Managers Managers f % f % Yes 16 50% 16 52% No 16 50% 15 48%
32 100% 31 100%
48% of managers felt that their managers/supervisors are not adequately
trained to conduct performance appraisal discussions as compared to 50% of
non managers – almost identical.
Deductions
99

Close to half of the sample have no confidence in their managers’/supervisors’
ability to conduct a performance appraisal discussion. This like the questions
above points to a lack of confidence on the appraisal process and system.
100
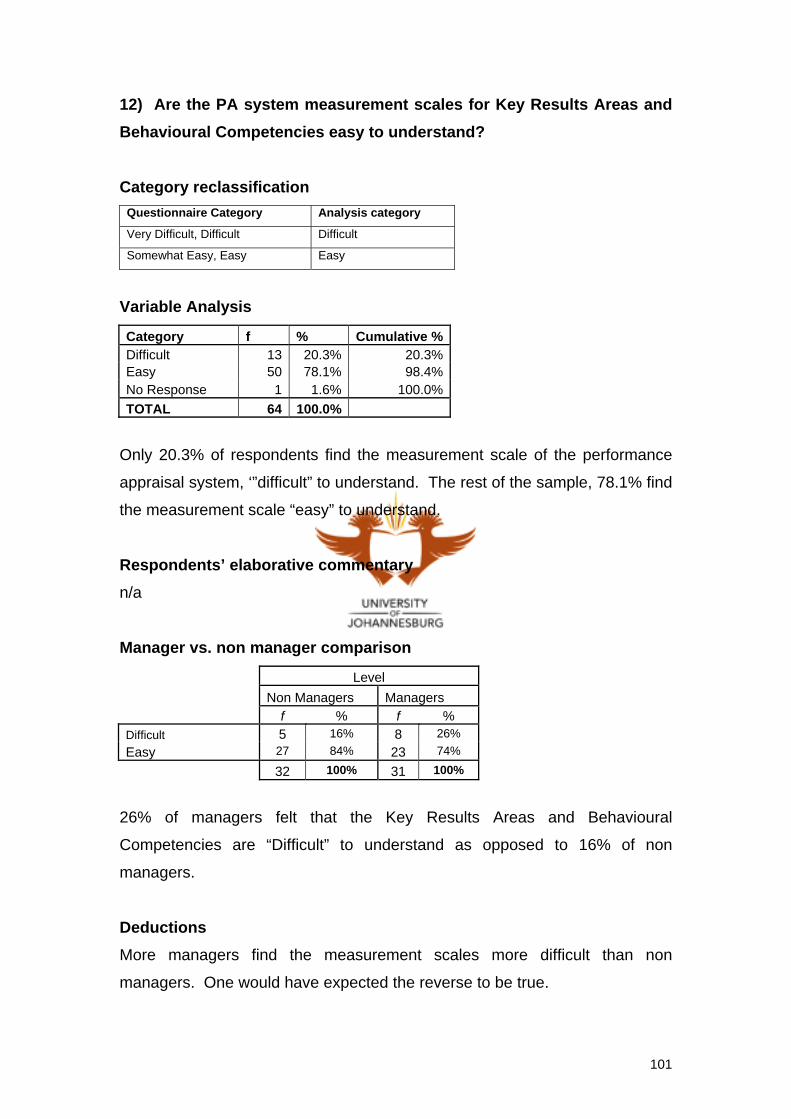
12) Are the PA system measurement scales for Key Results Areas and Behavioural Competencies easy to understand? Category reclassification
Questionnaire Category Analysis category
Very Difficult, Difficult Difficult
Somewhat Easy, Easy Easy
Variable Analysis
Category f % Cumulative %Difficult 13 20.3% 20.3%Easy 50 78.1% 98.4%No Response 1 1.6% 100.0%TOTAL 64 100.0%
Only 20.3% of respondents find the measurement scale of the performance
appraisal system, ‘”difficult” to understand. The rest of the sample, 78.1% find
the measurement scale “easy” to understand.
Respondents’ elaborative commentary n/a
Manager vs. non manager comparison
Level Non Managers Managers f % f % Difficult 5 16% 8 26% Easy 27 84% 23 74%
32 100% 31 100%
26% of managers felt that the Key Results Areas and Behavioural
Competencies are “Difficult” to understand as opposed to 16% of non
managers.
Deductions More managers find the measurement scales more difficult than non
managers. One would have expected the reverse to be true.
101

13) Do you fully understand the current PA system applied? Category reclassification
Questionnaire Category Analysis category
Not al all Do not understand
Understand somewhat, Understand mostly Understand
Variable Analysis
Category f % Cumulative %Do not understand 4 6.3% 6.3%Understand 59 92.2% 98.4%No Response 1 1.6% 100.0%TOTAL 64 100.0%
Only 6.3% of the sample do not understand the current performance appraisal
system applied.
Respondents’ elaborative commentary n/a
Manager vs. non manager comparison
Level Non Managers Managers f % f % Do not Understand 2 6% 2 6%
Understand 30 94% 29 94%
32 100% 31 100%
There is no difference between managers and non managers with regard to
on the above question.
Deductions Despite the 20.3% who find the measurement scale to be “difficult” in
Question (12) above, it is interesting but also contradictory to see that 92.2%
of the sample understand the performance appraisal system applied.
102

14) Are you satisfied with the PA discussion between yourself and your manager? Category reclassification
Questionnaire Category Analysis category
Very Satisfied, Satisfied Satisfied
Dissatisfied, Very dissatisfied Dissatisfied
Variable Analysis
Category f % Cumulative %Satisfied 42 65.6% 65.6%Dissatisfied 21 32.8% 98.4%No Response 1 1.6% 100.0%TOTAL 64 100.0%
65.6% respondents are “satisfied” with their performance discussion between
themselves and their managers. 32.8% are “dissatisfied”.
Respondents’ elaborative commentary n/a
Manager vs. non manager comparison
Level
Non Managers Managers
f % f % Satisfied 22 69% 20 65% Dissatisfied 10 31% 11 35%
32 100% 31 100%
A slightly bigger proportion of non-managers (69%) is “satisfied” with the
performance discussions than the managers (65%).
Deductions Although 65.6% of respondents are “satisfied” with the discussions between
themselves and their managers/supervisors, the percentage that is
“dissatisfied” (32.8%), is of concern. The dissatisfaction between managers
and non-managers groups is over 30% and this needs attention. The
103
dissatisfaction could cover a wide range of issues and perhaps questions to
follow will assist in establishing the source of dissatisfaction.
104

15) How do you feel about user’s (manager & subordinate) ability to interpret measurement scales and critical behaviours in the PA system? Category reclassification None
Variable Analysis
Category f % Cumulative %Open to subjectivity 27 42.2% 42.2%Very Clear 13 20.3% 62.5%No Comment 22 34.4% 96.9%No Response 2 3.1% 100.0%TOTAL 64 100.0%
Although a large number of the sample find the measurement scale
“easy”(78.1%) in Question 12 and 65.6% are “satisfied” with the discussion
between themselves and their managers, Question 14, 42.2% of the sample
still find the interpretation of the measurement scales and critical behaviours
“open to subjectivity”. Only 20.3% finds the interpretation “very clear”.
Respondents’ elaborative commentary Most common comments on this question from the respondents were that the
ratings are predetermined prior to performance appraisal discussion.
Respondents felt that their managers/supervisors are not very open and
honest with them when discussing the ratings and ratings are interpreted to
suit the situation at that particular moment, so as to tie back to the predefined
rating.
Manager vs. non manager comparison
Level Non Managers Managers f % f % Open to subjectivity 10 32% 17 55% Very Clear 6 19% 7 23% No Comment 15 48% 7 23% 31 100% 31 100%
105

55% of managers as opposed to 32% of non managers felt that the
performance system measurement scales and critical behaviours are open to
subjectivity. Approximately half of non managers answered “No comment” for
this question.
Deductions Positive responses came from only 20.3% of the sample, i.e. they felt that the
interpretation is “very clear”. Most of the responses are not very encouraging,
i.e. 42.2% felt that the interpretation is “open to subjectivity” with 55% and
32% of managers and non managers respectively. Once again this questions
the credibility of the system to the users. One factor that stands out from this
analysis is that 34.4% of respondents could not comment on this question,
more so for non managers (48%). Is it because of fear of victimisation, lack of
interest or simply the inability to comment? This is one aspect of the study
that needs close attention especially during the analysis of other questions to
follow.
106

C3: Moderation process 16) In your understanding is the moderation done BEFORE or AFTER the PA discussion between manager and employee? Category reclassification None
Variable Analysis
Category f % Cumulative %Before 25 39.1% 39.1%After 15 23.4% 62.5%Before & After 14 21.9% 84.4%Don’t know 7 10.9% 95.3%No Response 3 4.7% 100.0%TOTAL 64 100.0%
10.9% of the sample “do not know” when the moderation takes place. 39.1%
of the sample understands the moderation to be done “before” the
performance appraisal discussion.
Respondents’ elaborative commentary n/a
Manager vs. non manager comparison
Level Non Managers Managers f % f % Before 9 29% 16 53% After 11 35% 4 13% Before & After 7 23% 7 23% Don't Know 4 13% 3 10%
31 100% 30 100%
Managers and non managers have a different understanding of when
moderation takes place. 53% of managers and 29% of non managers think
that moderation it is done “before”, whilst 13% and 35% of managers and non
managers respectively think that moderation is done “after” the performance
107

appraisal discussion. For both groups there is more than 10% that “do not
know” when moderation takes place.
Deductions There is inconsistent understanding of when moderation takes place among
the staff. This is even more so between the managerial and non-managerial
staff. The responses to this question indicate lack of consistent understanding
in the appraisal process in the organisation.
108

17) In your opinion is the moderation process fair? Category reclassification
Questionnaire Category Analysis category
Not Fair Not Fair
Partially Fair, Fair Fair
Variable Analysis
Category f % Cumulative %Not Fair 21 32.8% 32.8%Fair 34 53.1% 85.9%No Response 9 14.1% 100.0%TOTAL 64 100.0%
32.8% of the respondents felt that moderation is “Not fair”.
Respondents’ elaborative commentary Respondents commented that individuals’ actual performance is diluted by the
forced ranking process. They felt that the fact that in most cases senior
management does the moderation, the process is flawed as most of them are
not close to the individuals’ ability and circumstances. The process is not
transparent enough for line managers to provide relevant input towards the
rating and this is emphasised by the fact that even line managers are given
the predefined ratings by senior managers from which to conduct the
performance appraisal discussions. Respondents felt that the moderation
process is used to slice the bonus pool.
Manager vs. non manager comparison
Level Non Managers Managers f % f % Not Fair 9 33% 12 43% Fair 18 67% 16 57%
27 100% 28 100%
Big differences are seen in the “Not Fair” and “Fair” Category. 43% of
managers, as opposed to 33% of non managers think that the moderation
109

process is “not fair” and 57% of managers and 67% of non managers think
that the moderation process is “fair”.
Deductions There are a significant proportion of employees that felt that line managers
are not involved enough in the determination of their ratings. This is of
concern and 32.8% of the respondents deem the process to be unfair. This is
even more so for the managers’ group. The area of concern here is if
employees at managerial level are not convinced that the process is fair, how
can they be able to convince employees below them?
110

C4: Discussion of the PA review
18) In your last appraisal discussion, how did your manager’s rating compare to yours? Category reclassification None
Variable Analysis
Category f % Cumulative %Better 13 20.3% 20.3%Worse 21 32.8% 53.1%Same 23 35.9% 89.1%No Response 7 10.9% 100.0%TOTAL 64 100.0%
20.3% of the respondents were rated “better” than expected, 32.8% were
rated “worse” than expected and 35.9% were rated as they expected.
Respondents’ elaborative commentary n/a
Manager vs. non manager comparison
Level Non Managers Managers f % f % Better 7 23% 6 23% Worse 11 35% 10 38% Same 13 42% 10 38%
31 100% 26 100%
Although there is no major difference between managers’ and non-managers’
ratings expectations, a slightly higher percentage of managers felt that they
were rated “worse” than expected in their last performance appraisal
discussion with their manager/supervisor. A slightly higher percentage (42%)
of non-mangers felt that the rating received was the “same” as theirs.
111

Deduction The perception of performance for staff and their managers/supervisors is
only consistent for 35.9% of the sample. This is an indication of lack of
feedback other than the appraisal discussion session.
112

19) In your last appraisal discussion, did your manager ask you for your input? Category reclassification None
Variable Analysis
Category f % Cumulative %Yes 46 71.9% 71.9%No 16 25.0% 96.9%No Response 2 3.1% 100.0%TOTAL 64 100.0%
Most subordinates were asked for their input during the performance appraisal
discussion with their managers, 71.9%. Only 25.0% of the sample were not
asked for input during the performance appraisal discussion with their
managers/supervisors.
Respondents’ elaborative commentary n/a
Manager vs. non manager comparison
Level Non Managers Managers f % f % Yes 24 77% 22 71% No 7 23% 9 29%
31 100% 31 100%
Slightly more non-managers (77%) are asked for input during performance
appraisal discussion as opposed to managers (71%).
Deductions Close to a quarter of staff are not asked for input during discussions with their
managers/supervisors. This indicates that there are still cases where the
appraisal sessions are not a discussion but a one way session (top-down).
113

20) In your last appraisal discussion, was your input used in giving the final rating? Category reclassification
Questionnaire Category Analysis category
Yes Yes
No , Not asked for input, Don’t Know No
Variable Analysis
Category f % Cumulative %Yes 26 40.6% 40.6%No 37 57.8% 98.4%No Response 1 1.6% 100.0%TOTAL 64 100.0%
Although 71.9% respondents were asked for input during their performance
appraisal discussions with their managers/supervisors in Question 19 above,
only 40.6% of the respondents’ input is used in the final rating.
Respondents’ elaborative commentary n/a
Manager vs. non manager comparison
Level
Non Managers Managers
f % f % Yes 16 50% 10 32% No 16 50% 21 68%
32 100% 31 100%
50% of non-managers felt that their input was used to determine the final
rating as opposed to 32% of managers. 68% of managers felt that their input
was not used to determine the final rating.
114

Deduction The fact that the input of only 40.6% of the cases is used in determining their
final rating, could undermine the credibility of the process and even
discourage employees from preparing prior to the discussions so as to fully
participate during the discussions with their managers/supervisors. This could
mean that employees feel that the ratings are predefined and there is nothing
that they say that would make the ratings modified. This feeling could even
make them see preparation as a futile exercise.
115

21) Does your manager substantiate his/her rating with specific incidents? Category reclassification None
Variable Analysis
Category f % Cumulative %Always 23 35.9% 35.9%Sometimes 30 46.9% 82.8%Never 8 12.5% 95.3%No Response 3 4.7% 100.0%TOTAL 64 100.0%
35.9% of managers/supervisors “always” substantiate their ratings with
specific incidents. 46.9% substantiate “Sometimes” and 12.9% “never”
substantiate their ratings.
Respondents’ elaborative commentary n/a
Manager vs. non manager comparison
Level Non Managers Managers f % f % Always 10 32% 13 43% Sometimes 17 55% 13 43% Never 4 13% 4 13%
31 100% 30 100%
13% of managers and non-managers have had experience of
managers/supervisors rating them without substantiating with specific
incidents.
Deductions Managers/supervisors need to substantiate their ratings when discussing the
appraisal of staff. 35.6% of cases where this happens is not good enough,
especially in ensuring a credible performance appraisal system. This low
116

substantiation could also be as a result of unclear expectations and
measurement criteria that is agreed and signed by both parties.
117

22) In your last appraisal discussion, did the discussion focus on the following? Category reclassification None
Variable Analysis
Performance Behavioural Competency Development f % Cumulative % f % Cumulative % f % Cumulative % Yes 57 89.1% 89.1% 57 89.1% 89.1% 43 67.2% 67.2% No 5 7.8% 96.9% 4 6.3% 95.3% 18 28.1% 95.3% No Response 2 3.1% 100.0% 3 4.7% 100.0% 3 4.7% 100.0% TOTAL 64 100.0% 64 100.0% 64 100.0%
89.1% of the previous discussions held with subordinates, focused on
Performance and Behavioural Competencies. Only 67.2% of the discussion,
focused on Development.
Respondents’ elaborative commentary n/a
Manager vs. non manager comparison
Performance Behavioural Competency Development Level Level Level
Non Managers Managers
Non Managers Managers
Non Managers Managers
f % f % f % f % f % f % Yes 29 94% 28 90% 30 97% 27 90% 21 68% 22 73% No 2 6% 3 10% 1 3% 3 10% 10 32% 8 27%
31 100% 31 100% 31 100% 30 100% 31 100% 30 100%
Although the focus of discussion is not very different for managers and non
managers with their managers/supervisors, the development discussion is
slightly more for managers than for non-managers.
118

Deductions Development seems to be taking second place when managers/supervisors
discuss performance appraisals with their staff. The current system and forms
do not have a section for development discussion. (See Appendix C and D
for non managers’ and managers’ appraisal forms respectively). This means
that discussions on development plans are not formalised and it is just by
chance that they are discussed, documented and formally implemented with
action plans and timeframes.
119

C5: Outcome of the PA process
23) Briefly describe how you felt BEFORE your last PA discussion. Category reclassification
Questionnaire Category Analysis category
Looking forward to it, Motivated Positive
Anxiety, Down, Scared Negative
Variable Analysis
Category f % Cumulative %Looking forward to it 16 25.0% 25.0%Motivated 14 21.9% 46.9%Anxiety 19 29.7% 76.6%Down 8 12.5% 89.1%Scared 1 1.6% 90.6%No Response 6 9.4% 100.0%TOTAL 64 100.0%
Category f % Cumulative %Positive 30 46.9% 46.9%Negative 28 43.8% 90.6%No Response 6 9.4% 100.0%TOTAL 64 100.0%
46.9% of the respondents felt positive before their performance appraisal
discussion with their managers/supervisors.
Respondents’ elaborative commentary Before the performance appraisal discussions, employees that look forward to
the discussions are the ones that feel that they have been doing well. In most
cases these employees are interested in knowing what development areas
they need to work on, discuss other career opportunities in the bank and want
to use this forum to raise other issues that they have never had time to raise.
There is however, a large group of respondents that felt negative before the
performance appraisal discussion because they perceive that the ratings are
predefined and any discussion is just a formality.
120

Other respondents have not received regular feedback and are therefore
anxious and know that the outcome could be a surprise. Respondents also
felt that the rating is in most cases perception rather than individual true
capability and performance. Respondents also felt that the system is used to
reduce the bank's staff costs.
Manager vs. non manager comparison
Positive Negative Level Level Non Managers Managers Non Managers Managers f % f % f % f % Marked 13 22% 17 31% 17 19% 11 14% Not Marked 47 78% 38 69% 73 81% 70 86%
60 100% 55 100% 90 100% 81 100%
More managers marked a positive feeling before their performance discussion
with their managers/supervisors than non-managers.
Deductions 43.8% of respondents had a negative feeling before discussions with their
managers/supervisors. This feeling could be attributed to many issues
ranging from:
Lack of regular discussions with managers/supervisors;
Anxiety about the senior managers’ perception about individuals; and
Seen as time to receive negative feedback.
121

24) Briefly describe how you felt AFTER your last PA discussion. Category reclassification
Questionnaire Category Analysis category
Angry, Discouraged, Down Negative
Neutral Neutral
Motivated Positive
Variable Analysis
Category f % Cumulative %Angry 8 11.8% 11.8%Discouraged 14 20.6% 32.4%Down 4 5.9% 38.2%Neutral 21 30.9% 69.1%Motivated 16 23.5% 92.6%No Response 5 7.4% 100.0%TOTAL 68* 100.0%
Note*: Some of the respondents ticked more than one selection, hence a total of = 68 and not 64.
Category f % Cumulative %Negative 26 38.2% 38.2%Neutral 21 30.9% 69.1%Positive 16 23.5% 92.6%No Response 5 7.4% 100.0%TOTAL 68 100.0%
38.2% of the respondents experienced a negative feeling after their
performance appraisal discussion. 30.9% are “neutral” and only 23.5% have
a positive feeling, “motivated”.
Respondents’ elaborative commentary Comments of the sample that felt positive after the performance appraisal
discussion were as follows:
Feedback was better than expected;
Their efforts were recognised;
Strengths and weaknesses were highlighted and they knew what to
work on; and
They were told that more responsibilities were to come their way.
The negative feelings were mostly due to the following:
122

Employees’ input was not considered;
Manager could not substantiate rating;
Managers’ comments during the performance appraisal discussion was
not work related;
Deserved better rating than they were given; and
The rating was worse than expected and came as a big surprise.
Manager vs. non manager comparison
Negative Neutral Positive Level Level Level
Non Managers Managers
Non Managers Managers
Non Managers Managers
f % f % f % f % f % f % Marked 10 11% 16 19% 11 37% 10 34% 9 30% 7 25% Not Marked 80 89% 68 81% 19 63% 19 66% 21 70% 21 75%
90 100% 84 100% 30 100% 29 100% 30 100% 28 100%
A very similar number of managers and non managers had a neutral feeling
after their discussions with their managers/supervisors. It is interesting to
note that non managers have a higher percentage (30%) of positive feeling
than managers (25%). Managers have a higher negative feeling (19%) after
their appraisal discussions than their non-manager counterparts (11%).
Deductions More meaningful deductions are drawn from a comparison of this question
(24) and the previous question (23). See summary table below: POSITIVE FEELING
Non Manager Manager
Before After Before After
22% 30% 31% 25%
The number of non managers who had a positive feeling has increased after
their performance appraisal discussions with their managers/supervisors from
22% to 30%, whilst that of managers has decreased from 31% to 25%.
NEGATIVE FEELING
Non Manager Manager
123

Before After Before After
19% 11% 14% 19%
The reverse holds true for negative feeling. Non- managers had decreased
from 19% to 11%& whilst that of managers had increased from 14% to 19%.
The above responses tie up with question 18, where 42% of non-managers
were rated the same as expected as opposed to 38% of managers.
124

25) In your perception, what is the outcome of the PA discussion used for? Category reclassification None
Variable Analysis
Career Development Salary Review Promotion
Category f % Cumulative % f % Cumulative % f % Cumulative %
Yes 38 59.4% 59.4% 50 78.1% 78.1% 33 51.6% 51.6% No 25 39.1% 98.5% 12 18.8% 96.9 28 43.8% 95.4
No Response 1 1.6% 100.0% 2 3.1% 100.0% 3 4.7% 100.0%
TOTAL 64 100.0% 64 100.0% 64 100.0%
Bonus
Release/Exit
Category f % Cumulative % f % Cumulative %
Yes 39 60.9% 60.9 23 35.9% 35.9%
No 21 32.8% 93.7% 29 45.3% 71.2
No Response 4 6.3% 100.0% 12 18.8% 100.0%
TOTAL 64 100.0% 64 100.0%
59.4% perceive the outcome of the performance appraisal discussion to be
used for Career Development, 78.1% for Salary review, 51.6% for
Promotions, 60.9% for Bonus and 35.9% for Exit purposes.
Respondents’ elaborative commentary n/a
125

Manager vs. non manager comparison
Career Development Salary Review Promotion
Level Level Level
Non Managers Managers Non Managers Managers Non Managers Managers
f % f % f % f % f % f %
Yes 19 59% 19 61% 24 75% 26 87% 14 44% 19 66%
No 13 41% 12 39% 8 25% 4 13% 18 56% 10 34%
32 100% 31 100% 32 100% 30 100% 32 100% 29 100%
Bonus Release/Exit
Level Level
Non Managers Managers Non Managers Managers
f % f % f % f %
Yes 17 55% 22 56% 10 36% 13 54%
No 14 45% 17 44% 18 64% 11 46%
31 100% 39 100% 28 100% 24 100%
Perception of use of the performance appraisal discussion outcome for
different categories is widely different for managers and non-managers with
the exception of Career Development and Bonus. More managers than non-
managers believe that the rating is used for promotion and salary review. 56%
of non managers and 34% of managers do not believe that the outcome of the
performance appraisal discussion drives promotions.
Deductions It is notably concerning that a large proportion of non-managers (41%) and
managers (39%) do not perceive the outcome of the performance appraisal to
be used for career development. Responses in this question tie up with
question 22, where the focus of their recent discussion focus on development
was only 67.2%. It is also of concern, especially for managers, to have 44%
of them not thinking that the outcome of the performance appraisals is used
for their bonuses. The responses above suggest that a large percentage of
staff do not see a link between the performance appraisals outcomes and
career development, promotions and bonus. This once again questions the
credibility of the performance appraisal process amongst the employees.
126

26) At your last PA discussion, do you know where in the 20/70/10 ranking your rating placed you? Category reclassification None
Variable Analysis
Category f % Cumulative %Yes 35 54.7% 54.7%No 27 42.2% 96.9%No Response 2 3.1% 100.0%TOTAL 64 100.0%
42.2% of the participants do not know where they fell in the 20/70/10 ranking
of their last performance appraisal discussions.
Respondents’ elaborative commentary n/a
Manager vs. non manager comparison
Level Non Managers Managers f % f % Yes 17 55% 18 58% No 14 45% 13 42%
31 100% 31 100%
Although not very different, slightly more managers (58%) know where in the
20/70/10 ranking their last rating placed them compared to 55% of non-
managers.
Deductions Managers/supervisors do not communicate to staff their ratings, relative to
their peers. This then explains why they do not see the link between their
ratings and outcomes such as promotions and bonuses because they do not
have a yardstick with which to base the ratings. This could explain why only
14.1% of the respondents could not respond to question 17. Not only was
127

there a vastly different understanding of when exactly moderation takes place
in question 16, but there were 10.9% respondents who “do not know” and
4.7% who opted for “no response” to their knowledge of when in the appraisal
process moderation takes place.
128

27) In your opinion, was your final rating and rank used to determine: Category reclassification None
Variable Analysis
Salary Review
Bonus
Category f % Valid % f % Valid %
Yes 42 65.6% 65.6% 32 50.0% 50.0% No 13 20.3% 85.9% 22 34.4% 84.4%
No Response 9 14.1% 100.0% f 15.6% 100.0%
TOTAL 64 100.0% 64 100.0%
Promotion Not used at all
Category f % Valid % f % Valid %
Yes 29 45.3% 45.3% 6 9.4% 9.4% No 25 39.1% 84.4% 29 45.3% 54.7
No Response 10 15.6% 100.0% f 45.3% 100.0%
TOTAL 64 100.0% 64 100.0%
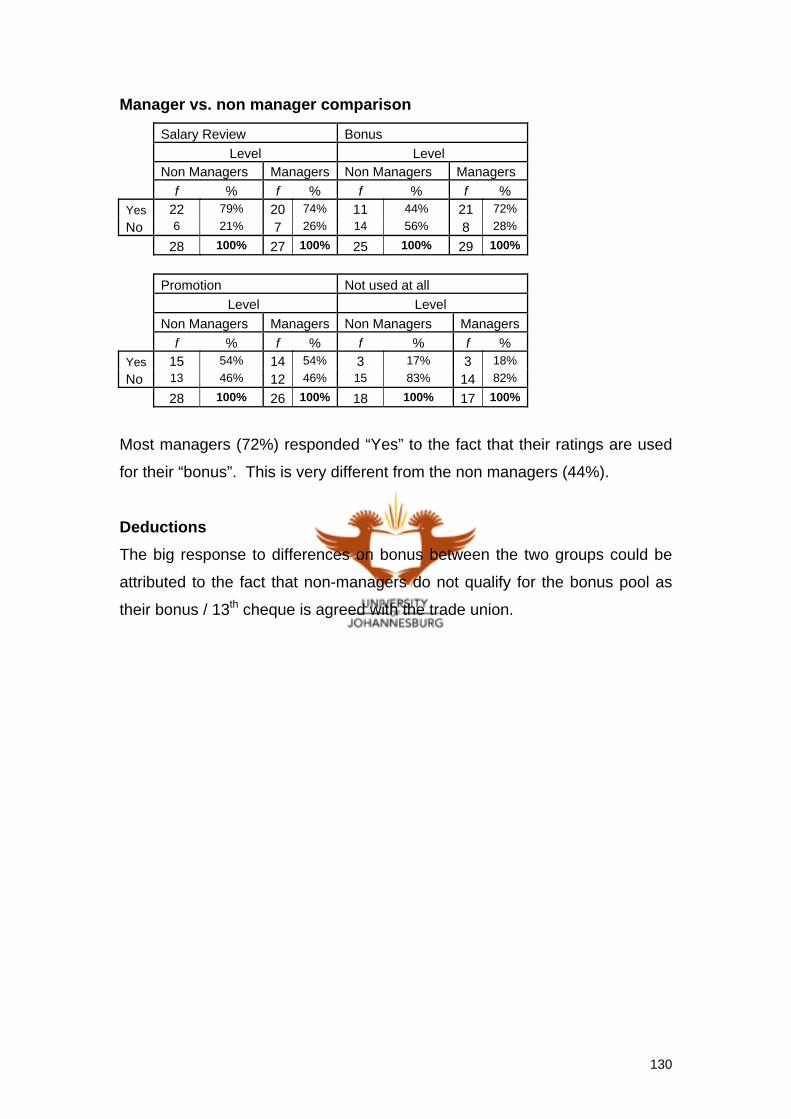
Of the sample, 65.6% said that their rating was used for salary review, 50.0%
for bonus, 45.3% for promotion and 9.4% said the rating was not used at all.
Respondents’ elaborative commentary Although a small percentage of the sample commented that their ratings are
used for salary reviews, bonuses and promotions, there was a large
proportion of the sample that commented that their ratings are not linked to
anything at all.
129
Manager vs. non manager comparison
Salary Review Bonus Level Level Non Managers Managers Non Managers Managers f % f % f % f % Yes 22 79% 20 74% 11 44% 21 72% No 6 21% 7 26% 14 56% 8 28%
28 100% 27 100% 25 100% 29 100%
Promotion Not used at all Level Level Non Managers Managers Non Managers Managers f % f % f % f % Yes 15 54% 14 54% 3 17% 3 18% No 13 46% 12 46% 15 83% 14 82%
28 100% 26 100% 18 100% 17 100%
Most managers (72%) responded “Yes” to the fact that their ratings are used
for their “bonus”. This is very different from the non managers (44%).
Deductions The big response to differences on bonus between the two groups could be
attributed to the fact that non-managers do not qualify for the bonus pool as
their bonus / 13th cheque is agreed with the trade union.
130

C6: Development Plan (“DP”)
28) How would you rate your DP in relation to your long-term (“LT”) career objectives? Category reclassification None
Variable Analysis
Category f % Cumulative %No DP 19 29.7% 29.7%DP-No match to LT career objectives 13 20.3% 50.0%DP-Matches LT career objectives 27 42.2% 92.2%No Response 5 7.8% 100.0%TOTAL 64 100.0%
Note*: DP=Development Plan and LT = Long Term
29.7% of the sample do not have a development plan. 20.3% have a
development plan but in their opinion it is not in line with their long term career
objectives. 42.2% have development plans that are in line with their long term
objectives.
Respondents’ elaborative commentary Although 42.2% responded that they have development plans that are in line
with their long term career objectives, respondents still commented that their
development plans are their own responsibility and they cannot rely on their
managers for that. Respondents also commented that the bank offers them a
job and not a career. Respondents also felt that training offered by the bank
is to enable them to do specific jobs and is not intended to grow their careers.
Some commented that development plans discussed with their managers are
in most cases not formalised and cover short term Key Results Areas.
131

Manager vs. non manager comparison
Level Non Managers Managers f % f % No DP 8 28% 11 37% DP<>LT* 6 21% 7 23% DP=LT* 15 52% 12 40%
29 100% 30 100%
Note*: DP=Development Plan and LT = Long Term
52% of non-managers have development plans that are in line with their long
term career objectives as opposed to 40% of managers. 37% of managers do
not have development plans versus 28% of non-managers. Deductions It is concerning to see that only 42.2% of staff have development plans that
match their long term career objectives. Reading the elaborate commentary
one gets the feeling that even the 42.2%, their managers/supervisors are not
aware of existence of the DPs. Respondents’ commentary gives the reader
an impression that a large proportion of staff do not see their long term career
objectives being met in the organisation (i.e. “the organisation only offers a job
and not career”). It is of concern to see half of the staff having long term
career objectives that are not addressed collectively with their
managers/supervisors.
132

29) Does the DP have actions and time frames?
Category reclassification None
Variable Analysis
Actions Time Frames
Category f % Valid % f % Valid %
Yes 28 43.8% 43.8% 24 37.5% 37.5% No 24 37.5% 81.3% 26 40.6% 78.1%
No Response 12 18.8% 100.0% 14 21.9% 100.0%
TOTAL 64 100.0% 64 100.0%
43.8% of the sample have actions for their development plans and 37.5%
have time frames for their development plans.
Respondents’ elaborative commentary In instances where respondents commented that development plans exist,
actions and time frames are not implemented or closely monitored.
Manager vs. non manager comparison
Actions Time Frames Level Level Non Managers Managers Non Managers Managers f % f % f % f % Yes 17 65% 11 42% 13 52% 11 44% No 9 35% 15 58% 12 48% 14 56%
26 100% 26 100% 25 100% 25 100%
Managers who answered “Yes” to “Actions” on the development plans
comprise just over 42% versus 65% of non-managers. From the above table
it looks like more employees at non-managerial levels have development
plans and these have actions and timeframes. This does not seem to be the
case for employees at managerial levels.
Deductions Development plans are not prioritised by managers and supervisors.
133

C7: Other
30) When are job expectations discussed between you and your manager? Category reclassification None
Variable Analysis
Mid Year PA discussion End Year PA discussion
Category f % Cumulative % f % Cumulative %
Yes 31 48.4% 48.4% 28 43.8% 62.2% Never 15 23.4% 71.8% 17 26.6% 70.4%
No Response 18 28.1% 100.0% 19 29.7% 100.0%
TOTAL 64 100.0% 64 100.0%
Beginning of year Beginning of Assignment
Category f % Cumulative % f % Cumulative %
Yes 19 29.7% 45.2% 18 28.1% 45.0% Never 23 35.9% 65.6% 22 34.4% 62.5%
No Response 22 34.4% 100.0% 24 37.5% 100.0%
TOTAL 64 100.0% 64 100.0%
The percentages on cases where expectations are discussed are very low
irrespective of the time of the year.
Respondents’ elaborative commentary Most people commented that the current expectations are not directly linked
to the Key Results Areas and therefore not always clear. Staff also
commented that Key Results Areas are set too late in the year and not easily
measurable. Staff commented that their seniors use the carrot and stick
approach when discussing Key Results Areas with them.
134

Manager vs. non manager comparison
MidYearPA EndYearPA Level Level
Non Managers Managers
Non Managers Managers
f % f % f % f % Yes 14 61% 17 74% 13 57% 15 68% No 9 39% 6 26% 10 43% 7 32%
23 100% 23 100% 23 100% 22 100%
Start of Year Start of Assignment Level Level
Non Managers Managers
Non Managers Managers
f % f % f % f % Yes 10 48% 9 43% 8 42% 10 48% No 11 52% 12 57% 11 58% 11 52%
21 100% 21 100% 19 100% 21 100%
Both managers’ and non-managers’ experience of expectations discussion
with their seniors is during mid year performance appraisal discussion, (61%
and 74% for non managers and managers respectively) and end of the year
(57% and 68% for non managers and managers respectively). Responses for
start of the year and start of the assignment are less than 50% for both groups
of employees.
Deductions Given that more that half of the staff do not discuss expectations with their
managers/supervisors at the beginning of the year or assignments, one can
concluded that employees carry on with their jobs in most cases without
agreeing on expectations with their managers/supervisors. There is a
significant number of staff that still do not discuss expectations with their
managers/supervisors even during the formal appraisal sessions (23.4% and
26.6% mid year and end year appraisal sessions respectively). It is therefore
not surprising that 32.8 % are dissatisfied with the performance appraisal
discussion in question 14. 32.8% are rated worse that expected in question
18. 43.8% have a negative feeling before the appraisal discussion in question
23 and 38.2% have a negative feeling after their performance appraisal
discussions with their managers/supervisors in question 24.
135

31) Other than the formal Mid Year and End Year PA sessions, do you receive informal feedback during the year? Category reclassification None
Variable Analysis
Category f % Cumulative %Frequently 19 29.7% 29.7%Seldom 28 43.8% 73.4%Never 14 21.9% 95.3%No Response 3 4.7% 100.0%TOTAL 64 100.0%
21.9% of the sample “never” receive informal feedback other than during
formal performance review sessions.
Respondents’ elaborative commentary A large proportion of the sample commented that they receive weekly informal
and monthly formal feedbacks. Some say that informal feedback is only given
when it is negative.
Manager vs. non manager comparison
Level Non Managers Managers f % f %
Frequently 7 23% 12 40%
Seldom 16 52% 12 40% Never 8 26% 6 20%
31 100% 30 100%
Managers receive feedback more “frequently” (40%) whilst non managers
receive feedback “seldom” (52%).
Deductions Percentage of staff that receive no informal feedback is high at 21.9%. This
does not give employees an opportunity continuously to improve themselves
whilst exploiting their strengths. Although more managers receive frequent
136

feedback than non managers, it is surprising to see that in question 18, less of
them (37%) as opposed to 45% of non-managers receive expected ratings.
One can only conclude that the informal feedback does not give an accurate
indication of what the managers/supervisors expect from their subordinates.
Informal feedback should be used as a build up to formal appraisal
discussions and ratings and if they happen that frequently, surprises should
not be expected, unless the measurement criteria and the ratings are
inconsistently interpreted by both parties.
137
32) Please elaborate in general on what your perception is on the effective use of the current performance appraisal system in the bank.
Respondents elaboration commentary A general and most common perception of the sample is that the current
performance appraisal system is open to subjectivity and is biased. Staff felt
that the current system is not transparent enough to give them confidence;
that it is used to drive outcomes such as salary review, bonus and promotions.
Staff perception of the forced ranking is that it is done with no significant input
from line mangers, and senior mangers use it as a tool to slice the bonus pool
to the detriment of high performers. This they sometimes felt to be favourable
for those who are more popular with senior management than others.
Many of them also felt that employees are left alone to conduct the
performance appraisal discussion as they see fit with no formal training and
guidance. This has led them to use their own experience and gut feel, which
opens up the system to inconsistency.
Respondents commented that supervisors and managers should be penalised
for not being able to develop staff under them. They felt that they should
incorporate 360 reviews to moderate the rating outcomes.
Respondents felt that a proper performance appraisal system that is
transparent and openly linked to growth and reward can go a long way as a
retention strategy tool.
138

4.7 WORKSHOP & SURVEY (GROUP FINANCE) Group Finance was one of the divisions that the researcher selected to
include in the sample. In the end the division was excluded from the sample
because Group Finance Human Resources had recently (March 2005)
conducted a workshop and a survey covering broader issues around
Performance Appraisal. Group Finance HR was in the process of defining
action plans for the outcomes of the workshop and the survey. The intention
was to implement the action plans and conduct another similar survey in
March 2006, after implementation of the action plan from March 2005
outcome. To avoid confusion and mixed results, Group Finance HR advised
and allowed the researcher to use the outcome of the workshop and the
survey. The outcomes of the workshop and the survey are discussed in
sections below.
4.7.1 Workshop The workshop was conducted as an open forum, where employees were
given the opportunity to voice out their opinions on a range of issues around
the current performance appraisal process. Outcome of the questions or
issues raised were grouped under common headings and are listed below.
4.7.1.1 Performance Contracts & Key Results Areas (“KRA”)
How KRAs are set and who makes the decision?
Performance contracts are not being discussed and signed.
Performance agreements are not provided when employees rotate or
change jobs in the organisation.
4.7.1.2 Performance Rating
Lack of understanding of the performance rating scale.
Lack of differentiation between a 4 & 5 rating.
139

Managers’ failure to provide clarity on how to achieve a 4 & 5 on the
rating scale.
Performance ratings are discussed by management and allocated prior
to employees’ involvement.
The appropriateness and relevance of the performance scores, salary
increases, bonus and forced ranking are not clear.
Employees are forced to sign performance ratings they do not agree to.
4.7.1.3 Performance appraisal
Lack of understanding of the performance appraisal process.
Lack of consistency in the performance appraisal process.
Performance appraisals are personal and not job related.
The impact of relationship during performance discussions, particularly
when employees have a different view. There appears to be tendency
towards victimisation.
4.7.1.4 Other
Perceived negative attitude displayed by employees.
Lack of management availability to provide regular feedback on
performance.
Where feedback is provided, the focus tends to be on the negative
aspects of performance and very little recognition and acknowledgment
of a job well done.
4.7.2 Survey Group Finance survey was done via email from which staff had to select
voting buttons to indicate “Yes”, “No” and “Somewhat” for the four statements.
The statements were:
My manager had a performance appraisal discussion with me;
My manager discussed 2004 KRA’s with me prior to my performance
appraisal;
140

My manager gave me feedback on positive and negative aspects of my
performance during 2004; and
My manager discussed ways in which I could improve my performance in
2005.
Although there were some “Yes” responses to some of the questions below,
the “No” and “Somewhat” were in the majority. The revelations of the survey
were bundled with that of the workshop and are discussed in the 4.7.3 below.
4.7.3 Group Finance HR summary of the workshop and the survey
Information gathered from Group Finance staff using the workshop and the
survey was summarised by Group Finance HR as listed below.
Managers/supervisors had not discussed performance appraisal with
their subordinates. This was not in the majority.
Line managers need special attention and additional coaching on the
performance appraisal procedures.
There are problems with the performance appraisal process most
notably with setting of KRAs. KRAs are not set and agreed to by most
staff members.
Line managers should be assessed on how well they follow the
performance appraisal process. This should be done through input
from staff and tools such as the multi-rater. This input should form part
of the line managers overall performance rating.
Line managers have not been disciplined to discuss ways in which
performance improvements could be achieved. There seem to be lack
of discussion on both the positive and negative aspects of the
performance.
141

CHAPTER 5: CONCLUSIONS
5.1 Questionnaire - descriptive analysis The questionnaire and Group Finance HR workshop and survey although at
different levels of detail and design, covered issues around performance
appraisal. Apart from the differences in detail and designs, the core outcomes
and findings are similar. Without referring to any study in particular, the
findings will be concluded as per the main themes of the problem statement,
the questionnaire leading to the main objective of the study, to establish the
perception of employees on effective use of the performance appraisal system
in the organisation.
5.1.1 Preparation for the performance appraisal
The study revealed that preparation prior to a formal performance appraisal
discussion is not done adequately in the bank. Non-managers were the group
that was given the least notification prior to the discussion. One can not
ignore the fact that managers/supervisors felt ready for the discussion when
they had time to prepare. This could mean a couple of things, namely
Because of lack of confidence on the manager/supervisors side, they
prefer to catch their subordinates by surprise so that the discussion can
be one way and less confrontational;
Managers/supervisors take the performance appraisal discussion for
granted and the discussion takes place depending on the workload on
their desks;
Managers/supervisors are not held accountable for adhering to the
bank’s performance appraisal process and procedures; or
Managers/supervisors do not understand the importance of the
discussion.
In most cases managers/supervisors deemed the experience as unpleasant.
In section 3.4.1.1, applications of performance management, Edmonstone
142
(1996:10) states that both parties must prepare for the review sessions and
eliminate surprises, assess performance trends and plan for the future.
5.1.2 Training of the performance appraisal process The study has highlighted that the staff have not been trained on how to give
and receive performance appraisal feedback. Managers/supervisors have not
received formal training and use their own experience and gut feel. Lack of
training is a source of inconsistent interpretation from the users of the system.
Subordinates do not think that their managers/supervisors are trained
adequately to perform the exercise and also feel that they do not focus on
relevant issues. This is a big concern as not only does it place users in a
difficult situation in terms of inability to conduct the process accurately and to
deal with different reactions, but most importantly it undermines the credibility
of the process completely.
5.1.3 Understanding of the performance appraisal system and process
Although most participants feel that the measurement scales are easy to
understand, users feel that the ratings are open to subjectivity. There was
also reference to lack of understanding concerning the difference between a
rating of 4 and 5. One other disturbing finding was the inconsistent
understanding of the moderation process. The moderation process is
deemed unfair by a significant proportion of staff. Employees feel that line
managers’ participation is non existent in the moderation process. Employees
can not understand how senior managers can feed the finalised rating to line
managers. Staff feels that line managers drive the discussion to support the
pre defined rating given. One can not help but marry this argument with lack
of preparation given to subordinates, so as to catch them off guard with a
predefined rating that is difficult to justify.
143

5.1.4 Performance appraisal discussion
A large proportion of staff has a negative feeling towards performance
appraisal discussion which is disturbing to note. This could allude to a lack of
clarification regarding expectations from both parties. Employees have a
strong perception that feedback focuses only on negatives. One reads that
discussion and feedback is in most cases one way. Most subordinates are
not requested to give input and if requested, it is not used. Respondents
claim that input is ignored since ratings are predefined.
5.1.5 Use of the outcome of the performance appraisal rating
According to the performance appraisal process (Appendix E), employees’
final ratings range from 1(poor) to 5(outstanding) after which they will be
ranked according to the 20/70/10 forced ranking. Employees could know their
final rating but in most cases they do not know where in the 20/70/10 forced
ranking they are. This bears testimony to employees response is that there is
not a direct link between the performance ratings and drivers such as salary
review, promotions and bonuses. Laud (199:29) states that lack of specificity
in the linkage of outcome of the performance appraisal to the use, leaves
room for numerous mitigating factors to intrude, and may obscure the
motivational purpose of the system.
5.1.6 Career development in performance appraisal discussions
Although a significant number of non managers felt that their career
development aspirations are taken care of, in general career development
was seen as one of the aspects managers/supervisors overlooked. It is
however not surprising because how can one expect to address development
if they can not sufficiently address issues of performance?
Managers/subordinates are doing the bare minimum as expected by Human
Resources, and that is to complete the performance appraisal forms with their
subordinates.
144

Career development is not formalised in the forms and the process. More
disturbing is comments such as “the organisation offers jobs and not
careers”. Mavis (1994:44) agrees with this finding and states that assistance
required by employees for areas that need improvement and solid plans on
how to improve them are often overlooked during the performance appraisal
feedback process.
5.1.7 Overall perception of employees on effective performance appraisal discussions
Employees’ do not believe that their managers/supervisors know what they
are doing regarding the performance appraisal, due to lack of training and use
of predefined ratings. Coupled by the lack of proper understanding of the
process (e.g. moderation, forced ranking, etc) employees do not believe that
the performance appraisal ratings drive any outcome.
5.2 Questionnaire - inferential analysis The hypotheses were formulated to infer from the sample used in the study,
employment perception on effective use of the performance appraisal system
in the organisation.
H1 : Different divisions’ perception on the effective use of the performance
appraisals systems and processes is the same.
H2 : Managerial and non-managerial employees’ perception on the effective
use of the performance appraisals systems and processes is the same.
H3 : Understanding of the purpose of the performance appraisals systems and
processes is the same in all divisions.
H4 : Understanding of the purpose of the performance appraisals systems and
processes is the same for managerial and non-managerial employees.
H5: Perception of users is that performance appraisal outcomes drive
compensations, promotions and development plans in the organisation.
Using SPSS statistical package, the above hypotheses could not be tested
because of the following reasons;
145

There were only 18 cases from the Group IT division, therefore any
statistical comparisons could not produce statistically valid inferences
from which differences could be compared;
Although there were 32 and 31, non-manager and manager
respondents respectively, most of the other variables had categories of
5 or less cases when cross tabulated with position level (i.e. manager
and non-managerial). Where possible such categories were grouped
to use for descriptive comparison analysis.
146

CHAPTER 6: RECOMMENDATIONS Recommendations to address the problems identified in the themes described
above are presented below:
6.1 All staff in the organisation need to go through a training process so as to
establish a common understanding of the organisation’s philosophy of
performance appraisal process. This should cover the following issues:
When are formal appraisal sessions scheduled;
What are the different parties’ roles, expectation and deliverables
throughout the process;
Consistent definitions, interpretation and understanding of the rating
scales;
Consistent definition, interpretation and understanding of the critical
behaviours;
Consistent understanding of what is moderation and why it is
necessary;
Role of line and senior management in the moderation process;
When does moderation take place;
How do the performance ratings link with outcomes such as salary
review, promotions and bonus ;
All staff members must be trained on how to receive feedback; and
Staff with subordinates must be trained on how to receive and give
feedback.
6.2 The final rating of staff must be communicated to staff in the context of
the 20/70/10 forced ranking process. The 20/70/10 forced ranking must
be explained in the context of salary increase and bonus calculation to all
staff. This will make the process transparent and staff can always know
where they are relative to their peers. It is also recommended that good
performance is celebrated informally within the divisions, and individuals
are recognised. This should be supported by informal regular feedback
so as to avoid surprises among and about other individuals.
147

6.3 Definition of Key Result Area must be linked to organisations objective.
The link must be obvious both at senior management and also at the very
lowest level of staff members.
6.4 Management must be held accountable to agree and finalise KRA with
their staff member at the beginning of each year. Measurement criteria
must be agreed and signed by both parties. Management and
supervisors must be encouraged to have regular feedback sessions with
their staff.
6.5 In order to establish the culture of development in the organisation, it is
recommended that performance appraisal and development planning are
treated as separate discussion sessions between line manager and staff.
This will ensure that both performance and development issues are
given the proper attention they deserve and there is no clouding of one
with the other. It is true that some of the performance development
areas may be inputs to the development planning, but this will ensure
that the development planning is long term focused. Development
planning must be a joint effort between line manager and staff with clear
actions, roles of each party, time line and a monitoring process. Smith,
Hornsby & Shirmeyer’s (1997:13) research revealed that managers
prefer objective traditional approach whilst subordinates prefer
developmental collaborative approach.
6.6 It is very difficult to keep up with all the above as staff turnover is high in
the market. In order to ensure continuous consistency of the
performance appraisal philosophy understanding and implementation,
the above training must be incorporated into the induction package for all
new staff members.
148

REFERENCES
Bacal R. 1999. Performance Management. New York: McGraw Hill.
Bateman TS & Snell SA. 2002. Management: Competing in the New Era. 5th
ed. McGraw-Hill: Irwin.
Cook M. 1995. Performance appraisal and true performance. Journal of
Managerial Psycology, 10(7):3-7
City Press. 2005. Self evaluation for career path. City Press, 04 April:4.
DeNisi AS. 1996. Cognitive Approach to Performance Appraisal. Routledge,
London and New York.
Dessler G. 1988. Personnel Management. 4th ed. Prentice Hall.
Edmonstone J. 1996. Appraising the state of performance appraisal. Health
Manpower Management. 22(6):9-13
Fletcher C & Williams R. 1986. Performance Appraisals and Career
Development. Hutchinson Education.
Fletcher S. 1997. Analysing Competence. Kogan Page Limited.
Goodale JG. 1997. Seven ways to improve performance appraisals. Human
Resources Management, 77-80.
Greenhill RT. 1988. Performance Related Pay. Fitzwilliam Publishing Ltd.
Grobler PA, Warnich S, Carrell MR, Elbert NF & Hatfield RD. 2002. Human
Resource Management in South Africa. 2th ed. Thompson Learning.
149

Hartle F. 1995. How to reengineer your performance appraisal process.
London: Kogan Page.
Herbst FJ. 2003. Referencing in Academic Documents – Guidelines.
Johannesburg: Department of Business Management, Rand Afrikaans
University.
Herbst FJ. 2003. Guidelines for compiling the short dissertation.
Johannesburg: Department of Business Management, Rand Afrikaans
University.
Howell K & Cameron E. August 1996. The benefits of an outsider’s opinion.
People Management, 28-30.
Kreitner R & Kinicki A. 2001. Organizational Behavior. 5th ed. McGraw-Hill:
Irwin.
Laud RL. 1992. Performance Appraisal and its link to strategic management
development. Handbook of Management, 5(1):25-31.
Lawler EE & McDermont M. 2003. Current performance management
practices. World of work journal. 12(2):49-60
Mavis M. October 1994. Painless Performance Evaluation. Training &
Development, 48(10):40 – 44.
McAdams JL. 1996. The Reward Plan Advantage. 1st ed. HB Printing.
Molefe. GN. 2004. A support staff performance management model for a
selected tertiary institution in the Tshwane Metropolitan area. Unpublished
M.COM Dissertation, Rand Afrikaans University.
Orpen C. July 1994. Human Resources Management. Management
Appraisal: Can it be more effective? 10(6):26-28
150

Otte FL & Hutcheson PG. 1992. Helping employees manage careers.
Prentice-Hall Inc.
Sunday Times. 2004. How great managers manage people. Sunday Times,
29 August:11
Sunday Times. 2005. Ways to win over your employees – companies who are
keen on keeping their people need to look at how they are treating them.
Sunday Times, 20 March:11.
Smith BN, Hornsby JS & Shirmeyer R. March 1997. Current trends in
Performance Appraisal. An examination of Managerial Practices. SAM
Advance Management Journal, 10-15
Swanepoel BJ & Slabbert JA. 1998. Introduction to employment relations
management. Johannesburg: Juta.
The Star. 2004. Workplace – Edcon Group Case Study. The Star, 14
October:6
Wilson J & Cole G.June 1990. Personnel Management. A healthy approach
to performance appraisal. 46-49
Zikmund WG. 2003. Business Research Methods. 7th ed. Thompson
Learning.
151

ANNEXURES Annexure A : Sampling frame
Name Surname Position Division Start Date Name 1 Surname 1 Clerk, Legal CRDT: HL DURBAN 1995-08-28 Name 2 Surname 2 Officer, Credit Assurance CRDT: HL DURBAN 1998-10-01 Name 3 Surname 3 Manager, Home Loans Granting CRDT: HL DURBAN 1996-09-01 Name 4 Surname 4 Manager, Credit CRDT: HL DURBAN 1986-12-22 Name 5 Surname 5 Manager, Credit Assurance CRDT: HL DURBAN 2002-03-01 . . . . Name n-1 Surname n-1 Officer, Administration CRDT:HL ADMIN 2002-03-01 Name n Surname n Officer, Administration CRDT:HL ADMIN 1987-12-01
I

Annexure B : Questionnaire This questionnaire: Dissertation purposes.
Approximately 20 minutes to complete.
Has 32 Questions, please complete all questions.
The questionnaire has 3 sections namely:
Section A – Personal details (all respondents to fill) Section B – Employees with subordinates (fill only if you have a subordinate)
Section C – Performance Appraisal (all respondents to fill)
See Annexure: Annexure A - Non Managerial form
Annexure B - Managerial form
II

Please mark the appropriate box with an X SECTION A: PESONAL DETAILS
1) In which division are you currently employed?
A: RETAIL CREDIT B: FINANCE C: IT D:OTHER
2) What level is your current position?
A:
NON-
MANAGERIAL
B:
JNR
MANAGER
C:
MID
MANAGER
D:
SNR
MANAGER
E:
EXEC
LEVEL
F:
OTHER
LEVEL
3) How many years have you been with the organisation?
A:
2 – 4 years
B:
5 - 7 years
C:
8 - 10 years
D:
11–13years
D:
14+ years
F:
OTHER
4) How many years have you been in the current position?
A:
< 12months
A:
1-2 years
B:
3-4 years
C:
5-6 years
D:
7+ years
F:
OTHER
SECTION B: EMPLOYEES WITH SUBORDINATES
5) Do you always have enough time to prepare before discussions with your
subordinates?
A:
YES
B:
NO
If NO please elaborate. ………………………………………………………………………………. …………………………………………………………………………………………………………… ……………………………………………………………………………………………………………
6) How do you feel about appraising employees below you?
A:
Daunting
B:
Bad
experience
C:
Playing GOD
E:
Enjoy it
F:
Fulfilling
Please elaborate. ………………………………………………………………………………. …………………………………………………………………………………………………………… ……………………………………………………………………………………………………………
III

7) How do you feel adequately trained to perform a PA discussion?
A:
Inadequate
B:
Partly
adequate
C:
Fully
adequate
Please elaborate …….…………………………………………………………………………. …………………………………………………………………………………………………………… ……………………………………………………………………………………………………………
SECTION C: PERFORMANCE APPRAISAL (“PA”) C1: Preparation by employees
8) For your last PA session how much time were you given for preparation?
A:
<= 2days
B:
3-6 days
C:
1 week
D:
2-3 weeks
E:
4 weeks+
F:
None
9) Was the preparation time given adequate?
A:
Too short B:
Adequate
C:
More than
enough
D:
Not important
to me
10) Do you feel that your manager (who does your appraisal) has done adequate
preparation before the PA discussion with yourself?
A:
YES
B:
NO
C:
Not
relevant
Please motivate…….…………………………………………………………………………. …………………………………………………………………………………… …………………………………………………………………………………… C2: Understanding of the PA system
11) Do you feel that your manager has been trained adequately to conduct a PA
discussion?
A:
YES
B:
NO
C:
Don’t Know
IV

12) Are the PA system measurement scales for Key Results Areas and Behavioural
Competencies easy to understand?
A:
Very difficult
B:
Difficult
C:
Somewhat easy
C:
Very easy
13) Do you fully understand the current PA system applied?
A:
Not at all
B:
Understand
somewhat
C:
Understand
mostly
14) Are you satisfied with the PA discussion between yourself and your manager?
A:
Very satisfied
B:
Satisfied
C:
Dissatisfied
D:
Very dissatisfied
15) How do you feel about user’s (manager & subordinate) ability to interpret
measurement scales and critical behaviours in the PA system?
A:
Open to subjectivity
B:
Very clear
C:
No comment
Please specify…………………………………………………………………………………. …………………………………………………………………………………… …………………………………………………………………………………… C3: Moderation process
16) In your understanding is the moderation done BEFORE or AFTER the PA discussion
between manager and employee?
A:
BEFORE
B:
AFTER
C:
BEFORE & AFTER
D:
DON’T KNOW
17) In your opinion is the moderation process fair?
A:
Not fair
B:
Partially fair
C:
Fair
Please motivate…………………………………………………………………………………. …………………………………………………………………………………… ……………………………………………………………………………………
V

C4: Discussion of the PA review
18) In your last appraisal discussion, how did your manager’s rating compare to yours?
A:
Better
B:
Worse
C:
Same
19) In your last appraisal discussion, did your manager ask you for your input?
A:
Yes
B:
No
20) In your last appraisal discussion, was your input used in giving the final rating?
A:
Yes
B:
No
C:
Don’t know
D:
Not asked for input
21) Does your manager substantiate his/her rating with specific incidents?
A:
ALWAYS
B:
SOMETIMES
C:
NEVER
22) In your last appraisal discussion, did the discussion focus on the following?
(Please answer all questions)
Performance YES NO
Behavioural Competencies YES NO
Development YES NO
C5: Outcome of the PA process
23) Briefly describe how you felt BEFORE your last PA discussion.
A:
Looking forward
to it
B:
Motivated
C:
Anxiety
D:
Down
E:
Scared
Provide reasons for this feeling………………………………………………………………………. ……………………….…………………………………………………………………………………… ……………………….……………………………………………………………………………………
24) Briefly describe how you felt AFTER your last PA discussion.
A:
Angry
B:
Discouraged
C:
Down
D:
Neutral
E:
Motivated
Provide reasons for this feeling....…………………………………………………………….. ……………..……………………………………………………………………………………… ……………..………………………………………………………………………………………
VI

25) In your perception, what is the outcome of the PA discussion used for?
(Please answer all questions)
Career development YES NO
Salary review YES NO
Promotion YES NO
Bonus YES NO
Release/Exit YES NO
Don’t know YES NO
26) At your last PA discussion, do you know where in the 20/70/10 ranking your rating
placed you?
A:
YES
B:
NO
27) In your opinion, was your final rating and rank used to determine:
Salary YES NO
Bonus YES NO
Promotion YES NO
Not used al all YES NO
Please specify ………………………………………………………………………………… ………………………………………………………………………………….. ………………………………………………………………………………..…
C6: Development Plan (“DP”)
28) How would you rate your DP in relation to your long-term (“LT”) career objectives?
A:
No DP
B:
Have DP – No match with LT career
objectives
C:
Have DP - Matches LT career
objectives
Please specify ………………………………………………………………………………… ………………………………………………………………………………….. ………………………………………………………………………………..…
VII

VIII
29) Does the DP have actions and time frames?
Actions YES NO
Time frames YES NO
Please specify ………………………………………………………………………………… ………………………………………………………………………………….. ………………………………………………………………………………..…
C7: Other
30) When are job expectations discussed between you and your manager?
During PA (mid year discussion) YES NO
During PA (end year discussion) YES NO
Beginning of each year YES NO
Beginning of each assignment YES NO
Please specify ………………………………………………………………………………… ………………………………………………………………………………….. ………………………………………………………………………………..…
31) Other than the formal Mid Year and End Year PA sessions, do you receive informal
feedback during the year?
A:
Frequently
B:
Seldom
C:
Never
Please specify ………………………………………………………………………………… ………………………………………………………………………………….. ………………………………………………………………………………..…
32) Please elaborate in general on what your perception is on the effective use of the
current performance appraisal system in the bank.
GENERAL COMMENTS
……………………………………………………………………………………………………….
……………………………………………………………………………………………………….
……………………………………………………………………………………………………….
……………………………………………………………………………………………………….
……………………………………………………………………………………………………….
……………………………………………………………………………………………………….

ANNEXURE C: Non Managerial PA forms
GENERAL STAFF PERFORMANCE REVIEW
RETAIL CREDIT
EMPLOYEE PERSONAL DETAILS:
e Surnam Initials Personnel Number Position Title Job Family Level IBT Business Unit NSTRUCTIONS: I The Performance Assessment has four parts:
IX

(i) A set of Principal Accountabilities (PA’s) (ii) Key Result Areas (KRAs) (iii) Critical Behaviours (CB’s) (iv) Future Development Planning
Please complete each part during the discussion with the appraisee and record the outcomes on the spreadsheet provided.
SECTION I PRINCIPAL ACCOUNTABILITIES
Every position exists for a specific purpose. The purpose may be described by a set of Principal Accountabilities. These are the enduring deliverables for which a position holder is responsible. Usually, there are no more than seven Accountabilities. Please describe below those Principal Accountabilities associated with the position under review (principal accountabilities as per the current job description). These should be discussed and agreed with the employee so that he/she is quite clear about his/her accountabilities.
SECTION I PRINCIPAL ACCOUNTABILITIES
1 2 3 4
X

5 SECTION II KEY RESULT AREAS (KRAS)
Identify and agree on the appraisee's Key Result Areas and write them into the space provided below. Agree a relative weighting per KRA and write this in the appropriate column (decimal ratings may be used). Assess actual performance by rating each KRA.
Rating Weight % KRA Description 1 2 3 4 5 Weight x Rating (unrounded)
1
2
3
4
5 10% Customer service
100% Unrounded KRA total
Notes: Weight must add to 100%.
XI
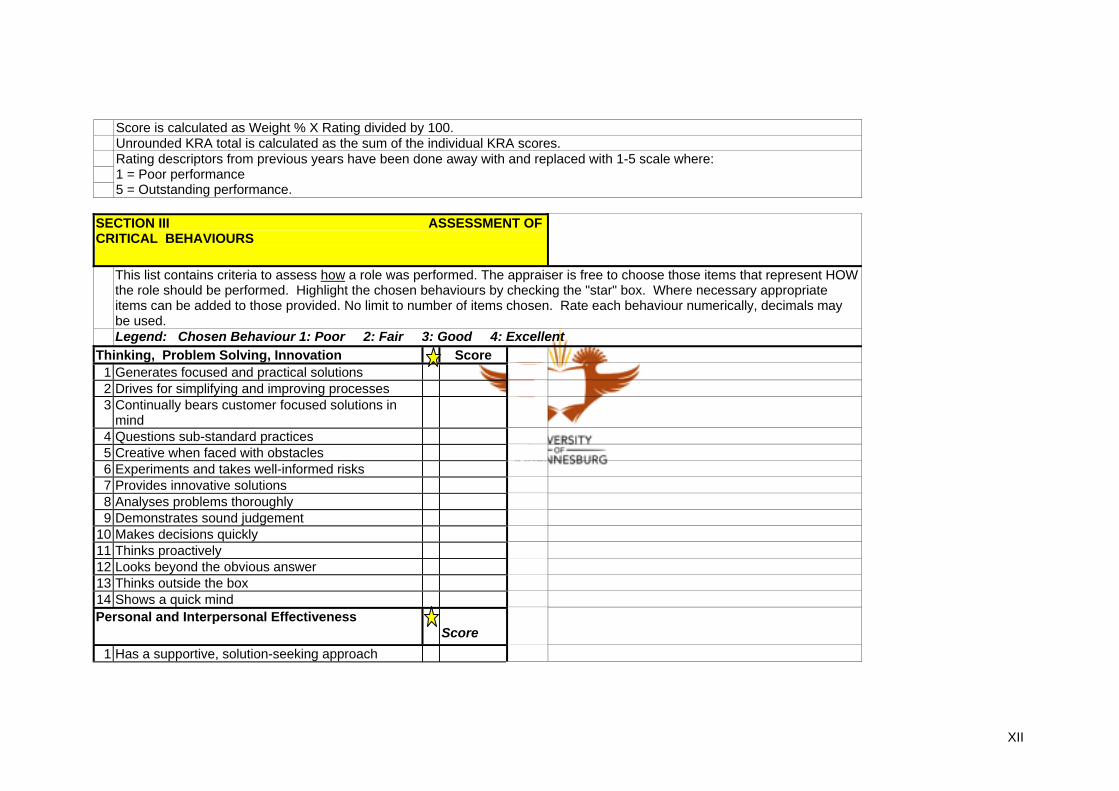
Score is calculated as Weight % X Rating divided by 100. Unrounded KRA total is calculated as the sum of the individual KRA scores.
Rating descriptors from previous years have been done away with and replaced with 1-5 scale where: 1 = Poor performance 5 = Outstanding performance.
SECTION III ASSESSMENT OF CRITICAL BEHAVIOURS
This list contains criteria to assess how a role was performed. The appraiser is free to choose those items that represent HOW the role should be performed. Highlight the chosen behaviours by checking the "star" box. Where necessary appropriate items can be added to those provided. No limit to number of items chosen. Rate each behaviour numerically, decimals may be used.
Legend: Chosen Behaviour 1: Poor 2: Fair 3: Good 4: Excellent Thinking, Problem Solving, Innovation Score
1 Generates focused and practical solutions 2 Drives for simplifying and improving processes 3 Continually bears customer focused solutions in
mind 4 Questions sub-standard practices 5 Creative when faced with obstacles 6 Experiments and takes well-informed risks 7 Provides innovative solutions 8 Analyses problems thoroughly 9 Demonstrates sound judgement
10 Makes decisions quickly 11 Thinks proactively 12 Looks beyond the obvious answer 13 Thinks outside the box 14 Shows a quick mind Personal and Interpersonal Effectiveness
Score 1 Has a supportive, solution-seeking approach
XII

SECTION III ASSESSMENT OF CRITICAL BEHAVIOURS
This list contains criteria to assess how a role was performed. The appraiser is free to choose those items that represent HOW the role should be performed. Highlight the chosen behaviours by checking the "star" box. Where necessary appropriate items can be added to those provided. No limit to number of items chosen. Rate each behaviour numerically, decimals may be used.
Legend: Chosen Behaviour 1: Poor 2: Fair 3: Good 4: Excellent 2 Works as part of a team and builds relationships 3 Challenges people while supporting them 4 Praises people for good work 5 Selects the best people and rewards them 6 Coaches and shapes performance 7 Manages poor performance 8 Motivates people and builds enthusiasm 9 Develops people
10 Celebrates successes 11 Contributes towards a positive working environment12 Values differences in others 13 Customer and service orientated 14 Shows respect for others 15 Provides support for others 16 Communicates and networks 17 Shows self confidence 18 Is realistic about his/her abilities 19 Demonstrates trustworthiness and integrity 20 Open to change 21 Deals effectively with ambiguity 22 Sensitive to others Motivation, Purpose, Drive
Score 1 Shows energy and drive 2 Focuses on delivering re lts su
XIII

SECTION III ASSESSMENT OF CRITICAL BEHAVIOURS
This list contains criteria to assess how a role was performed. The appraiser is free to choose those items that represent HOW the role should be performed. Highlight the chosen behaviours by checking the "star" box. Where necessary appropriate items can be added to those provided. No limit to number of items chosen. Rate each behaviour numerically, decimals may be used.
Legend: Chosen Behaviour 1: Poor 2: Fair 3: Good 4: Excellent 3 Action and practical solution orientated 4 Learns and develops herself / himself 5 Shows commitment in the face of obstacles 6 Optimistic, even under adverse conditions 7 Motivates people to be goal directed 8 Enthusiastic about future possibilities 9 Willing to take responsibility
10 Willing to accept responsibility Overall Critical Behaviour Assessment rating:
XIV

Moderator: ____________________________ Date: ____________
I have seen the contents of my Performance Assessment and it was fully discussed with me.
I accept the contents as fair. I have made my comments in a separate statement which I have handed to my manager for attachment hereto.
Yes No
Yes No
Appraisee: ____________________________ Date: ____________
Appraiser: ____________________________ Date: ____________
XV

ANNEXURE D: Managerial PA forms
RETAIL CREDIT Managerial Review
EMPLOYEES PERSONAL DETAILS: Surname
Initials Personnel number Job Family Level
Area: IBT number
Current Position Title
XVI

EXPLANATION OF PERFORMANCE RATING SCALE: Performing below the required standards (B):
Performs below the required standards, needing constant supervision and often making mistakes. Although some of the required skills are present, application on the job is weak. Care of internal\external customers suffers, as the service provided is of a low standard. The contribution of the individual is deficient, with extensive formal, and on-the-job training as well as performance counselling necessary. Generally performing to most of the required standards (G): Meets most of the standards. Generally capable of performing at the desired level, but performance/provision of customer care may be inconsistent due to skills deficit and/or inability to apply skills/knowledge on the job. Formal and/or on-the-job training may be required to perform at the fully competent level. Performing at the fully competent level (F): Meets all of the standards. Has all the required skills and knowledge to perform the job independently and applies skills and knowledge to provide good levels of customer service consistently and reliably. Contribution is considerable and supervision is rarely required. Surpassing most of the required standards (S):
Surpasses most of the required standards. Apart from having all the required knowledge , skills and ability, also demonstrates a sustained commitment to excellent performance, providing well above average customer service by often putting in the extra effort. Rarely, if ever requires supervision, making very few errors and is expert in the job. Contribution to the team is constructive and the level of customer service provided by the whole team is enhanced by the individual's approach. Exemplifies the level of excellence to be aimed for in customer service. Performing at an outstanding level (O/S):
Consistently surpasses most of the standards. As well as producing an exceptionally high level of work, is able to function beyond the requirements of the job. Able to act as advisor to others, solving problems and providing coaching. Functions as an informal leader, using depth of knowledge and personal skill to encourage the improvement of performance/customer service delivered by the entire team.
XVII

PART A: APPRAISAL OF PAST PERFORMANCE Section 1: Appraisal of Key Result Areas (KRAs) - contributes 70% towards the overall performance rating. State the KRA, weight the importance of each KRA to the job, by filing in a percentage. For each KRA fill in a score (1-5) in the score column, multiply each KRA score by its weight and record this figure in the Weight X Score column. Add the scores in this last column to arrive at an unrounded total.
No. Weight Key Result Areas Standards/ Measures Score Weight X
Score 1 2 3 4 5 10% Customer Service
100% UNROUNDED TOTAL Example: Score Key: Weighting X Score = Score Performing below required standards (B) = Score 0 - 1.99
70% X 3.25 = 2.28 Generally performing to most of the required standards (G) = Score 2.00 - 2.99 30% X 4 = 1.20 Performing at the fully competent level (F) = Score 3.00 - 3.99
Unrounded Total = 3.48 Surpassing most of the required standards (S) = Score 4.00 - 4.99 Performing at an outstanding level (O/S) = Score 5
XVIII

Section 2: Appraisal of Behavioural Competencies - contributes 30% towards the overall performance rating. Evaluate the importance of each competency to the job by placing a tick in the critical box. Tick the scale descriptor box that best describes the appraisee's performance level for each competency,decimals may be used. Rating scale: 1 - Below Standard, 2 - Generally Performing, 3 - Fully Competent, 4 - Surpassing, 5 - Outstanding
Critical Competency Score Comments
Showing initiative
Problem solving
Decision making/applying
Displays business curiosity
Relationship building and networking
Negotiation
Self development
People management
Communication
Team effectiveness
Developing subordinates
Driving change
Planning
Overall Critical Behaviour Assessment Rating:
XIX

The overall rating comprises 70% of the unrounded KRA rating + 30% of the overall Critical behaviour assessment rating. Example:
Overall KRA rating (unrounded) = 3.50
Overall Critical Behaviour assessment rating= 3.00 3.50 X 70% = 2.45 3.00 X 30% = 0.90 ,
Overall unrounded rating = 3.35 Moderator:
ame
N Signature Date Appraiser: Comments: Name Signature Date Appraisee: Comments: Name Signature Date
XX

Tick as appropriate: I have seen the contents of my Review discussion form and it was fully discussed with me.
Yes No
I accept the contents as fair
Yes No
I have made my comments in a separate statement which will be submitted to the Human Resources Department.
Yes No
PART B: FUTURE PERFORMANCE GOALS Future Key Result Areas (KRAs)
No. Weight Key Result Area 1 …….% 2 …….% 3 …….% 4 …….% Customer Service 5 10%
100%
XXI

Annexure E: Organisations internal performance appraisal process
1 2 3
Preliminary Appraisal input
Ranking
8
Moderation panel
Reward
One-on-one discussions take place
4Changes flagged and applied
Anomalies raised, discussed and applied in need
Final Ranking
XXII 7 65

Moderation panel Ranking Preliminary Appraisal input
KEY MEASURESKey Result Areas Behavioural Competencies Skills assessment (training attended and NQF) Noteworthy events Potential Grid Retention of key staff Leadership (360 Degree appraisals) Staff Development (mentoring and coaching) Personal Development Innovation (projects) Branch audit and inspection reports/Compliance. Knowledge of the appraisee
Appraiser completes appraisal form and discusses individual appraisals with key Moderators.
XXIII

Changes made by the moderation panel are “flagged” and communicated by the HR representative to the relevant appraiser if the latter was not part of the moderation panel
Changes flagged and applied
One-on-one appraisal discussions. Changes made as a result of the appraisal discussions are communicated to HR per spreadsheet to be updated together with the previously “flagged” changes. Employee advised of ranking category.
One-on-one appraisal discussions take place
Anomalies raised, discussed and applied in need
Final Ranking
XXIV

XXV
Reward
Final Ranking
Market position and performance. Current reward should be evaluated against the relevant market for the position under consideration and the performance of the incumbent.
Market vulnerability. It may in rare cases be justifiable to increase the reward eligibility of sound employees who will be difficult to replace or in respect of whom some other urgent retention imperative exists
Final ranking is provided to CMC to complete the reward review in line with ranking outcomes and guidelines provided as part of the annual reward review process.

General Staff Interim Appraisal Timelines
Preliminary Appraisal input
RankingModeration panel
Final Performance Ranking
Anomalies raised, discussed and applied in need
Changes flagged and applied
One-on-one discussions take place
14 – 18 June
21 – 28 June
20 - 23 July
29 June – 19 July26 – 30 July
XXVI

Managerial Staff Interim Appraisal Timelines
Preliminary Appraisal input
RankingModeration panel
Final Performance Ranking
Anomalies raised, discussed and applied in need
Changes flagged and applied
One-on-one discussions take place
26 – 30 July
2 – 13 Aug
26-27 Aug
16-26Aug30-3Sept
XXVII

Ranking
•Employees are compared to each other, and assigned a number that supposedly indicates whether they are more, similarly, or
less effective than their colleagues.
•Encourages managers to evaluate employees honestly, provide clearer distinctions between employees and promote a high-
performance culture.
•Formal ranking: 20:70:10.
•Moderation Panels to be used as objective measurements in performance ranking and as reward distribution panels for reward
ranking.
Moderation Guidelines – Retail Banking
OVERVIEW:
The purpose of moderation is to ensure that appraisal outcomes of individuals are aligned with the broader performance context of
their specific area/division/province and accurately reflects the overall performance of Retail Banking. The initial focus will be to
prepare sufficiently, using the ranking framework to contextualise, the comparative employee contribution and deliverables in
XXVIII

accordance with the overall outputs as represented in the business results. Additional factors as listed in the key measures can be
considered to ensure that a holistic view is taken in the final rankings as described in the moderation process phases.
MODERATION PROCESS
Phase 1 Appraiser completes appraisal form and discusses individual appraisals with key moderators (individual who will sign as moderator)
Phase 2 Excel spreadsheets with rankings captured by the relevant HR department
Phase 3 Moderation panel discuss and consider ranking outcomes in conjunction with appraisal input in accordance with roles and
responsibilities of the panel. HR practitioner presents “bell curve” data and moderation panel agrees to changes where applicable.
Phase 4 Changes made by the moderation panel need to be “flagged” and communicated by the HR representative to the relevant appraiser
if the latter was not part of the moderation panel.
XXIX
Phase 5 One-on-one appraisal discussions. Changes made as a result of the appraisal discussions need to be communicated to HR per
spreadsheet to be updated together with the previously “flagged” changes. Employee advised of ranking category.
Phase 6 Final ranking is provided to Career Management Committee to complete the reward review in line with ranking outcomes and
guidelines provided as part of the annual reward review process.
ROLE AND RESPONSIBILITIES OF THE MODERATION PANEL
• Reviews the appropriateness and consistency of the ratings and verify forms for correctness and completeness
• Encourages the elimination of excessive strictness, leniency, inconsistency and other biases, encouraging the full utilisation of
the rating scale.
• Consult with the appraiser (s) where opinions differ and reach consensus prior to appraisal discussion. Focus on preparation
and not prejudging outcomes.
ROLE OF THE HR PRACTIONER(FACILITATOR)
• Ensures that issues relating to dissatisfaction are followed up
• Provides guidance on performance related issues
• Plays a mediation role in difficult appraisal outcomes
• Makes management information available to assist with ongoing performance management
XXX