chapter 4: demand opener. copyright © pearson education, inc.slide 2 chapter 4, opener essential...
TRANSCRIPT

Chapter 4: DemandOpener
Chapter 4: DemandOpener

Copyright © Pearson Education, Inc. Slide 2Chapter 4, Opener
Essential QuestionEssential Question
• How do we decide what to buy
Copyright © Pearson Education, Inc. Slide 3Chapter 4, Opener
Guiding QuestionsGuiding Questions
• Section 1: Understanding Demand– How does the law of demand affect the
quantity demanded?• The law of demand states that as the price of a
good or service increases, the quantity of that good or service will decrease.
Copyright © Pearson Education, Inc. Slide 4Chapter 4, Opener
Guiding QuestionsGuiding Questions
• Section 2: Shifts in the Demand Curve– Why does the demand curve shift?
• Many factors can cause the demand curve to shift including change in price, change in people’s income, consumer expectations, and demographics.

Copyright © Pearson Education, Inc. Slide 5Chapter 4, Opener
Guiding QuestionsGuiding Questions
• Section 3: Elasticity of Demand– What factors affect elasticity of demand?
• Elasticity of demand is determined by how readily available adequate substitutes are as well as whether or not a person needs the good or service.

Chapter 4: DemandSection 1
Chapter 4: DemandSection 1

Copyright © Pearson Education, Inc. Slide 7Chapter 4, Opener
ObjectivesObjectives
1. Explain the law of demand.
2. Describe how the substitution effect and the income effect influence decisions.
3. Create a demand schedule for an individual and a market.
4. Interpret a demand graph using demand schedules.

Copyright © Pearson Education, Inc. Slide 8Chapter 4, Opener
Key TermsKey Terms
• demand: the desire to own something and the ability to pay for it
• law of demand: consumers will buy more of a good when its price is lower and less when its price is higher
• substitution effect: when consumers react to an increase in a good’s price by consuming less of that good and more of a substitute good

Copyright © Pearson Education, Inc. Slide 9Chapter 4, Opener
Key Terms, cont.Key Terms, cont.
• income effect: the change in consumption that results when a price increase causes real income to decline
• demand schedule: a table that lists the quantity of a good a person will buy at various prices in a market
• market demand schedule: a table that lists the quantity of a good all consumers in a market will buy at various prices
• demand curve: a graphic representation of a demand schedule

Copyright © Pearson Education, Inc. Slide 10Chapter 4, Opener
IntroductionIntroduction
• How does the law of demand affect the quantity demanded?
– Price changes always affect the quantity demanded because people buy less of a good when the price goes up.
– By analyzing demand schedules and demand curves, you can see how consumers react to changes in price.

Copyright © Pearson Education, Inc. Slide 11Chapter 4, Opener
DemandDemand
• Demand is the desire to own something and the ability to pay for it.
– The law of demand states that when a good’s price is lower, consumers will buy more of it. When the price is higher, consumers will buy less of it.• The law of demand is the result of the substitution
effect and the income effect --two ways that a consumer can change his or her spending patterns. Together, they explain why an increase in price decreases the amount consumers purchase.

Copyright © Pearson Education, Inc. Slide 12Chapter 4, Opener

Copyright © Pearson Education, Inc. Slide 13Chapter 4, Opener
The Law of Demand in ActionThe Law of Demand in Action
• Checkpoint: What happens to demand for a good when the price increases?
– Changes in price are an incentive; price changes always affect quantity demanded because people buy less of a good when its price goes up.

Copyright © Pearson Education, Inc. Slide 14Chapter 4, Opener
The Substitution EffectThe Substitution Effect
• The substitution effect takes place when a consumer reacts to a rise in the price of one good by consuming less of that good and more of a substitute good. The substitution effect can also apply to a drop in prices.

Copyright © Pearson Education, Inc. Slide 15Chapter 4, Opener
The Income EffectThe Income Effect
• The income effect is the change in consumption that results when a price increase causes real income to decline.
– Economists measure consumption in the amount of a good that is bought, not the amount of money spent on it.
– The income effect also operates when the price is lowered. If the price of something drops, you feel wealthier. If you buy more of a good as a result of a lower price, that’s the income effect at work.

Copyright © Pearson Education, Inc. Slide 16Chapter 4, Opener
Demand SchedulesDemand Schedules
• The law of demand explains how the price of an item affects the quantity demanded of that item.
• To have demand for a good, you must be willing and able to buy it at a specified price.
• A demand schedule is a table that lists the quantity of a good that a person will purchase at various prices in the market.

Copyright © Pearson Education, Inc. Slide 17Chapter 4, Opener
Market Demand SchedulesMarket Demand Schedules
• A market demand schedule shows the quantities demanded at various prices by all consumers in the market.– Market demand schedules are used to predict
the total sales of a commodity at several different prices.
– Market demand schedules exhibit the law of demand: at higher prices the quantity demanded is lower.

Copyright © Pearson Education, Inc. Slide 18Chapter 4, Opener
Demand SchedulesDemand Schedules
• Demand schedules show that demand for a good falls as the price rises.– How does market demand change when the price
falls from $3 to $2 a slice?

Copyright © Pearson Education, Inc. Slide 19Chapter 4, Opener
The Demand GraphThe Demand Graph
• A demand curve is a graphic representation of a demand schedule.
– The vertical axis is always labeled with the lowers possible prices at the bottom and the highest prices at the top.
– The horizontal axis should be labeled with the lowest possible quantity demanded at the left and the highest possible quantity demanded on the right.

Copyright © Pearson Education, Inc. Slide 20Chapter 4, Opener
Demand CurvesDemand Curves
• Ashley’s demand curve shows the number of slice she is willing and able to buy at each price, while the market demand curve shows demand for pizza in an entire market.– How are the demand curves similar?

Copyright © Pearson Education, Inc. Slide 21Chapter 4, Opener
Market Demand CurvesMarket Demand Curves
• All demand schedules and demand curves reflect the law of demand.
• Market demand curves are only accurate for one very specific set of market conditions. They cannot predict changing market conditions.

Copyright © Pearson Education, Inc. Slide 22Chapter 4, Opener
ReviewReview
• Now that you have learned how the law of demand affect the quantity demanded, go back and answer the Chapter Essential Question.– How do we decide what to buy?

Chapter 4: DemandSection 2
Chapter 4: DemandSection 2

Copyright © Pearson Education, Inc. Slide 24Chapter 4, Opener
ObjectivesObjectives
1. Explain the difference between a change in quantity demanded and a shift in the demand curve.
2. Identify the factors that create changes in demand and that can cause a shift in the demand curve.
3. Give an example of how a change in demand for one good can affect demand for a related good.

Copyright © Pearson Education, Inc. Slide 25Chapter 4, Opener
Key TermsKey Terms
• ceteris paribus: a Latin phrase that means “all things held under constraint”
• normal good: a good that consumers demand more of when their income increases
• inferior good: a good that consumers demand less of when their income increases

Copyright © Pearson Education, Inc. Slide 26Chapter 4, Opener
Key Terms, cont.Key Terms, cont.
• demographics: the statistical characteristics of populations and population segments, especially when used to identify consumer markets
• complements: two goods that are bought and used together
• substitutes: goods that are used in place of one another
Copyright © Pearson Education, Inc. Slide 27Chapter 4, Opener
IntroductionIntroduction
• Why does the demand curve shift?– Shifts in the demand curve are caused by
more than just price increases and decreases. Other factors include:
• Income• Consumer Expectations• Population• Demographics• Consumer Tastes and Advertising

Copyright © Pearson Education, Inc. Slide 28Chapter 4, Opener
Changes in DemandChanges in Demand
• A demand schedule takes into account only changes in price. It does not consider the effects of news reports of any one of the thousands of other factors that change from day to day that could affect the demand for a particular good.
• A demand curve is accurate only as long as there are no changes other than price that could affect the consumer’s decision.
Copyright © Pearson Education, Inc. Slide 29Chapter 4, Opener
Changes in Demand, cont.Changes in Demand, cont.
• A demand curve is accurate only as long as the ceteris paribus assumption—that all other things are held constant—is true.
• When we drop the ceteris paribus rule and allow other factors to change, we no longer move along the demand curve. Instead, the entire demand curve shifts.– A shift in the demand curve means that at every price,
consumers buy a different quantity than before; this shift of the entire demand curve is what economists refer to as a change in demand.

Copyright © Pearson Education, Inc. Slide 30Chapter 4, Opener
Graphing Changes in DemandGraphing Changes in Demand
• When factors other than price cause demand to fall, the demand curve shifts to the left. An increase in demand appears as a shift to the right.– If the price of a book rose by one dollar, how would
you show the change on one of these graphs?

Copyright © Pearson Education, Inc. Slide 31Chapter 4, Opener
Change in Demand FactorsChange in Demand Factors
• Several factors can lead to a change in demand, rather than simply changing the quantity demanded.
• Income– Most items that we purchase are normal goods, which
consumers demand more of when their income increases.• A rise in income would cause the demand curve to shift
to the right, indicating an increase in demand. A fall in income would cause the demand curve to shift left, indicating a decrease in demand.

Copyright © Pearson Education, Inc. Slide 32Chapter 4, Opener
Consumer ExpectationsConsumer Expectations
• Checkpoint: How will an anticipated rise in price affect consumer demand for a good?
– The current demand for a good is positively related to its expected future price.
– If you expect the price to rise, your current demand will rise, which means you will buy the good sooner.
– If you expect the price to drop your current demand will fall, and you will wait for the lower price.

Copyright © Pearson Education, Inc. Slide 33Chapter 4, Opener
PopulationPopulation
• Changes in the size of the population will also affect the demand for most products.
• Population trends can have a particularly
strong effect on certain goods.

Copyright © Pearson Education, Inc. Slide 34Chapter 4, Opener
DemographicsDemographics
• Demographics are the characteristics of populations, such as age, race, gender, and occupation.– Businesses use this data to classify
potential customers.– Demographics also have a strong influence
on packaging, pricing, and advertising.

Copyright © Pearson Education, Inc. Slide 35Chapter 4, Opener
Demographics, cont.Demographics, cont.
• Hispanics, or Latinos are now the largest minority group in the United States.
• Firms have responded to this shift by providing products and services for the growing Hispanic population.

Copyright © Pearson Education, Inc. Slide 36Chapter 4, Opener
AdvertisingAdvertising
• Advertising is a factor that shifts the demand curve because it plays an important role in many trends.
• Companies spend money on advertising because they hope that it will increase the demand for the goods they sell.

Copyright © Pearson Education, Inc. Slide 37Chapter 4, Opener
Complements and SubstitutesComplements and Substitutes
• The demand curve for one good can also shift in response to a change in demand for another good.
• There are two types of related goods that interact this way:– Complements are two
goods that are bought and used together.
– Substitutes are goods that are used in place of one another.

Copyright © Pearson Education, Inc. Slide 38Chapter 4, Opener
ReviewReview
• Now that you have learned why the demand curve shifts, go back and answer the Chapter Essential Question.– How do we decide what to buy?

Chapter 4: DemandSection 3
Chapter 4: DemandSection 3

Copyright © Pearson Education, Inc. Slide 40Chapter 4, Opener
ObjectivesObjectives
1. Explain how to calculate elasticity of demand.
2. Identify factors that effect elasticity.
3. Explain how firms use elasticity and revenue to make decisions.

Copyright © Pearson Education, Inc. Slide 41Chapter 4, Opener
Key TermsKey Terms
• elasticity of demand: a measure of how consumers respond to price changes
• inelastic: describes demand that is not very sensitive to price changes
• elastic: describes demand that is very sensitive to a change in price
• unitary elastic: describes demand whose elasticity is exactly equal to 1
• total revenue: the total amount of money a company receives by selling goods or services

Copyright © Pearson Education, Inc. Slide 42Chapter 4, Opener
IntroductionIntroduction
• What factors affect elasticity of demand?
– Economists have developed a way to calculate how strongly consumers will react to a change in price.
– Original price and how much you want a particular good are both factors that will determine your demand for a particular product.
Copyright © Pearson Education, Inc. Slide 43Chapter 4, Opener
Consumer ResponseConsumer Response
• Elasticity of demand is the way that consumers respond to price changes; it measures how drastically buyers will cut back or increase their demand for a good when the price rises or falls.
– Your demand for a good that you will keep buying despite a price change is inelastic.
– If you buy much less of a good after a small price increase, your demand for that good is elastic.

Copyright © Pearson Education, Inc. Slide 44Chapter 4, Opener
Elastic DemandElastic Demand
• Elastic Demand comes from one or more of these factors:
– The availability of substitute goods– A limited budget that does not allow for price
changes– The perception of a good as a luxury item.
Copyright © Pearson Education, Inc. Slide 45Chapter 4, Opener
Calculating Elasticity of DemandCalculating Elasticity of Demand
• In order to calculate elasticity of demand, take the percentage change in the quantity of the good demanded and divide this number by the percentage change in the price of the good. The result is the elasticity of demand for the good.
– The law of demand implies that the result will always be negative. This is because increases in the price of a good will always decrease the quantity demanded, and a decrease in the price of a good will always increase the quantity demanded.

Copyright © Pearson Education, Inc. Slide 46Chapter 4, Opener

Copyright © Pearson Education, Inc. Slide 47Chapter 4, Opener
Measuring ElasticityMeasuring Elasticity
• If the elasticity of demand for a good at a certain price is less than 1, the demand is inelastic. If the elasticity is greater than 1, demand is elastic. If elasticity is exactly equal to 1, demand is unitary elastic. According to the cartoon, grazing
sheep are this homeowner’s solution to the high price of gasoline.

Copyright © Pearson Education, Inc. Slide 48Chapter 4, Opener
Factors Affecting ElasticityFactors Affecting Elasticity
• Availability of Substitutes– If there are a few
substitutes for a good, then even when its price rises greatly, you might still buy it.
– If the lack of substitutes can make demand inelastic, a wide choice of substitute goods can make demand elastic.

Copyright © Pearson Education, Inc. Slide 49Chapter 4, Opener
Other FactorsOther Factors
• Relative Importance – A second factor in determining a good’s
elasticity of demand is how much of your budget you spend on a good.
• Necessities v. Luxuries– Whether a person considers a good to be a
necessity or a luxury has a great impact on a person’s elasticity of demand for that good.

Copyright © Pearson Education, Inc. Slide 50Chapter 4, Opener
Other Factors, cont.Other Factors, cont.
• Change Over Time– Consumers do not always react quickly to a
price increase, because it takes time to find substitutes. Because they cannot respond quickly to price changes, their demand is inelastic in the short term.• Demand sometimes becomes more elastic
over time as people eventually find substitutes.
Copyright © Pearson Education, Inc. Slide 51Chapter 4, Opener
Total RevenueTotal Revenue
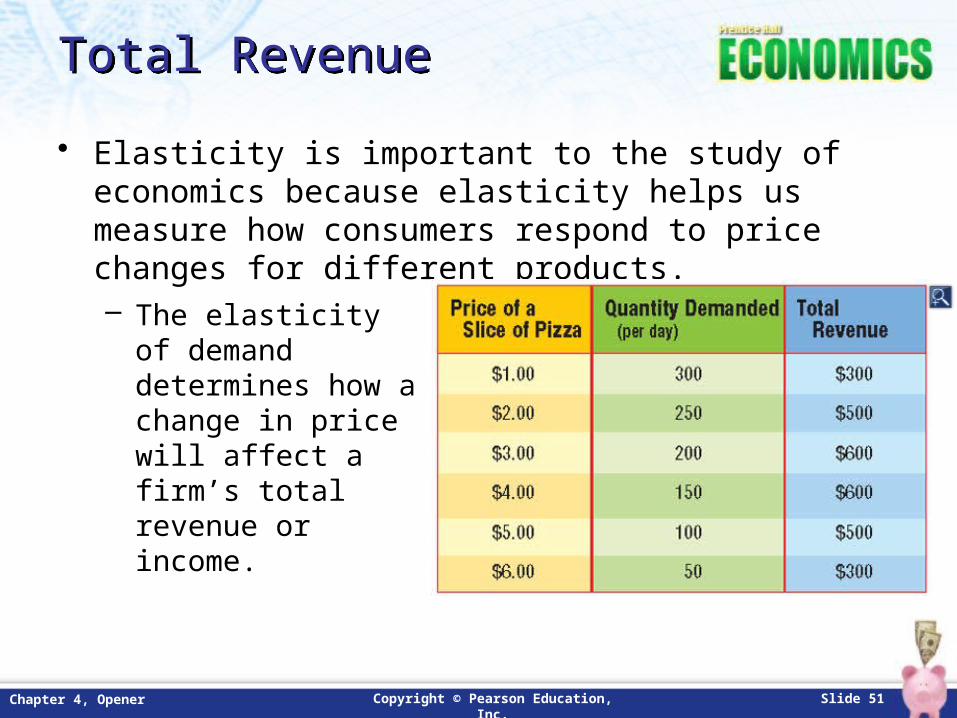
• Elasticity is important to the study of economics because elasticity helps us measure how consumers respond to price changes for different products.
– The elasticity of demand determines how a change in price will affect a firm’s total revenue or income.

Copyright © Pearson Education, Inc. Slide 52Chapter 4, Opener
Total Revenue and Elastic DemandTotal Revenue and Elastic Demand
• The law of demand states that an increase in price will decrease the quantity demanded.
• When a good has elastic demand, raising the price of each unit sold by 20% will decrease the quantity sold by a larger percentage. The quantity sold will drop enough to reduce the firm’s total revenue.
• The same process can also work in reverse. If the price is reduced by a certain percentage, the quantities demanded could rise by an even greater percentage. In this case, total revenues would increase.

Copyright © Pearson Education, Inc. Slide 53Chapter 4, Opener
Total Revenue and Inelastic DemandTotal Revenue and Inelastic Demand
• If demand is inelastic, consumers’ demand is not very responsive to price changes. If prices increase, the quantity demanded will decrease, but by less than the percentage of the price increase. This will result in higher total revenues.

Copyright © Pearson Education, Inc. Slide 54Chapter 4, Opener
Elasticity and RevenueElasticity and Revenue
• Elasticity of demand determines the effect of a price change on total revenues.
– Why will revenue fall if a firm raises the price of a good whose demand is elastic?
– What happens to total revenue when price decreases, but demand is inelastic?

Copyright © Pearson Education, Inc. Slide 55Chapter 4, Opener
Elasticity and Price PoliciesElasticity and Price Policies
• Checkpoint: Why does a firm need to know whether demand for its product is elastic or inelastic?– Knowledge of how the elasticity of demand can affect
a firm’s total revenues helps the firm make pricing decisions that lead to the greatest revenue.• If a firm knows that the demand for its product is elastic
at the current price, it knows that an increase in price would reduce total revenue.
• If a firm knows that the demand for its product is inelastic at its current price, it knows that an increase in price will increase total revenue.

Copyright © Pearson Education, Inc. Slide 56Chapter 4, Opener
ReviewReview
• Now that you have learned what factors affect elasticity of demand, go back and answer the Chapter Essential Question.– How do we decide what to buy?