chapter 4 complex critical infrastructure key resources
TRANSCRIPT

CRIM 3460 Introduction to Critical Infrastructure Protection Spring 2016
Chapter 4 – Complex Critical Infrastructure Key Resources (CIKR)
Systems
School of Criminology and Justice Studies University of Massachusetts Lowell

California on Fire Financial Meltdown of 2008 Enrichment: Too Much of a Good Thing Can Ruin It Tragedy of the Commons: Bad Behavior in a Non-
linear World
California wildfires Are California wildfires normal accidents? Forest Fires as Complex Systems (SOC) Percolation and SOC Bak’s punctuated equilibrium Policy Implications
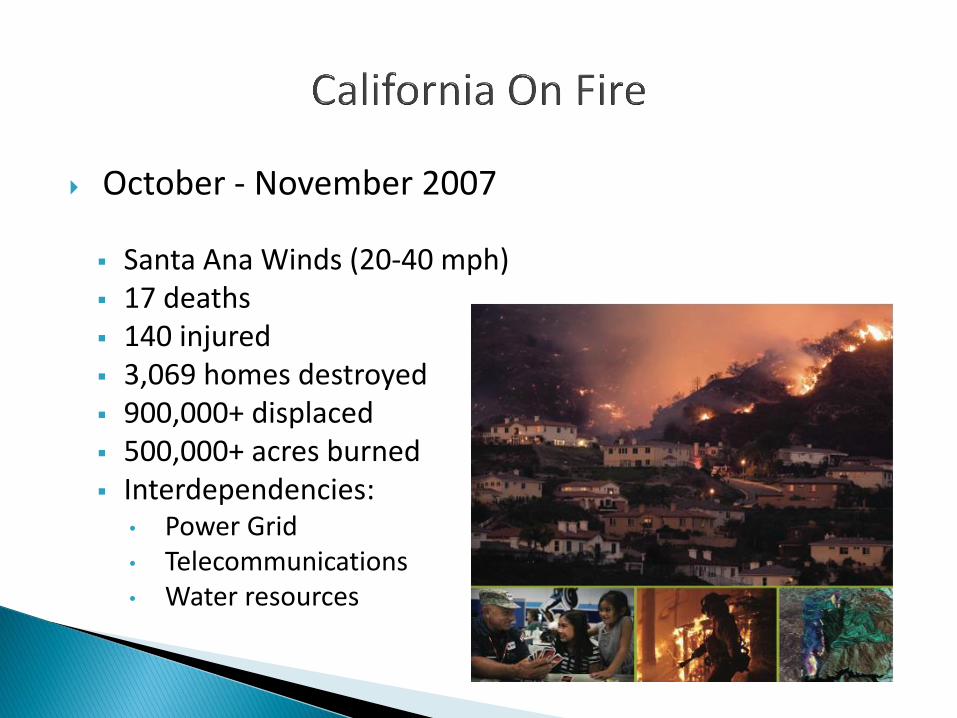
October - November 2007
Santa Ana Winds (20-40 mph) 17 deaths 140 injured 3,069 homes destroyed 900,000+ displaced 500,000+ acres burned Interdependencies:
• Power Grid • Telecommunications • Water resources

Resources committed and consequences From 10/21 thru 10/31:
An average of 1070 engines per day deployed An average of 9952 personnel per day deployed Total acres burned was 517,937
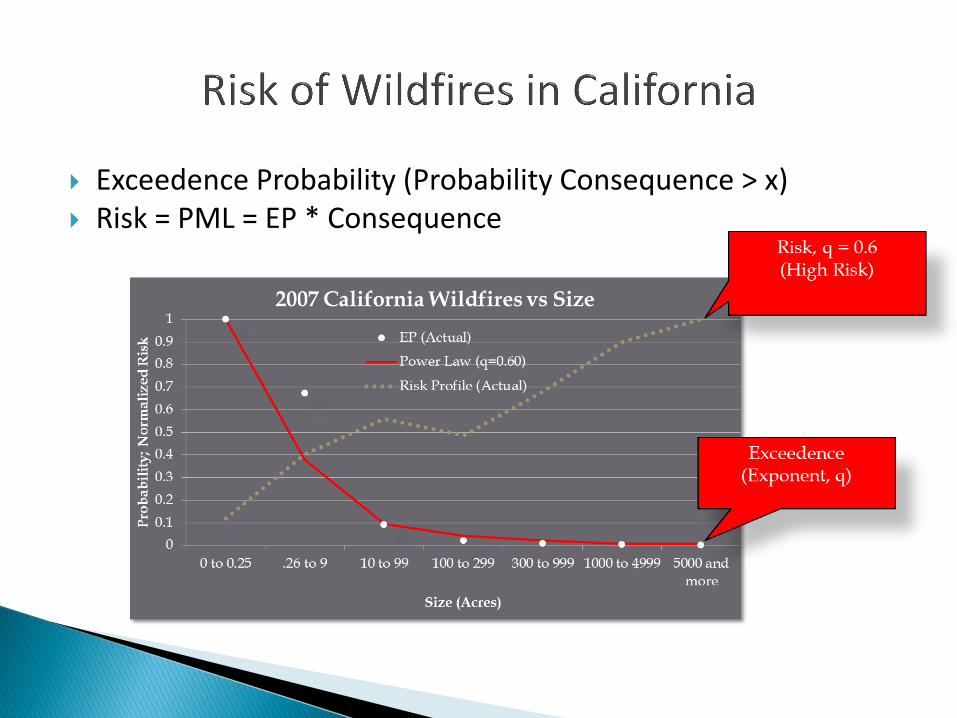
Exceedence Probability (Probability Consequence > x) Risk = PML = EP * Consequence

Percolation increases risk by increasing the juxtaposition and structure (spectral radius) of a CIKR system represented as a network.
Density – A measure of how compact or concentrated something is
Consequence – An effect of an event, incident or occurrence. Resilience – Ability to resist, absorb, recover from or
successfully adapt to adversity or a change in conditions. Self-Organized Criticality – Measured in terms of spectral
radius, which is a measure of network structure and equates to fragility and non-resilience.

Simulation: Lightning Strike Interval = Once every 25 Time Intervals
Forest = 4096 squares Green = Trees Red = Lightning bolts White = Empty ground
Percolation:
Continguous clusters
Density: Fraction of green squares
Consequence: Fraction of burned trees

Simulation: Lightning strike interval = Once every 100 Time Steps
Strikes occur less often Consequences are higher Risk is higher Clusters are larger Resilience is lower

Resilience exponent decreases with strike interval
Infrequent fires are bigger
Increased frequency reduces size

Size of fire increases with infrequent thinning
Consequence vs lightning strike interval

Percolation increases SOC
SOC explains why resilience differs for different systems: “100-Year” Power Outages Every 10 Years
High Occurrence of Fires In Southern California
Criticality of USA Telecom Sector
Spread of contagious diseases
….others TBD
Political SOC:
Source: Ramo, Joshua Cooper, The Age of the Unthinkable, Little, Brown and Company, (2009)

Risk increases with self-organized criticality Bak’s Sand Pile (critical points) Perrow’s Normal Accidents (linked systems) Taleb’s Black Swans (power laws) Malamud’s Forest Fires (percolation)
Self-organization increases with efficiency Remove surge capacity Reduce redundancy Optimize for profit

Terrorist attacks and natural disasters randomly occur Unpredictable collapses and magnitude obey a power law SOC is a force multiplier increased by reduced resilience Risk increases because of percolation
Policy options: Backing away from SOC Sub-optimal operation with lower efficiency Addition of “surge capacity” at a higher cost Decrease “connectivity” via the regulatory process Harden clusters, concentrations, hubs and infrastructure

What happened? A sudden drop in the stock market precipitated by the
collapse of major investment firms and banks, “cascaded” throughout the financial sector resulting in stalling industrial production; a 22% decline
Key Words: Sudden drop
Cascaded
Stalling

Was it the housing crash? Subprime mortgages in 1993
o Interest only o Adjustable rates o Reverse-equity loans
MBS = Mortgage-Backed Securities o Resold packaged home mortgages
CDO = Collateralized Debt Obligations o Resold packaged MBS’s
CDS = Credit Default Swap o Insurance against default of CDO
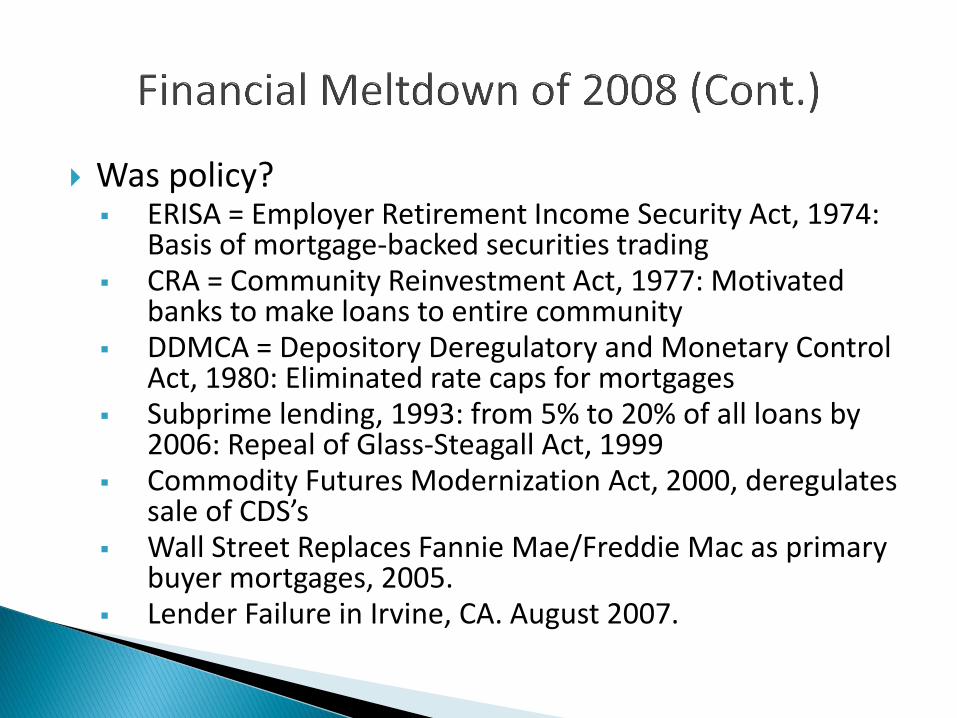
Was policy? ERISA = Employer Retirement Income Security Act, 1974:
Basis of mortgage-backed securities trading CRA = Community Reinvestment Act, 1977: Motivated
banks to make loans to entire community DDMCA = Depository Deregulatory and Monetary Control
Act, 1980: Eliminated rate caps for mortgages Subprime lending, 1993: from 5% to 20% of all loans by
2006: Repeal of Glass-Steagall Act, 1999 Commodity Futures Modernization Act, 2000, deregulates
sale of CDS’s Wall Street Replaces Fannie Mae/Freddie Mac as primary
buyer mortgages, 2005. Lender Failure in Irvine, CA. August 2007.

Two theories Normal accidents happen (irregularly)
Economic collapses are “predictable” black swans….

Two theories (cont.) Paradox of Enrichment (too much of a good thing)
Economic collapses are “predictable” Minsky Moments

Normal Accident Theory

Network Meltdown

Sand Pile

Paradox Enrichment Theory
Minsky moments:
o Speculative euphoria leads to an inevitable crash
o Bubbles are inevitable
Paradox of Enrichment:
“When exceeding the carrying capacity of an ecological system, you risk its collapse.”
In this case, the carrying capacity is GDP
Michael Rosenzweig, Prof. Ecology & Evolutionary Biology

Predator/Prey Model

GDP as “carrying capacity”

Other Examples
Adding extra capacity to a network could reduce overall performance
Applying pesticides could increase the pest population
Adding security personnel could increase breaches
Increasing automobile MPG could decrease mobility; gasoline taxes support highways

What caused the 2008 Financial Crisis?
Self-organized Criticality
Enrichment
Will it happen again? Yes
Can Financial Crashes be avoided? Yes
What policies should we consider to protect the system? Avoid Self-organized Criticality

Enrichment: Too much of a good thing can ruin it
Dunbar’s Number: Used to explain why the right size for a group; corporation, government agency, school, etc. is less than 150-200 individuals. Why is this?
Possible Explanations: Management overhead exceeds benefits
o Overhead: it takes effort to maintain a relationship
o Benefit: more people = more productivity
Failure to communicate
Source: Robin Ian MacDonald Dunbar Director of the Institute of Cognitive and Evolutionary Anthropology, University of Oxford

Failure to communicate
o Network diameter: longest path from any individual to any other individual.
o Productivity: group performance is inversely proportional to the group’s social network diameter.

Increasing the carrying capacity (number of people doing work) can decrease effectiveness Where: carrying capacity (in biology) is the maximum,
equilibrium number of organisms of a particular species that can be supported indefinitely in a given environment
Some concepts: The more programmers you have, the less productive they are
Adding extra capacity could reduce overall performance.
Adding lanes to a freeway increases congestion
Applying pesticide may increase the pest population.
Paradox of enrichment was postulated by Michael Rosenzweig in 1971.

Does more carrying capacity help?
Not always
Rosenzweig observed this paradox in nature in 1971:
Increasing the carrying capacity of the ecological system beyond a certain value leads to dynamic instability, and extinction of the predator species
What happens if pasture capacity is increased? Increasing the carrying capacity
Capacity = 1.0, 1.25, 1.5, 1.75, 1.95, 2.0, >2.0
Critical point = “tipping point” = 2.0

“.com” Bubble 1990-2000
Excess venture capital (enrichment) -> too many “.coms” -> collapse
2002-2009 Housing Bubble
Homeownership politics (enrichment) -> low rates -> housing collapse
Recent Corn-Ethanol Incentives
Ethanol subsidies (enrichment) -> corn price instability
Interstate Highway System Highway Trust Fund (enrichment) -> more highway -> ??

Hypothesis: Venture capital “enrichment” caused the
market to crash

Observation: Cisco stock price tracks venture capital
enrichment and leads to unstable price

Political motivation for home ownership
66% home ownership seems to be the ‘carrying capacity’ of the US housing economy Did we exceed carrying capacity?
Is the housing market stable again?
Does ownership have a critical point?

U.S. is the largest producer of field corn; 13B bushels a year.
Since 2005, field corn crop has been increasingly used to create ethanol. Fuel blenders are obliged under the 2007 Energy Independence and Security Act (EISA) to mix eligible biofuels into the gasoline. Blenders receive a tax credit per gallon of ethanol.
For corn-based biofuels, such as ethanol, current mandate under EISA is 12.6B gallons (increases to 15B in 2015). Source: Tom Capehart, USDA biofuels expert.
At current levels, 39% of U.S. field corn is used to produce the gasoline substitute.
Does EISA produce the Paradox of Enrichment?

Increasing ....
Number of security personnel in airports may increase risk of insider misconduct (more people to access secure areas)
Increasing carrying capacity of roads, may increase number of traffic accidents (due to more cars).
Applying more pesticides may increase number of pests (due to increased resistance).
Adding Internet capacity may reduce its performance (Braess's paradox).
Increasing capacity of an electric power line may increase the size and severity of blackouts (due to SOC)

Enrichment and CIKR
CIKR sectors cannot be understood as simple systems
Complex systems approach to guide policy and strategy
Does Enrichment Threaten or Help Sustainment of CIKR?
Questions Should enrichment paradox (EP) be considered in CIKR
security?
Does EP increase and/or decrease risk?
How do we identify “unintended consequences” of enrichment?
What should be done about EP, if anything?

Fukushima Disaster 2011
Earthquake-tsunami-nuclear power plant meltdown
Buildings and infrastructure worth about $210B
Nearly 15,000 dead and missing; 9,000 missing
Excludes costs of radiation leaks, direct damage to reactors
Considered most-costly damage, ever.
Comparable to USA Financial Meltdown of 2008

Levy Flight of incidents
Idaho Falls - 1961 - 3 deaths
Czechoslovakia - 1976 - 2 deaths
Three-Mile Island - 1979 - 0 deaths
Chernobyl - 1986 - 58 deaths
Japan
o 1999 - 2 deaths
o 2004 - 5 deaths
o 2011 - 3 deaths (nuke only)

Nuclear Power Industry “Shared Risk” 104 U.S. power reactors; each subject to $111.9M risk Price-Anderson Nuclear Industries Indemnity Act, 1957.
Renewed in 2005 for 20 years Licensees required to insure first $375 million per reactor
Reactor companies obliged to pay up to $111.9M per reactor for claims that exceed the $375M
As of 2011, maximum amount of the fund is approximately $12.22B ($111.9M X 104 reactors). Fund is not paid into unless an accident occurs. Payments are capped at $17.5M per year, until $111.9M or liability is reached.
Construction cost: $10B; risk of $111.9M approx. 1% of cost

Negative Examples
Water/air pollution damage crops, buildings, public health
“Too big to fail” banking that shifts losses to taxpayers
Over fishing of oceanic fisheries
Risk transfers in health care, maintenance of roads, etc.
Positive Examples
Network effects: individual buying a cell phone benefits alle
Quarantining infectious diseases benefits everyone
Keeping up the neighborhood increases all home values
Unintended Consequences
Positive effects may turn into negative effects

Critical Points
Tipping point or threshold effect
Small change near critical point leads to major change
System becomes unstable near its critical point
Commons is sustainable Populations vs. Time
Grass grows as fast as eaten
Cows sold as fast as reproduced
Limit cycle Does not reach 0
Repeats forever; sustainable

Commons dies out
Population vs. Time
o Overstocking with cows
o Grass grows too slowly
o Commons eventually dies
o Death to prey => death to predator
Limit Cycle
o Eventually reaches zero
o At 0: One or both die out

Moral Hazards Private sector accepts upside risk and keeps the profits Public sector accepts downside risk and pays for any losses Examples: Bailouts of 2008-2009; environmental damage;
social security and Medicare Regulations
1992 EPACT Regulation: Transmission lines in the power grid 1996 Telecom Regulation: Wired landlines in
communications
Others # hospital beds, # maintenance of highways, fishing in
international waters and the rise of resistant diseases due to careless use of antibiotics.

Moral Hazards
Private sector accepts upside risk and keeps the profits
Public sector accepts downside risk and pays for any losses
Examples: 2008/9 Bailout; environmental damage; social security and Medicare
Regulations 1992 EPACT Reg: Transmission lines in the power grid
1996 Telecom Reg: Wired landlines in communications
Others - hospital beds, highway maintenance, fishing and resistant diseases (antibiotics)