chapter 3 systems documentation techniques copyright © 2012 pearson education, inc. publishing as...
TRANSCRIPT
Chapter 3
Systems Documentation Techniques
Copyright © 2012 Pearson Education, Inc. publishing as Prentice Hall 3-1
Learning Objectives
Prepare and use data flow diagrams to understand, evaluate, and document information systems.
Prepare and use flowcharts to understand, evaluate, and document information systems.
Copyright © 2012 Pearson Education, Inc. publishing as Prentice Hall 3-2

What Is Documentation?
Set of documents and models Narratives, data flow models,
flowcharts
Describe who, what, why, when, and where of systems: Input, process, storage, output, and
controls
Copyright © 2012 Pearson Education, Inc. publishing as Prentice Hall 3-3
Importance and Uses of Documentation
Guideline and procedures for current employee to follow
Training of new employees
Review and evaluation of system effectiveness and controls
Modification of existing system
Proposed systems
Copyright 2012 © Pearson Education, Inc. publishing as Prentice Hall 3-4
Why Should You Learn Documentation?
You need to be able to read documentation in all its forms: narratives, diagrams, models.
You need to be able to evaluate the quality of systems, such as internal control based in part on documentation.
SAS 94 requires independent auditors to understand all internal control procedures. Documentation assists in auditor
understanding and documentation of their understanding
Copyright © 2012 Pearson Education, Inc. publishing as Prentice Hall 3-5
Why Should You Learn Documentation?
Sarbanes-Oxley states that management: Is responsible for internal control system Is responsible for assessing the
effectiveness of the IC System Both management and external auditors
need to document and test IC System
Copyright 2012 © Pearson Education, Inc. publishing as Prentice Hall 3-6

Data Flow Diagrams
Graphically describes the flow of data within a system
Four basic elements Data source and destination
Data flow
Transformation process
Data stores
Copyright © 2012 Pearson Education, Inc. publishing as Prentice Hall 3-7

Entity
Represents a source of data or input into the system
or
Represents a destination of data or output from the system
Copyright © 2012 Pearson Education, Inc. publishing as Prentice Hall 3-8
Data Flows
Movement of data among: Entities (sources or destinations) Processes Data stores
Label should describe the information moving
Copyright © 2012 Pearson Education, Inc. publishing as Prentice Hall 3-9
Process
Represents the transformation of data
Copyright © 2012 Pearson Education, Inc. publishing as Prentice Hall 3-10

Data Store
Represents data at rest
Copyright © 2012 Pearson Education, Inc. publishing as Prentice Hall 3-11

Data Flow Diagram Levels
Context Highest level (most general) Purpose: show inputs and outputs into system Characteristics: one process symbol only, no
data stores
Level-0 Purpose: show all major activity steps of a
system Characteristics: processes are labeled 1.0,
2.0, and so on
Copyright © 2012 Pearson Education, Inc. publishing as Prentice Hall 3-12
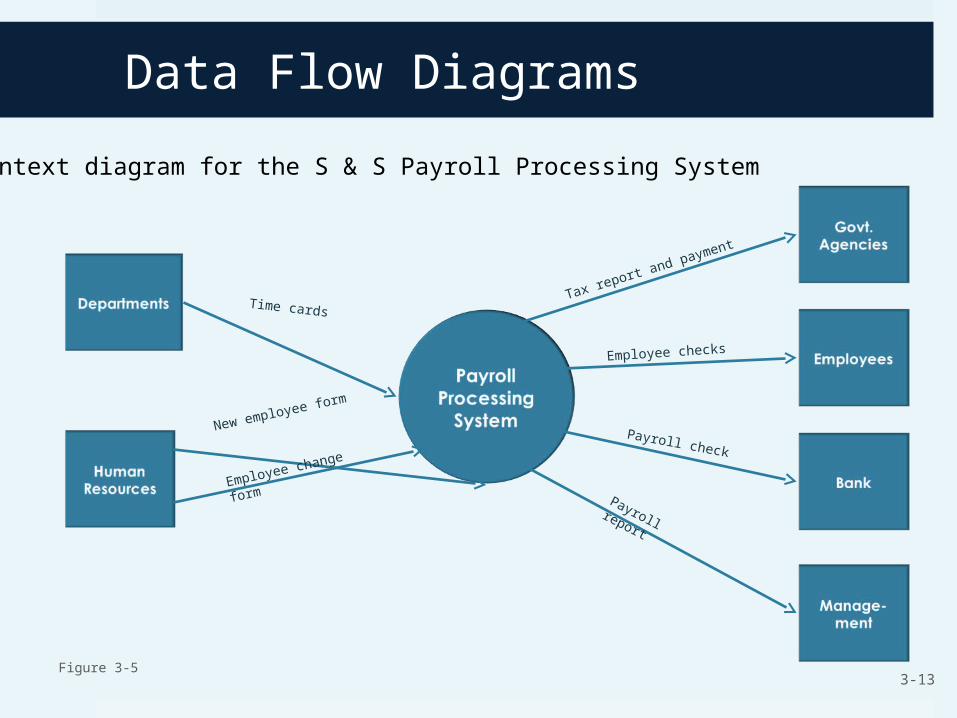
Data Flow Diagrams
Figure 3-53-13
Context diagram for the S & S Payroll Processing System
New employee form
Employee change form
Time cards
Employee checks
Payroll check
Tax report and payment
Payroll report
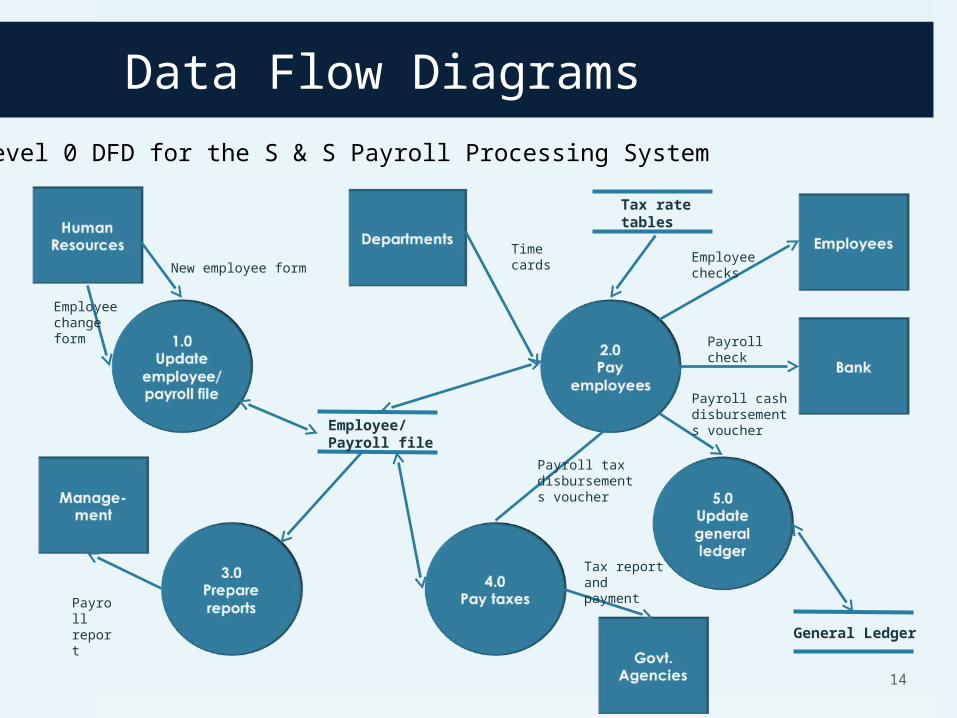
Data Flow Diagrams
14
General Ledger
Employee/Payroll file
Tax ratetables
New employee form
Employee changeform
Timecards
Employeechecks
Payrollcheck
Payroll cash disbursements voucher
Payroll tax disbursements voucher
Tax report and payment
Payroll report
Level 0 DFD for the S & S Payroll Processing System
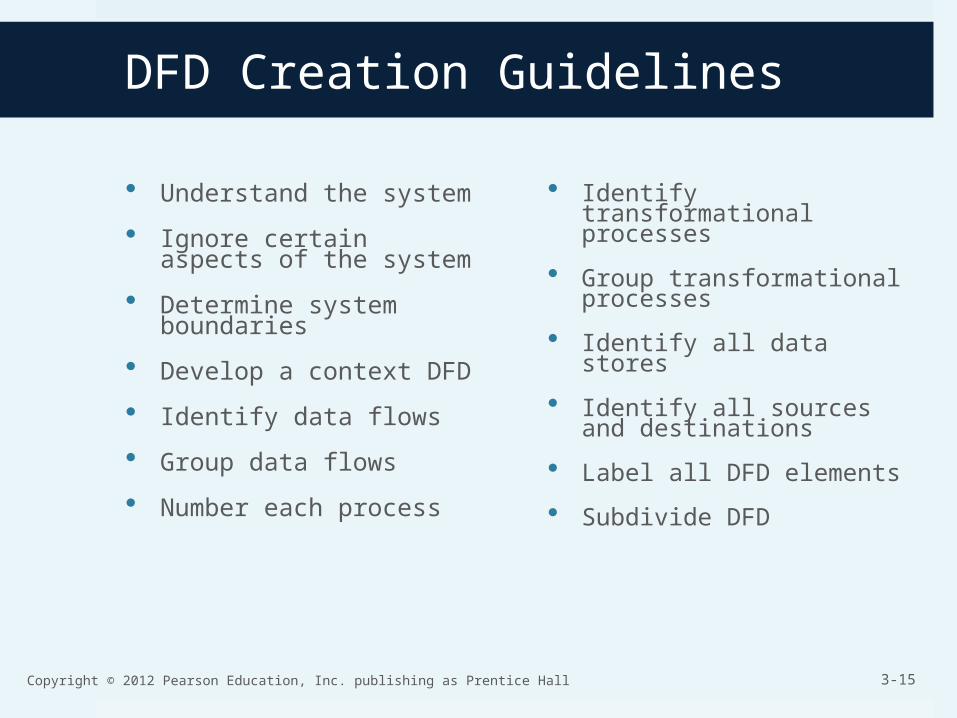
DFD Creation Guidelines
Understand the system
Ignore certain aspects of the system
Determine system boundaries
Develop a context DFD
Identify data flows
Group data flows
Number each process
Identify transformational processes
Group transformational processes
Identify all data stores
Identify all sources and destinations
Label all DFD elements
Subdivide DFD
Copyright © 2012 Pearson Education, Inc. publishing as Prentice Hall 3-15

Flowcharts
Use symbols to logically depict transaction processing and the flow of data through a system.
Using a pictorial representation is easier to understand and explain versus a detailed narrative.
Copyright © 2012 Pearson Education, Inc. publishing as Prentice Hall 3-16

Flowchart Symbol Categories
Input/Output
Processing
Storage
Miscellaneous
3-17

Flow Chart Symbol Categories
(cont’d)

Types of Flowcharts
Document Illustrates the flow of documents through an
organization Useful for analyzing internal control procedures
System Logical representation of system inputs, processes,
and outputs Useful in systems analysis and design
Program Represent the logical sequence of program logic
Copyright © 2012 Pearson Education, Inc. publishing as Prentice Hall 3-19
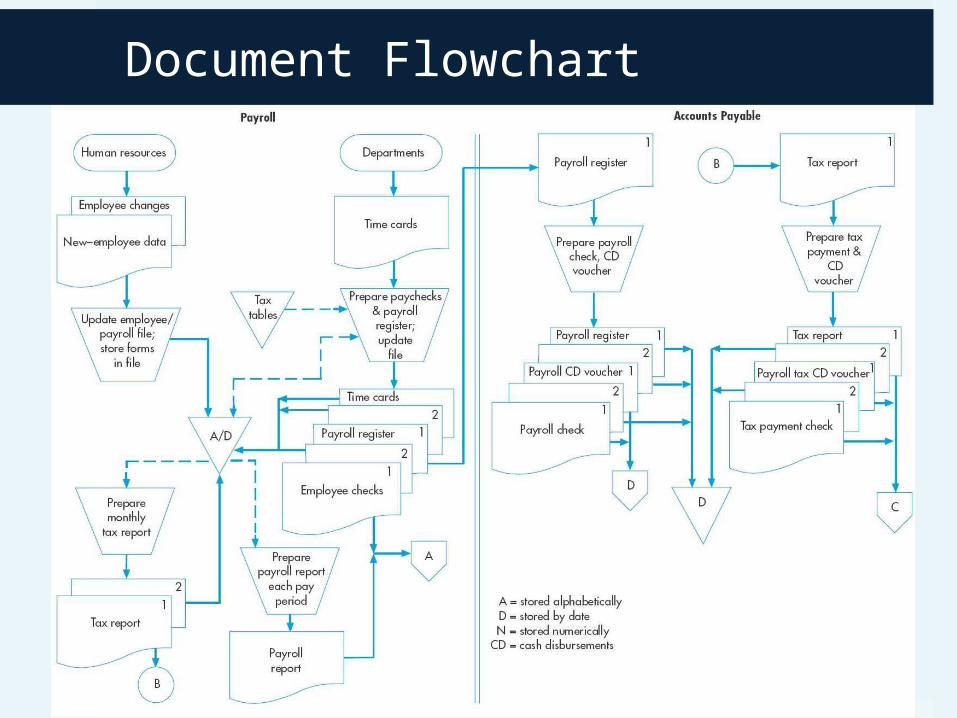
Document Flowchart
3-20

Document Flowchart (cont’d)
3-21

System Flowchart
3-22

System vs. Program Flowchart
3-23