chapter - 3 educational loans in indiashodhganga.inflibnet.ac.in › bitstream › 10603 › 54464...
TRANSCRIPT

41
Chapter - 3
EDUCATIONAL LOANS IN INDIA
After adopting the policy of economic reforms in 1991 the educational scenario has
changed. The share of development expenditure in the total expenditure of the states
declined drastically in the aftermath of the reforms and out of that, the share of
education along with health declined (Kumar et al., 2005). The development
expenditure in terms of GDP has declined more for the centre than for the states. For
education, the share has declined if we consider the centre and states together since
1990-91. However, public support for higher education by the centre has begun to
inch up only recently and the entire scenario is not yet clear. The government
expenditure on higher education in India has been subject to the vagaries of budget
making compounded by the shifting priorities of the government towards education.
The share of total expenditure on higher education by the union government fell to
16.7 per cent in 1996-97 from 20.6 per cent in 1990-91, which climbed up to 26 per
cent in 1998-99 to decline again to 19 per cent in 2003-04. As a percentage of GDP,
the government expenditure on higher education declined to 0.37 in 2003-04 from
0.46 in 1990-91 (Sharma, 2005).
Public expenditure on scholarships has also suffered. Expenditure on
scholarships as a percentage of total expenditure on higher education was barely 0.49
in 1990-91 and 0.32 in 2003-04 and it is budgeted to go up to 1.26 during 2007-08.
The same trend is applicable for technical education as well. If one looks at the plan
expenditure on higher and technical education, the same saga unfolds. As a
percentage of total expenditure on education, allocation for higher education reached
an all time high of 27.9 per cent during the Fourth Plan (1969-74), which
subsequently declined to 9.2 per cent during the Ninth Plan (1997-02). For technical
education, the ratio seems to have remained virtually unchanged during the same
period (Chattopadhyay, 2007). A scheme of loan scholarships of national and state
governments has been in operation in India since 1963 under the name The National
Loan Scholarship Scheme. At that time, only one per cent students were taking loan
for higher education. The National Loan Scholarship Scheme provides interest-free
loans to needy and able students to help them finance for full time higher education in
India, starting from the post-matriculation level to the completion of higher education;

42
loans are renewable on an annual basis. The value of the loan-scholarship ranges
between Rs. 720 per annum (for pre-university and under-graduate courses) and Rs.
1750 per annum (for doctoral or for post-second degree education in professional
courses such as medicine, engineering, technology, etc.) depending upon the nature
and type of higher education. The scholarships are awarded on the basis of both merit
and financial means. All those who secure marks of 50 per cent or above in qualifying
examinations, and whose parental annual income does not exceed Rs. 25,000 (the
limit was Rs. 6000 until 1987-88), and who do not receive any other scholarship, are
eligible for the loans. Parental income is not taken into account in the case of post
graduate studies (second degree and above), for which merit forms the sole criterion
for final selection among the eligible applicants. The scheme is funded by the national
(central) government, but administered through the provincial (state) governments.
The loan is actually paid through higher education institutions. The national
government fixes the number of loan scholarships (in 1991 around 20,000), and the
regional distribution is based on the distribution of population. In each state the
distribution is made proportionate to the number of different qualifying examinations,
subject to a minimum of one for each category (Tilak, 1992).
In the very first year 1963, although 18,000 loan scholarships were initially
announced, only 9,600 were actually given. The number of loan scholarships touched
an all time high level of 26,500 in 1965-66; and immediately declined to 18,000 in the
following year (1966-67). The figure stabilized over the years around 20,000, except
in 1973-74 when due to 'economy' measures (necessitated by high rates of inflation,
etc.) the number was halved to 10,000 (Tilak, 1992).
Present chapter discuss the position of educational loans in India, this chapter
is divided into six sections. First section deals with student loan from public sources,
public expenditure on student loans in different years. In the second section terms and
conditions given by RBI are discussed, a comparative picture of 2001 and 2010 is
shown in this section. Third section deals with bank group-wise educational loan
sanctioned in 2009. Fourth section deals with region-wise performance of educational
loans in terms of outstanding number of accounts and outstanding amount in 2009,
2010 and 2011. In the fifth section, performance of different states is discussed in
terms of outstanding number of accounts and outstanding amount in 2009, 2010 and
2011. In the last section of the chapter share of public sector banks is shown in terms
of outstanding number of accounts and outstanding amount in 2010, 2011 and 2012.

43
3.1 Educational Loans from Public Sources in India
Originally, the scheme started with Rs. 13.3 million in 1963-64, and in 1991-92 the
budget for the scheme was of the order of Rs. 30 million (Table 3.1). The budget for
the scheme fluctuated significantly, and was around Rs. 40 million during the 1970s.
As the number of scholarships was fixed, the actual total amount depended upon the
distribution of scholarships by levels/types/courses of higher education. The total
amount invested in student loans from their introduction in 1963 until 1987-88 is of
the order of Rs. 869 million.
Table 3.1 shows the public expenditure on student loans in higher education
from 1963-64 to 1991-92. It clears the picture that the maximum of revised budget
estimate is in 1970-71. Minimum of public expenditure on educational loans is in the
starting year i.e. 1963-64. The second least public expenditure on student loans is in
1990-91, due to economic crises. The student population in higher education has
increased from 1.3 million in 1963-64 when the scheme was started, to 9.2 million in
1988-89.
Table 3.1: Public Expenditure on Student Loans in Higher Education (National
Loan Scholarships Scheme)
(Rs. in millions)
Year Budget
Estimate
Revised
Estimate Year
Budget
Estimate
Revised
estimate
1963-64 13.3 13.3 1978-79 40.6 40.6
1964-65 29.5 …. 1979-80 40.4 40.0
1965-66 41.9 35.5 1980-81 40.0 40.0
1966-67 41.8 …. 1981-82 42.2 42.2
1969-70 52.5 51.3 1982-83 42.4 32.4
1970-71 63.0 57.1 1983-84 42.4 42.4
1971-72 44.4 44.4 1984-85 42.4 ….
1972-73 42.7 38.3 1985-86 37.4 32.4
1973-74 40.7 33.4 1986-87 33.2 ….
1974-75 36.2 31.2 …. …. ….
1975-76 34.4 34.2 1988-89 33.2 33.2
1976-77 42.8 42.8 1989-90 37.7 32.0
1977-78 44.4 42.2 1990-91 30.1 28.5
1991-92 30.0 …. Note: (....) Not available
Source: Annual Report(s), (various years), Department (or Ministry of Education), Government of
India, New Delhi.

44
Table 3.2 shows the number of scholarships in higher education in 1990-91. It
also shows the percentage of scholarships given to a specific level. 82 per cent of the
total percentage of scholarships covered by school education, 13.7 per cent by post
graduate students, 3.8 per cent by university courses and minimum percentage 0.5 per
cent scholarships absorbed by post second graduate. The number of loan scholarships
remained fixed at the initial number, 20000. Thus there is no correspondence between
the size of the student numbers and the number of loan scholarships.
Table 3.2: Number of National Loan Scholarships in Higher Education in India
during 1990-91
(Allocation by level)
Level of Education Number Percentage
Post- Matriculation/ Ten Plus (new scheme)/ Higher
Secondary (old scheme)/ etc. 16409 82.0
First Degree/ University Course/ Plus 2 (new scheme)/
Intermediate Stage 750 3.8
Post Graduate(second graduate) 2741 13.7
Post Second graduate 100 0.5
Total 20000 100
Source: Department of Education, Ministry of Human Resource Development, Government of India,
New Delhi.
There also exist a lot of variations within India regarding educational loan
amount disbursement and number of accounts. Table 3.3 shows number of loan
scholarships sanctioned in higher education in India, in 1990-1991. The table shows
loan scholarships in absolute as well as in terms of percentage. It is found that Uttar
Pradesh covered the highest share 16.19 per cent of scholarships from all of India,
followed by Bihar in case of sanctioning educational loans to students. Lakshadweep
has the least share 0.005 per cent of scholarships in India in 1990-1991, followed by
Dadra Nagar Haveli with 0.015 per cent of scholarships in India in 1990-1991.
After the adoption of economic reforms policy many commercial banks were
involved in educational loan scheme. Commercial banks in India include public sector
banks, private sector banks and foreign banks. During 2000-01, there were 27 public
sector banks, 43 private sector banks and 45 foreign banks in India. Published data on
educational sector lending by commercial banks is limited to public sector banks and

45
relate to the number of accounts and amount of education loan (i.e. amount
outstanding). The data from private and foreign banks are not available.
Table 3.3: State-Wise Loan Scholarships in Higher Education in India, 1990-91
(National Loan Scholarship Scheme)
State Number of
Scholarships Percentage State
Number of
Scholarships Percentage
Andhra
Pradesh 1555 7.77 Punjab 489 2.44
Assam 599 2.99 Rajasthan 1021 5.10
Bihar 2035 10.17 Sikkim 10 0.05
Gujarat 1003 5.01 Tamilnadu 1381 6.90
Goa 26 0.13 Tripura 62 0.31
Haryana 381 1.90 Uttar Pradesh 3239 16.19
Himachal
Pradesh 124 0.62 West Bengal 1584 7.92
Jammu &
Kashmir 177 0.88
A & N
Islands 6 0.03
Karnataka 1089 5.44 Arunachal
Pradesh 19 0.095
Kerala 730 3.65 Chandigarh 15 0.075
Madhya
Pradesh 1524 7.62
Dadar Nagar
Haveli 3 0.015
Maharashtra 1829 9.14 Delhi 193 0.96
Manipur 42 0.21 Daman & Diu 5 0.025
Meghalaya 40 0.20 Lakshadweep 1 0.005
Nagaland 24 0.12 Mizoram 15 0.075
Orissa 759 3.79 Pondicherry 17 0.085
All India 20,000 Source: Department of Education, Ministry of Human Resource Development, Government of India,
New Delhi.
Table 3.4 shows that over the years, the number of accounts in the country
shows wide fluctuations in terms of annual growth. The annual growth was negative
in 1990-91, 1991-92, 1992-93, 1997-98 and 1999-00, zero in 1993-94 and positive in
other years. On the other hand, the amount of loan has increased as indicated by the
positive annual growth. However, annual growth indicates lack of consistency in the
annual increase in amount of the loan. Further, of the total priority sector lending by
public sector banks, student loan has remained less than one percent throughout the
period. Annual growth of amount outstanding was highest with 89.32 per cent in
2000-01 followed by 1996-97 with 53.01 per cent. Least annual growth of amount
outstanding was 10.38 per cent in 1992-93.

46
Table 3.4: Growth of Student Loan by Public Sector Banks in India:
1990-91 to 2000-01
Financial
Year
No. of Accounts (in 000's) Amount
Outstanding in Rs.
(in million) at
Current Prices
Annual
Growth of
Amount
Outstanding
(%)
Number
Annual
Growth (%)
1990-1991 70 -2.78 770 14.93
1991-1992 69 -1.43 1060 37.66
1992-1993 66 -4.35 1170 10.38
1993-1994 66 0 1320 12.82
1994-1995 70 6.06 1580 19.70
1995-1996 74 5.71 1830 15.82
1996-1997 114 54.05 2800 53.01
1997-1998 82 -28.07 3290 17.50
1998-1999 137 67.07 4500 36.78
1999-2000 80 -41.61 5430 20.67
2000-2001 112 40.00 10280 89.32 Source: Economic Survey, Ministry of Finance Government of India, Various Issues, New Delhi.
3.2 Educational Loans in India: Terms and Conditions
RBI made the policy decisions to facilitate the educational loan scheme with some
major modifications from 2001. Due to policy of 2001, the overall scenario of
educational loan scheme has changed. There after many other changes has been made
by RBI and Indian Bank‘s Association (IBA) from time to time. The comparative
picture of 2001 and 2010 of educational loan scheme is given as follows:
3.2.1) Objectives of the Scheme:
Objectives of educational loan scheme during 2001 and 2010 were same: Educational
Loan Scheme aims at providing financial support from the banking system to
deserving/meritorious students for pursuing higher education in India and abroad. The
main emphasis is that every meritorious student though poor is provided with an
opportunity to pursue education with the financial support from the banking system
with affordable terms and conditions. No deserving student is denied an opportunity
to pursue higher education for want of financial support. In short, the scheme aims at
providing financial assistance on reasonable terms: a) to the poor and needy to
undertake basic education; b) to the meritorious students to pursue
higher/professional/technical education.
3.2.2) Student Eligibility in 2001: Student‘s eligibility to get educational loan, were:
a) should be an Indian National; b) secured admission to professional/technical

47
courses through entrance test/selection process; c) secured admission to foreign
university/institutions; d) should have scored minimum 60 per cent (50 per cent for
SC/STs) in the qualifying Examination for admission to graduation courses.
In 2010 student‘s eligibility to get educational loan, were: a) should be an Indian
National; b) Secured admission to professional/ technical courses in India or Abroad
through entrance test/ merit based selection process.
3.2.3) Courses Eligible: In 2001 courses eligible for educational loan were:
A) Studies in India: a) school education including senior secondary stage; b)
Graduation courses: B.A., B.Com, B.Sc., etc.; c) post Graduation courses: Masters &
Ph.D.; d) professional courses: Engineering, Medical, Agriculture, Veterinary, Law,
Dental, Management, Computer etc; e) computer certificate courses of reputed
institutes accredited to Deptt. of Electronics or institutes affiliated to university; f)
courses like ICWA, CA, CFA etc.; g) courses conducted by IIM, IIT, IISc, XLRI,
NIFT etc.; h) courses offered in India by reputed foreign universities; i) evening
courses of approved institutes; j) other courses leading to diploma /degree etc.
conducted by colleges/universities approved by UGC/Govt./AICTE/AIBMS/ICMR
etc.; k) courses offered by National Institutes and other reputed private institutions.
Banks may have the system of appraising other institution courses depending on
future prospects/recognition by user institutions.
In 2010 All the courses are also eligible for educational loan in 2010 but school
education has excluded from educational loan scheme this time. Some new courses
are included under this scheme are as follows: a) regular Degree/Diploma courses like
aeronautical, pilot training, shipping etc., approved by Director General of Civil
Aviation/Shipping, if the course is pursued in India. In case the course is pursued
abroad, the Institute should be recognized by the competent local aviation/shipping
authority; b) courses, which are not covered under the criteria, mentioned above,
individual banks may take a view to consider extending.
B) Studies Abroad: There is no change regarding the courses eligible in abroad for
2001 and 2010 and were: a) graduation: For job oriented professional/technical
courses offered by reputed universities; b) post graduation MCA, MBA, MS, etc.;
and c) courses conducted by CIMA - London, CPA in USA etc.

48
3.2.4) Expenses considered for loan: In 2001 a) fee payable to
college/school/hostel; b) examination/Library/Laboratory fee; c) purchase of
books/equipments/instruments/uniforms; d) caution deposit/building fund/refundable
deposit supported by institution bills/receipts; e) travel expenses/passage money for
studies abroad f) purchase of computers – essential for completion of the course; and
g) any other expense required to complete the course – like study tours, project work,
thesis, etc.
In 2010: All the expenses are same in 2010 as covered in 2001, but few changes are
given below: a) caution deposit/building fund/refundable deposit supported by
institution bills/receipts, subject to the condition that the amount does not exceed 10
per cent of the total tuition fees for the entire course; and b) insurance premium for
student borrower
3.2.5) Quantum of Finance: Need based finance subject to repaying capacity of the
parents/students with margin and the following ceilings.
In 2001 a) Studies in India-Maximum Rs.7.50 lac b) Studies abroad-Maximum Rs.15
lacs
In 2010 a) Studies in India-Maximum Rs.10.00 lac b) Studies abroad-Maximum
Rs.20 lacs
3.2.6) Margin: The conditions in 2001 and 2010 are same given below: a)
Scholarship/assistantship to be included in margin; and b) Margin may be brought-in
on year-to-year basis as and when disbursements are made on a pro-rata basis.
2001 2010
Up to Rs. 2 lac Nil Up to Rs. 4 lac Nil
Above Rs. 2 lac: studies in India 15% Above Rs. 4 lac: studies in India 5%
Studies Abroad 25% Studies Abroad 15%
3.2.7) Security: Common features of 2001 and 2010 regarding security were: a) The
document should be executed by both the student and the guardian; b) The security
can be in the form of land /building /Govt. securities /Public Sector Bonds/Units of
UTI, NSC, KVP, LIC policy, gold, shares/debentures, bank deposit in the name of
student parent/guardian or any other third party with suitable margin; c) Wherever the
land/building is already mortgaged, the unencumbered portion can be taken as
security on 11-charge basis provided it covers the required loan amount; d) In case the
loan is given for purchase of computer the same to be hypothecated to the Bank.

49
2001 2010
upto
Rs. 2 lac No security
upto
Rs. 4 lac
Co-obligation of parents. No
security
Above
Rs. 2 lac
Collateral security equal to
100 % of the loan Amount
of guarantee of third person
known to bank for 100% of
the loan amount.
Above
Rs. 4 lacs
and upto
Rs. 7.5
Lacs
Co-obligation of parents together
with collateral security in the form
of suitable third party guarantee.
The bank may, at its discretion, in
exceptional cases, waive third party
guarantee if satisfied with the net-
worth / means of parent/s who
would be executing the document as
"joint borrower".
…. ….
Above
Rs. 7.5
Lacs
Co-obligation of parents together
with tangible collateral security of
suitable value, along with the
assignment of future income of the
student for payment of installments Note: Banks who wish to support highly meritorious/deserving students without security may delegate
such powers to a fairly higher-level authority.
3.2.8) Rate of Interest:
2001 2010
upto Rs. 2 lac PLR upto Rs. 4 lac BPLR
Above Rs. 2 lac PLR+1% Above Rs. 4 lacs and upto
Rs. 7.5 Lacs BPLR+1%
In 2001: a) the interest to be debited quarterly/half yearly on simple basis during the
Repayment holiday/ Moratorium period; and b) Penal interest rate 2 per cent is
charged for above Rs. 2 lacs for the overdue amount and overdue period.
In 2010: a) simple interest to be charged during the Repayment holiday/ Moratorium
period; and b) Penal interest to be charged as applicable to individual banks.
3.2.9) Sanction/Disbursement: Common features in 2001 and 2010 were: a) the loan
to be sanctioned as per delegation of powers preferably by the branch nearest to the
place of domicile; b) no application for educational loan received should be rejected
without the concurrence of the next higher authority; and c) the loan to be disbursed
in stages as per the requirement/demand directly to the institutions/vendors of
books/equipments/instruments to the extent possible.
In 2010 one more item was included: In the normal course, while appraising the
loan the future income prospects of the student will be looked into. However, where
required, the means of parent / guardian could also be taken into account to evaluate
re-payment capability.

50
3.2.10) Repayment: Repayment regarding conditions is same in 2001 and 2010:
Repayment holiday/Moratorium
Course period + 1 year or 6 months after
getting job, whichever is earlier.
The loan to be repaid in 5-7 years after commencement of repayment if the student is
not able to complete the course within the scheduled time extension of time for
completion of course may be permitted for a maximum period of 2 years. If the
student is not able to complete the course for reasons beyond his control, sanctioning
authority may at his discretion consider such extensions as may be deemed necessary
to complete the course.
The accrued interest during the repayment holiday period to be added to the
principal and repayment in equated monthly installments (EMI) fixed.
Differences: In 2001, 1-2 per cent interest concession may be provided for borrowers
if the interest is serviced during the study period when repayment holiday is specified
for interest/ repayment under the scheme.
In 2010, 1.0 per cent interest concession may be provided for borrowers if the interest
is serviced during the study period when repayment holiday is specified for interest/
repayment under the scheme.
3.2.11) Insurance: Banks may arrange for life insurance policy on the students
availing educational loan. Individual banks may work out the modalities with
insurance companies. This facility is available in 2010 and not in 2001.
3.2.12) Follow Up: Conditions are same in 2001 and 2010, banks to contact
college/university authorities to send the progress report at regular intervals in respect
of students who have availed loans.
In 2010: In case of studies abroad, bank may obtain the Unique Identification
Number (UIN)/Identity Card and note the same in the bank's records.
3.2.13) Processing Charges: In 2001: No processing/upfront charges may be
collected on educational loans. In 2010: No processing/ upfront charges may be
collected on educational loans for studies in India.
3.2.14) Capability Certificate: Conditions are same in 2001 and 2010:
Banks can also issue the capability certificate for students going abroad for higher
studies. For this financial and other supporting documents may be obtained from
applicant, if required. (Some of the foreign universities require the students to submit
a certificate from their bankers about the sponsors solvency/financial capability, with

51
a view to ensure that the sponsors of the students going abroad for higher studies are
capable of meeting the expenses till completion of studies.)
3.2.15) Other Conditions: In 2001and 2010 few conditions were same as: no due
certificate needs not be insisted upon as a pre-condition for considering educational
loan. However banks may obtain a declaration/an affidavit confirming that no loans
are availed from other banks. Loan applications have to be disposed of within a period
of 15 days to 1 month, but not exceeding the time norms stipulated for disposing of
loan applications under priority sector lending. In order to bring flexibility in terms
like eligibility, margin, security norms, banks may consider relaxation in the norms on
a case to case basis delegating the powers to a fairly higher level authority.
Some new conditions added in 2010: a) Banks which wish to support highly and
exceptionally meritorious/ deserving students without security may delegate such
powers to a fairly higher level authority. b) In case of receipt of application for more
than one loan for student borrower from a family, the 'family' as a unit has to be taken
into account for considering the loan and security taken in relation to the total
quantum of finance disbursed, subject to margin and repaying capacity of the
parent/student. c) There is no specific restriction with regard to the age of the student
to be eligible for education loan. d) In cases of student staying with parents and where
such parents have transferable jobs or there is change in address, the bank may
provide in the system of noting the ‗address for correspondence' for tracking purpose.
e) Banks may consider top up loans to students pursuing further studies within the
overall eligibility limit, with appropriate re-schedulement, subject to taking required
security. f) The co-obligator should be parent(s)/guardian of the student borrower. In
case of married person, co-obligator can be spouse or the parent(s)/parents-in-law.
From the above discussed terms and conditions, it is clear that there are major
changes regarding educational loans from 2001 to 2010 are in quantum of finance,
security, rate of interest and margin. Except these conditions some minor changes also
occurred during this period.
Educational Loan Scenario in India from 2009 and onwards
3.3 Bank Group-Wise Educational Loans in India
RBI divided all the banks working in Indian territories in five categories: State Bank
of India and its Associates, Nationalized Banks, Foreign Banks, Regional Rural Banks

52
and Private Banks. Table 3.5 shows the performance of these five categories under
educational loans in India in 2009 in terms of number of accounts, credit limit and
amount outstanding.
Table 3.5 shows that maximum number of accounts under educational loans
was with Nationalized Banks in absolute terms (892556) and (58.72 per cent) in
relative terms. Second position was of State Bank Group which covers 35.05 per cent
of education loan accounts in 2009. Least contributing banks were Foreign Banks
with (0.0004 per cent) in total educational loan accounts. Highest credit limit was of
Nationalized Banks which is 51.59 per cent of the total credit limit. State Bank Group
occupied second position in credit limit with 42.8 per cent share. Lowest position was
of Foreign Banks which contribute only 0.0006 per cent of total credit limit in 2009.
Same case was repeated in terms of amount outstanding, as Nationalized Banks have
shown the largest contribution with Rs. 13907.22 crore, which was 55.99 per cent of
total amount outstanding, while the share of State Bank Group was 39.21 per cent
(with Rs. 9742.91 crore outstanding amount) and that of the foreign banks was only
0.0006 per cent (with Rs. 0.16 crore) only. Thus, table 3.5 shows that the performance
of Nationalized Banks was best in terms of number of accounts, credit limit and
amount outstanding while the foreign Banks contribute the least in all these three
terms.
Table 3.5: Bank’s Group-Wise Performance under Educational Loans in
India-2009
(Amount in Rs. Crore)
Name of Bank No. of
Accounts
Credit
Limit
Amount
Outstanding
State Bank of India and its Associates 532813
(35.05)
14794.8
(42.8)
9742.91
(39.21)
Nationalized Banks 892556
(58.72)
17425.41
(51.59)
13907.22
(55.99)
Foreign Banks 7
(0.0004)
0.21
(0.0006)
0.16
(0.0006)
Regional Rural banks 48378
(3.18)
481.98
(1.48)
408.25
(1.64)
Private Banks 46234
(3.05)
1075.08
(3.19)
789.67
(3.18)
All Scheduled Commercial Banks 1519988
(100.00)
33777.47
(100.00)
24848.22
(100.00)
Note: Figures in parentheses are percentages
Source: Half yearly returns on advances to priority sectors, Rural Planning and Credit Department,
RBI.

53
3.4 Region-Wise Educational Loans in India
India is divided into six regions by RBI i.e. Northern, North-Eastern, Eastern, Central,
Western and Southern region. The classification of states/ union territories into six
regions is given as follows (with the total number of states and UTs given in
brackets):
Northern Region (07) Delhi, Punjab, Haryana, Chandigarh, Jammu & Kashmir,
Himachal Pradesh, Rajasthan;
North Eastern Region (07) Assam, Meghalaya, Mizoram, Arunachal Pradesh,
Nagaland, Manipur, and Tripura);
Eastern Region (06) Bihar, Jharkhand, West Bengal, Orissa, Sikkim, Andaman &
Nicobar;
Central Region (04) Uttar Pradesh, Uttarakhand, Madhya Pradesh, Chhattisgarh;
Western Region (05) Gujarat, Maharashtra, Daman & Diu, Goa, Dadra & Nagar
Haveli; and
Southern Region (06) Andhra Pradesh, Karnataka, Lakshadweep, Tamilnadu, Kerala
and Pondicherry.
Table 3.6 shows the performance of six regions under educational loans in
terms of outstanding number of accounts in India in 2009, 2010 and 2011. It shows
that Southern Region contributed largest 60.47 per cent of educational loan accounts
followed by Central Region with 10.99 per cent share in 2009. The North-Eastern
Region contributed least with 0.77 per cent where that of the Western Region is 9.02
per cent in 2009. In 2010 the Southern Region contributed to the highest share of
educational loan accounts 61.42 per cent followed by Central Region with 10.87 per
cent. The percentage of educational loan accounts was the lowest with North-Eastern
Region (0.79 per cent) while the second lowest share was of Northern Region with
8.52 per cent. In 2011 the largest share under educational loan accounts was covered
by southern region with 61.72 per cent followed by central region with 10.57 per cent.
Share of north-eastern region was least with 0.78 per cent contribution under
educational loans in 2011. It is clear from the table that number of educational loan
accounts was increased in 2010 than 2009 in absolute terms from 1615046 to
1972056 and in 2011 than 2010 from 1972056 to 2287843.

54
Table 3.6: Region-Wise Performance under Educational Loans in India in terms
of Number of Accounts (Outstanding as on March ended)
Region No. of Account
(2009)
No. of Accounts
(2010)
No. of Accounts
(2011)
Northern Region 149707
(9.27)
168104
(8.52)
183900
(8.04)
North-Eastern
Region
12509
(0.77)
15558
(0.79)
17941
(0.78)
Eastern Region 153261
(9.49)
189293
(9.6)
240448
(10.51)
Central Region 177501
(10.99)
214265
(10.87)
241876
(10.57)
Western Region 145674
(9.02)
173639
(8.80)
191600
(8.37)
Southern Region 976394
(60.47)
1211197
(61.42)
1412078
(61.72)
All India
1615046
(100.00)
1972056
(100.00)
2287843
(100.00) Note: Figures in parentheses are percentages
Source: Half yearly returns on advances to priority sectors, Rural Planning and Credit Department,
RBI.
Number of loan accounts has also increased in all regions in absolute terms. In
all the three consecutive years‘ relative share of Eastern Region and Southern Region
has increased whereas that of Northern Region, Central Region, and Western Region
has decreased, while the share of North-Eastern region has remained stable.
Table 3.7 shows the performance of six regions under educational loans in
terms of amount outstanding in India during 2009, 2010 and 2011. It shows that
Southern Region constituted the highest percentage (53.35 per cent) of educational
loan amount outstanding in 2009, followed by the Northern Region 12.05 per cent.
The least share in amount outstanding was that of the North-Eastern Region 1.01 per
cent in 2009. In 2010 the Southern Region covered the highest percentage of
educational loan amount outstanding 54.50 per cent, second highest percentage share
was of Western Region with (11.51 per cent). The percentage of educational loan
amount outstanding was lowest of North-Eastern region 1.02 per cent, second lowest
percentage was of Eastern Region with 10.47 per cent in 2010. In 2011 again
Southern-region stood first under educational loan amount outstanding with 54.29 per
cent share followed by Eastern-region with 11.84 per cent share. Least contribution
under educational loan amount outstanding was of North-Eastern region with 1.01 per

55
cent share in 2011. From 2009 to 2010 the amount outstanding has increased in
absolute terms in total from Rs. 27799 crore to Rs. 36923 crore, and from 2010 to
2011 there was sharp increase in amount outstanding from Rs. 36923 crore to 42992.5
crore.
Table 3.7: Region-Wise Distributions of Educational Loans in India
(Amount in Rs. Crore)
Region Amount
Outstanding 2009
Amount
Outstanding 2010
Amount
Outstanding 2011
Northern Region 3349
(12.05)
4153
(11.28)
4453.8
(10.36)
North-Eastern
Region
281
(1.01)
376
(1.02)
433.3
(1.01)
Eastern Region 2887
(10.38)
3868
(10.47)
5092.3
(11.84)
Central Region 3161
(11.38)
4152
(11.24)
4897.0
(11.39)
Western Region 3291
(11.84)
4251
(11.51)
4772.6
(11.10)
Southern Region 14830
(53.35)
20123
(54.50)
23343.5
(54.29)
All India 27799
(100.00)
36923
(100.00)
42992.5
(100.00) Note: Figures in parentheses are percentages
Source: Half yearly returns on advances to priority sectors, Rural Planning and Credit Department,
RBI.
From cross table comparison of 3.6 and 3.7 it is clear that outstanding number
of accounts and amount outstanding was highest in Southern Region and the least in
Northern-Eastern Region. This clears the picture that Southern Region get maximum
benefits of educational loan scheme in India and Northern-East Region is getting the
minimum benefits of this scheme. Tables also show that number of accounts as well
as amount outstanding increases from 2009 to 2010 and from 2010 to 2011.
3.5 State-Wise Educational Loans in India
Table 3.8 shows the performance of educational loans (outstanding number of
accounts) in all states and UTs of India in both absolute terms and percentage terms.
The table shows a comparative picture of student loan accounts in 2009, 2010 and
2011.It shows that highest number of beneficiaries was from Tamilnadu (25.89 per
cent), followed by Kerala (13.37 per cent) in 2009. The lowest percentage of number

56
of accounts was from Lakshadweep (0.0008 per cent), followed by Nagaland (0.014
per cent) in 2009. In 2010 highest percentage of accounts under educational loan were
from Tamilnadu with (29.14 per cent). Second highest percentage of beneficiaries was
from Kerala with (12.52 per cent). The least percentage of beneficiaries was from
Nagaland (0.001 per cent) followed by Daman & Diu (0.007 per cent). In 2011 the
largest share under educational loan accounts was contributed by Tamilnadu with
31.35 per cent followed by Kerala with 12.67 per cent share. Least contributed share
under educational loan accounts was of Lakshadweep with 0.001 per cent in 2011.
From 2009 to 2010 and 2010 to 2011 the number of loan accounts has increased in
absolute terms in total from 1615046 to 1972056 and from 1972056 to 2287843
respectively.
In table 3.8 educational loan accounts show many fluctuations in all states in
absolute terms and in terms of percentage. Some states has increased their share in
educational loan accounts and while some has shown a decline in the same. Relative
share of Northern States (Delhi, Haryana, Chandigarh, Jammu & Kashmir, Himachal
Pradesh, and Rajasthan) has declined while in absolute form number of accounts has
increased during the three years. North-Eastern States did not show any major change
in educational loan accounts in terms of percentage but shows an improvement in
absolute terms during the three years. Eastern States have registered an increase in
educational loan accounts in percentage and in absolute sense. Central State
(Chhattisgarh) has shown a rise in student loan accounts in percentage and in terms of
number, while Uttar Pradesh, Uttarakhand and Madhya Pradesh have shown an
increase in absolute terms and a decline in percentage during the same period.
Western States (Gujarat, Maharashtra, Daman & Diu, Goa and Dadra & Nagar
Haveli) have experienced an increase in educational loan accounts in absolute terms
and shown a decline in percentage from 2009 to 2011. From 2009 to 2011, all the
Southern States except Tamilnadu shows a decline in educational loan accounts in
terms of percentage and an increment in absolute terms. In overall, results exhibits
that some states providing more benefits of this scheme to students and some are
lagging behind themselves in this respect.

57
Table 3.8: State-Wise Comparison of Educational Loans in India in terms of
Outstanding Accounts
Note: Figures in parentheses are percentages
Source: Half yearly returns on advances to priority sectors, Rural Planning and Credit Department,
RBI.
State/ Union Territory No. of Accounts
2009
No. of Accounts
2010
No. of Accounts
2011
Delhi 33382 (2.07) 38261 (1.94) 38761 (1.69)
Punjab 30992 (1.92) 30630 (1.55) 32937 (1.44)
Haryana 26856 (1.66) 30564 (1.54) 34161 (1.49)
Chandigarh 5460 (0.34) 6034 (0.31) 6057 (0.26)
Jammu & Kashmir 7798 (0.48) 8710 (0.44) 9450 (0.41)
Himachal Pradesh 8671 (0.54) 10262 (0.52) 12293 (0.54)
Rajasthan 36548 (2.26) 43643 (2.21) 50241 (2.19)
Assam 8878 (0.55) 11216 (0.57) 12997 (0.57)
Meghalaya 757(0.047) 934 (0.047) 1261 (0.05)
Mizoram 339 (0.021) 439 (0.02) 585 (0.02)
Arunachal Pradesh 421 (0.026) 463 (0.023) 372 (0.02)
Nagaland 224(0.014) 241 (0.012) 340 (0.01)
Manipur 1119(0.069) 1259 (0.064) 1166 (0.05)
Tripura 771 (0.048) 1006 (0.051) 1220 (0.05)
Bihar 36566 (2.26) 43433 (2.20) 62646 (2.74)
Jharkhand 24426 (1.51) 31752 (1.61) 38214 (1.67)
West Bengal 52918 (3.28) 61118 (3.10) 73333 (3.20)
Orissa 40807 (2.57) 52288 (2.65) 65428 (2.86)
Sikkim 297 (0.18) 351 (0.018) 341 (0.011)
Andaman & Nicobar 247 (0.015) 351 (0.018) 486 (0.02)
Uttar Pradesh 91972 (5.69) 110036 (5.58) 126756 (5.54)
Uttarakhand 16354 (1.01) 20088 (1.02) 23222 (1.01)
Madhya Pradesh 60267 (3.73) 72584 (3.68) 77216 (3.37)
Chhattisgarh 8908 (0.55) 11557 (0.59) 14682 (0.64)
Gujarat 35984 (2.23) 41171 (2.09) 44593 (1.95)
Maharashtra 105709 (6.54) 128488 (6.51) 142676 (6.24)
Daman & Diu 432 (0.026) 445 (0.022) 251 (0.01)
Goa 3130 (0.19) 3389 (0.17) 3506 (0.15)
Dadra & Nagar Haveli 419 (0.026) 146 (0.007) 574 (0.02)
Andhra Pradesh 195659 (12.11) 218491 (11.08) 220779 (9.65)
Karnataka 138650 (8.58) 161085 (8.17) 172783 (7.55)
Lakshadweep 13 (0.0008) 24 (0.001) 15 (0.001)
Tamilnadu 418100 (25.89) 574690 (29.14) 717261 (31.35)
Kerala 215976 (13.37) 246974 (12.52) 289998 (12.67)
Pondicherry 7996 (0.49) 9933 (0.50) 11242 (0.49)
All India 1615046 (100.00) 1972056 (100.00) 2287843 (100.00)

58
Table 3.9: State-Wise Comparison of Educational Loans in India in terms of
Outstanding Amount
(Amount in Rs. Crore)
State/Union Territory
Amount
Outstanding
2009
Amount
Outstanding
2010
Amount
Outstanding
2011
Delhi 1048 (3.77) 1227 (3.32) 1174.9 (2.73)
Punjab 624 (2.24) 781 (2.11) 838.2 (1.95)
Haryana 548 (1.97) 705 (1.91) 780.6 (1.81)
Chandigarh 157 (0.56) 183 (0.49) 187.4 (0.43)
Jammu & Kashmir 140 (0.50) 176 (0.48) 190.8 (0.44)
Himachal Pradesh 137 (0.49) 195 (0.53) 249.0 (0.58)
Rajasthan 695 (2.50) 886 (2.40) 1032.9 (2.40)
Assam 193 (0.69) 269 (0.73) 305.4 (0.71)
Meghalaya 17 (0.06) 22 (0.06) 29.5 (0.07)
Mizoram 12 (0.04) 16 (0.04) 21.2 (0.05)
Arunachal Pradesh 9 (0.03) 10 (0.03) 8.3 (0.02)
Nagaland 7 (0.02) 6 (0.02) 8.7 (0.02)
Manipur 28 (0.10) 32 (0.09) 35.4 (0.08)
Tripura 15 (0.05) 21 (0.06) 24.8 (0.06)
Bihar 658 (2.37) 941 (2.55) 1382.2 (3.21)
Jharkhand 513 (1.80) 691 (1.90) 930.4 (2.16)
West Bengal 970 (3.45) 1214 (3.29) 1393.6 (3.24)
Orissa 733 (2.64) 1006 (2.72) 1367.3 (3.18)
Sikkim 8 (0.03) 9 (0.02) 8.7 (0.02)
Andaman & Nicobar 5 (0.02) 7 (0.02) 10.1 (0.02)
Uttar Pradesh 1668 (6.00) 2302 (6.23) 2809.0 (6.53)
Uttarakhand 298 (1.07) 402 (1.09) 511.0 (1.19)
Madhya Pradesh 1024 (3.68) 1199 (3.25) 1294.3 (3.01)
Chhattisgarh 171 (0.61) 249 (0.70) 282.7 (0.66)
Gujarat 949 (3.41) 1184 (3.21) 1130.6 (2.63)
Maharashtra 2254 (8.11) 2968 (8.03) 3545.6 (8.25)
Daman & Diu 13 (0.05) 14 (0.04) 4.4 (0.01)
Goa 65 (0.23) 81 (0.22) 84.9 (0.19)
Dadra & Nagar Haveli 10 (0.03) 4 (0.01) 7.1 (0.02)
Andhra Pradesh 3970 (14.28) 4843 (13.12) 5091.8 (11.84)
Karnataka 2432 (8.75) 2916 (7.90) 3216.2 (7.48)
Lakshadweep - 0 0.2 (0.0004)
Tamilnadu 5185 (18.65) 7352 (19.91) 9582.3 (22.29)
Kerala 3142 (11.30) 4874 (13.20) 5282.1 (12.29)
Pondicherry 101 (0.36) 138 (0.37) 170.9 (0.39)
All India 27799 (100.00) 36923 (100.00) 42992.5 (100.00) Note: Figures in parentheses are percentages
Source: Half yearly returns on advances to priority sectors, Rural Planning and Credit Department,
RBI.

59
Table 3.9 shows the performance of educational loans (Amount Outstanding)
in all states and UTs of India in absolute terms and in terms of percentage. It shows
that highest amount outstanding under educational loans was from Tamilnadu (18.65
per cent), and second highest was from Andhra Pradesh (14.28 per cent) in 2009. The
least share in amount outstanding was of Andaman & Nicobar (0.02 per cent) in 2009
followed by Nagaland (0.02 per cent) in the same year. In 2010, largest share of
amount outstanding under educational loan was of Tamilnadu (19.91 per cent) and
second highest share of amount outstanding was from Kerala (13.2 per cent). The
least percentage of amount outstanding was from Dadra & Nagar Haveli (0.01 per
cent) followed by Nagaland (0.02 per cent). In 2011 largest contributing share in
amount outstanding was of Tamilnadu with 22.29 per cent followed by Kerala with
12.29 per cent share. Minimum contribution in amount outstanding was made by
Lakshadweep in 2011.
From 2009 to 2010 and 2010 to 2011 the amount outstanding has increased in
absolute terms from Rs. 27799 crore to Rs. 36923 crore and from Rs. 36923 crore to
Rs. 42992.5 crore. From 2009 to 2011 the relative share of Northern States (Delhi,
Haryana, Chandigarh, Jammu & Kashmir, Punjab and Rajasthan) has decreased,
while amount outstanding has increased in absolute terms. In Himachal Pradesh,
educational loan amount has increased in percentage as well as in absolute terms.
North-Eastern States except Arunachal Pradesh and Manipur all the other states
highlights an increase in educational loan amount outstanding in percentage as well as
in absolute terms from 2009 to 2011. Eastern States (Bihar, Jharkhand and Orissa)
have shown increase in educational loan amount outstanding in percentage and in
absolute sense from 2009 to 2011, while the states namely West Bengal and Sikkim
have shown an increase in amount outstanding in absolute terms and decrease in
relative terms. Only Andaman & Nicobar has shown no change in amount outstanding
in percentage, but an increase in absolute terms. Central States (Uttar Pradesh,
Uttrakhand and Chhattisgarh) have increased their share in student loan amount
outstanding in percentage and in terms of number and Madhya Pradesh has shown an
increase in Absolute terms and a decline in percentage during the same period.
Western States except Maharashtra all the other states of this region have declined
their share in relative terms from 2009 to 2011. From 2009 to 2011 Southern States
(Kerala, Tamilnadu and Pondicherry) increased their educational loan amount
outstanding in relative as well as in absolute terms, while (Andhra Pradesh and
60
Karnataka) have increased their share in absolute terms and decreased in percentage.
Henceforth, from the cross table comparison of table number 3.8 and table number 3.9
it is held that outstanding number of accounts as well as amount outstanding was the
highest in Tamilnadu in all the three years from 2009 to 2011. Amount outstanding
and number of accounts has increased from 2009 to 2011 in absolute form.
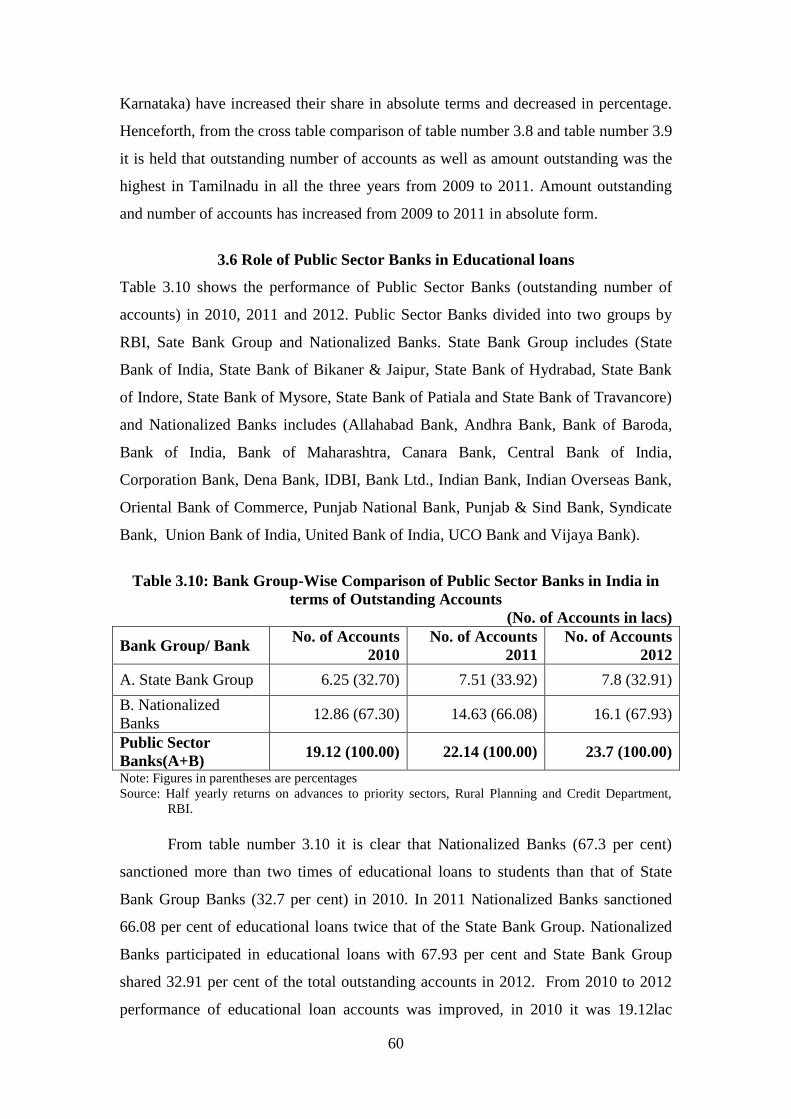
3.6 Role of Public Sector Banks in Educational loans
Table 3.10 shows the performance of Public Sector Banks (outstanding number of
accounts) in 2010, 2011 and 2012. Public Sector Banks divided into two groups by
RBI, Sate Bank Group and Nationalized Banks. State Bank Group includes (State
Bank of India, State Bank of Bikaner & Jaipur, State Bank of Hydrabad, State Bank
of Indore, State Bank of Mysore, State Bank of Patiala and State Bank of Travancore)
and Nationalized Banks includes (Allahabad Bank, Andhra Bank, Bank of Baroda,
Bank of India, Bank of Maharashtra, Canara Bank, Central Bank of India,
Corporation Bank, Dena Bank, IDBI, Bank Ltd., Indian Bank, Indian Overseas Bank,
Oriental Bank of Commerce, Punjab National Bank, Punjab & Sind Bank, Syndicate
Bank, Union Bank of India, United Bank of India, UCO Bank and Vijaya Bank).
Table 3.10: Bank Group-Wise Comparison of Public Sector Banks in India in
terms of Outstanding Accounts
(No. of Accounts in lacs)
Bank Group/ Bank No. of Accounts
2010
No. of Accounts
2011
No. of Accounts
2012
A. State Bank Group 6.25 (32.70) 7.51 (33.92) 7.8 (32.91)
B. Nationalized
Banks 12.86 (67.30) 14.63 (66.08) 16.1 (67.93)
Public Sector
Banks(A+B) 19.12 (100.00) 22.14 (100.00) 23.7 (100.00)
Note: Figures in parentheses are percentages
Source: Half yearly returns on advances to priority sectors, Rural Planning and Credit Department,
RBI.
From table number 3.10 it is clear that Nationalized Banks (67.3 per cent)
sanctioned more than two times of educational loans to students than that of State
Bank Group Banks (32.7 per cent) in 2010. In 2011 Nationalized Banks sanctioned
66.08 per cent of educational loans twice that of the State Bank Group. Nationalized
Banks participated in educational loans with 67.93 per cent and State Bank Group
shared 32.91 per cent of the total outstanding accounts in 2012. From 2010 to 2012
performance of educational loan accounts was improved, in 2010 it was 19.12lac

61
accounts and in 2011 it was 22.14lac accounts and in 2012 number of educational
loan accounts was 23.7lac.
Table 3.11 shows the performance of Public Sector Banks (Amount
Outstanding) under educational loans in India during 2010, 2011 and 2012. It is found
that Nationalized Banks shared 63.81 per cent amount outstanding and State Bank
Group contributed 36.19 per cent amount outstanding under educational loans in
2010. In 2011, Nationalized Banks covered 65.05 per cent and State Bank Group
34.95 per cent of educational loan amount outstanding. In 2012, Nationalized Banks
contributed 66.38 per cent and State Bank Group contributed 33.62 per cent in
educational loan amount outstanding. From 2010 to 2012, performance of educational
loan amount outstanding improved in absolute terms. In 2010 amount outstanding was
of worth Rs. 35292 crore and in 2011 it was Rs. 41344 crore and in 2012 it is Rs.
46700 crore.
Table 3.11: Bank Group-Wise Comparison of Public Sector Banks in India in
terms of Outstanding Amount
(Amount in Rs. Crore)
Bank Group/ Bank
Amount
Outstanding
2010
Amount
Outstanding
2011
Amount
Outstanding
2012
A. State Bank Group 12774 (36.19) 14451 (34.95) 15700 (33.62)
B. Nationalized Banks 22518 (63.81) 26893 (65.05) 31000 (66.38)
Public Sector Banks(A+B) 35292 (100.00) 41344 (100.00) 46700 (100.00)
Note: Figures in parentheses are percentages
Source: Half yearly returns on advances to priority sectors, Rural Planning and Credit Department,
RBI.
Henceforth, from cross table comparison of table 3.10 and table 3.11 it is clear
that the outstanding number of accounts and amount outstanding under educational
loans was higher of Nationalized Banks than of State Bank Group in absolute terms as
well as in percentage.
Table 3.12 shows outstanding number of accounts under educational loans of
public sector banks in 2010, 2011and 2012. All the public sector banks sanctioned
19.12lac accounts in 2010. Largest share in outstanding number of accounts was of
State Bank of India with 21.97 per cent followed by Canara Bank with 8.94 per cent
of the all public sector banks educational loan accounts in 2010.

62
Table 3.12: Bank-Wise Comparison of Public Sector Banks in India in terms of
Outstanding Accounts (No. of Accounts in lacs)
Bank Group/ Bank No. of Accounts
2010
No. of Accounts
2011
No. of Accounts
2012
State Bank of India 4.20 (21.97) 5.31 (23.98) 5.6 (23.63)
State Bank of B&J 0.19 (0.99) 0.2 (0.90) 0.2 (0.84)
State Bank of Hyderabad 0.51 (2.67) 0.52 (2.35) 0.5 (2.11)
State Bank of Indore 0.11 (0.57) …….. …….
State Bank of Mysore 0.26 (1.36) 0.29 (1.31) 0.3 (1.26)
State Bank of Patiala 0.51 (2.67) 0.13 (0.59) 0.1 (0.42)
State Bank of Travancore 0.47 (2.46) 1 (4.52) 1.1 (4.64)
Allahabad Bank 0.39 (2.04) 0.43 (1.94) 0.5 (2.11)
Andhra Bank 0.79 (4.13) 0.74 (3.34) 0.7 (2.95)
Bank of Baroda 0.70 (3.66) 0.81 (3.66) 0.8 (3.37)
Bank of India 0.90 (4.71) 1.03 (4.65) 1.2 (5.06)
Bank of Maharashtra 0.21 (1.10) 0.23 (1.04) 0.3 (1.26)
Canara Bank 1.71 (8.94) 1.93 (8.72) 2.1 (8.86)
Central Bank of India 0.68 (3.56) 0.83 (3.75) 1.0 (4.22)
Corporation Bank 0.46 (2.40) 0.43 (1.94) 0.5 (2.11)
Dena Bank 0.13 (0.68) 0.15 (0.68) 0.1 (0.42)
IDBI Bank ltd. 0.04 (0.21) 0.05 (0.22) 0.1 (0.42)
Indian Bank 1.61 (8.42) 1.8 (8.13) 2.0 (8.44)
Indian Overseas Bank 1.12 (5.86) 1.56 (7.05) 1.9 (8.02)
Oriental Bank of Commerce 0.41 (2.14) 0.46 (2.08) 0.5 (2.11)
Punjab National Bank 1.14 (5.96) 1.35 (6.10) 1.5 (6.33)
Punjab & Sind Bank 0.07 (0.37) 0.07 (0.32) 0.1 (0.42)
Syndicate Bank 0.95 (4.97) 1.02 (4.61) 1.1 (4.64)
Union Bank of India 0.67 (3.50) 0.75 (3.39) 0.8 (3.37)
United Bank of India 0.22 (1.15) 0.21 (0.95) 0.2 (0.84)
UCO Bank 0.35 (1.83) 0.47 (2.12) 0.5 (2.11)
Vijaya Bank 0.30 (1.57) 0.3 (1.35) 0.2 (0.84)
Public Sector Banks 19.12 (100.00) 22.14 (100.00) 23.7 (100.00) Note: 1) State Bank of Indore has been merged in State Bank of India in 2011.
2) Figures in parentheses are percentages
Source: Half Yearly return on Advances to priority sectors, Rural Planning & Credit Department, RBI.
The least outstanding number of accounts under educational loans was of
IDBI Bank Ltd. which covers 0.04lac accounts in absolute terms and 0.21 per cent in
relative terms. Second lowest rank was assigned to Punjab & Sind Bank in
outstanding number of accounts under educational loans with 0.37 per cent of the total
percentage of accounts in 2010. In 2011, State Bank of India contributed the largest
share of educational loan accounts in absolute terms (5.31lac) and in relative terms
(23.98 per cent). Second highest position was assigned to Canara Bank under
63
educational loan accounts with (1.93lac) and with 8.72 per cent of total loan accounts
in 2011. Least contributing bank was IDBI Bank Ltd. with 0.05 per cent of the total
percentage of loan accounts followed by Punjab & Sind Bank with 0.07 per cent of
the total percentage of accounts in 2011. In 2012 largest share in educational loan
accounts was covered by State Bank of India with 23.63 per cent followed by Canara
Bank with 8.86 per cent. Least contribution in educational loan accounts was made by
State Bank of Patiala, Dena Bank, IDBI Bank Ltd. and Punjab and Sind Bank each
accounting for 0.42 per cent share. From 2010 to 2011 and 2011 to 2012 total
outstanding number of accounts increased from19.12lac to 22.14lac and 22.14lac to
23.7lac respectively which show a great increase. But share of few banks in
educational loan accounts was increased in comparison of other banks, while some
banks remains same in performance and most of the banks shown a decline in
educational loan accounts in terms of percentage.
Table 3.13 shows amount outstanding of educational loans of public sector
banks in 2010, 2011 and 2012. The entire public sector bank‘s amount outstanding
was Rs. 35292 crore in 2010. Highest amount outstanding was with State Bank of
India in absolute terms (Rs. 8711crore) and 24.68 per cent of the all public sector
banks educational loan amount outstanding in 2010, followed by Canara Bank with
Rs. 2896 crore covering 8.20 per cent of amount outstanding. The least amount
outstanding under educational loans was with IDBI Bank Ltd. (Rs. 82 crore) in
absolute terms and 0.23 per cent in relative terms, followed by Punjab & Sind Bank
with 0.58 per cent during the same period. In 2011, State Bank of India contributed
highest in amount outstanding under educational loans in absolute terms (Rs. 10367
crore) and in relative terms (25.07 per cent). Second highest position was occupied by
Canara Bank under educational loan amount outstanding with (Rs. 3503 crore) and
with 8.47 per cent in 2011 in absolute and in terms of percentage respectively. IDBI
Bank Ltd. was found to be the least contributing bank with (Rs. 110 crore) in absolute
terms and 0.27 per cent of the total percentage of loan amount outstanding, followed
by Punjab & Sind Bank with Rs. 218 crore and 0.53 per cent in 2011. In 2012, State
Bank of India contributed maximum amount outstanding of educational loans with
24.62 per cent share followed by Canara Bank with 8.35 per cent. Least share in
educational loan amount outstanding was of Punjab & Sind Bank with 0.43 per cent.

64
Table 3.13: Bank Group-Wise Comparison of Public Sector Banks in India in
terms of Outstanding Amount
(Amount in Rs. Crore)
Bank Group/ Bank
Amount
Outstanding
2010
Amount
Outstanding
2011
Amount
Outstanding
2012
State Bank of India 8711 (24.68) 10367 (25.07) 11500 (24.62)
State Bank of B&J 368 (1.04) 435 (1.05) 400 (0.86)
State Bank of Hyderabad 1009 (2.86) 1056 (2.55) 1100 (2.35)
State Bank of Indore 210 (0.59) ……. …….
State Bank of Mysore 489 (1.38) 534 (1.30) 600 (1.28)
State Bank of Patiala 304 (0.86) 340 (0.82) 400 (0.86)
State Bank of Travancore 1682 (4.76) 1719 (4.16) 1800 (3.85)
Allahabad Bank 819 (2.32) 1031 (2.50) 1200 (2.57)
Andhra Bank 1648 (4.67) 1629 (3.94) 1500 (3.21)
Bank of Baroda 1466 (4.15) 1685 (4.07) 1800 (3.85)
Bank of India 1716 (4.86) 1918 (4.64) 2200 (4.72)
Bank of Maharashtra 379 (1.07) 409 (0.99) 500 (1.07)
Canara Bank 2896 (8.20) 3503 (8.47) 3900 (8.35)
Central Bank of India 1162 (3.29) 1516 (3.67) 2100 (4.49)
Corporation Bank 814 (2.31) 926 (2.24) 1000 (2.14)
Dena Bank 289 (0.82) 286 (0.69) 300 (0.64)
IDBI Bank ltd. 82 (0.23) 110 (0.27) 300 (0.64)
Indian Bank 2161(6.12) 2635 (6.37) 3100 (6.64)
Indian Overseas Bank 1447 (4.10) 1971 (4.78) 2500 (5.35)
Oriental Bank of Commerce 939 (2.66) 1071 (2.60) 1100 (2.35)
Punjab National Bank 2132 (6.04) 2642 (6.40) 3100 (6.64)
Punjab & Sind Bank 204 (0.58) 218 (0.53) 200 (0.43)
Syndicate Bank 1460 (4.14) 1889 (4.57) 2300 (4.92)
Union Bank of India 1289 (3.65) 1537 (3.72) 1700 (3.64)
United Bank of India 422 (1.19) 457 (1.10) 500 (1.07)
UCO Bank 659 (1.87) 857 (2.07) 1100 (2.35)
Vijaya Bank 534 (1.51) 603 (1.46) 600 (1.28)
Public Sector Banks 35292 (100.00) 41344 (100.00) 46700 (100.00) Note: 1) State Bank of Indore has been merged in State Bank of India in 2011
2) Figures in parentheses are percentages
Source: Half Yearly return on Advances to priority sectors, Rural planning & Credit Department, RBI.
Both the tables (3.12 and 3.13) indicates that number of accounts and amount
outstanding were found to be highest with State Bank of India and least with IDBI
Bank Ltd. in 2010 all the three consecutive years.
In nutshell, as the new economic reforms adopted in 1991 professional higher
education is not in range of poor people because of high fee and funds of private
institutes. In 1991 public expenditure on higher education is declining drastically. So,

65
after 1991 a new scenario emerged to provide professional higher education purely on
commercial basis. In such situations student loan program was started to ease the
financial burden of government budget. Educational loan scheme was working in
India from 1963 but a high rise in this scheme is shown after the new economic policy
is started. This is because RBI gave clear guidelines for student loans in 2001
modified in 2010. This led to high rate and level of performance of public sector
banks in the student loans. But there exist a lot of regional variations in respect of
educational loan program in India. In 1990-91 highest benefitted states from
scholarships was U.P., Bihar and southern states and least benefitted states were
north-eastern and union territories. In 2009, maximum outstanding number of
accounts and amount sanctioned by nationalized banks followed by State Bank of
India and its Associates. Least contribution in outstanding number of accounts and
amount sanctioned is made by foreign banks under educational loans in 2009. Largest
benefitted region under educational loan accounts and amount is southern region and
north-eastern is least benefited from the scheme in 2009, 2010 and 2011. The reason
behind the poor performance of North-Eastern states in this scheme is that these states
are far behind in terms of banking facilities. State-wise experience shows that largest
share of educational loan accounts and amount are availed by Tamilnadu followed by
Kerala and least benefitted states are union territories and Nagaland in 2009, 2010 and
2011. One more picture is seen in context of bank groups, that the largest share of
student loans is sanctioned by public sector banks and a negligible share is
contributed by other bank groups. From public sector banks highest number of
accounts and amount are sanctioned by State Bank of India followed by Canara Bank
and least contribution is made by IDBI Bank Ltd. and Punjab & Sind Bank. To
improve the existing educational loan scenario in India and to make the educational
loan scheme a unique way of providing greater access to higher and professional
education, regional and state wise inequalities should be reduced. Private sector banks
should be encouraged to provide educational loan facility to needy students on the
same terms and conditions under which public sector banks are providing student
loans.